MEASURING THE IMPACT OF PROFESSIONAL · PDF fileMEASURING THE IMPACT OF PROFESSIONAL...
32
MEASURING THE IMPACT OF PROFESSIONAL ACCREDITATION ON STUDENT EXPERIENCES AND LEARNING OUTCOMES w J. Fredericks Volkwein,* , † Lisa R. Lattuca,* Betty J. Harper,* and Robert J. Domingo* ................................................................................................ ................................................................................................ This research uses a conceptual model to examine the influence of a change in accreditation standards on a representative national sample of 203 engineering programs at 40 institutions. Based on data collected from more than 140 program chairs, 1,200 faculty, 4,300 graduates of 2004, and 5,400 graduates of 1994, the study investigates the differential impact of the change in accreditation standards on programs reviewed in different years during the period of transition. Despite significant variation across most of the measures and groups in 1994 (before the introduction of the new accreditation criteria), the 2004 evidence demonstrates a surprisingly uniform level of student experiences and outcomes. These findings suggest that engineering accreditation is beginning to accomplish its quality assurance goals. ................................................................................................ ................................................................................................ KEY WORDS: accreditation; outcomes; student experiences; program change; engi- neering education. INTRODUCTION As conversations about the Reauthorization of the Higher Education Act heated up on Capitol Hill in 2003, legislators and lobbyists dis- cussed, among other issues, dissatisfaction with the higher education accreditation process. The concerns included the secrecy and perceived lack of rigor of the peer review process, variable institutional acceptance w This is a revised version of a research paper presented at the meeting of the Asso- ciation for Institutional Research, May 17, 2006, Chicago, IL. *Center for the Study of Higher Education, Pennsylvania State University, University Park, PA, USA. Address correspondence to: J. Fredericks Volkwein, Center for the Study of Higher Edu- cation, Pennsylvania State University, University Park, PA, USA. E-mail: [email protected]. 251 0361-0365/07/0300-0251/0 Ó 2006 Springer Science+Business Media, LLC Research in Higher Education, Vol. 48, No. 2, March 2007 (Ó 2006) DOI: 10.1007/s11162-006-9039-y
Transcript of MEASURING THE IMPACT OF PROFESSIONAL · PDF fileMEASURING THE IMPACT OF PROFESSIONAL...
MEASURING THE IMPACT OF PROFESSIONALACCREDITATION ON STUDENT EXPERIENCESAND LEARNING OUTCOMESw
J. Fredericks Volkwein,*,† Lisa R. Lattuca,* Betty J. Harper,* andRobert J. Domingo*
................................................................................................................................................................................................
This research uses a conceptual model to examine the influence of a change inaccreditation standards on a representative national sample of 203 engineeringprograms at 40 institutions. Based on data collected from more than 140 programchairs, 1,200 faculty, 4,300 graduates of 2004, and 5,400 graduates of 1994, thestudy investigates the differential impact of the change in accreditation standardson programs reviewed in different years during the period of transition. Despitesignificant variation across most of the measures and groups in 1994 (before theintroduction of the new accreditation criteria), the 2004 evidence demonstrates asurprisingly uniform level of student experiences and outcomes. These findingssuggest that engineering accreditation is beginning to accomplish its qualityassurance goals.
................................................................................................................................................................................................KEY WORDS: accreditation; outcomes; student experiences; program change; engi-neering education.
INTRODUCTION
As conversations about the Reauthorization of the Higher EducationAct heated up on Capitol Hill in 2003, legislators and lobbyists dis-cussed, among other issues, dissatisfaction with the higher educationaccreditation process. The concerns included the secrecy and perceivedlack of rigor of the peer review process, variable institutional acceptance
wThis is a revised version of a research paper presented at the meeting of the Asso-ciation for Institutional Research, May 17, 2006, Chicago, IL.
*Center for the Study of Higher Education, Pennsylvania State University, University Park,
PA, USA.
�Address correspondence to: J. Fredericks Volkwein, Center for the Study of Higher Edu-
cation, Pennsylvania State University, University Park, PA, USA. E-mail: [email protected].
p j
251
0361-0365/07/0300-0251/0 � 2006 Springer Science+Business Media, LLC
Research in Higher Education, Vol. 48, No. 2, March 2007 (� 2006)DOI: 10.1007/s11162-006-9039-y

of transfer credit for courses taken at other institutions, and consumers’inability to make informed choices about colleges and universities basedon information from accreditation reviews (Bollag, 2005, 2006). Inspring 2006, a discussion paper prepared for the national Commissionon the Future of Higher Education proposed replacing regional accredi-tors with a national accreditation body—a suggestion that sparked con-siderable debate, but found little support from institutions andaccreditors (Bollag, 2006). At the heart of such discussions are seriousquestions about the effectiveness of accreditation as a quality assurancemechanism.Challenges to accreditation are not new, but they have rarely been so
visible to the general public. Throughout the history of the accreditationprocess, accreditors have responded to changing contexts and pressuresfrom inside and outside the academy by modifying their processes. Forexample, in response to the increasing cost burden associated withregional and professional accreditation reviews, agencies have encour-aged institutions to embed these reviews in ongoing institutional pro-cesses such as strategic planning or program review. Acknowledging thegrowing consensus that student learning outcomes are the ultimate testof the quality of academic programs, accreditors have also refocusedtheir criteria, reducing the emphasis on quantitative measures of inputsand resources and requiring judgments of educational effectiveness frommeasurable outcomes (Volkwein, Lattuca, Caffrey, and Reindl, 2003).The Council for Higher Education Accreditation (CHEA), which recog-nizes individual accreditation agencies, endorses assessment of studentlearning outcomes as one dimension of accreditation: ‘‘Students, par-ents, and the public ... want to know what the learning gained in these[academic] programs will mean in the marketplace of employment andin their lives as citizens and community members’’ (2003, p. 4).Assessment of student outcomes may assist higher education accredi-
tors and institutions answer the increasingly fervent calls for account-ability from state and federal legislators. Among accreditors, the trendtoward assessment of student outcomes as a criterion for accreditationhas gained considerable momentum, but requirements vary by accredita-tion agency. Regional accreditors generally require that institutions orprograms conduct assessment as a condition for accreditation,1 butsome professional accreditation agencies have taken outcomes assess-ment a step further by identifying specific learning outcomes to beachieved by accredited programs. For instance, ABET, the Accredita-tion Board for Engineering and Technology, specified 11 undergraduatelearning outcomes for all baccalaureate engineers, regardless of engi-neering specialty. Similarly, the Accreditation Council for Graduate
252 VOLKWEIN, LATTUCA, HARPER, AND DOMINGO

Medical Education identified six general competencies (e.g., patient care,medical knowledge, interpersonal skills, and communication) in theiraccreditation criteria (Batalden, Leach, Swing, Dreyfus, and Dreyfus,2002). In response to these changes, engineering and medical programshave begun to align their curricula with the outcomes stipulated by theirrespective criteria (see Batalden et al., 2002; Lattuca, Terenzini, andVolkwein, 2006).Discussions about the effectiveness of accreditation as a quality assur-
ance tool might be less contentious if there were clear evidence regardingthe impact of the process on institutions, academic programs, and gradu-ates. Surprisingly, despite the centrality of the process in higher educa-tion, there is little systematic research on the influence of accreditationon programs or learning. Anecdotal accounts of institutional and pro-gram responses to new accreditation standards are abundant (see, forexample, the proceedings of the American Society for Engineering Edu-cation), but there are only a handful of studies that examine the impactof accreditation across institutions or programs. Moreover, these studiestypically focus simply on documenting institutional responses. For exam-ple, in a study of the impact of changes in accreditation standards foraccounting programs, Sinning and Dykxhoorn (2001) found programsworking to identify the skills and knowledge base required for employ-ment in the field and developing educational objectives reflecting theseskills. Similarly, a survey of 21 mechanical engineering programs con-ducted by the American Society of Mechanical Engineers (ASME) foundthat the implementation of EC2000 in these programs ‘‘created an envi-ronment in which the entire program faculty was involved in the processof establishing program educational objectives and student outcomes andassessment processes’’ (Laurenson, 2001, p. 20). Systematic studies of theimpact of accreditation processes on both changes in educational pro-grams and student learning are, to our knowledge, non-existent.The opportunity to study the impact of an outcomes-based accredita-
tion model on educational processes and student learning arose in 2002when ABET engaged Penn State’s Center for the Study of Higher Edu-cation to assess the impact of its new accreditation criteria for under-graduate engineering programs. The new criteria were expected tostimulate significant restructuring of curricula, instructional practices,and assessment activities in engineering programs (ABET, 1997) and theEC2000 impact study, entitled Engineering Change, assesses the extentto which the expected restructuring has occurred and its influence onthe 11 student learning outcomes specified in EC2000.ABET’s reform efforts began in the 1990s, as the agency responded to
criticisms from two key stakeholder groups. Employers’ voiced concerns
MEASURING THE IMPACT OF PROFESSIONAL ACCREDITATION 253

regarding the mismatch between industry needs and the skill sets ofgraduates of engineering programs. Engineering faculty and administra-tors countered that that ABET’s prescriptive accreditation criteria werebarriers to curricular and pedagogical innovation (Prados, Peterson, andAberle, 2001). With funding support from the National Science Founda-tion and industries represented on the ABET advisory council, the agen-cy conducted a series of workshops to generate ideas about neededchange and consensus among different constituencies. Recommendationsfrom the workshops, published in A Vision for Change (ABET, 1995),became catalysts for the development of new criteria, which were circu-lated to the engineering community a few months later. Following aperiod of public comment, the ABET Board of Directors approvedEngineering Criteria 2000 (EC2000) in 1996.The new criteria radically altered the evaluation of undergraduate
engineering programs, shifting the emphasis from curricular specifica-tions to student learning outcomes and accountability. Under EC2000,engineering programs must define program objectives to meet their con-stituents’ needs. To ensure accountability, each program is required toimplement a structured, documented system for continuous improve-ment that actively and formally engages all of its constituents in thedevelopment, assessment, and improvement of academic offerings. Pro-grams must also publish specific goals for student learning and measuretheir achievement to demonstrate how well these objectives are beingmet (Prados, 1995). ABET was one of the first accrediting bodies toadopt a philosophy of continuous improvement for accreditation andthe first to submit that process to scholarly evaluation.ABET piloted the EC2000 criteria in 1996–1997. After a 3-year transi-
tion period (1998–2000), during which programs could choose to under-go review using either the old or new criteria, EC2000 becamemandatory in 2001. In this paper, we use data from the EngineeringChange study to answer two research questions regarding the influenceof EC2000 on engineering programs. The first research question focuseson the overall impact of EC2000, asking
• Did the new EC2000 accreditation standards have the desired impacton engineering programs, student experiences, and student outcomes?
The second research question explores the potential influence of thephased implementation of the EC2000 standards over a 5-year period,assuming that this may have affected rates of change in programs andstudent learning. As noted, institutions undergoing an accreditationreview between 1998 and 2000 had the option of meeting the new EC2000
254 VOLKWEIN, LATTUCA, HARPER, AND DOMINGO
standards ‘‘early’’, that is, before they became mandatory, or to ‘‘defer’’an EC2000 review until the next cycle. The decision to undergo EC2000review early or to defer to the next cycle may have reflected program read-iness to meet the requirements outlined in the new criteria. Early adoptersof EC2000 accreditation, for instance, may have already introduced out-comes assessment or continuous improvement principles into their pro-grams. Institutions that deferred EC2000 and stood for review under theold standards may have had one or more programs that were not wellpositioned to respond to these new requirements. ‘‘On-time’’ programs,the ones that came up for review after EC2000 became mandatory in2001, may be more like early programs in terms of their readiness to pro-vide evidence of assessment and continuous improvement practices. Thesecond research question for this study therefore asks,
• Do engineering programs in the three review cycle groups (pilot/early, on-time/required, and deferred) differ in program changes,student experiences, and/or student outcomes? In other words, areprograms that deferred adoption of EC2000 significantly differentfrom those programs that did not?
CONCEPTUAL FRAMEWORK OF THE ENGINEERING CHANGESTUDY
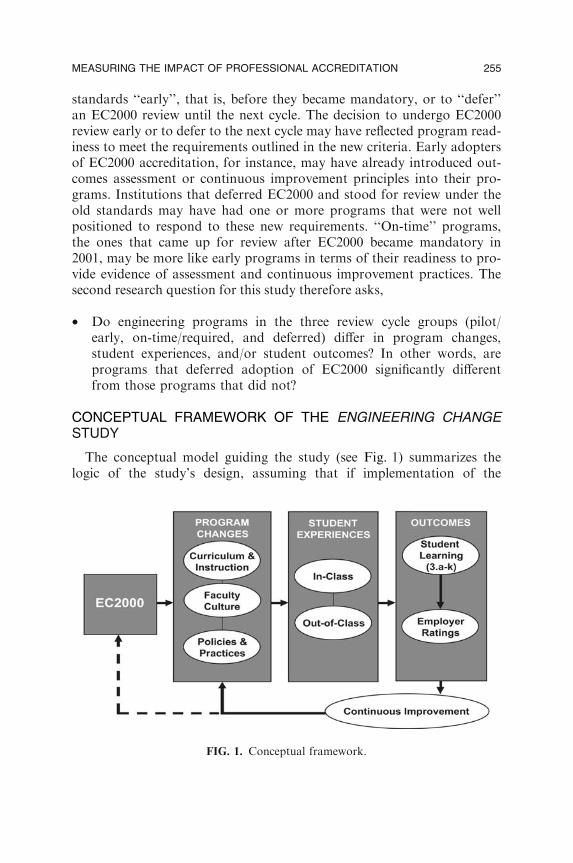
The conceptual model guiding the study (see Fig. 1) summarizes thelogic of the study’s design, assuming that if implementation of the
FIG. 1. Conceptual framework.
MEASURING THE IMPACT OF PROFESSIONAL ACCREDITATION 255

EC2000 evaluation criteria were having the desired effect, several chan-ges in engineering programs would be evident:
• Engineering programs would make changes to align their curriculaand instructional practices with the 11 learning outcomes specifiedby EC2000.
• Changes in program faculty culture would be evident as facultymembers engaged at a higher rate than before EC2000 in activitiessuch as outcomes assessment and curriculum revision.
• Faculty and program administrators would adjust program practicesand policies regarding salary merit increases, tenure, and promotioncriteria to give greater recognition to the kinds of teaching and learn-ing required by EC2000.
• Changes to the quality and character of student educational experi-ences inside and outside the classroom would be visible.
• All these changes in curricula, instructional practices, faculty cultureand student experiences would influence student learning (defined asimproved student performance on measures of the 11 EC2000 learn-ing outcomes).
• Employers would report improvements in the knowledge and compe-tencies of the engineering graduates they have hired since implemen-tation of EC2000.
DATA SOURCES AND INSTRUMENTS
The Engineering Change study examined accredited engineering pro-grams in selected engineering fields within a representative sample ofinstitutions. The population of programs for the EC2000 study wasdefined to be those programs accredited since 1990 in seven targeted dis-ciplines.2 Of the 1,241 ABET-accredited engineering programs in thetargeted disciplines, 1,024 met this specification. The project teamselected programs for participation in the study based on a two-stage,disproportionate,3 stratified random sample with a 7 � 3 � 2 design.The sample is stratified on three criteria: (1) the targeted seven disci-plines, (2) the three accreditation review cycles (pilot/early, on-time,deferred), and (3) whether the programs and institutions participated ina National Science Foundation Engineering Education Coalition duringthe 1990s.4 To round out the sample, four EC2000 pilot institutions(first reviewed in 1996 and 1997), and several Historically Black Col-leges and Universities (HBCUs) and Hispanic Serving Institutions
256 VOLKWEIN, LATTUCA, HARPER, AND DOMINGO

(HSIs) were added. The final sample included 203 engineering programsat 40 institutions. Table 1 lists the participating institutions.The participating schools include 23 public and 17 independently con-
trolled institutions. Thirty schools award doctoral degrees; six are mas-ter’s degree institutions, and four are baccalaureate or specializedinstitutions (based on the 2000 Carnegie Classifications). The programsat all these institutions closely resemble those in the defined population.Both the number of undergraduate degrees awarded by discipline andthe number of faculty in each discipline are within 3% points of theirrepresentation in the population. Although the proportion of privateinstitutions in the sample is greater than their number in the population,the percentages of undergraduate degrees awarded by public and private
TABLE 1. Institutions Participating in Engineering Change: A Study of the Impact
of EC2000
Doctoral Institutions
Arizona State University University of Texas at Arlington
Case Western Reserve University University of Texas at Austin
Clemson University Virginia Polytechnic Institute
and State UniversityCornell University
Western Michigan UniversityGeorgia Institute of Technology
Worchester Polytechnic InstituteHoward University
Illinois Institute of Technology
Master�s InstitutionsIowa State University
California State Polytechnic
University, Pomona
Lehigh University
California State University, Sacramento
Marquette University
Embry Riddle Aeronautical University
Massachusetts Institute of Technology
North Carolina A&T University
Ohio State University
Tuskegee University
Princeton University
Youngstown State University
Purdue University
Syracuse University
Bachelor�s and Specialized Institutions
Temple University
South Dakota School of Mines
and Technology
Texas A&M University
Tri-State University
University of Arkansas
Union College
University of California, Los Angeles
United States Military Academy
University of Florida
University of Illinois at Chicago
University of Michigan
University of Missouri-Columbia
University of Notre Dame
University of the Pacific
MEASURING THE IMPACT OF PROFESSIONAL ACCREDITATION 257

institutions align with those in the population from which the sample isdrawn. Finally, the profiles of small, medium, and large programs in thesample approximate the actual program size profiles in each of theseven disciplines.
DATA COLLECTION
Engineering Change collected data in 2003–2004 from several sources,including 2004 graduating seniors, 1994 engineering graduates, facultymembers and program chairs from these same programs, deans of theparticipating institutions, and employers (data from deans and employ-ers were not used in the analyses reported here). Institutions participat-ing in the study provided contact information for their faculty,graduating seniors, and alumni. One institution did not provide studentresponses, reducing that institutional sample to 39. Four of the fivesurvey instruments developed for the study and used for the currentanalysis are described below.The Survey of Seniors in Engineering Programs solicited information
on basic demographic information, level of participation in out-of-classactivities related to engineering education, student-learning outcomesassociated with the 11 EC2000 outcomes criteria, classroom experiences,and plans for the future. The companion instrument, the Survey of Engi-neering Alumni, asked 1994 graduates to report on these same educationalexperiences and their learning outcomes at the time of their graduation.The Survey of Engineering Program Changes collected program-level
information from program chairs, including changes over time in curric-ular emphases associated with the EC2000 learning outcomes, levels offaculty support for assessment and continuous improvement efforts, andchanges in institutional reward policies and practices. The companioninstrument, the Survey of Faculty Teaching and Student Learning inEngineering, collected complementary information on changes in curric-ula and instructional practices at the course-level, participation in pro-fessional development activities, assessments of student learning, andperceptions of changes in the faculty reward system.In the fall of 2003, survey instruments were sent to 2,971 faculty
members and 203 program chairs. In spring, 2004, surveys were sent tothe population of 12,144 seniors nearing graduation as well as the15,734 1994 graduates of the targeted 40 campuses (instruments areavailable at http://www.ed.psu.edu/cshe/abet/ instruments.html). Beforedata collection began, the dean of the college of engineering on eachcampus sent e-mail requests soliciting student and faculty participation.
258 VOLKWEIN, LATTUCA, HARPER, AND DOMINGO

Follow-up waves included a postcard reminder sent two weeks after theinitial mailing, and a complete follow-up (similar to the initial mailing)sent 2 weeks after the postcard.Survey responses were received from 4,543 graduating seniors, 5,578
alumni, 1,272 faculty members, and the chairs of 147 engineering pro-grams on 39 campuses. The student and alumni surveys yielded 4,330(36% response rate) and 5,336 (34%) usable cases respectively. The fac-ulty and program chair respondents yielded useable cases for 1,243 fac-ulty members (42%), and 147 program chairs (representing 72% of thetargeted programs).5
After conducting analyses of missing data on the student, alumni, andfaculty databases, we eliminated respondents who submitted surveys forwhich more than 20% of the variables were missing. We then imputedvalues (using expected maximization estimation in SPSS) for missingdata in the useable cases.6 We did not impute missing data for the pro-gram chairs due to the smaller number of cases in the database.
VARIABLES
Three sets of control variables are used in our multivariate analyses:(1) precollege characteristics of graduating seniors and alumni; (2) insti-tutional characteristics; and (3) engineering program characteristics. Pre-college characteristics include age, male/female, SAT/ACT scores,transfer status, race/ethnicity, family income, parents’ education, highschool GPA and citizenship. Institutional and program characteristicsare type of control, institutional type (based on Carnegie Classification,2001), institutional size and wealth, participation in an NSF Coalition,and engineering discipline. Two sets of dichotomously coded indepen-dent variables are used in these analyses—student cohort (1994 or 2004)and EC2000 review cycle (pilot/early, on-time, or deferred). See Table 2
TABLE 2. Sample Programs by Accreditation Cycle
Cycle Groups Programs (n) Pre-EC2000 Mixed Post-EC2000
Pilot 18 1990–1991 1996–1997a 2002–2003a
Early 69 1992–1994 1998–2000a 2004–2006a
Deferredb 48 1992–1994 1998–2000 2004–2006a
On-time 68 1994–1996 2001–2003a 2007–2009a
Total 203
aPrograms reaccredited during these years are reviewed under the new EC2000 standards.bThese 48 programs postponed for six years their review under the new EC2000 standards.
MEASURING THE IMPACT OF PROFESSIONAL ACCREDITATION 259

for the breakdown of sample programs by review cycle. We areespecially interested in comparing the performance indicators of the 48‘‘deferred’’ programs with the other groups.The dependent variables in our multivariate analyses are indicators of
program changes, student experiences and learning outcomes. Table 3summarizes these variables. Fourteen scales and one single-item measureassess changes in program characteristics before and after EC2000.Eight of these scales (four each from the program chair and facultydatasets) measure changes in curricular emphasis on topics associatedwith the EC2000 learning outcomes (for example, changes in curricularemphasis on Foundational Knowledge and Skills). Two scales measurechanges in emphasis on Active Learning or Traditional Pedagogies.Changes in Faculty Culture were assessed by two scales tapping facultyparticipation in professional development activities related to instruc-tional improvement and engagement in projects to improve undergradu-ate engineering education. An additional item asked program chairs toassess changes in faculty support for continuous improvement efforts.Finally, two scales (one for faculty and one for program chairs) mea-sured changes in perceptions of the degree to which the faculty rewardsystem emphasizes teaching. As seen in Table 3, the Alpha reliabilitiesfor these 14 scales range from .90 to .49, with only three falling below.72.Three scales measure students’ in-class experiences: Clarity and Orga-
nization; Collaborative Learning, and Instructor Interaction and Feed-back. Two other scales represent students’ perceptions of ProgramOpenness to Ideas and People and Program Climate. Additional out-of-class experiences are measured by single items that assess (1) the degreeto which students or alumni were active in a student chapter of a Pro-fessional Society, and (2) the number of months students and alumnispent in each of the following: Internship/Cooperative Education, Inter-national Travel, Study Abroad, and Student Design Competition.The learning outcomes scales are derived from a series of principal
components analysis of 36 survey items. The research team developedthese items through an iterative process designed to operationalize the11 learning outcomes specified in EC2000. For each item, respondentsindicated their level of achievement with regard to a particular skill on a5-point scale (1 = ‘‘No Ability’’ and 5 = ‘‘High Ability’’). The princi-pal components analysis produced a nine-factor solution that retainedmore than 75% of the variance among the original 36 survey items. (SeeTable 3 for sample items and scale reliabilities, and see Strauss and Ter-enzini (2005) for the full factor structure and description of the itemdevelopment process.)
260 VOLKWEIN, LATTUCA, HARPER, AND DOMINGO

TABLE 3. Variables Used in ANCOVA Analyses
Program Change Variablesa
Foundational knowledge as reported by faculty (3 item scale, alpha = .85)
Sample item: Compared to the first time you taught the course how,
if at all, has the emphasis on applying knowledge of mathematics,
sciences, and engineering changed?
Foundational knowledge as reported by program chairs (5 item scale, alpha = .74)
Sample item: Over the past decade, how, if at all, has your program’s
emphasis on basic engineering science changed?
Professionalism and societal issues as reported by faculty (4 item scale, alpha = .79)
Sample item: Compared to the first time you taught the course how,
if at all, has the emphasis on professional ethics changed?
Professionalism and societal issues as reported by program chairs
(5 item scale, alpha = .79)
Sample item: Compared to the first time you taught the course how,
if at all, has the emphasis on professional ethics changed?
Communication skills as reported by program chairs (3 item scale, alpha = .79)
Sample item: Over the past decade, how, if at all, has your program’s
emphasis on verbal communication changed?
Project skills as reported by faculty (4 item scale, alpha = .72)
Sample item: Compared to the first time you taught the course how,
if at all, has the emphasis on project management changed?
Project skills as reported by program chairs (4 item scale, alpha = .72)
Sample item: Over the past decade, how, if at all, has your program’s
emphasis on engineering design changed?
Applied engineering skills as reported by faculty (3 item scale, alpha = .52)
Sample item: Compared to the first time you taught the course how,
if at all, has the emphasis on modern engineering tools changed?
Active learning as reported by faculty (7 item scale, alpha = .80)
Sample item: Compared to the first time you taught the course how,
if at all, has the emphasis on assignments or exercises focusing
on application changed?
Traditional pedagogy as reported by faculty (2 item scale, alpha = .49)
Sample item: Compared to the first time you taught the course how,
if at all, has the emphasis on lectures changed?
Assessment for improvement as reported by program chairs (single item)
Over the past decade, have there been any changes in your program’s
use of assessment information for ongoing, systematic efforts
to improve program quality?
Instructional development as reported by faculty (4 item scale, alpha = .73)
Measured on a 3-point rating scale of ‘‘less,’’ ‘‘same’’, or ‘‘more’’
Sample item: Compared to 5 years ago, how often have you
participated in seminars or workshops on assessing student learning?
MEASURING THE IMPACT OF PROFESSIONAL ACCREDITATION 261

Table 3. Continued
Undergraduate education projects as reported by faculty (5 item scale, alpha = .64)
Measured on a 3-point rating scale of ‘‘less,’’ ‘‘same’’, or ‘‘more’’
Sample item: Compared to 5 years ago, how often have you participated
in a project to improve undergraduate engineering education?
Emphasis on teaching in rewards as reported by faculty (3 item scale, alpha = .90)
Sample item: Over the past decade, how has your programs emphasis
on teaching in recruiting and hiring changed?
Emphasis on teaching in rewards as reported by program chairs
(3 item scale, alpha = .89)
Sample item: Over the past decade, how has your programs
emphasis on teaching in recruiting and hiring changed?
Student Experience Variablesb
Collaborative learning (7 item scale, alpha = .90)
Sample item: How often did you discuss ideas with classmates?
Instructor interaction and feedback (5 item scale, alpha = .87)
Sample item: How often did you interact with instructors as part of the course?
Clarity and organization (3 item scale, alpha = .82)
Sample item: How often were assignments and class activities clearly explained?
Program encouragement for openness (4 item scale, alpha = .74)
Sample item: In your major, how often did engineering courses encourage you to
examine your beliefs and values?
Perceived program climate (4 item scale, alpha = .57)
Sample item: In your major, how often did you observe the use of offensive words,
behaviors, or gestures directed at students because of their identity?
Internship/co-op (single item)
Measured on a 5-point rating scale ranging from ‘‘none’’ to ‘‘more than 12 months’’
Student design competition (single item)
Measured on a 5-point rating scale ranging from ‘‘none’’ to ‘‘more than 12 months’’
Professional society involvement (single item)
Measured on a 4-point rating scale ranging from ‘‘not at all’’ to ‘‘highly’’
Student Learning Outcomes Variablesc
Applying math and science (2 item scale, alpha = .74)
Sample item: Please rate your ability to apply knowledge of mathematics
Experimental skills (4 items scale, alpha = .89)
Sample item: Please rate your ability to analyze evidence or data from an experiment
Applying engineering skills (4 item scale, alpha = .94)
Sample item: Please rate your ability to apply engineering tools
Design and problem solving (6 item scale, alpha = .92)
Sample item: Please rate your ability to design solutions to meet needs
Communication skills (4 item scale, alpha = .86)
Sample item: Please rate your ability to convey ideas in writing
262 VOLKWEIN, LATTUCA, HARPER, AND DOMINGO

Only four of the 28 multi-item scales developed for this study have al-pha reliabilities below the conventional .70 standard (i.e., applied engi-neering skills, traditional pedagogies, engagement in projects to improveundergraduate engineering education; and perceived program climate).Such scales can be retained for analyses if they have substantive or the-oretical value, which these do.
ANALYTICAL PROCEDURES
Data were analyzed using analysis of covariance (ANCOVA) withmultiple covariates to control for graduates’ precollege characteristics,program, and institutional traits. In the initial analysis, means for thepilot/early, on-time, and deferred EC2000 cycle group were comparedacross eight student in- and out-of-class experience scales, nine studentoutcome scales, 14 program change scales, and one single-item programchange variable. The Bonferroni correction was applied in order to miti-gate the effects of making comparisons across multiple groups by con-trolling overall error rate. In the second phase of the analysis, the 1994and 2004 engineering graduates’ mean scores were compared on studentexperience and outcome variables. Effect sizes were calculated in orderto determine the magnitude of the differences between the studentcohorts. In the third and final phase of analysis a series of pairwisemultiple comparisons were used to determine the mean differences in
g p y pp
Table 3. Continued
Group skills (3 item scale, alpha = .86)
Sample item: Please rate your ability to work with others to accomplish team goals
Societal and global issues (5 item scale, alpha = .92)
Sample item: Please rate your ability to understand contemporary issues
Ethics and professionalism (5 item scale, alpha = .87)
Sample items: Please rate your ability to understand the engineering code of ethics
Life-long learning (3 item scale, alpha = .78)
Sample item: To what extent are you able to learn and apply new technologies and
tools
aMeasured on a 5-point scale ranging from ‘‘significant decrease’’ to ‘‘significant increase’’
unless otherwise noted.bMeasured on a 4-point rating scale ranging from ‘‘almost never’’ to ‘‘almost always’’ unless
otherwise noted.cMeasured on a 5-point scale ranging from ‘‘no ability’’ to ‘‘high ability’’.
MEASURING THE IMPACT OF PROFESSIONAL ACCREDITATION 263
program changes, student experiences and outcomes among the threeEC2000 cycle groups.
RESULTS OF THE EC2000 STUDY
We first examined the data to see if the new EC2000 accreditationstandards are having the desired impact on engineering programs, stu-dent experiences, and student outcomes. We summarize here the majorfindings consistent with the logic of the conceptual model in Fig. 1.
CHANGES IN ENGINEERING PROGRAMS BETWEEN 1994AND 2004
According to program chairs and faculty members, engineering pro-gram curricula changed considerably following implementation of theEC2000 criteria. Both program chairs and faculty members report in-creased emphasis on nearly all of the professional skills and knowledgesets associated with EC2000 Criterion 3.a-k. Three-quarters or more ofthe chairs report moderate or significant increases in their program’semphases on communication, teamwork, use of modern engineeringtools, technical writing, lifelong learning, and engineering design. Simi-larly, more than half of the faculty respondents report a moderate tosignificant increase in their emphasis on the use of modern engineeringtools, teamwork, and engineering design in a course they taught regu-larly (these results not shown here but available from first author).EC2000’s focus on professional skills might be expected to lead to
changes in teaching methods as faculty members seek to provide stu-dents with opportunities to learn and practice their teamwork, design,and communication skills. Consistent with that expectation, half to two-thirds of the faculty report that they have increased their use of activelearning methods, such as group work, design projects, case studies, andapplication exercises, in a course they teach regularly (see Fig. 2).EC2000 also requires that engineering programs assess student perfor-
mance on the a-k learning outcomes and use the findings for programimprovement. Program chairs report high levels of faculty support forthese practices (see Fig. 3). About three quarters of chairs estimate thateither more than half or almost all of their faculty supported curriculardevelopment and revision efforts (76%) and systematic efforts toimprove (73%). Seventy percent report moderate to strong support forthe assessment of student learning, and about two-thirds report similarlevels of support for data-based decision-making.
y
264 VOLKWEIN, LATTUCA, HARPER, AND DOMINGO

Faculty generally corroborate this finding: As shown in Fig. 4, nearly90% of the faculty respondents report some personal effort in assess-ment, and more than half report moderate to significant levels of per-sonal effort in this area. For the most part, moreover, faculty members
FIG. 2. Faculty reports of changes in teaching methods since first teaching theirfocal course.
FIG. 3. Program chairs reports of faculty support for EC2000 initiatives.
MEASURING THE IMPACT OF PROFESSIONAL ACCREDITATION 265

do not perceive their assessment efforts to be overly burdensome: Near-ly 70% think their level of effort was ‘‘about right.’’Learning how to conduct assessment or incorporate active learning
methods into courses may influence faculty members’ engagement inprofessional development opportunities focused on teaching and learn-ing. This study finds that more than two-thirds of the faculty membersreport reading about teaching in the past year, and about half engage informal professional development activities, such as attending seminarsor workshops on teaching, learning, and assessment, or participating ina project to improve engineering education. Depending on the activity,one-fifth to one-quarter of the faculty members report that in the past5 years they have increased their teaching-and-learning-related profes-sional development efforts.One of the most important influences on faculty work in colleges and
universities is the institutional reward system, which can encourage ordiscourage attention to teaching. The EC2000 accreditation criteriarequire that engineering programs be responsible for the quality ofteaching, learning, and assessment, but do faculty members believe thattheir institutions value their contributions in these areas when makingdecisions about promotion, tenure, and merit-based salary increases?About half of the program chairs and faculty surveyed see no change intheir institution’s reward system over the past decade. About one thirdof the program chairs, however, report an increase over the past decadeon the emphasis given to teaching in promotion, tenure, and salary andmerit decisions. In contrast, roughly one-quarter of faculty respondentsbelieve the emphasis on teaching in their reward systems decreased in
FIG. 4. Faculty level of effort in assessment.
266 VOLKWEIN, LATTUCA, HARPER, AND DOMINGO

the same time period. Senior faculty members, however, tend to reportincreased emphasis on teaching in promotion and tenure decisionswhereas untenured faculty are more likely to report decreased emphasis.
CHANGES IN STUDENT EXPERIENCES
Have the curricular and pedagogical changes reported by programchairs and faculty had a measurable impact on the educational experi-ences of engineering undergraduates? The evidence suggests they have.Indeed, the experiences of the 2004 graduates differ in a number ofways from those of their counterparts of a decade earlier. The directionof the changes, moreover, is consistent with what one would expect ifEC2000 were putting down roots. As shown in Figs. 5 and 6, comparedto their counterparts of a decade earlier and controlling for an array ofindividual and institutional characteristics, 2004 graduates reported:
• More collaborative work and active engagement in their own learn-ing;
• More interaction with instructors and instructor feedback on theirwork;
• More study abroad and international travel experiences;• More involvement in engineering design competitions; and• More involvement in professional society chapters.
, , g g
FIG. 5. Adjusted means for 1994 and 2004 graduates’ in-class experiences duringtheir engineering programs.
MEASURING THE IMPACT OF PROFESSIONAL ACCREDITATION 267

Although they tend to be small, six of these eight differences betweenpre- and post-EC2000 graduates are statistically significant.The 2004 graduates, however, are slightly less positive than their pre-
decessors about the diversity climate in their programs. The generallyhigh scores on the ‘‘program diversity climate’’ scale reflect student per-ceptions that faculty in their programs are treating all students fairly, aswell as the general absence of personal harassment, offensive words,behaviors, or gestures directed at students because of their identity.Recent graduates perceive a significantly cooler climate for women andstudents of color than 1994 graduates, although the responses in bothyears are near the positive end of the five-point climate scale.Because some survey items were ambiguous with regard to whether
they described in- or out-of-class experiences, we treated the ‘‘programopenness’’ scale separately from those with more certain settings (andthus it is not shown in Fig. 5). Items in this scale tapped graduates’ per-ceptions of how much their engineering program encouraged them toexamine their beliefs and values, emphasized tolerance and respect fordifferences, made them aware of the importance of diversity in the engi-neering workplace, and how frequently they discussed diversity issueswith their engineering friends. In contrast to their reports about thediversity climate in their programs, more recent graduates report theirprograms to be marginally more open to new ideas and people than do
FIG. 6. Adjusted means for 1994 and 2004 graduates’ out-of-class experiencesduring their engineering programs.
268 VOLKWEIN, LATTUCA, HARPER, AND DOMINGO

their predecessors (scale means are 2.80 and 2.74, respectively; effectsize = .09, or 4 percentile points). The magnitude of this difference,however, suggests relatively little substantive change over the past dec-ade in the extent to which engineering programs encourage their stu-dents to be open to new ideas and people.
CHANGES IN LEARNING OUTCOMES
As noted in the methodology section, a factor analysis on the batteryof items reflecting EC2000 Criterion 3.a-k learning outcomes yieldednine scales. These nine scales became the dependent variables in a seriesof multivariate ANCOVA analyses that allowed us to examine the dif-ferences between 1994 and 2004 graduates. These analyses controlled forthe differences in student pre-college traits, as well as for the character-istics of the institutions and engineering programs they attended.Each of the nine outcomes scales are based on self-reported ability
levels at the time of graduation. A growing body of research over thepast 30 years has examined the adequacy of self-reported measures oflearning and skill development as proxies for objective measures of thesame traits or skills. Although results vary depending on the traits andinstruments examined, these studies report correlations of .50 to .90, be-tween self-reports and actual student grades, SAT scores, the ACTComprehensive Test, the College Basic Academic Subjects Examination,and the Graduate Record Examination.7 Moreover, most social scien-tists place a great deal of confidence in aggregated scores as an indica-tion of real differences between groups under the conditions prevailingin this study (Kuh, 2005).Figures 7–9 show the results of the multivariate ANCOVA analyses.
We see significant gains between 1994 and 2004 in their ability to
• Apply knowledge of mathematics, science, and engineering• Use modern engineering tools necessary for engineering practice• Use experimental skills to analyze and interpret data• Design solutions to engineering problems• Function in groups and engage in teamwork• Communicate effectively• Understand professional and ethical obligations• Understand the societal and global context of engineering solutions• Recognize the need for, and engage in life-long learning.
In all cases, the differences are consistent with what one would expectunder the assumption that EC2000 is having an impact on engineering
MEASURING THE IMPACT OF PROFESSIONAL ACCREDITATION 269

education. All differences, moreover, are statistically significant(p<.001), with effect sizes ranging from + .07 to + .80 of a standarddeviation (mean = + .36). Five of the nine effect sizes exceeded .3 ofa standard deviation, an effect size that might be characterized as‘‘moderate.’’
FIG. 7 Adjusted means for 1994 and 2004 graduates’ reports of their competence inmathematics, science, and engineering science skills.
FIG. 8. Adjusted means for 1994 and 2004 graduates’ reports of their competence inproject-related skill areas.
270 VOLKWEIN, LATTUCA, HARPER, AND DOMINGO

The largest differences between 1994 and 2004 graduates are in fiveareas: Awareness of societal and global issues that can affect (or beaffected by) engineering decisions (effect size = +.80 of a standarddeviation), applying engineering skills (+.47 sd), group skills (+.47 sd),and awareness of issues relating to ethics and professionalism (+.46 sd).The smallest difference is in graduates� abilities to apply mathematicsand sciences (+.07 sd). Despite that small but statistically significantdifference, this finding is particularly noteworthy because some facultymembers and others have expressed concerns that developing the profes-sional skills specified in EC2000 might require devoting less attention toteaching the science, math, and engineering science skills that are thefoundations of engineering. This finding indicates not only that therehas been no decline in graduates� knowledge and skills in these areas,but that more recent graduates report slightly better preparation thantheir counterparts a decade earlier. The evidence suggests not only thatimplementation of EC2000 is having a positive impact on engineeringeducation, but also that gains are being made at no expense to theteaching of basic science, math, and engineering science skills.
DIFFERENTIAL IMPACT BY YEAR OF ACCREDITATION REVIEW
Having documented the EC2000-driven changes between 1994 and2004, we next examined engineering programs that are reviewed earlierand later in the accreditation cycle. Are programs that deferred the
FIG. 9. Adjusted means for 1994 and 2004 graduates’ reports of their competence inthe contexts and professionalism cluster.
MEASURING THE IMPACT OF PROFESSIONAL ACCREDITATION 271

adoption of EC2000 significantly different from those programs that didnot? More specifically, do they differ in program changes, student expe-riences, and/or student outcomes?As we note in the methodology discussion above, the ABET 6-year
accreditation review cycle means that the 203 programs in our studystood for review under the new EC2000 standards at different points intime. After the 18 pilot programs (at four institutions) were reviewedin 1996–1997, those engineering programs scheduled for re-accreditationin 1998, 1999, and 2000 were given a choice to undergo review eitherunder the new EC2000 standards or the old standards, thus deferringthe EC2000 review for 6 years. Beginning in 2001, all programs wererequired to adhere to the EC2000 standards in order to be reaccredited.At the time of data collection in 2004, 18 programs had been reviewedtwice under EC2000 (the pilots), 69 programs had opted to be reviewedearly (in 1999–2000), 48 programs had elected to postpone their EC2000review for 6 years and instead be reviewed under the old standards, and68 programs underwent EC2000 review as required (shown in Table 2).Hence a key question: Do the engineering student experiences and out-comes in the 48 ‘‘deferred’’ programs differ significantly from the 155others in 2004?Congruent with our conceptual model, we first examined the 15 pro-
gram measures (described in Table 3) and found relatively uniformchanges in program curricula, in pedagogical practices, and in the gen-eral faculty culture (see Table 4). Changes in the faculty and programemphasis on communications skills, project skills, and assessment forimprovement were especially strong but relatively uniform across allprogram groups, even those that had not yet experienced an EC2000re-accreditation review. Only one of the 15 variables resulted in statisti-cally significant differences: faculty in the Deferred group reportedgreater emphasis on teaching in the rewards structure than faculty inthe other two groups.Next, we examined the 2004 in-class and out-of-class student experi-
ences shown in Table 5 and found almost the same uniformity amongthe three groups. For each of the eight indicators of EC2000-relevantexperiences and nine indicators of student learning, we tested for signifi-cant differences among the three groups, and only six of the 51 testsproved statistically significant at<.05. As shown in Table 5, students inthe Deferred programs report significantly greater engagement in collab-orative learning than those in the Early and On-time programs, andthey also report greater gains in ethics and professionalism than stu-dents in the On-time group. On the other hand, those in the Deferredgroup report less involvement in internships and cooperative education
272 VOLKWEIN, LATTUCA, HARPER, AND DOMINGO

TABLE 4. Adjusted Program Change Means, Standard Deviations, and Significant
Differences among the Three Accreditation Groups
Program Changes MeansaStandard
Deviations
Significant Differences
between Groups
Curriculum and Instruction
Foundational Knowledge (Faculty)
Early 3.130 .524 ns
On-time 3.126 .601 ns
Deferred 3.167 .586 ns
Foundational Knowledge (Chairs)
Early 3.231 .462 ns
On-time 3.147 .396 ns
Deferred 3.272 .505 ns
Professionalism and societal issues (Faculty)
Early 3.471 .580 ns
On-time 3.448 .596 ns
Deferred 3.551 .578 ns
Professionalism and societal issues (Program Chairs)
Early 3.899 .541 ns
On-time 3.827 .512 ns
Deferred 3.865 .426 ns
Communication Skills (Chairs)
Early 4.079 .623 ns
On-time 4.097 .627 ns
Deferred 4.037 .485 ns
Project Skills (Faculty)
Early 3.509 .598 ns
On-time 3.525 .643 ns
Deferred 3.509 .634 ns
Project Skills (Chairs)
Early 4.078 .651 ns
On-time 4.271 .591 ns
Deferred 4.299 .561 ns
Applied Skills (Faculty)
Early 3.628 .622 ns
On-time 3.586 .594 ns
Deferred 3.627 .632 ns
Active Learning (Faculty)
Early 3.554 .622 ns
On-time 3.575 .661 ns
Deferred 3.548 .589 ns
Traditional Pedagogy (Faculty)
Early 3.205 .649 ns
On-time 3.096 .648 ns
Deferred 3.197 .608 ns
MEASURING THE IMPACT OF PROFESSIONAL ACCREDITATION 273

experiences than both the Early and On-time groups, and lower gains inexperimental skills than the On-time group. There were no significantdifferences among the three cycle groups in the 13 other learning experi-ences and outcomes (e.g., instructor clarity, interaction and feedback,design competition, program openness and diversity, and participationin a student chapter of a professional society). We assumed that the stu-dents in the Early and On-time groups would report better EC2000-likeexperiences and greater learning gains than those in the Deferred group.Instead we find that 45 of the 51 differences in means among the threegroups on the 17 indicators are not significant, and three of the sixsignificance tests favored students in the Deferred programs and threefavored students in the other two groups.
Table 4. Continued
Program Changes MeansaStandard
Deviations
Significant Differences
between Groups
Faculty Culture
Assessment for Improvement (Program Chairs)
Early 4.335 .639 ns
On-time 4.159 .659 ns
Deferred 4.263 .646 ns
Instructional Development (Faculty)
Early 2.144 .455 ns
On-time 2.142 .484 ns
Deferred 2.182 .474 ns
UG Education Programs (Faculty)
Early 2.085 .376 ns
On-time 2.086 .397 ns
Deferred 2.090 .373 ns
Policies and Practices
Emphasis of Teaching in Rewards (Faculty)
Early 3.183 .783 ns
On-time 3.214 .780 Deferred sig.>On-time
Deferred 3.294 .639 Deferred sig. > Early
Emphasis of Teaching in Rewards (Program Chairs)
Early 4.560 1.251 ns
On-time 3.969 1.442 ns
Deferred 4.014 1.281 ns
*p £ 0.05, **p£ 0.01, ***p £ 0.001.a Adjusted for institutional control (public/private), NSF Coalition participation, Carnegie
Classification, wealth, and size.
274 VOLKWEIN, LATTUCA, HARPER, AND DOMINGO

Somewhat puzzled by these results, we next looked back at the 1994data to compare the 1994 and 2004 programs. We already knew fromthe faculty and program chairs that the changes in programs and curric-ula across the three groups were surprisingly uniform (as shown inTable 4), so we then examined the 1994 ANCOVA-adjusted means onthe eight student experiences and nine outcomes for the three groups.To our surprise, we found that (a) the 1994 Deferred group had thelowest mean on 14 of the 17 variables; and (b) the gains between 1994and 2004 and the associated effect sizes are greatest for the Deferred
TABLE 5. 2004 Adjusted Mean Differences in Student Experiences and Outcomes
among the Three Accreditation Groups
Mean Differencesa and Significance
Early–On
Time
On Time–
Deferred
Early–
Deferred
Student Experiences
In-class
Instructor clarity ).007 ).011 ).018Collaborative learning ).040 ).073* ).113***Instructor interaction and
feedback
.041 ).024 .017
Out-of-class
Internship/cooperative education ).023 .245*** .222***
Design competition .065 .040 .105
Professional Society Chapter .030 ).118 ).088Program diversity climate .000 .034 .033
Program Openness to Ideas and People .017 .018 .034
Student Outcomes
Applying math and science .035 ).022 .013
Design and problem solving ).059 .059 .000
Experimental skills ).024 .087** .064
Group skills .000 ).036 ).035Ethics and professionalism .045 ).080* ).035Communication skills .027 ).036 ).009Societal and global issues .006 ).028 ).022Applying engineering skills .010 .018 .027
Life-long learning ).008 .011 .003
*p £ 0.05, **p£ 0.01, ***p £ 0.001.aAdjusted for student transfer status, age, male/female, US citizenship, race/ethnicity, mother’s
education, father’s education, family income, test scores, high school GPA, discipline, and for
institutional control (public/private), NSF Coalition participation, Carnegie Classification,
wealth, and size.
MEASURING THE IMPACT OF PROFESSIONAL ACCREDITATION 275

group on 13 of the 17 variables (table not included but available fromfirst author). Thus, we appear to have a homogenization or catch-upeffect: the three groups were much more disparate in 1994, but muchmore alike in 2004.This conclusion is supported by the analysis shown in Table 6, which
shows the 51 ANCOVA-adjusted mean differences among the threegroups on the 17 indicators of student experiences and outcomes in1994. The means for the Early and/or On-time groups exceed the meansof the Deferred group on 14 of the 17 measures of student experiences
TABLE 6. 1994 Adjusted Mean Differences in Student Experiences and Outcomes
among the Three Accreditation Groups
Mean Differencesa and Significance
Early–On
Time
On Time–
Deferred
Early–
Deferred
Student Experiences
In-class
Instructor Clarity ).047* .099*** .052*
Collaborative learning .018 .005 .023
Instructor interaction and feedback ).010 .145*** .135***
Out-of-class
Internship/cooperative education .039 .002 .041
Design competition .042 .057 .100**
Professional society chapter .140*** ).095* .044
Program diversity climate ).029 .049* .019
Program Openness to Ideas and People ).012 .020 .008
Student Outcomes
Applying math and science .008 .025 .033
Design and problem solving ).046 .120*** .073*
Experimental skills ).043 .102** .059
Group skills .053 ).020 .033
Ethics and professionalism ).017 ).012 ).030Communication skills .032 .000 .032
Societal and global issues .013 .058 .071
Applying engineering skills ).014 .099** .085**
Life-long learning .004 .052 .056*
*p £ 0.05, **p £ 0.01, ***p £ 0.001.aAdjusted for student transfer status, age, male/female, US citizenship, race/ethnicity, mother’s
education, father’s education, family income, test scores, high school GPA, discipline, and for
institutional control (public/private), NSF Coalition participation, Carnegie Classification,
wealth, and size.
276 VOLKWEIN, LATTUCA, HARPER, AND DOMINGO

and outcomes; and the lag by the Deferred group is especially signifi-cant in instructor clarity, interaction and feedback, design competition,diversity climate, design, and problem solving, experimental skills, engi-neering skills, and life-long learning. Only in Professional Society Chap-ter participation did the Deferred group exceed the On-time (but not theEarly) group. In summary, the Deferred group means in 1994 are signif-icantly lower than the other two groups in eight of the 17 student expe-riences and outcomes, but by 2004 the deferred group means are lowerin only two of the 17 indicators and higher in two.
CONCLUSIONS
The 2004 evidence suggests a rather uniform level of post-EC2000performance across most of the measures and most of the groups in ourstudy. We suspect that, for one reason or another, the programs andinstitutions in the deferred group were lagging significantly behind theothers in 1998–2000, and they appeared to know it. Thus, they electedto stand for re-accreditation under the old ABET standards and todefer the EC2000 review for 6 years so they could catch up.This EC2000 Study provides the education research community with
evidence of a connection between changes in accreditation and the sub-sequent improvement of programs, curricula, teaching, and learning inundergraduate programs. Our findings reveal that engineering programshave changed substantially since the implementation of EC2000. In gen-eral, programs increased their emphasis on curriculum topics associatedwith EC2000 as well as the emphasis on active learning strategies. Engi-neering faculty are more engaged in assessment activities and in profes-sional development activities related to teaching and assessment. Thenature of the student educational experience has also changed. Com-pared to alumni of a decade ago, today’s engineering graduates areengaged in more collaborative learning activities in the classroom, inter-act more with faculty, and are more actively involved in co-curricularactivities such as engineering design competitions and student chaptersof professional organizations. Today’s graduates also report significantlyhigher levels in all of the student learning outcomes specified in theEC2000 criteria, and in some cases, the differences between 1994 and2004 graduates are substantial.All of this evidence suggests that EC2000 is working as expected. We
stress, however, that these changes are not attributable solely toEC2000. Other analyses have demonstrated that programmatic changesare due in part to EC2000 but that additional external and internalinfluences also shape engineering programs (for analyses and discussion,
MEASURING THE IMPACT OF PROFESSIONAL ACCREDITATION 277

see Lattuca et al., 2006; Lattuca, Strauss, and Sukbaatar, 2004). Ratherthan the sole influence, EC2000 accreditation is an important driver in aset of convergent factors (including faculty initiatives, external fundingfor projects to improve teaching and learning, and employer feedback)that influence educational activities and learning in engineering pro-grams.The current study, however, provides additional convincing evidence
supporting the important role that accreditation has played in engineer-ing education. When we began this study, we expected to find that engi-neering programs varied in their responsiveness to EC2000. We assumedthat programs that deferred their EC2000 accreditation review yearwould demonstrate less change than those that adopted EC2000 early.We expected to find lower levels of curricular and instructional changeand different kinds of student classroom and out-of-class experiences inthe deferred populations. We also expected that graduates of deferredprograms would report lesser levels of preparation on the 11 EC2000learning outcomes. Our analyses, however, indicate that, although thedeferred programs were indeed significantly behind the EC2000 earlyadopters in 1994, by 2004 these differences among Early/On-time andDeferred programs had largely disappeared.Our findings suggest that EC2000 was indeed a catalyst for change.
By 1996, all engineering programs knew that an EC2000 review layahead of them—and they all began to respond in kind. The deferredprograms bought time by using the old criteria for reviews between1998 and 2000, but they did so, apparently, knowing that they laggedbehind the others. As these analyses indicate, deferred programs madeconsiderable progress in meeting the goals expressed in EC2000 by2004, actually catching up to programs that were, in 1994, better pre-pared for an EC2000 review.A remaining question concerns the generalizability of these findings to
regional accreditation and to professional accreditation in other fields.As noted earlier, regional, or institutional, accreditation often requiresthe use of outcomes assessment, but does not specify particular learningoutcomes for all institutions. The diversity of institutional missions pre-sumably precludes the identification of a single set of learning outcomesfor all colleges and universities. Yet, the American Association of Col-leges and Universities (AAC&U) recently published the results of itsdecade-long national effort to identify liberal learning outcomes for allcollege graduates. By undertaking studies of high school and college stu-dents, faculty, employers, civic leaders, and accrediting bodies, AAC&Uhas galvanized a national consensus and identified a set of collegestudent outcomes that are needed by today’s citizens. Reported in
278 VOLKWEIN, LATTUCA, HARPER, AND DOMINGO

Taking Responsibility for the Quality of the Baccalaureate Degree (2004),these outcomes, such as written and verbal communication, inquiry andcritical thinking, quantitative literacy, teamwork, and information liter-acy, are highly consistent with the professional outcomes specified inEC2000. Moreover, the AAC&U efforts also have discovered goal con-gruence among the regional and specialized accrediting agencies. Thespecialized accrediting agencies that participated in the AAC&U Projecton Accreditation and Assessment (PAA) were unanimous in their beliefthat a strong liberal education was essential to success in each of theirprofessions (AAC&U, 2004). For example, seven of the eleven EC2000learning outcomes for engineering and technology graduates are visiblein almost any list of desired general education outcomes at most leadinginstitutions in any major. Hence, academic autonomy and differentialmission may not be the barrier it has been presumed to be—and theidentification of some shared learning outcomes for all graduates doesnot negate the need to specify unique outcomes that respond to addi-tional important institutional values.In the case of professional accreditation, it is reasonable to wonder
whether accreditors’ specification of learning outcomes will result in thekinds of consistent changes in programs and student outcomes we see inengineering. Like the regional accreditors, ABET enjoys almost uni-versal compliance; 96% of all engineering programs in the United Statesare ABET-accredited (due in part but not wholly to licensure require-ments). The number of programs seeking accreditation, however, variesby professional field. The National Council for Accreditation of Teach-ing Education, for example, accredits about 70% of the schools of edu-cation in the US (Wise, 2005). Likewise, just over 70% of newlylicensed nurses graduated in 2004 from programs accredited by theNational League for Nursing Accreditation Commission (2005). In con-trast, the Association to Advance Collegiate Schools of Business, (2006)accredits less than a third of the estimated 1500 schools of business inthe United States. Widespread change may depend on the perceivedimportance of accreditation. Some institutions may simply decide thatthe return on investment from specialized accreditation is not enough tojustify overhauling their educational programs.Despite variations in the types of accreditation and their application
in particular fields, the study of the impact of EC2000 provides usefulevidence that can inform discussions of accountability and quality assur-ance in higher education. Additional analyses of these data will providefurther information on the role that accreditation plays in programimprovement, but the current study at least answers the naggingquestion about what influence, if any, accreditation has on educational
MEASURING THE IMPACT OF PROFESSIONAL ACCREDITATION 279

quality and student learning in fields like engineering. As importantly,the study provides a model for evaluations in other professional fieldsand might be replicated by other agencies as they seek to under-stand—and establish—their impact on undergraduate and graduate edu-cation.
ACKNOWLEDGEMENTS
This study was sponsored by the Accrediting Board of Engineeringand Technology (ABET) and a grant from the National Science Foun-dation. The opinions expressed here do not necessarily reflect the opin-ions or policies of ABET, and no official endorsement should beinferred. The authors acknowledge and thank the other members of theresearch team who participated in the development of the design, instru-ments, and databases for this project: Dr. Patrick T. Terenzini, co-PI;Dr. Linda C. Strauss, senior project associate; Suzanne Bienart, projectassistant; and graduate research assistants Vicki L. Baker, Amber D.Lambert, and Javzan Sukhbaatar.
ENDNOTES
1. See standards of the Middle States Commission on Higher Education (2002), New Eng-
land Association of Schools and Colleges (2005), North Central Association of Colleges
and Schools (2003), Northwest Commission on Colleges and Universities (2006), Southern
Association of Colleges and Schools (2004), and the Western Association of Schools and
Colleges (2005).
2. The seven disciplines targeted for the Engineering Change study are aerospace, chemical,
civil, computer, electrical, industrial, and mechanical engineering. For the past 5 years,
these seven fields have annually accounted for about 85% of all undergraduate engineer-
ing degrees awarded in the U.S.
3. The sample is ‘‘disproportionate’’ because the team over-sampled the smaller disciplines
(e.g., aerospace and industrial) to ensure an adequate number of responses for discipline-
specific analyses.
4. During the 1990s, the National Science Foundation funded 10, multi-institution Engineer-
ing Education Coalitions to design and implement educational innovations and to dissemi-
nate findings and best practices in an effort to encourage curricular and instructional
reform. Wankat, Felder, Smith, and Oreovicz (2002) assert that NSF support has
‘‘probably done more to raise awareness of the scholarship of teaching and learning in
engineering than any other single factor’’ (p. 225).
5. Several chairs in the study administered more than one engineering program. We con-
tacted these chairs by phone to ask if they preferred to complete a single survey for both
programs or to respond for each program separately. Most completed one survey for two
programs, producing a lower number of program chairs surveys than the number of pro-
grams studied.
280 VOLKWEIN, LATTUCA, HARPER, AND DOMINGO

6. We did not impute personal characteristics such as male/female, race/ethnicity, and disci-
pline.
7. For a review of this literature see Volkwein (2005)
REFERENCES
ABET (Accreditation Board for Engineering and Technology). (1995). A Vision for Change: A
Summary Report of the ABET/NSF Industry Workshops. Author, Baltimore.
ABET. (1997). Engineering Criteria 2000 [Electronic version]. Author, Baltimore.
Association of American Colleges and Universities. (2004). Taking Responsibility for the Quality
of the Baccalaureate Degree. Author, Washington, DC.
Association to Advance Collegiate Schools of Business International. (2006). The AACSB
Guide to Business Education. Author, Tampa, FL. Retrieved May 13, 2006, from http://
www.aacsb.edu/publications/PocketGuide/B-SchoolGuideFinal.pdf.
Batalden, P., Leach, D., Swing, S., Dreyfus, H., and Dreyfus, S. (2002). General competencies
and accreditation in graduate medical education. Health Affairs 21(5): 103.
Bollag, B. (2005). Congress stops giving heartburn to accreditors. The Chronicle of Higher
Education 52(16): A1, A22–A23.
Bollag, B. (2006). Federal panel floats plan to overhaul accreditation. The Chronicle of Higher
Education 52(32): A1, A18–A19.
Carnegie Foundation for the Advancement of Teaching. (2001). The Carnegie Classification of
Institutions of Higher Education (2000 ed.). Author, Menlo Park, CA.
CHEA (Council for Higher Education Accreditation) (2003). Statement of Mutual Responsi-
bilities for Student Learning Outcomes: Accreditation, Institutions, and Programs, CHEA,
Washington, DC.
Kuh, G. D. (2005). Imagine asking the client: Using student and alumni surveys for
accountability in higher education. In: Burke, J. C. and Associates (eds.), Achieving
Accountability in Higher Education: Balancing Public, Academic, and Market Demands.
Jossey-Bass, San Francisco, pp. 148–172.
Lattuca, L. R., Terenzini, P. T., and Volkwein, J. F. (2006). Engineering Change: A Study of the
Impact of EC2000. Final Report. ABET, Baltimore, MD.
Lattuca, L. R., Strauss, L. C., and Sukhbaatar, J. (2004). The Impact of Program Accreditation
on Curriculum & Instruction: Findings from a National Study. Paper presented at the Annual
Meeting of the Association for the Study of Higher Education, Kansas City, MO.
Laurenson, R. M. (2001). Initial Assessment of the Impact of ABET/EC2000 Implementation
Using Mechanical Engineering Programs as the Pilot Study Group: A Project of the ASME
Committee on Engineering Accreditation, American Society of Mechanical Engineers, NY.
Middle States Commission on Higher Education. (2002). Characteristics of Excellence in Higher
Education: Eligibility Requirements and Standards for Accreditation [Electronic version].
Author, Philadelphia, PA.
NLNAC (National League for Nursing Accreditation Commission, Inc.). (2005). 2005 Report
to Constituents. Author, New York. Retrieved May 13, 2006, from http://www.nlnac.org/
reports/2005.pdf.
New England Association of Schools and Colleges, Commission on Institutions of Higher
Education. (2005). Standards for Accreditation. Author, Bedford, MA. Retrieved May 11,
2006, from http://www.neasc.org/cihe/standards2005.htm.
MEASURING THE IMPACT OF PROFESSIONAL ACCREDITATION 281

North Central Association of Colleges and Schools, The Higher Learning Commission. (2003).
Handbook ofAccreditation (3rd edn.). Author, Chicago, IL.RetrievedMay11, 2006, fromhttp://
www.ncahlc.org/index.php?option = com_content&task = view&id = 37&Itemid = 116.
Northwest Commission on Colleges and Universities. (2006). Accreditation Standards. Author,
Redmond, WA. Retrieved May 11, 2006 from http://www.nwccu.org/Standards%20
and%20Policies/Accreditation%20Standards/Accreditation%20Standards.htm.
Prados, J.W. (1995). Engineering education and accreditation reform: How did we get here, and
where are we going? Presentation at ABET Synthesis workshop, August 18, 1995, Baltimore,
Maryland.
Prados, J. W., Peterson, G. D., and Aberle, K. B. (2001). A Vision for Change: The
Transformation of US Educational Quality Assurance in Engineering. Paper presented at the
SEFI (European Society for Engineering Education) Conference, Copenhagen, Denmark.
Sinning, K. E., and Dykxhoorn, H. J. (2001). Processes implemented for AACSB accounting
accreditation and the degree of faculty involvement. Issues in Accounting Education 16(2):
181–205.
Southern Association of Colleges and Schools, Commission on Colleges. (2004). Principles of
Accreditation: Foundations for Quality Enhancement [Electronic version]. Author, Decatur,
GA.
Strauss, L. C. and Terenzini, P. T. (2005). Assessing student performance on EC2000 Criterion
3.a-k. In: Proceedings of the 2005 American Society for Engineering Education Annual
Conference & Exposition.
Volkwein, J. F. (2005). On the Correspondence between Objective and Self-Reported Measures of
Student Learning Outcomes. Resource paper http://www.ed.psu.edu/cshe/abet/resour-
ces.html.
Volkwein, J. F., Lattuca, L. R., Caffrey, H. S., and Reindl, T. (2003). What works to ensure
quality in higher education institutions. AASCU/CSHE. Policy Seminar on Student Success,
Accreditation, and Quality Assurance, AASC&U and Penn State University, Washington,
DC,.
Wankat, P. C., Felder, R. M., Smith, K. A., and Oreovicz, F. S. (2002). The scholarship of
teaching and learning in engineering. In: Huber, M. T, and Morreale, S. (eds.), Disciplinary
Styles in the Scholarship of Teaching and learning: Exploring Common Ground. American
Association for Higher Education, Washington, DC.
Western Association of Schools and Colleges. (2005). How to Become Accredited: Procedures
Manual for Eligibility, Candidacy, and Initial Accreditation [Electronic version]. Author,
Alameda, CA.
Wise, A. E. (2005). Establishing teaching as a profession: The essential role of professional
accreditation. Journal of Teacher Education 56(4): 318–331.
Received June 9, 2006
282 VOLKWEIN, LATTUCA, HARPER, AND DOMINGO