Measuring the impact of communication technology on group decision making · PDF...
18
5 Measuring the impact of communication technology on group decision making Pieter W.G. Bots and Robert Jan Streng* Faculty of Systems Engineering, Policy Analysis and Management Delft University of Technology P.O. Box 5015, NL-2600 GA Delft, the Netherlands Voice: +31 152782948 Fax: +31 152783422 E-mail: [email protected] *The second author is presently working with BSO-ORIGIN Consultancy, Utrecht, the Netherlands. Abstract This paper reports on a longitudinal experiment under controlled conditions that was conducted to measure the impact of communication technology on group decision making. SmaIl groups of MIS students were observed while playing a series of rounds in a management game under three different conditions: face-to-face in one room, dispersed over four rooms with audio and video connection, and dispersed with audio connection only. Contrary to expectation, hardly any significant differences in task performance were found. Although the limitations of the study ask for cautious interpretation of the [mdings, it would seem that communication technology will not be a major obstacle on the road to effective international offices of the future. Keywords Communication technology, decision making, CSCW, impact assessment, management game 1 INTRODUCTION If the different problem analyses in Bots et at. (1995) with respect to the international office of the future (IOF) hold any truth, then of all potential keys to this office, communication technology will be the easiest one to tum. Yet earlier literature on management and decision making in organizations points out phenomena that may impede adoption of this technology. For one, Daft et at. (1987) observed in practice that managers are reluctant to replace their conventional meetings by technology-based ones: "Executives continue to prefer oral, face-to-face communication for much of B. C. Glasson et al. (eds.), Information Systems and Technology in the International Office of the Future © Springer Science+Business Media Dordrecht 1996
Transcript of Measuring the impact of communication technology on group decision making · PDF...

5
Measuring the impact of communication technology on group decision making
Pieter W.G. Bots and Robert Jan Streng* Faculty of Systems Engineering, Policy Analysis and Management Delft University of Technology P.O. Box 5015, NL-2600 GA Delft, the Netherlands Voice: +31 152782948 Fax: +31 152783422 E-mail: [email protected] *The second author is presently working with BSO-ORIGIN Consultancy, Utrecht, the Netherlands.
Abstract This paper reports on a longitudinal experiment under controlled conditions that was conducted to measure the impact of communication technology on group decision making. SmaIl groups of MIS students were observed while playing a series of rounds in a management game under three different conditions: face-to-face in one room, dispersed over four rooms with audio and video connection, and dispersed with audio connection only. Contrary to expectation, hardly any significant differences in task performance were found. Although the limitations of the study ask for cautious interpretation of the [mdings, it would seem that communication technology will not be a major obstacle on the road to effective international offices of the future.
Keywords Communication technology, decision making, CSCW, impact assessment, management game
1 INTRODUCTION
If the different problem analyses in Bots et at. (1995) with respect to the international office of the future (IOF) hold any truth, then of all potential keys to this office, communication technology will be the easiest one to tum. Yet earlier literature on management and decision making in organizations points out phenomena that may impede adoption of this technology. For one, Daft et at. (1987) observed in practice that managers are reluctant to replace their conventional meetings by technology-based ones: "Executives continue to prefer oral, face-to-face communication for much of
B. C. Glasson et al. (eds.), Information Systems and Technology in the International Office of the Future© Springer Science+Business Media Dordrecht 1996

64 Part B Full Papers
their work. The availability of teleconferencing and other electronic media has not reduced travel or face-to-face communications". The question we address in this paper is whether decision makers are right in preferring face-to-face meetings: Do video-conferencing and telephone-conferencing indeed have such a negative impact on decision process and decision outcome that a skeptic attitude towards these technologies is justified?
To get a better understanding of the impact of communication technology on group decision making performance, we conducted a longitudinal experiment in which groups of students had to work on a particular decision making task under one of three different conditions: either a face-toface setting, an audio-conference setting or a video-conference setting.
In the following section we outline the conceptual framework that we chose as basis for the experimental design. In section 3 we show how the problem of measuring the impact of communication technology on group decision making was operationalized into an experim-ental design. In section 4 we present the obeservations and discuss the outcome of the experiment.
2 CONCEPTUAL FRAMEWORK FOR THE STUDY
Assessing the impact of new technologies on current business practice is a rich and complex issue. In conceptualizing this research we made reductions along several dimensions:
• the characteristics to differentiate between levels of communication technology;
• the type of activity in which this technology is used;
• the impact area that is observed.
Differentiating characteristic: media richness To classify communication media, Daft and Lengel (1986) introduced the concept of "media richness". In their theoretical framework, the richness of a communication medium is operationalized in terms of four factors: feedback capability, the capability of the medium to transmit multiple cues, the language variety, and the personal focus of the medium. In this framework, face-to-face meetings provide the "richest" communication medium, video-conferencing is "leaner" (reduced visibility of group members, no "touch and smell") and audio-conferencing is again "leaner" (no visual cues at all). No use of telecommunication technology would result in even "leaner" communication media, such as asynchronous communication by exchanging written memos.
McCarthy et al. (1991) and Chappell et at. (1992) use a different classification scheme: They distinguish between communication channels on the basis of four tasks that should be performed: synchronization of communication, maintaining conversational coherence, repairing conversational breakdown, and maintaining shared focus. Although these factors are quite different from the factors in the media richness framework, the classification outcome when applied to the three communication settings (face-to-tace, video and audio) is essentially the same.
Following amongst others Rice (1984), Kinney and Watson (1992), and El-Shinnawy and Markus (1992) we adopt the media richness terminology for this study. A "rich" communication medium is expected to have less impact on group performance than a "lean" communication medium. Thus, media richness is taken as the independent variable.
Activity: group decision making DeSanctis and Gallupe (1987) defme a decision making group as two or more people jointly responsible for detecting a problem, elaborating on the nature of the problem, generating possible

Communication technology on group decision making 65
solutions, or formulating strategies for implementing solutions. Jacob and Pirkul (1992) state that the key difference between an individual decision maker and a decision making group is the need for interaction between the group members during the decision making process.
The information processing model of organizations (Galbraith 1977) implies that there are two factors that influence this interaction: uncertainty and equivocality (EI-Shinnawy and Markus 1992). Uncertainty refers to "the difference between amount of information required to perform the task and the amount of information already possessed by the organization". Equivocality refers to ambiguity and multiple, conflicting interpretations of situations (Weick 1979). Communication is considered essential in resolving issues that involve ambiguity. This makes group decision making in illstructured or semi-structured situations an appropriate activity for studying the impact of communication technology on group performance.
Group performance in problem solving and decision making tasks under different conditions has been researched extensively (McGrath and Hollingshead 1994). The research on support for group decision making can roughly be divided into two main streams: supporting the process by means of information technology and supporting the process by means of communication technology. The definition of electronic meeting systems (EMS) as given by Dennis et al. (1988) covers both: "EMS are systems that use information technology to support the group work that occurs in meetings. EMSs combine the task orientation of GDSS and the communication orientation of CSCW." In their literature review, Dennis et al. show that the largest body of research on EMS is concerned with comparing the use of a decision room with situations in which no computer support is provided. Since our objective is to measure the impact of communication technology only, the level of (computer based) decision support available to the group is a variable that must be controlled in the experiment.
Impact area: quality of decision making In their research on the benefits of expert systems, Oz et al. (1993) make distinction between three key factors in decision making: decision quality, decision making time and confidence in the decision. They remark that there are two important schools of thought on the quality of decision making: one emphasizes the process, the other mainly considers the outcome. We consider both aspects important for assessing the impact of communication technology on group decision making.
Based on a survey of the literature on decision making, Janis and Mann (1977) compiled a set of major criteria that can be used to determine whether the decision making process is of high qUality. They state: ''The effective decision maker, to the best of his ability and within his information processing capabilities,
1. thoroughly canvasses a wide range of alternative courses of action; 2. surveys the full range of objectives to be fulfilled and the values implicated by the choice; 3. carefully weighs whatever he or she knows about the costs and risks of negative consequences, as
well as the positive consequences, that could flow from each alternative; 4. intensively searches for new information relevant to further evaluation of the alternatives; 5. correctly assimilates and takes account of any new information or expert judgment to which he is
exposed, even when the information or judgment does not support the course of action he initially prefers."
To measure quality of decision process, these five aspects must be further operationalized in the context of the specific decision making task. Quality of decision outcome can be measured if there is a standard for comparison of task performance and adequate control for external influences on the

66 Part B Full Papers
variables that are identified to indicate success. In theory, appropriate experimental design can create such circumstances. Practice shows that such decision making tasks tend to become too artificial to allow for generalization to real-life decision making contexts (Van Schaik, 1988; Kottemann and Remus 1991; Sheffield 1995). With this caution in mind, quality of decision process and decision outcome is taken as the dependent variable.
At the conceptual level, we formulate the relationship between dependent and independent variables by these two hypotheses:
HI. When two groups of decision makers with equal skills are working on the same problem, the group that uses the "richer" communication channel will go through a better decision process, that is: they will consider more alternative courses of action and they will analyze these deeper than the group that communicates through the "leaner" communication channel.
H2. When two groups of decision makers with equal skills are working on the same problem, the group that uses the "richer" communication channel will make better decisions than the group that communicates through the "leaner" communication channel.
In the following section, we describe the experimental setting created to test these two hypotheses.
3 EXPERIMENT
We set up the experiment along the same lines that were followed by e.g. Van Schaik (1988), Kottemann and Remus (1991) and Oz et al. (1993). The decision making activity involves playing a round in a management game, where small groups of students each are to make their decisions under different conditions, in this case audio, video of face-to-face. We first describe how the different levels of media richness have been implemented. We then tum to the decision making task, outlining the management game and the information that is made available to the decision making groups. Next, we further operationalize hypotheses HI and H2 in the context of the experimental setup. Finally, we describe the way in which experimental control has been implemented.
3.1 Implementing different levels of media richness
For the experiment we made use of the Laboratory for Work and Information Technology (the WIT-lab) at Delft University of Technology (Van der Velden, 1995). The laboratory consists of five sound-proofed test rooms and a control room, all interconnected by several networks, supporting audio, video and data transmission. The rooms are decorated to create a genuine "office atmosphere". At the time of the experiment, each test room feautured an Apple MacIntosh™ , a video camera/monitor combination, and a clip-on microphone and two audio speakers to allow synchronous (full-duplex) voice communication. Figure 1 gives an impression of the "office workplaces" the WIT-lab thus provides.

Communication technology on group decision making 67
Figure 1 Impression of the work places as used in the experiment
The video equipment has been designed to preserve the impression of "eye contact" between group members: a video camera registers the image of the person facing the monitor via a one-way mirror positioned at a 45° angle as depicted in Figure 2. The images from four cameras are displayed on the monitor simultaneously by means of a video splitter.
video camera
one-way mirror
Figure 2 Mounting of video camera and monitor.
The computers in the test rooms all are connected with a server in the control room. The software used in the experiment runs on this server. Its output image is displayed on all computer screens using the MacIntosh Timbuktu™ software. This application also processes mouse and keyboard control from each of the computers.
The three different levels of media richness have been implemented as follows:
• Face-to-face: For this condition, we made use of the larger of the five rooms. Group members were seated on one side of the table on which the computer was installed, with a separate mouse available to each member. The audio and video equipment were not used.

68 Part B Full Papers
• Video: The video-conferencing condition was implemented by dispersing the group over the four smaller test rooms. Here, each group member found himlherself in the position depicted by
• Figure l. • Audio: This condition was identical to the video-conferencing setting except that the video image
was not displayed on the monitor.
3.2 The decision making task
To assess the impact of communication technology on group decision making, the decision making task should be sufficiently equivocal to require group members to interact to solve the problem at hand and yet sufficiently structured to allow the observers to measure the effectiveness of the decisions. Using a management game that is well-known to us and - at first - completely unknown to the student subjects seemed adequate to meet these two demands.
The management game we used in the experiment was developed at Delft University of Technology and has been used previously as a research implement (Van Schaik 1988; Bots et al. 1989). It is still being used in executive workshops on decision support systems. The game has two important characteristics:
• taking the decisions is experienced by players as an ill-structured task;
• there is sufficient evidence that systematic information gathering leads to a better score.
The decisions that have to be made concern the management of a firm that produces materials for housing construction. This firm competes with a number of other firms on a market that is sensitive not only to pricing and advertising policies of these firms, but also to such external factors as industrial production, interest rate and season - the number of housing starts tends to follow a seasonal pattern. A round in the game corresponds to a business period of three months. Each round, the players have to decide upon these six variables:
• selling price of their product;
• number of salespersons;
• amount of expense for publicity;
• number of production line workers;
• total production volume;
• number of new production lines to build.
Information regarding fixed factors such as the cost of labor, depreciation of equipment and investment in new production lines is available to the players in an 8-page instruction manual. Information regarding variable factors, including decisions made in prior game periods, are made available electronically at the beginning of the next round. Each round, players typically have one hour to browse through this information and make their decisions.
To be able to run the game on the WIT-lab equipment, the user interface was redeveloped using Apple's HyperCard™ software. Via this interface, players have access to information that is stored in a stack of "hypercards". The order of browsing through this stack is not enforced by the system; the players can freely move through the stack. As can be seen in Table 1, these cards conceptually
Communication technology on group decision making 69
fall into two categories: those supporting intelligence activities and those supporting design and choice.
Table 1 Two groups of cards Intelligence Balance infonnation Profit statement Liquidity Market infonnation Regression analyses
Design and choice Decision infonnation Notepad
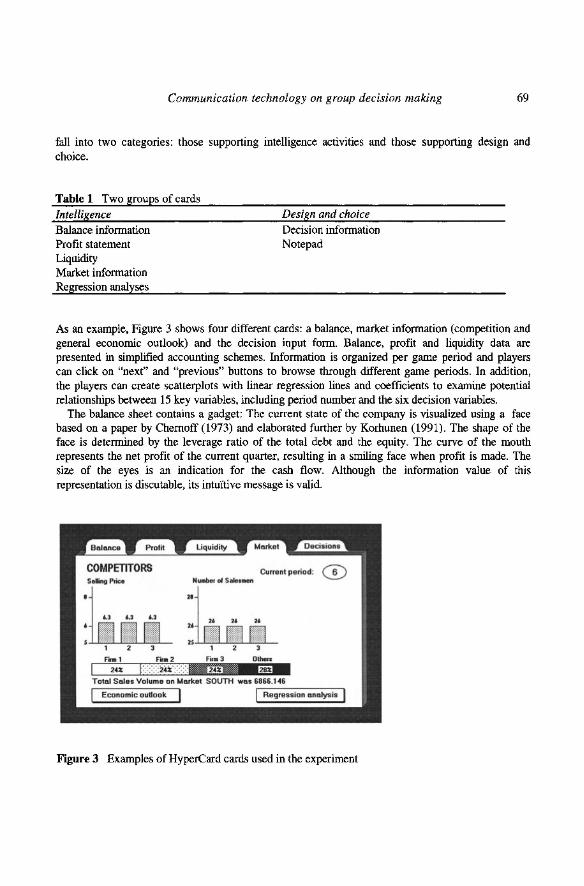
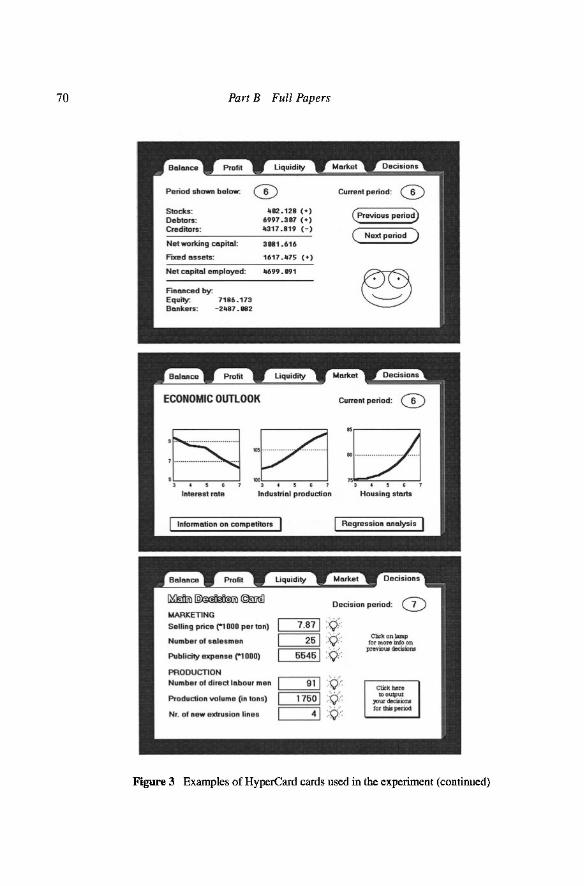
As an example, Figure 3 shows four different cards: a balance, market infonnation (competition and general economic outlook) and the decision input fonn. Balance, profit and liquidity data are presented in simplified accounting schemes. Infonnation is organized per game period and players can click on "next" and "previous" buttons to browse through different game periods. In addition, the players can create scatterplots with linear regression lines and coefficients to examine potential relationships between 15 key variables, including period number and the six decision variables.
The balance sheet contains a gadget: The current state of the company is visualized using a face based on a paper by Chernoff (1973) and elaborated further by Korhunen (1991). The shape of the face is determined by the leverage ratio of the total debt and the equity. The curve of the mouth represents the net profit of the current quarter, resulting in a smiling face when profit is made. The size of the eyes is an indication for the cash flow. Although the infonnation value of this representation is discutable, its intuitive message is valid.
Figure 3 Examples of HyperCard cards used in the experiment
70 Part B Full Papers
Stocb: Debtors: Cred~ors:
Net working capikll:
Faxed asse1s :
_02.128 (.) 6997.307 (.) _317 .819 ( - )
3181 . 616
1617._75 (.)
Net cap~al employed: ~99. 091
Financed by: Equity. 7186.173 Bankors: - 2"87.082
( PreviOUS periOd)
( Next periOd)
CuITS"t period:
·~·· -······················· ~Ea ~-.-- .. -.. -- .. -........... . .. ........................... . 1·---· · ···· · __ · __ ·· __ ·_- ---
, .. l f 5 , J 3 • !!i " 1 f S , 7
Interest rn.tB Indus,rial production Housing start.
MARKETING
Selling price ilOOO per Ion)
Number of salesmen
Publicity expense ("1000)
PRODUCTION Numbar of dirod Inhour mon
Production vo1ume (in tons)
Nr. of new eXb'usion lines
Decision period:
7.87 1 :~( 25 1 :1;1;':
~:::::55==4551 :1;1;':
91 1 :1;1;': ~='17~5~O 1 :1;1;': L...----'-J4 1 :.1;1;':
CtieJI: on lClp lor m.ore into on
pre-RJUldI!!IciOms:
Figure 3 Examples of HyperCard cards used in the experiment (continued)

Communication technology on group decision making 71
3.3 Operationalization
Figure 4 shows the basic scheme for the experiment. The unit of observation is one round in the game played by one group. The independent variable is medium richness. Group composition, decision making task and level of computer support must be controlled for.
Decision process quality has been operationalized in terms of the search for information studied and the number of alternatives considered. To measure the intensity of the search for information, the number of cards consulted during a session and the number of regression analyses made are counted. The number of alternatives considered is measured by counting the number of times key decision variables have been changed on the main decision card.
Decision outcome quality has been operationalized in terms of the amount of profit made (relative to the total profit made on the market in that period) and the market share realized in that period. Although these variables depend not only on the quality of the decisions made in that same round, they are suitable performance indicators when a series of rounds is played.
Independent variable Dependent variables
session length "intelligence" fraction
EXPERIMENT # cards consulted medium richness # regression plots made • playing one round
in a management game # decision changes profit score market share
group composition t r task and starting conditions
level of computer support
Controlled variables
Figure 4 Experiment variables
Since groups would be playing a sequence of rounds, we anticipated a leaming effect that might introduce a bias. Main indicator for a leaming effect is the time required for decision making. Such time may possibly be influenced by medium richness. Fowler and Wackerbarth (1988) report that audio groups spend more time maintaining group organization than face-to-face groups do. However, this claim is not supported by Kinney and Watson (1992) who concluded that their hypothesis that the decision time for audio-supported groups would be longer than for face-to-face groups could not be proven. In view of these conflicting results, we choose not to use session length as an indicator for decision making performance, but only to check for possible differences in learning behavior. As a potential second indicator for learning behavior, we chose the fraction of time groups spend on "intelligence" activities. The rationale for adding this indicator is that as groups learn, they will require relatively less time finding and evaluating the information that is relevant, leaving more time for design and choice activities.

72 Part B Full Papers
Operationalizing hypothesis HI and H2 from section 2 in terms of the variables in Figure 4 leads to the following set of hypotheses:
Hl.l. The number of cards studied will be higher for face-to-face groups than for mediated groups, and higher for video-groups than for audio-groups.
H1.2. The number of regression analyses made by face-to-face groups will be higher than by mediated groups, and higher for video groups than for audio groups.
H1.3. The number of decision changes by face-to-face groups will be higher than for mediated groups, and higher for video-groups than for audio-groups.
H2.1. The relative profit score for face-to-face groups will be higher than for mediated groups, and higher for video-groups than for aUdio-groups.
H2.2. The market share of face-to-face groups will be higher than for mediated groups, and higher for video-groups than for audio-groups.
3.4 Experimental control
The decision making groups all consisted of four participants: computer science students with only a basic background in management science. Participation in the game was mandatory to get credit for the MIS course it was part of. We controlled the group composition for any prior working relationships amongst students. The game was configured to allow 16 groups to play on four different markets: four groups on each market. Assignment of groups to markets was random. Each group played 10 rounds at a rate of one round per week. The students were asked not to discuss the game when not in session. With a single exception, this rule was observed.
To create uniform starting conditions, all groups started in game period 7 with up to that point identical firms. The players were made very clear that the objective was to realize both profit and market share. They were not instructed regarding their decision process, although they were told that the game tends to favor players that make good use of the available information. To increase motivation, we offered rewards ranging from $10 to $50 per student, depending on their final performance on their market. To control for "end of game" behavior - typically low performing groups that make ''wild'' decisions to chance for a last round success - the results of the last round were not included in the analysis.
For each market, the four groups were again randomly assigned to the different conditions: one audio, one video and two face-to-face. The second face-to-face group was placed in the videoconferencing setting after round 11 to see whether a switch to a "leaner" medium after working some time face-to-face would show a significant impact. With nine rounds, this could in theory yield 144 observations. The actual numbers deviate from this due to scheduling constraints imposed by availability of facilities and students. These irregularities should not introduce a systematic error in the observations, however.
4 EXPERIMENTAL FINDINGS
4.1 Checking for learning effects
As we remarked in section 3.3, different conditions might affect the groups in becoming proficient in the decision making task. We argued that a decrease in session length and the fraction of game time
Communication technology on group decision making 73
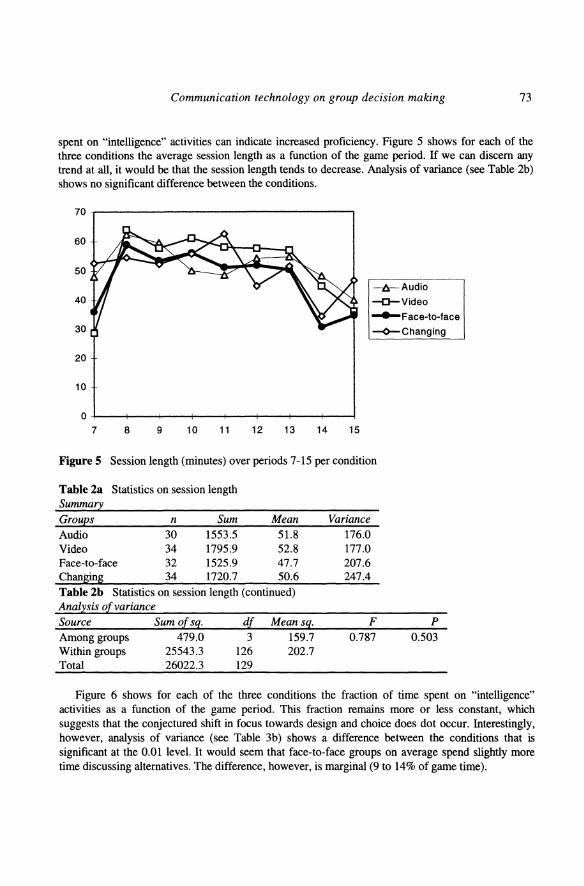
spent on "intelligence" activities can indicate increased proficiency. Figure 5 shows for each of the three conditions the average session length as a function of the game period. If we can discern any trend at all, it would be that the session length tends to decrease. Analysis of variance (see Table 2b) shows no significant difference between the conditions.
70
60
50
---l:r- Audia 40 -o-Videa
-Face-la-face 30 -<>-Changing
20
10
0 7 8 9 10 11 12 13 14 15
Figure 5 Session length (minutes) over periods 7-15 per condition
Table 2a Statistics on session length Summa1:l, Groue,s n Sum Mean Audio 30 1553.5 51.8 Video 34 1795.9 52.8 Face-to-face 32 1525.9 47.7 Changing 34 1720.7 50.6 Table 2b Statistics on session length (continued) Analysis of variance Source Sum of sq. df Mean sq. Among groups 479.0 3 159.7 Within groups 25543.3 126 202.7 Total 26022.3 129
Variance 176.0 177.0 207.6 247.4
F p
0.787 0.503
Figure 6 shows for each of the three conditions the fraction of time spent on "intelligence" activities as a function of the game period. This fraction remains more or less constant, which suggests that the conjectured shift in focus towards design and choice does dot occur. Interestingly, however, analysis of variance (see Table 3b) shows a difference between the conditions that is significant at the 0.01 level. It would seem that face-to-face groups on average spend slightly more time discussing alternatives. The difference, however, is marginal (9 to 14% of game time).

74 Part B Full Papers
0.9
0.8
0.7
0.6 -A-Audio
0.5 ---O-Video -Face-to-face
0.4 --<>- Changing
0.3
0.2
0.1
0 7 8 9 10 11 12 13 14 15
Figure 6 Fraction of "intelligence" time over periods 7-15 per condition
Table3a Statistics on fraction of "intelligence" time Summa'.:2., Groul!.s n Sum Mean Variance Audio 30 21.6 0.72 0.020 Video 34 25.5 0.75 0.010 Face-to-face 32 20.4 0.64 0.021
Chan~ 34 26.2 0.77 0.013
Table 3b Statistics on fraction of "intelligence" time (continued) Analysis of variance Source Sum of sq. Among groups 0.330 Within groups 2.012 Total 2.342
df 3
126 129
Mean sq. 0.1100 0.0160
F 6.887
P 0.0002
Given these observations with respect to session length and "intelligence" time, we see no reason to conclude that learning effects introduce a bias.
4.2 Decision quality: process
We operationalized the quality of the decision process in terms of three dependent variables: the number of cards consulted, the number of regression plots being made, and the number of times key decision variables have been changed.
As can be seen in the fIrst section of Table 4, audio groups on average consult the least number of cards, whereas (initially) face-to-face groups consult the highest number of cards. Although this would seem to confIrm the anticipated effect of medium richness, analysis of variance shows that the differences are not signifIcant even at the 0.1 level.

Communication technology on group decision making 75
Table 4 Statistics on number of cards consulted Summa2, Groul!,s n Sum Mean Variance Audio 30 1120 37.3 167.5 Video 34 1393 41.0 271.7 Face-to-face 32 1315 41.1 208.4 Changin~ 34 1526 44.9 335.9
Analysis of variance Source Sum of sq. df Mean sq. F p
Among groups 911. 7 3 303.9 1.221 0.305 Within groups 31367.9 126 249.0 Total 32279.6 129
Table 5 shows the observations with respect to the number of regression plots made: again the audio groups score lowest, but this time the video groups show the highest average. Analysis of variance reveals this differences to be statistically significant at the 0.05 level.
TableS Statistics on number of regression plots Summa2, Groul!,s n Sum Mean Variance Audio 30 98 3.27 7.72 Video 34 193 5.68 13.38 Face-to-face 32 120 3.75 8.13 Changing 34 166 4.88 13.07
Anallsis at. variance Source Sum 0Ls!/.. dL Means!/.. F P Among groups 115.2 3 38.4 3.586 0.016 Within groups 1348.8 126 10.7 Total 1464.0 129
Table 6 shows again a different picture: the differences between the three conditions with respect to the average number of changes made in key decision variables are quite marginal and not significant.
Table 6 Statistics on number of decision variable changes Summa2, Groul!,s n Sum Mean Variance Audio 30 158 5.27 4.13 Video 34 171 5.03 3.24 Face-to-face 32 180 5.63 2.89 Changin~ 34 177 5.21 6.74

76 Part B Full Papers
Analysis of variance Source Sum of sq. df Mean sq. F P Among groups 6.1 3 2.045 0.509 0.677 Within groups 505.9 126 4.015 Total 512.0 129
4.4 Decision qUality: outcome
We have two indicators for the outcome of the decision: profit and market share. There were considerable differences in the total profits in each the four markets during the experiments. Taking the absolute profit value would give low-performance firms on a high-profit market an advantage above high-performance firms on low-profit markets. We therefore use a relative profit score in our analysis: the position relative to the highest and lowest profit score on the market. Best performing firms thus score 100, worst performing firms score O. As can be seen in Table 7, the differences in profit scores between conditions are not significant.
Table 7 Statistics on profit scores Summa'.:l., Grou2,s n Sum Mean Variance Audio 30 1377.3 45.9 2009.9 Video 34 2080.9 61.2 1393.5 Face-to-face 32 1774.4 55.4 1530.3 Changing 34 1706.1 50.2 1772.0
Anal~sis ot. variance Source Sum ots9.; dt. Means9.; F P
Among groups 4240.0 3 1413.3 0.847 0.471 Within groups 210186.2 126 1668.1 Total 214426.2 129
Table 8 shows a similar picture for market shares: again the video groups have the highest mean, but again the differences between groups are not significant. Note that the profit scores show a high variance. This is partly due to the scaling we applied. Although we cannot say that the two indicators are inconsistent, we consider market share to be the better performance indicator.
TableS Statistics on market shares Summa'.:l., Grou2,s n Sum Mean Variance Audio 30 540.2 18.0 37.9 Video 34 679.6 20.0 101.9 Face-to-face 32 525.5 16.4 20.3 Chan~in~ 34 652.1 19.2 41.4

Communication technology on group decision making 77
Analysis of variance Source Sum of sq. df Mean sq. F p
Among groups 236.0 3 78.7 1.536 0.209 Within groups 6456.5 126 51.2 Total 6692.5 129
4.5 Other observations during the experiment
Although the focus of this paper is on measuring group decision making performance, several other aspects have been measured systematically in the course of the experiment, for example the way subjects experienced different settings and perceived the quality of their decision making. We will not discuss these aspects here in detail, but summarize the observations by Van der Velden (1995) to add perspective to the observations with respect to performance.
Questionnaires filled out after each round by the subjects showed that - though all settings were rated as adequate for both task performance and group development - the face-to-face setting was perceived as most suitable for the task, and the audio-conferencing setting as least suitable. As more rounds were played, these differences in rating decreased. The shared screen facility was evaluated very positively by all groups. Also, all groups rated their motivation and group performance as high.
Analysis of a representative sample from the video recordings of the sessions revealed no differences in style of collaboration for groups that alternate face-to-face meetings with distributed meetings. Groups in the audio and the video condition showed more task-oriented behavior, and the social climate in the audio groups was less friendly than in the other conditions. These effects became stronger with time.
5 DISCUSSION AND CONCLUSION
The fmdings reported in the previous section seem to carry a single message: The experiment shows no significant impact of communication media on group decision making performance. None of the hypotheses H1.1 through H2.2 as formulated in section 3.3 is supported by our observations. The lack of impact may be explained by adaptation: the phenomenon that groups will develop styles of interaction behavior that compensate for the constraints imposed by communication media, thereby nullifying potential effects on task performance (McGrath and Kelley 1986). Face-to-face groups tend to be more "lively", which may explain the observed tendency of face-to-face groups to consult more cards, make more regression plots and spend some more time discussing and changing decision cards. Mediated groups, having less freedom of interaction, tend to be more "serious".
The question remains whether the experiment we described in this paper is appropriate for generalizing the conclusion that communication technology does not impact group decision making performance. We think that at least some mitigating comments are in order.
First, we must consider the decision making task that was studied in the experiment. Measuring decision making performance remains a tricky issue. In particular, correlation between indicators for the quality of the decision process and those for the quality of decision outcome is low (see Table 9).

78 Part B Full Papers
Table 9 Correlations between decision quality indicators
Variables A. #cards B. # decision changes C. # regression plots
Profit score 0.13 0.18
-0.22
Market share 0.34 0.25
-0.23
Secondly, it may be that in the artificial decision making context used in the experiment, the subjects rapidly develop what Rasmussen (1982) defines as problem solving at the rule-based level. This would mean that the results may not be generalized to problem solving at the knowledge-based level, i.e., decision making in unique, unfamiliar situations for which actions must be planned from an analysis and decision based on knowledge of the functional, physical properties of the system and of the various goals. Although the study was intended to measure the impact of communication technologies on group decision making in equivocal situations, it is questionable whether such conditions have indeed been achieved.
Although each of these considerations cautions us not to jump to optimistic conclusions regarding the feasibility of international offices of the future, the fact remains that in the situation as studied, students seriously working on a non-trivial excercise using "leaner" communication media showed no degradation in task performance. If anything, it is an intriguing indication that makes us look forward to seeing more empirical findings in this area.
Acknowledgments The authors wish to thank Erik Andriessen, Jelle Atema, Henk Sol and Jeroen van der Velde for their respective contributions to this research.
6 REFERENCES
Adams, D.A, Todd, P.A., and Nelson, R.R. (1993) A comparative evaluation of the impact of electronic and voice mail on organizational communication. Information & Management, 24(1).
Bots, P.W.G., Glasson, B.C., Vogel, D.R., eds. (1995) The International Office of the Future: A Problem Analysis, Technische Bestuurskunde, Delft University of Technology, Delft, The Netherlands. URL: http://www.sepa.tudelft.nlI-afd_sk/pb_iofapahtml.
Bots, P.W.G, Van Schaik, F.D.J. and Sol, H.G. (1989) A gaming environment for testing decision support systems. Proceedings of the third European Simulation Congress, Edinburgh, Scotland.
Canning McNurlin, B. (1989) Experiences with work group computing. IS/Analyzer. Chappell, D.A., Vogel, D.R. and Roberts, E.E. (1992) The MIRROR project: A virtual meeting
place. Proceedings of the 25th Hawaii International Conference on System Sciences (eds. IF. Nunamaker and R.H. Sprague), volume IV.
Chernoff, H. (1973) Using faces to represent points in k-dimensional space graphically. Journal of the American Statistical Society, 68, 361-368.
Daft, R.L. and Lengel, R.H. (1986) Organizational Information Requirements, Media Richness and Structural Design. Management Science, 32(5), 554--:571.
Daft, R.L., Lengel, R.H., Trevino, L.K. (1987), Message equivocality, media selection, and manager performance: implications for information systems. MIS Quarterly, 11, 355-366.

Communication technology on group decision making 79
Dennis, A.R., George, J.F., Jessup, L.M., Nunamaker, J.F., Vogel, D.R. (1988) Information technology to support electronic meetings. MIS Quarterly, 12, 591-624
DeSanctis, G., Gallupe, R.B. (1987) A Foundation for the Study of Group Decision Support Systems. Management Science, 33(5),589-609.
EI-Shinnawy, M.M., Markus, M.L. (1992) Media richness theory and new electronic communication media: a study of voice mail and electronic mail. Proceedings of ICIS'92, Dallas, USA.
Fowler, G., Wackerbarth, M. (1988) Audio Teleconferencing versus Face-to-Face Conferencing: A synthesis of the Literature. Western Journal of Speech Communication, 44, 236-252.
Galbraith, J.R. (1977) Organization Design: An information processing view, Addison-Wesley, New York.
Janis, I.L., Mann, L. (1977) Decision Making, The Free Press, New York. Kinney, S.T., Watson, R.T. (1992), The effect of medium and task on dyadic communication,
Proceedings of ICIS'92, Dallas, USA, 107-117. Korhonen, P. (1991) Using harmonious houses for visual pairwise comparison of multiple criteria
alternatives, Decision Support Systems, 7, 47-54. Kotteman, J.E., Remus, W.E. (1991) The effects of decision support systems on performance.
Environments for Supporting Decision Processes (eds. Sol, H.G., Vecsenyi, J.), North-Holland, Amsterdam.
McCarthy, J., Miles, V., Monk, A., Harrison, M., Dix, A., Wright, P. (1991) Four generic communication tasks which must be supported in electronic conferencing. SIGCHI Bulletin, January 1991.
McGrath, J.E., Kelley, J.R. (1986) Time and human interaction: towards a social psychology of time. Guildford, New York.
McGrath, J.E., Hollingshead, A.B. (1994) Groups interacting with technology. Sage library of social research,194.
Oz, E., Fedorowicz, J., Stapleton, T. (1993) Improving quality, speed and confidence in decision making. Measuring expert system benefits. Information Management, 24, 71-82.
Rasmussen, J. (1982) Human errors. A taxonomy for describing human malfunction in industrial installations, Journal of Occupational Accidents, 4.
Rice, R.R. (1984) The new media: Communication Research and Technology. Sage, Beverly Hills, CA.
Sheffield, J. (1995) The Effect of Communication Medium on Negotiation Performance. Group Decision and Negotiation, 4(2),159-179.
Van Schaik, F.D.J. (1988) Effectiveness of decision support systems, Delft University Press, Delft, the Netherlands.
Van der Velden, J.M. (1995) Samenwerken op afstand, Delft University Press, Delft, the Netherlands (in Dutch).
Weick, K.E. (1979) The social psychology of organizing, Addison-Wesley, Reading, MA.
7 BIOGRAPHY
Pieter Bots is associate professor at the School of Systems Engineering, Policy Analysis and ManageIrent of Delft University of Technology, the Netherlands. He has a Master's degree in Computer Science from the University of Leiden and a Ph.D. in Information Systems from Delft University of Technology. His main research interest lies in the analysis and design of policy and decision making processes and supporting information systems in both public and private organizations.

80 Part B Full Papers
Robert Jan Streng is consultant with BSO-ORIGIN Consultancy in Utrecht, the Netherlands. He has a Master's degree in Computer Science and a Ph.D. in Information System;, both from Delft University of Technology. His expertise lies in business process reengineering, EDI and interorganizational information system;.