Measuring the Extent and EVELOPMENT Implications of ... · In this sense the Showa Financial Crisis...
33
ADB INSTITUTE RESEARCH PAPER 39 Tetsuji Okazaki and Kazuki Yokoyama July 2002 ADB INSTITUTE TOKYO ASIAN DEVELOPMENT BANK INSTITUTE ASIAN DEVELOPMENT BANK INSTITUTE Just before Japan’s financial crisis of 1927, nearly 90 percent of ordinary banks were connected to non-banking companies through the interlocking of their directors and auditors. Moreover, such interlocking was more pervasive in the large-sized banks. In many cases, interlocking of directors and auditors resulted from the fact that the banks and non-banking companies were owned by the same large shareholders. This finding is consistent with the accepted “organ bank” hypothesis which asserts that (i) banks were organically connected with industrial companies and so freely extended to them unsafe loans which went bad; and (ii) minority shareholders and depositors of such organ banks were therefore exploited by the core members of the corporate group, composed of the bank and industrial companies. The lessons from this important episode are particularly relevant to contemporary governance issues in Asian and other economies. Measuring the Extent and Implications of Director Interlocking in the Pre-war Japanese Banking Industry
Transcript of Measuring the Extent and EVELOPMENT Implications of ... · In this sense the Showa Financial Crisis...

ADB INSTITUTE RESEARCH PAPER 39
Tetsuji Okazaki and Kazuki Yokoyama
July 2002
ADB INSTITUTETOKYO
ASIA
N D
EV
ELO
PM
EN
T BA
NK IN
ST
ITU
TE
ASIA
N D
EV
ELO
PM
EN
T BA
NK IN
ST
ITU
TE
Just before Japan’s financial crisis of 1927, nearly 90 percent of ordinary banks were connected to non-banking companies through the interlocking of their directors and auditors. Moreover, such interlocking was more pervasive in the large-sized banks. In many cases, interlocking of directors and auditors resulted from the fact that the banks and non-banking companies were owned by the same large shareholders.
This finding is consistent with the accepted “organ bank” hypothesis which asserts that (i) banks were organically connected with industrial companies and so freely extended to them unsafe loans which went bad; and (ii) minority shareholders and depositors of such organ banks were therefore exploited by the core members of the corporate group, composed of the bank and industrial companies. The lessons from this important episode are particularly relevant to contemporary governance issues in Asian and other economies.
Measuring the Extent and Implications of Director Interlocking in the Pre-war �Japanese Banking Industry
ADB Institute Research Paper Series
No. 39
July 2002
Measuring the Extent and Implicationsof Director Interlocking in the Pre-war
Japanese Banking Industry
Tetsuji Okazaki and Kazuki Yokoyama
II
ABOUT THE AUTHORS
Tetsuji Okazaki is Professor of Economics at the University of Tokyo and a founding memberof the ADB Institute�s Corporate Governance Experts Group. Together with his collaborator Kazuki Yokoyama, Prof. Okazaki has recently completed astudy on Goverance and Performance of Banks in Pre-war Japan: Testing the �Organ Bank�Hypothesis Quantitatively, (CIRJE Discussion Paper F-111, University of Tokyo, 2001).
ADB INSTITUTE RESEARCH PAPER 39
Additional copies of the paper are available free from the Asian Development Bank Institute, 8th Floor, KasumigasekiBuilding, 3-2-5 Kasumigaseki, Chiyoda-ku, Tokyo 100-6008, Japan. Attention: Publications. Also online at www.adbi.org
The Research Paper Series primarily disseminates selected work in progress to facilitate an exchange of ideas within the Institute's constituencies and the wider academic and policy communities. The findings, interpretations, and conclusions are the author�s own and are not necessarily endorsed by the Asian Development Bank Institute. They should not be attributed to the Asian Development Bank, its Boards, or any of its member countries. They are published under the responsibility of the Dean of the ADB Institute. The Institute does not guarantee the accuracy or reasonableness of the contents herein and accepts no responsibility whatsoever for any consequences of its use. The term �country�, as used in the context of the ADB, refers to a member of the ADB and does not imply any view on the part of the Institute as to sovereignty or independent status. Names of countries or economies mentioned in this series are chosen by the authors, in the exercise of their academic freedom, and the Institute is in no way responsible for such usage.
Copyright © 2002 Asian Development Bank Institute and the authors. All rights reserved. Produced by ADBIPublishing.

III
PREFACE
The ADB Institute aims to explore the most appropriate development paradigms for
Asia composed of well-balanced combinations of the roles of markets, institutions, and governments in the post-crisis period. Under this broad research project on development paradigms, the ADB Institute
Research Paper Series will contribute to disseminating works-in-progress as a building block of the project and will invite comments and questions. I trust that this series will provoke constructive discussions among policymakers as
well as researchers about where Asian economies should go from the last crisis and recovery.
Masaru Yoshitomi Dean
ADB Institute
IV
TABLE OF CONTENTS About the Authors II Preface III
Table of Contents IV
1. Introduction 1
2. A Brief History of the Pre-war Banking Industry 3
3. Interlocking between Banks and Non-banking Companies 6
4. The Influence of the Governance Structure on Bank Performance 18
5. Concluding Remarks 21 Figures and Table (in body of text)
Figure 1. Number of Banks 3 Figure 2. Composition of Bank Liabilities 4 Figure 3. Scale Distribution of the Ordinary Banks 6
Table 1. Coverage of Zenkoku Shogaisha Yakuninroku 8 Table 2. Basic Statistics of the Bank Performance 9 Table 3. Interlocking of Directors and Auditors between Banks and
Non-Banking Companies 10 a. All Directors and Auditors 10 b. Top Executives 10 c. Executive Directors 10 d. Ordinary Directors 10 e. Auditors 10
Table 4. Interlocking of Directors and Auditors between Banks and Non-Banking Companies by Scale of Banks 12
a. All Directors and Auditors 12 b. Top Executives 12 c. Executive Directors 13 d. Ordinary Directors 13 e. Auditors 14
Table 5. Interlocking and Investment of the Top Executives of the Selective Banks 16 Table 6. Estimation Results of Equation (1) 19 Table 7. Estimation Results of Equations (2)-(5) 20
Table 8. Estimation of the Risk Premium 20 Appendix Table 27
References 23 Appendix: Analysis of the List of Large Asset Holders 27
1
Measuring the Extent and Implications of Director Interlocking in the Pre-war Japanese Banking Industry�
Tetsuji Okazaki and Kazuki Yokoyama
1. Introduction
As a result of the Asian financial crisis of 1997, the issue of corporate governance has attracted the attention of researchers as well as policy authorities. Much of the literature on the Asian crisis focuses specifically on the exploitation of minority shareholders by core members of family-based companies (Claessens et al. (1998); Lang (2001)). We argue that family-based companies do not always exploit minority shareholders. Okazaki (1999) and Okazaki (2001) indicate that the companies affiliated to the major zaibatsu in pre-war Japan basically outperformed other companies in terms of ROE, using panel data of 1935 companies from 1922 to 1936. According to the book and paper, this was basically due to monitoring by the holding company through dispatching directors, checking financial records and so on. However, the existence of major zaibatsu such as Mitsui and Mitsubishi was only one aspect of the pre-war Japanese corporate system. In addition to the major zaibatsu, many small and medium-sized family-based corporate groups existed.
In relation to the non-zaibatsu business groups, it is widely accepted by economic historians that banks were organically connected with industrial companies. According to the accepted view, these �organ banks� (kikan ginko) freely loaned funds to affiliated companies, which turned out to be bad loans ex post. This problem of organ banks is considered to be the major cause of the Showa Financial Crisis of 1927, (Kato (1957); Yamazaki (2000); Teranishi (2000)).
If this accepted view, hereafter referred to as the organ bank hypothesis, is true, then the minority shareholders and depositors of the organ bank were exploited by the core members of the corporate group, composed of the bank and industrial companies. In this sense the Showa Financial Crisis of 1927 was a precursor of the Asian Financial Crisis of 1997. Investigating this organ bank hypothesis, which is the basic motivation of this paper, is important not only because it is relevant to contemporary governance issues in Asian economies, but also because it deals with the most fundamental hypothesis regarding pre-war Japanese financial history.
The concept of the �organ bank� was first emphasised by Kato (1957), who suggested that these banks were established in order to raise funds for the industrial
� This paper is a revised version of Okazaki and Yokoyama (2001). Financial support from the Asian Development Bank Institute (ADBI) is gratefully acknowledged. Professor Teranishi and Professor Korenaga kindly provided us with the data set they constructed for the Ministry of Finance (1928), and gave approval for us to use it for this paper. In addition, we would like to thank Dr. Chhikara, Dr. Chua, Dr. Fujiki, Professor Fujiwara, Professor Fukagawa, Professor Ikeo, Professor Kasuya, Professor Miyamoto, Dr. Montgomery, Professor Nam, Dr. Okina, Professor Saito, Professor M. Sato, Professor Y. Sato, Mr. Shizume, Professor Suehiro, Professor Tanimoto, Professor Woo-Cumings, Professor Watanabe, Dr. Yoshitomi and other participants at the seminars at ADBI, the University of Tokyo, the Bank of Japan, and the Financial Services Agency, and the Meeting of the Socio-Economic History Society and the Meeting of the Japan Society of Monetary Economics, for their helpful comments and suggestions.
2
businesses of the bank founders. Therefore the organ bank was not managed for the profit of the bank itself, but rather for the corporate group to which it belonged. Consequently, the organ bank tended to give large numbers of long-term loans to the small number of industrial companies connected with the bank founders (Sugiyama (1976); Murakami (1983)).
As mentioned above, the organ bank relationship has been regarded as a major cause of the Showa Financial Crisis. For example, just after the crisis, the Bank of Japan (BOJ) explained in a research report that the fundamental cause of the bankruptcy of the banks was the weakness of industrial organizations and the banking system. The BOJ particularly cited the unsound practices of banks. Bank directors participated in other businesses, and used the bank as an instrument to finance these ventures. In addition, because loan policy was based on personal connections, they gave large numbers of loans to certain persons or companies even when they lacked reliable collateral (Bank of Japan (1933), p.984). Takahashi and Morigaki (1968), one of the best known books on the Showa Financial Crisis, identified the organ bank relationship as a major cause of the crisis.
After Kato�s seminal work, research has progressed in two directions. The first involves case studies of the organ bank relationship. In the 1960s and 1970s the focus of this research was the function of the banks affiliated to the major zaibatsu. Kato (1957) argued that most banks in pre-war Japan, including those affiliated to the major zaibatsu, had the characteristics of organ banks. On the other hand, Shibagaki (1965) stressed that the zaibatsu-affiliated banks did not give substantial loans to the core companies in the same zaibatsu groups. Following the contributions of Imuta (1966) and Sugiyama (1976), a consensus has been reached that, apart from exceptional periods, the zaibatsu-affiliated banks were not organ banks in Kato�s sense (Murakami (1983)). With regard to non-zaibatsu banks, Imuta (1976), Ishii (1999) and Yamazaki (2000) examined the cases of several typical organ banks, based on the research by the BOJ and original documents.
The second research direction involves statistical analyses of bank performance. Imuta (1976b) classified banks into several groups by scale and location, and compared the basic financial indices across the groups. He found that the financial conditions of medium-sized banks in urban areas were relatively bad. They were characterized by high loan-deposit ratios, high borrowing-deposit ratios and so on. Teranishi (1982) reported similar results, using a more comprehensive data set. Yabushita and Inoue (1993) analysed the influence of bank performance on bank closures in 1927. Through a probit analysis of bank closures, they found that low equity-deposit ratios, high loan-deposit ratios and low ROEs increased the probability of bank closure.
Based on the above brief survey, we attempt in this paper to integrate the two clusters of research following Kato (1957). We begin by objectively measuring the extent of the connections between banks and non-banking companies. As explained in detail later, we have compiled a comprehensive database of directors and auditors in 1926, just before the Showa Financial Crisis. From it, we identify the extent of interlocking of directors and auditors, meaning when one individual holds multiple director or auditor positions in banks and non-banking companies. This is the first attempt to quantitatively measure the extent of bank-firm connections in pre-war Japan.
3
Next, using the data on interlocking, we examine the influence of the interlocking on bank performance, in order to test the organ bank hypothesis.
The paper is organized as follows. Section 2 briefly addresses the pre-war history of the Japanese banking industry. In section 3, we describe our database of directors and auditors as well as the findings derived from it. Section 4 is an econometric analysis of the influence of the interlocking of directors and auditors on bank performance. In section 5 we conclude the paper by discussing the implication of the paper to evolutionary dynamics of corporate governance and financial system in Japan.
2. A Brief History of the Pre-war Banking Industry
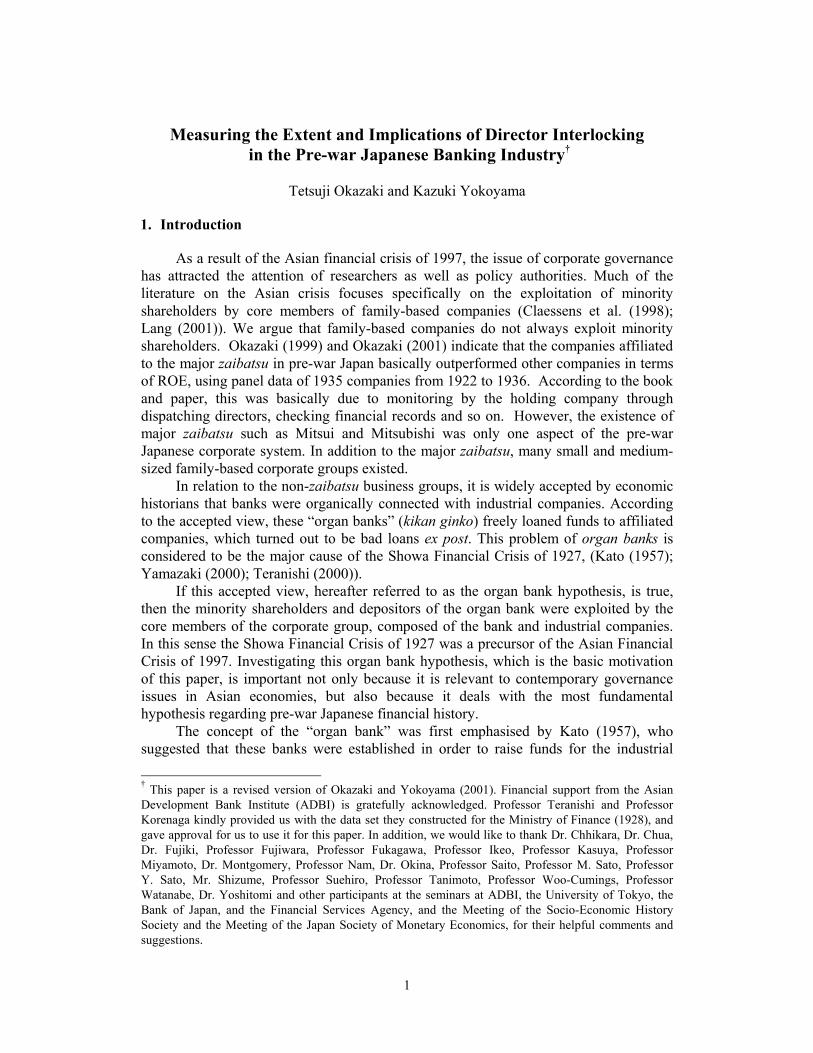
The modern history of the banking industry in Japan began in 1873 with the National Bank Act. The national banks were private banks that were granted the privilege to issue bank notes. After the revision of the Act in 1876, suspending the convertibility of national bank notes, the number of national banks rapidly increased to 153, the upper limit prescribed by the National Bank Act in 1879 (Figure 1). In 1882 the Bank of Japan (BOJ) was established as the central bank, resulting in a further revision of the National Bank Act that obliged national banks to become ordinary banks within twenty years of their establishment (Asakura (1988) pp.36-37; Teranishi (1982) pp.35-37).
Figure 1. Number of Banks
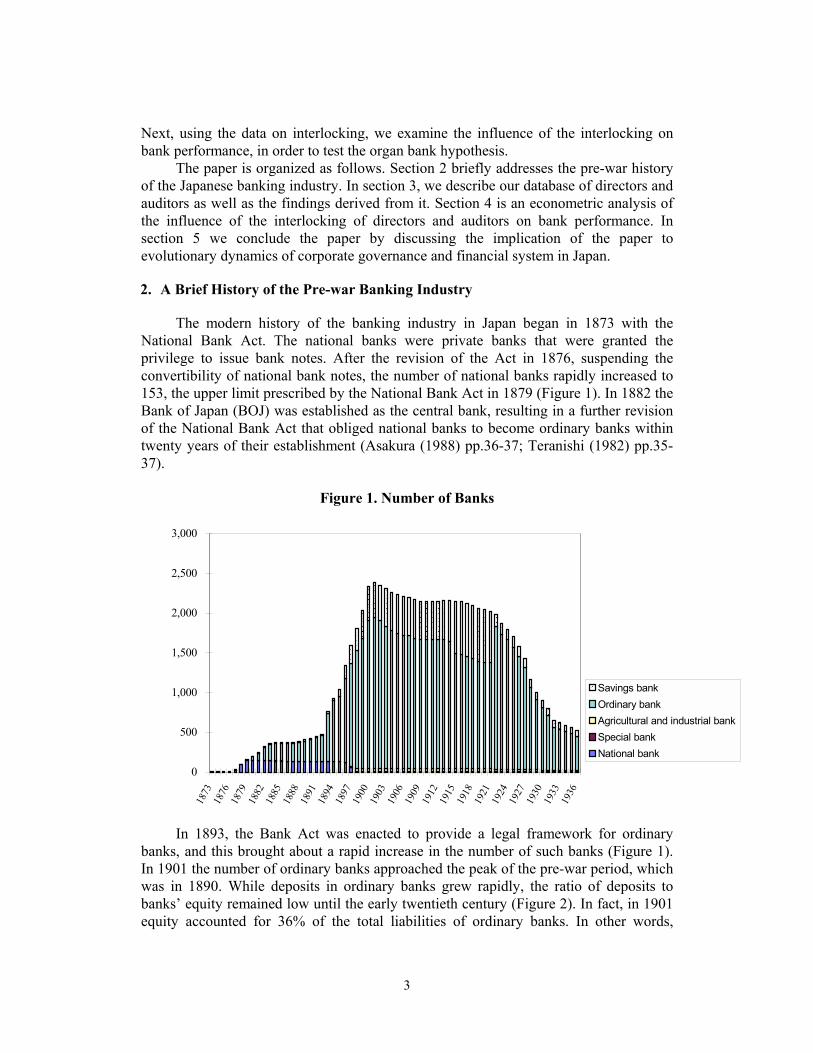
In 1893, the Bank Act was enacted to provide a legal framework for ordinary banks, and this brought about a rapid increase in the number of such banks (Figure 1). In 1901 the number of ordinary banks approached the peak of the pre-war period, which was in 1890. While deposits in ordinary banks grew rapidly, the ratio of deposits to banks� equity remained low until the early twentieth century (Figure 2). In fact, in 1901 equity accounted for 36% of the total liabilities of ordinary banks. In other words,
������
������ � ������ ������
�������
����
��
����
����
������
������
������
��������
��������
������
������
������
���
��������
������
��������
������
��������
��������
��������
��������
����������
����������
��������
��������
��������
����
�� ������������ ��
������
�� ������ �
���������
0
500
1,000
1,500
2,000
2,500
3,000
1873
1876
1879
1882
1885
1888
1891
1894
1897
1900
1903
1906
1909
1912
1915
1918
1921
1924
1927
1930
1933
1936
��������Savings bank
Ordinary bankAgricultural and industrial bankSpecial bankNational bank
4
Borrowings Equity Deposits Borrowings/liabilities Equity/liabilities Deposits/liabilities
lending their own funds was still a substantial part of ordinary banks� activities in those days, and in this sense their nature was substantially different from that of modern banks based on deposits.
The ratio of deposits increased remarkably in the 1900s due to a change in the BOJ�s policy. Until 1897, the BOJ gave loans freely to private banks. As a result, many ordinary banks depended heavily on its borrowings, and earned profits from the interest rate spread between borrowings from the BOJ and loans to private companies. In 1897 the BOJ began lending to non-banking companies and individuals in order to prevent the banks from earning profits from the interest rate spread (Bank of Japan (1983a) p.16). This policy change pushed ordinary banks to decrease their borrowings from the BOJ and to seriously seek deposits. At the same time, the number of ordinary banks began to decrease, with many falling into bankruptcy during the bank panics in 1901 and 1907.
In the 1910s, the First World War had a substantial influence on the banking industry as well as on the Japanese economy as a whole. In this period, deposits increased rapidly due to economic growth and an expansionary monetary policy. Consequently, the equity-liabilities ratios of the ordinary banks fell to less than 20% (Figure 2). In other words, the nature of the ordinary banks approached that of modern banks, based on deposits, at least in terms of the composition of liabilities.
Figure 2. Composition of Bank Liabilities
0
2,000
4,000
6,000
8,000
10,000
12,000
14,000
1895
1897
1899
1901
1903
1905
1907
1909
1911
1913
1915
1917
1919
1921
1923
1925
1927
1929
1931
1933
1935
0
10
20
30
40
50
60
70
80
90%million Million yen

5
On the other hand, during the war boom, many ordinary banks loaned large amounts to companies that were expanding rapidly, especially heavy industries and the chemical industry. In many cases, those companies faced difficulties when the First World War ended and international competition was revived, which, in turn meant that the bank loans became bad credit. Because, as mentioned above, the equity-liabilities ratio of banks had decreased in the 1910s, the deterioration of their assets seriously damaged their financial conditions; this was the root cause of the instability of the financial market in the 1920s.
During the bank panic of 1920 many banks, especially small-sized ones, were closed down. In order to secure stability in the financial market, the government initiated a reform of the industrial organization of the banking industry in the early 1920s by imposing regulations upon entry, and promoting mergers (Goto (1991) p.19; Okazaki (2001)). However, the great earthquake in Tokyo in 1923 further destabilized the financial market. As a result of the earthquake and the ensuing fires, large numbers of the assets that were collateral for bank loans, or were expected to produce cash flows to repay the loans, were either destroyed or burnt down.
In 1926 the government decided to take fundamental measures to restructure the financial system, proposing two draft laws to dispose of the bad loans. However, the National Diet opposed these bills on the ground that they favoured capitalists connected to the government. In the Diet deliberations, the Minister of Finance made a notorious slip of the tongue concerning the closure of certain banks, triggering the financial crisis of 1927.
The Showa Financial Crisis was the largest in the financial history of Japan. Forty-five banks closed due to bank runs. They made up 2.91% of the total number of ordinary and savings banks, and accounted for 9.02% of total deposits. Among them was Jugo Bank, one of the top ten banks, which had transactions with the Imperial Family. Another casualty was Taiwan Bank, the special bank set up for developing Taiwan [sic], and which acted as its central bank. The magnitude of the financial crisis can be measured by the shift of deposits from banks to the postal bureau savings system. In 1927, while the total outstanding deposits of all banks decreased, postal deposits increased by 30.1% (Toyo Keizai Shinposha (1991) p.365, p.401).
In 1928, following the Crisis, the Bank Law was enacted, compelling ordinary banks to be joint-stock companies and to hold more than one million yen in capital.1 Existing banks whose capital was under the lower limit�unqualified banks�were obliged to clear it within seven years. At the same time, ordinary banks were prohibited from conducting businesses other than those relating to banking. In addition, the executive directors and managers of ordinary banks were prohibited from engaging in other businesses. The restrictions on subsidiary businesses of banks and their executive directors and managers reflected the government�s recognition that the organ bank relationship was the basic cause of the unsound financial system.
1 Bank capital was required to be two million yen in Tokyo and Osaka, and 500,000 yen in towns and villages with a population smaller than ten thousand.
6
3. Interlocking between Banks and Non-banking Companies
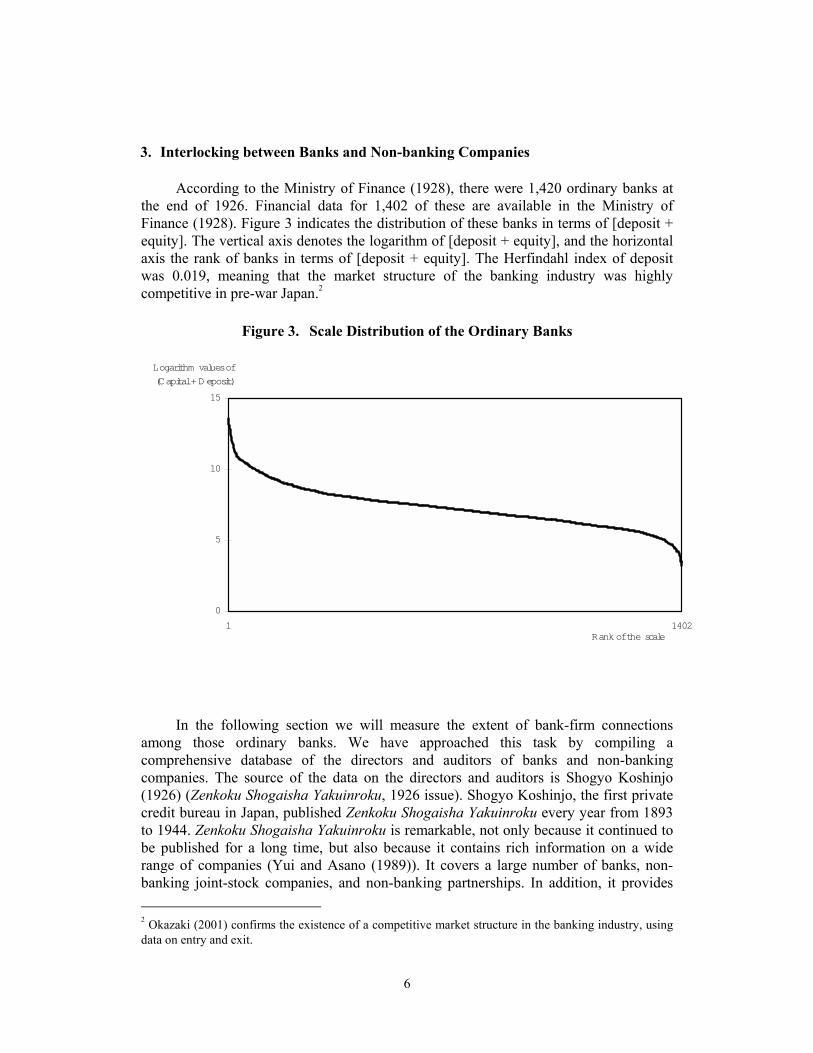
According to the Ministry of Finance (1928), there were 1,420 ordinary banks at the end of 1926. Financial data for 1,402 of these are available in the Ministry of Finance (1928). Figure 3 indicates the distribution of these banks in terms of [deposit + equity]. The vertical axis denotes the logarithm of [deposit + equity], and the horizontal axis the rank of banks in terms of [deposit + equity]. The Herfindahl index of deposit was 0.019, meaning that the market structure of the banking industry was highly competitive in pre-war Japan.2
Figure 3. Scale Distribution of the Ordinary Banks
In the following section we will measure the extent of bank-firm connections
among those ordinary banks. We have approached this task by compiling a comprehensive database of the directors and auditors of banks and non-banking companies. The source of the data on the directors and auditors is Shogyo Koshinjo (1926) (Zenkoku Shogaisha Yakuinroku, 1926 issue). Shogyo Koshinjo, the first private credit bureau in Japan, published Zenkoku Shogaisha Yakuinroku every year from 1893 to 1944. Zenkoku Shogaisha Yakuinroku is remarkable, not only because it continued to be published for a long time, but also because it contains rich information on a wide range of companies (Yui and Asano (1989)). It covers a large number of banks, non-banking joint-stock companies, and non-banking partnerships. In addition, it provides 2 Okazaki (2001) confirms the existence of a competitive market structure in the banking industry, using data on entry and exit.
0
5
10
15
1 1402Rank of the scale
Logarithm values of
(Capital + D eposit)

7
information on company names, year of establishment, capital, and names and addresses of the directors, auditors and major employees.
Several previous studies have extensively utilized Zenkoku Shogaisha Yakuinroku. Wada, Kobayakawa and Shiomi (1992a), (1992b), (1993), and Kobayakawa, Suzuki and Wada (1999a), (1999b), compiled databases of directors based on the 1898, 1907 and 1918 issues to identify the networks of directors and investors. Using the database of Kobayakawa, Suzuki and Wada (1999a), Miwa and Ramseyer (2000) analysed the monitoring function of the �prominent directors�, namely those who held posts as directors in multiple companies, focusing on the case of the cotton spinning industry in the late nineteenth century.
However, in this paper we focus on the interlocking connections of directors and auditors between banks and non-banking companies. In addition to identifying these connections, we examine the influence of this interlocking on bank performance. Since our primary motivation is to test the organ bank hypothesis, we have selected as our object year 1926, as it was just before the Showa Financial Crisis, which is supposed to have been caused by the organ bank relationship. For this purpose, we newly compiled a database of directors and the auditors, based on the 1926 issue of Zenkoku Shogaisha Yakuinroku.
There are data for 16,558 companies, including banks, in Shogyo Koshinjo (1926). Of these companies, 15,060 were located in the present territory of Japan and the remaining 1,498 were located in Karafuto (present-day Sakhalin), Taiwan (present-day Taipei,China), Korea, Manchuria and other areas. Out of the 15,060 companies in Japan�s present territory, 1,427 were banks, 11,578 were non-banking joint-stock companies, and 2,055 were non-banking partnerships. We can check the completeness of the coverage of Shogyo Kishinjo (1926) by comparing the above number of observations with the number of companies registered in the Ministry of Industry and Commerce (1928) (Kaisha Tokeihyo, 1926 issue). Kaisha Tokeihyo consists of corporate statistics edited by the Ministry of Industry and Commerce, based on a census survey.
According to the Ministry of Industry and Commerce (1928), there were 36,068 companies, including banks, in Japan at the end of 1926 (Table 1). 1,506 of them were banks, 16,251 non-banking joint-stock companies, and 18,311 non-banking partnerships. Therefore, the coverage ratio of Shogyo Koshinjo (1926) is 41.8% (15,060/36,068) in terms of the total number of companies. The coverage ratios for banks and non-banking joint-stock companies are as high as 94.8% and 71.2% respectively. On the other hand, the coverage ratio for non-banking partnership companies is only 11.2%. The low coverage ratio of non-banking partnership companies is a weakness of Shogyo Koshinjo (1926), especially for research on family-based companies. However, according to the Ministry of Industry and Commerce (1928), in terms of capital, the share of non-banking partnership companies was only 10.4% of the total, which may mitigate the weakness.
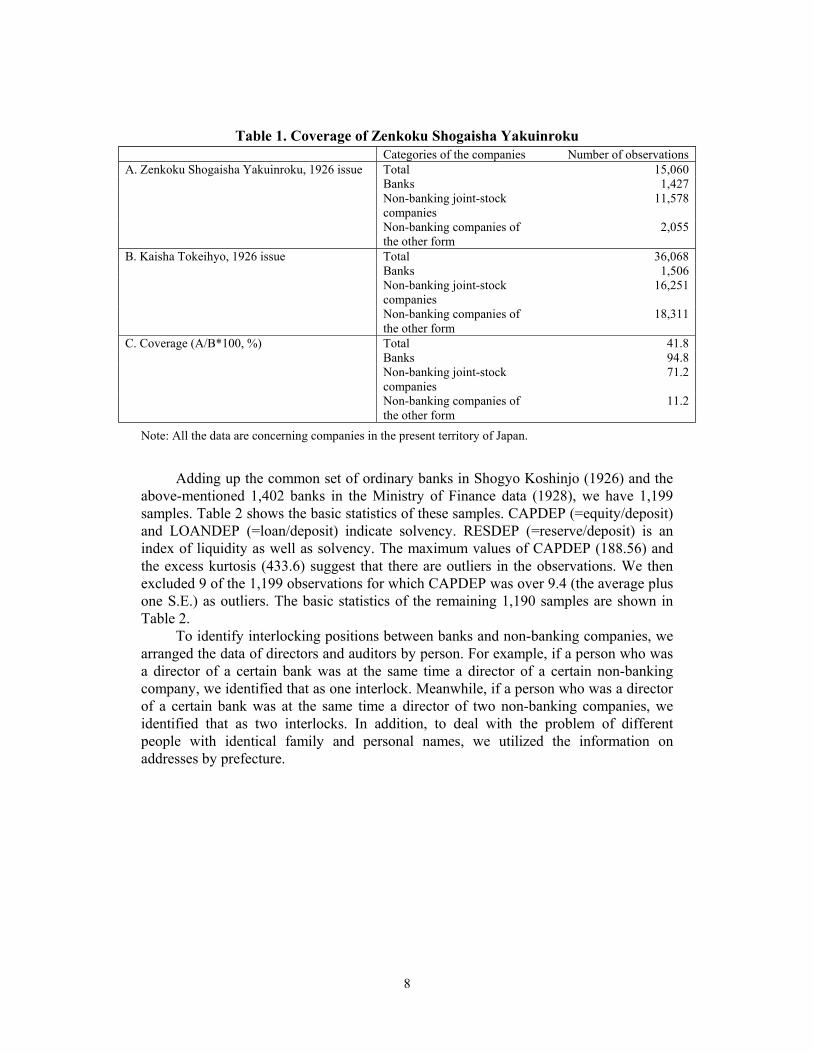
8
Table 1. Coverage of Zenkoku Shogaisha Yakuinroku Categories of the companies Number of observations A. Zenkoku Shogaisha Yakuinroku, 1926 issue Total 15,060 Banks 1,427 Non-banking joint-stock
companies 11,578
Non-banking companies of the other form
2,055
B. Kaisha Tokeihyo, 1926 issue Total 36,068 Banks 1,506 Non-banking joint-stock
companies 16,251
Non-banking companies of the other form
18,311
C. Coverage (A/B*100, %) Total 41.8 Banks 94.8 Non-banking joint-stock
companies 71.2
Non-banking companies of the other form
11.2
Note: All the data are concerning companies in the present territory of Japan.
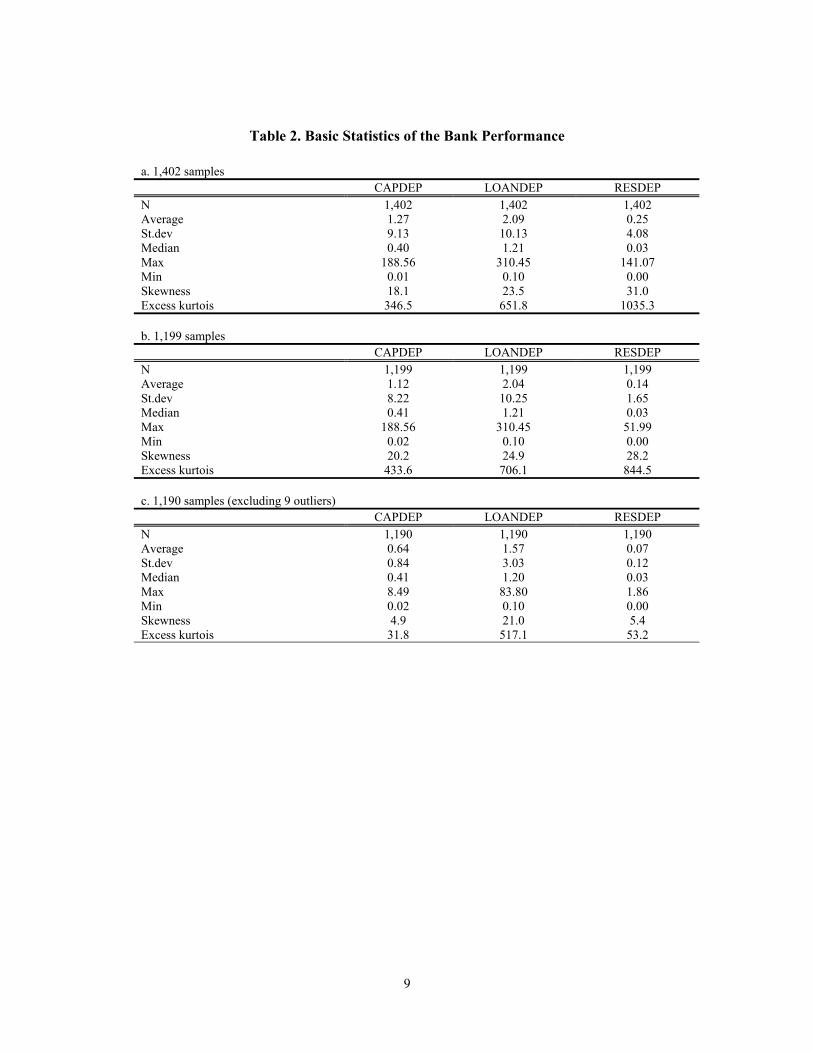
Adding up the common set of ordinary banks in Shogyo Koshinjo (1926) and the above-mentioned 1,402 banks in the Ministry of Finance data (1928), we have 1,199 samples. Table 2 shows the basic statistics of these samples. CAPDEP (=equity/deposit) and LOANDEP (=loan/deposit) indicate solvency. RESDEP (=reserve/deposit) is an index of liquidity as well as solvency. The maximum values of CAPDEP (188.56) and the excess kurtosis (433.6) suggest that there are outliers in the observations. We then excluded 9 of the 1,199 observations for which CAPDEP was over 9.4 (the average plus one S.E.) as outliers. The basic statistics of the remaining 1,190 samples are shown in Table 2.
To identify interlocking positions between banks and non-banking companies, we arranged the data of directors and auditors by person. For example, if a person who was a director of a certain bank was at the same time a director of a certain non-banking company, we identified that as one interlock. Meanwhile, if a person who was a director of a certain bank was at the same time a director of two non-banking companies, we identified that as two interlocks. In addition, to deal with the problem of different people with identical family and personal names, we utilized the information on addresses by prefecture.
9
Table 2. Basic Statistics of the Bank Performance
a. 1,402 samples CAPDEP LOANDEP RESDEP
N 1,402 1,402 1,402 Average 1.27 2.09 0.25 St.dev 9.13 10.13 4.08 Median 0.40 1.21 0.03 Max 188.56 310.45 141.07 Min 0.01 0.10 0.00 Skewness 18.1 23.5 31.0 Excess kurtois 346.5 651.8 1035.3 b. 1,199 samples CAPDEP LOANDEP RESDEP N 1,199 1,199 1,199 Average 1.12 2.04 0.14 St.dev 8.22 10.25 1.65 Median 0.41 1.21 0.03 Max 188.56 310.45 51.99 Min 0.02 0.10 0.00 Skewness 20.2 24.9 28.2 Excess kurtois 433.6 706.1 844.5 c. 1,190 samples (excluding 9 outliers) CAPDEP LOANDEP RESDEP N 1,190 1,190 1,190 Average 0.64 1.57 0.07 St.dev 0.84 3.03 0.12 Median 0.41 1.20 0.03 Max 8.49 83.80 1.86 Min 0.02 0.10 0.00 Skewness 4.9 21.0 5.4 Excess kurtois 31.8 517.1 53.2
10
a. All Directors and Auditors of 1,190 banks
Positions in the non-banking companies
Number of banks with interlocking
Ratio to all observations
Number of cases of interlocking Average per bank
Total 1,030 86.6 9,280 7.80Top executives 549 46.1 1,322 1.11Executive directors 185 15.5 249 0.21Ordinary directors 930 78.2 5,150 4.33Auditors 785 66.0 2,424 2.04
b. Top Executives of 1,190 banks
Positions in the non-banking companies
Number of banks with interlocking
Ratio to all observations
Number of cases of interlocking Average per bank
Total 515 43.3 2,496 2.10Top executives 202 17.0 318 0.27Executive directors 28 2.4 33 0.03Ordinary directors 377 31.7 862 0.72Auditors 220 18.5 341 0.29
c. Executive Directors of 1,190 banks
Positions in the non-banking companies
Number of banks with interlocking
Ratio to all observations
Number of cases of interlocking Average per bank
Total 253 21.3 722 0.61Top executives 50 4.2 65 0.05Executive directors 29 2.4 33 0.03Ordinary directors 178 15.0 372 0.31Auditors 136 11.4 224 0.19
d. Ordinary Directors of 1,190 banks
Positions in the non-banking companies
Number of banks with interlocking
Ratio to all observations
Number of cases of interlocking Average per bank
Total 853 71.7 4,499 3.78Top executives 346 29.1 636 0.53Executive directors 89 7.5 109 0.09Ordinary directors 730 61.4 2,601 2.19Auditors 518 43.6 1,090 0.92
e. Auditors of 1,190 banks
Positions in the non-banking companies
Number of banks with interlocking
Ratio to all observations
Number of cases of interlocking Average per bank
Total 673 56.6 1,562 1.31Top executives 184 15.5 302 0.25Executive directors 64 5.4 73 0.06Ordinary directors 526 44.2 1,304 1.10Auditors 406 34.1 759 0.64
Table 3. Interlocking of Directors and Auditors between Banks and Non-Banking Companies

11
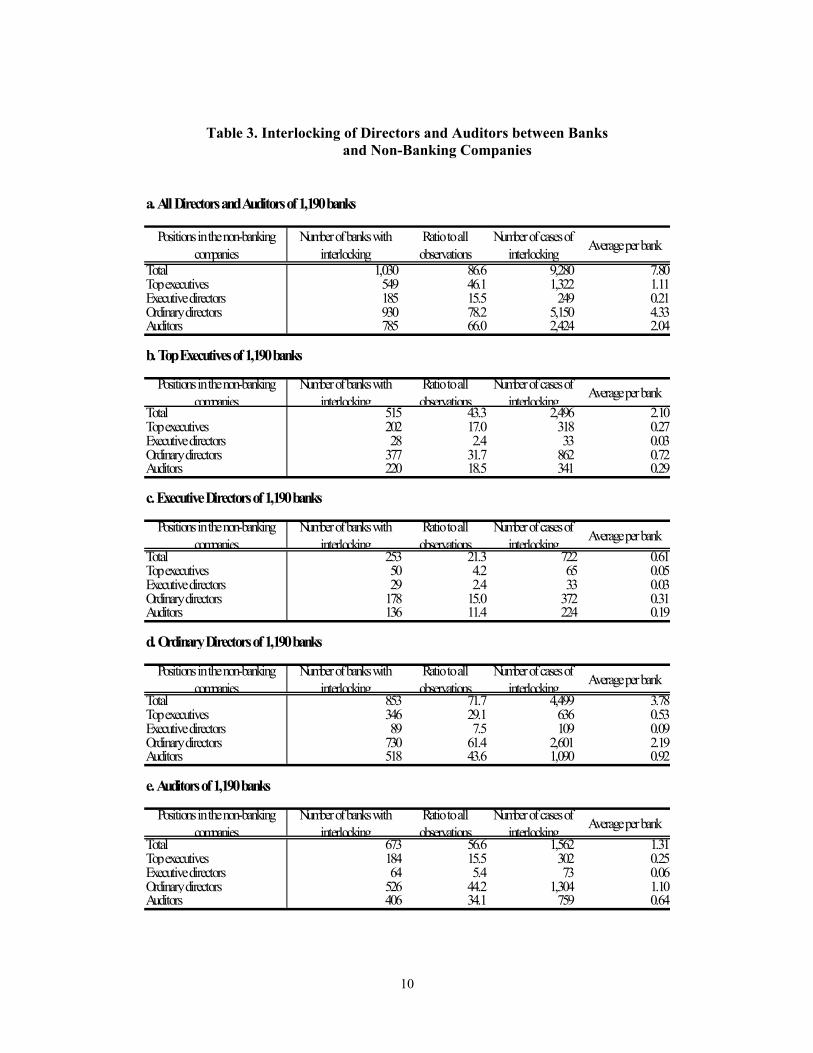
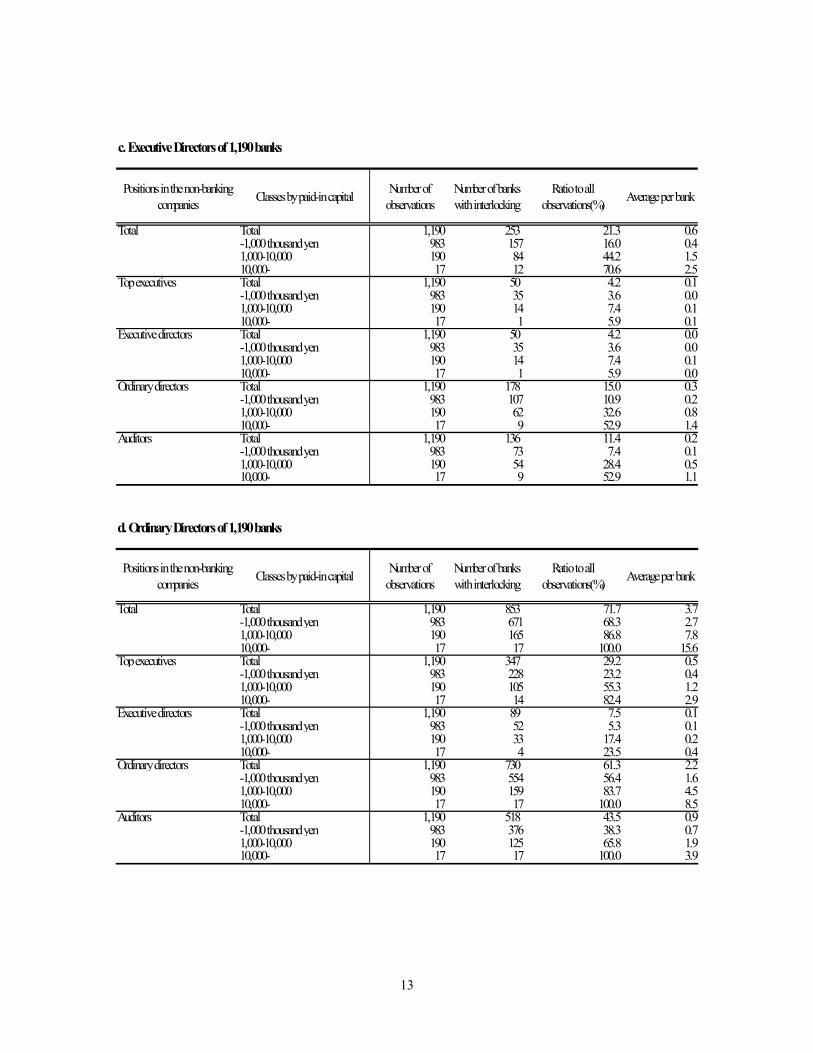
Table 3-a summarizes the results. As many as 1,030 banks, or 86.6% of the total observations, had directors or auditors who held posts as directors or auditors in non-banking companies.3 Further, the average number of interlocking positions per bank was 7.80. Table 3-a shows the data broken down by position in the non-banking companies. We classified the positions of directors and auditors into four categories, namely (1) top executives (president, chairman, etc), (2) executive directors, (3) ordinary directors, and (4) auditors.4 For example, those banks in which at least one director or auditor had the post of top executive of a non-banking company numbered 549, or 46.1% of the total observations.
Tables 3-b, 3-c, 3-d, and 3-e show the data broken down by the position in the bank. In 43.3% of the observations, the top executives of the banks held positions as directors or auditors of non-banking companies, and the average number of interlocks of the banks� top executives was 2.11. Meanwhile, the percentage of banks in which at least one ordinary director had a position as director or auditor of a non-banking company was 71.7%, and the average number of interlocks of the banks� executive directors was 3.78. From these results, we can safely say that most of the ordinary banks were connected with non-banking companies through the interlocking of directors and auditors.
Table 4 is a breakdown of Table 3 by the scale of banks. We split our 1,190 observations into three groups in terms of paid in capital following Teranishi (1982). The first point to be stressed is that the interlocking of directors and auditors with non-banking companies was pervasive across the three groups. At the same time, in relative terms, interlocking with non-banking companies was more pervasive among the large-sized banks. The percentage of banks with interlocking positions, as well as the average number of interlocks, was largest in the large-sized banking group. The situation is the same when we break down the data by position in the non-banking companies. In any sub-category of the data, both the percentage of banks with interlocking positions and the average number of interlocks were largest in the large-sized group (Table 4-a). In addition, when we break down the data by position in the bank, the situation is almost the same (Table 4-b, 4-c, 4-d, 4-e).
3 If we use the data of Shibuya et al. (1983), the ratio is 58.8%. See the Appendix. 4 Some companies did not have a president or a chairman. In this case, we identified the executive director as the top executive.

12
a. All Directors and Auditors of 1,190 banks
Positions in the non-banking companies Classes by paid-in capital Number of
observationsNumber of banks with interlocking
Ratio to all observations(%) Average per bank
Total Total 1,190 1,030 86.6 7.7-1,000 thousand yen 983 831 84.5 5.51,000-10,000 190 182 95.8 16.510,000- 17 17 100.0 34.6
Top executives Total 1,190 549 46.1 1.1-1,000 thousand yen 983 382 38.9 0.81,000-10,000 190 150 78.9 2.510,000- 17 17 100.0 5.8
Executive directors Total 1,190 185 15.5 0.2-1,000 thousand yen 983 117 11.9 0.11,000-10,000 190 60 31.6 0.510,000- 17 8 47.1 0.9
Ordinary directors Total 1,190 930 78.2 4.3-1,000 thousand yen 983 732 74.5 3.21,000-10,000 190 181 95.3 9.210,000- 17 17 100.0 17.9
Auditors Total 1,190 785 66.0 2.0-1,000 thousand yen 983 599 60.9 1.41,000-10,000 190 169 88.9 4.410,000- 17 17 100.0 10.0
b. Top Executives of 1,190 banks
Positions in the non-banking companies Classes by paid-in capital Number of
observationsNumber of banks with interlocking
Ratio to all observations(%) Average per bank
Total Total 1,190 515 43.3 1.3-1,000 thousand yen 983 380 38.7 1.01,000-10,000 190 120 63.2 2.710,000- 17 15 88.2 5.1
Top executives Total 1,190 202 17.0 0.3-1,000 thousand yen 983 132 13.4 0.21,000-10,000 190 59 31.1 0.610,000- 17 11 64.7 1.2
Executive directors Total 1,190 28 2.4 0.0-1,000 thousand yen 983 20 2.0 0.01,000-10,000 190 6 3.2 0.010,000- 17 2 11.8 0.1
Ordinary directors Total 1,190 377 31.7 0.7-1,000 thousand yen 983 271 27.6 0.51,000-10,000 190 94 49.5 1.510,000- 17 12 70.6 2.4
Auditors Total 1,190 407 34.2 0.3-1,000 thousand yen 983 335 34.1 0.21,000-10,000 190 63 33.2 0.610,000- 17 9 52.9 1.4
Table 4. Interlocking of Directors and Auditors between Banks and Non-Banking Companies by Scale of Banks
13
c. Executive Directors of 1,190 banks
Positions in the non-banking companies Classes by paid-in capital Number of
observationsNumber of banks with interlocking
Ratio to all observations(%) Average per bank
Total Total 1,190 253 21.3 0.6-1,000 thousand yen 983 157 16.0 0.41,000-10,000 190 84 44.2 1.510,000- 17 12 70.6 2.5
Top executives Total 1,190 50 4.2 0.1-1,000 thousand yen 983 35 3.6 0.01,000-10,000 190 14 7.4 0.110,000- 17 1 5.9 0.1
Executive directors Total 1,190 50 4.2 0.0-1,000 thousand yen 983 35 3.6 0.01,000-10,000 190 14 7.4 0.110,000- 17 1 5.9 0.0
Ordinary directors Total 1,190 178 15.0 0.3-1,000 thousand yen 983 107 10.9 0.21,000-10,000 190 62 32.6 0.810,000- 17 9 52.9 1.4
Auditors Total 1,190 136 11.4 0.2-1,000 thousand yen 983 73 7.4 0.11,000-10,000 190 54 28.4 0.510,000- 17 9 52.9 1.1
d. Ordinary Directors of 1,190 banks
Positions in the non-banking companies Classes by paid-in capital Number of
observationsNumber of banks with interlocking
Ratio to all observations(%) Average per bank
Total Total 1,190 853 71.7 3.7-1,000 thousand yen 983 671 68.3 2.71,000-10,000 190 165 86.8 7.810,000- 17 17 100.0 15.6
Top executives Total 1,190 347 29.2 0.5-1,000 thousand yen 983 228 23.2 0.41,000-10,000 190 105 55.3 1.210,000- 17 14 82.4 2.9
Executive directors Total 1,190 89 7.5 0.1-1,000 thousand yen 983 52 5.3 0.11,000-10,000 190 33 17.4 0.210,000- 17 4 23.5 0.4
Ordinary directors Total 1,190 730 61.3 2.2-1,000 thousand yen 983 554 56.4 1.61,000-10,000 190 159 83.7 4.510,000- 17 17 100.0 8.5
Auditors Total 1,190 518 43.5 0.9-1,000 thousand yen 983 376 38.3 0.71,000-10,000 190 125 65.8 1.910,000- 17 17 100.0 3.9
14
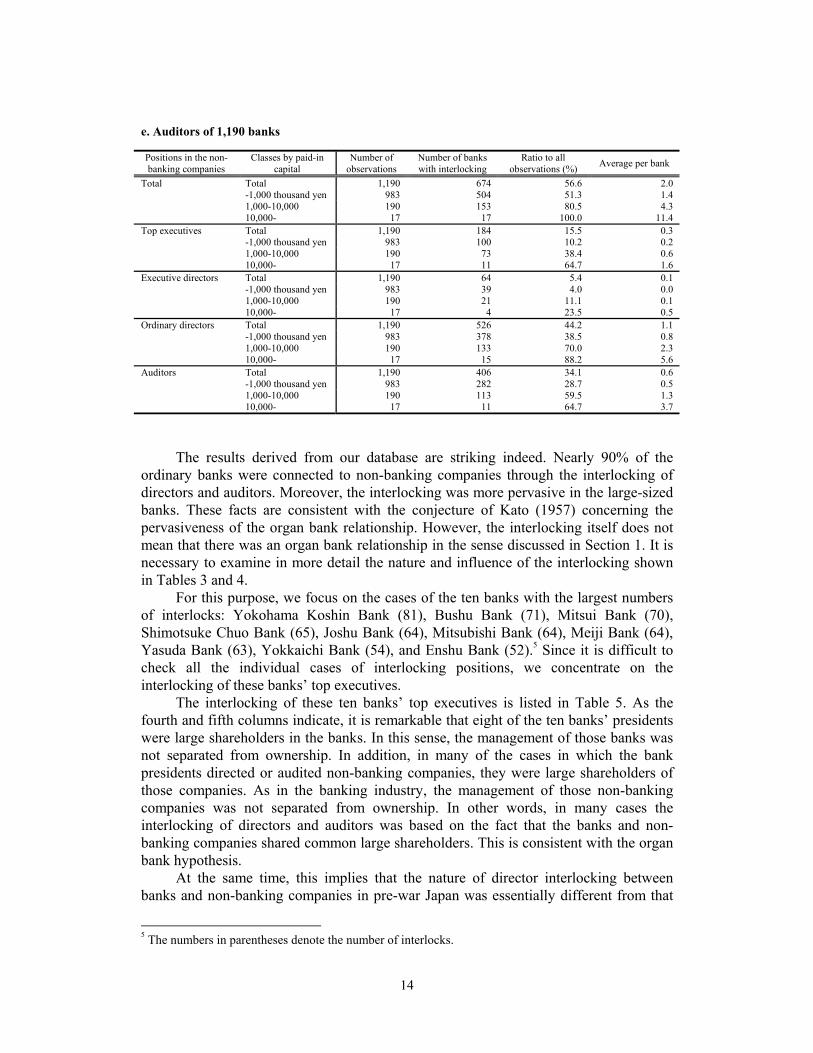
e. Auditors of 1,190 banks Positions in the non-banking companies
Classes by paid-in capital
Number of observations
Number of banks with interlocking
Ratio to all observations (%) Average per bank
Total Total 1,190 674 56.6 2.0 -1,000 thousand yen 983 504 51.3 1.4 1,000-10,000 190 153 80.5 4.3 10,000- 17 17 100.0 11.4 Top executives Total 1,190 184 15.5 0.3 -1,000 thousand yen 983 100 10.2 0.2 1,000-10,000 190 73 38.4 0.6 10,000- 17 11 64.7 1.6 Executive directors Total 1,190 64 5.4 0.1 -1,000 thousand yen 983 39 4.0 0.0 1,000-10,000 190 21 11.1 0.1 10,000- 17 4 23.5 0.5 Ordinary directors Total 1,190 526 44.2 1.1 -1,000 thousand yen 983 378 38.5 0.8 1,000-10,000 190 133 70.0 2.3 10,000- 17 15 88.2 5.6 Auditors Total 1,190 406 34.1 0.6 -1,000 thousand yen 983 282 28.7 0.5 1,000-10,000 190 113 59.5 1.3 10,000- 17 11 64.7 3.7
The results derived from our database are striking indeed. Nearly 90% of the ordinary banks were connected to non-banking companies through the interlocking of directors and auditors. Moreover, the interlocking was more pervasive in the large-sized banks. These facts are consistent with the conjecture of Kato (1957) concerning the pervasiveness of the organ bank relationship. However, the interlocking itself does not mean that there was an organ bank relationship in the sense discussed in Section 1. It is necessary to examine in more detail the nature and influence of the interlocking shown in Tables 3 and 4.
For this purpose, we focus on the cases of the ten banks with the largest numbers of interlocks: Yokohama Koshin Bank (81), Bushu Bank (71), Mitsui Bank (70), Shimotsuke Chuo Bank (65), Joshu Bank (64), Mitsubishi Bank (64), Meiji Bank (64), Yasuda Bank (63), Yokkaichi Bank (54), and Enshu Bank (52).5 Since it is difficult to check all the individual cases of interlocking positions, we concentrate on the interlocking of these banks� top executives.
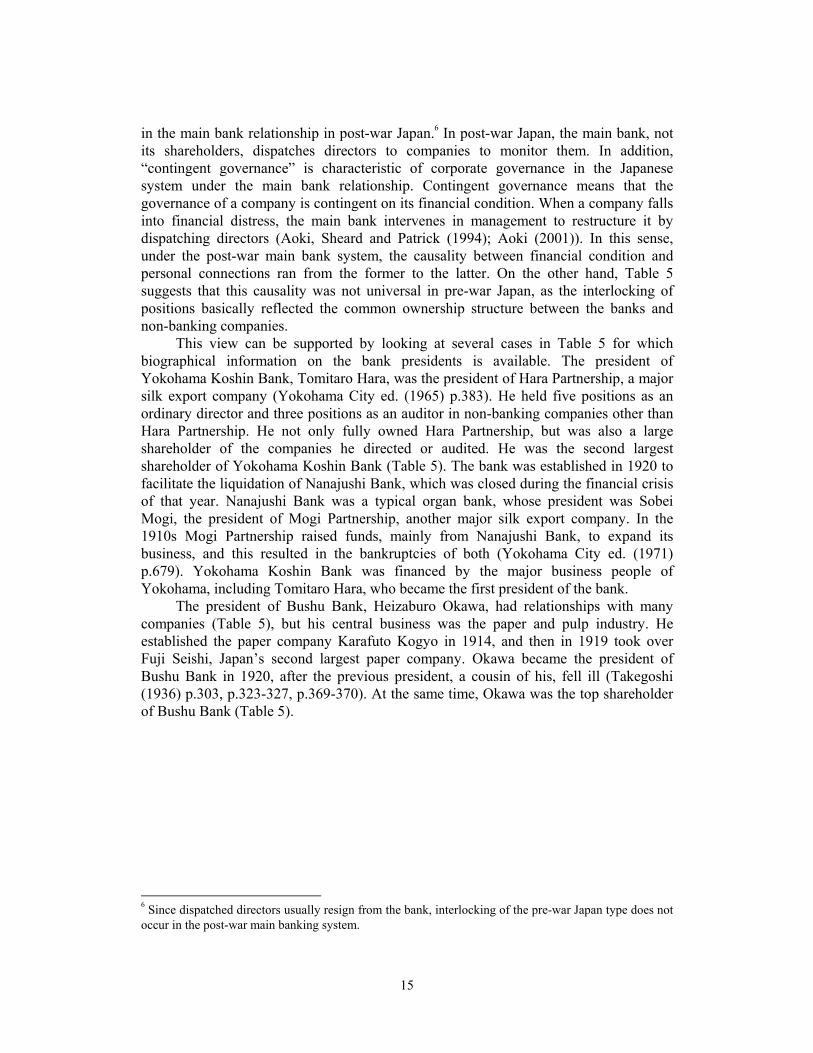
The interlocking of these ten banks� top executives is listed in Table 5. As the fourth and fifth columns indicate, it is remarkable that eight of the ten banks� presidents were large shareholders in the banks. In this sense, the management of those banks was not separated from ownership. In addition, in many of the cases in which the bank presidents directed or audited non-banking companies, they were large shareholders of those companies. As in the banking industry, the management of those non-banking companies was not separated from ownership. In other words, in many cases the interlocking of directors and auditors was based on the fact that the banks and non-banking companies shared common large shareholders. This is consistent with the organ bank hypothesis.
At the same time, this implies that the nature of director interlocking between banks and non-banking companies in pre-war Japan was essentially different from that
5 The numbers in parentheses denote the number of interlocks.
15
in the main bank relationship in post-war Japan.6 In post-war Japan, the main bank, not its shareholders, dispatches directors to companies to monitor them. In addition, �contingent governance� is characteristic of corporate governance in the Japanese system under the main bank relationship. Contingent governance means that the governance of a company is contingent on its financial condition. When a company falls into financial distress, the main bank intervenes in management to restructure it by dispatching directors (Aoki, Sheard and Patrick (1994); Aoki (2001)). In this sense, under the post-war main bank system, the causality between financial condition and personal connections ran from the former to the latter. On the other hand, Table 5 suggests that this causality was not universal in pre-war Japan, as the interlocking of positions basically reflected the common ownership structure between the banks and non-banking companies.
This view can be supported by looking at several cases in Table 5 for which biographical information on the bank presidents is available. The president of Yokohama Koshin Bank, Tomitaro Hara, was the president of Hara Partnership, a major silk export company (Yokohama City ed. (1965) p.383). He held five positions as an ordinary director and three positions as an auditor in non-banking companies other than Hara Partnership. He not only fully owned Hara Partnership, but was also a large shareholder of the companies he directed or audited. He was the second largest shareholder of Yokohama Koshin Bank (Table 5). The bank was established in 1920 to facilitate the liquidation of Nanajushi Bank, which was closed during the financial crisis of that year. Nanajushi Bank was a typical organ bank, whose president was Sobei Mogi, the president of Mogi Partnership, another major silk export company. In the 1910s Mogi Partnership raised funds, mainly from Nanajushi Bank, to expand its business, and this resulted in the bankruptcies of both (Yokohama City ed. (1971) p.679). Yokohama Koshin Bank was financed by the major business people of Yokohama, including Tomitaro Hara, who became the first president of the bank.
The president of Bushu Bank, Heizaburo Okawa, had relationships with many companies (Table 5), but his central business was the paper and pulp industry. He established the paper company Karafuto Kogyo in 1914, and then in 1919 took over Fuji Seishi, Japan�s second largest paper company. Okawa became the president of Bushu Bank in 1920, after the previous president, a cousin of his, fell ill (Takegoshi (1936) p.303, p.323-327, p.369-370). At the same time, Okawa was the top shareholder of Bushu Bank (Table 5).
6 Since dispatched directors usually resign from the bank, interlocking of the pre-war Japan type does not occur in the post-war main banking system.

16
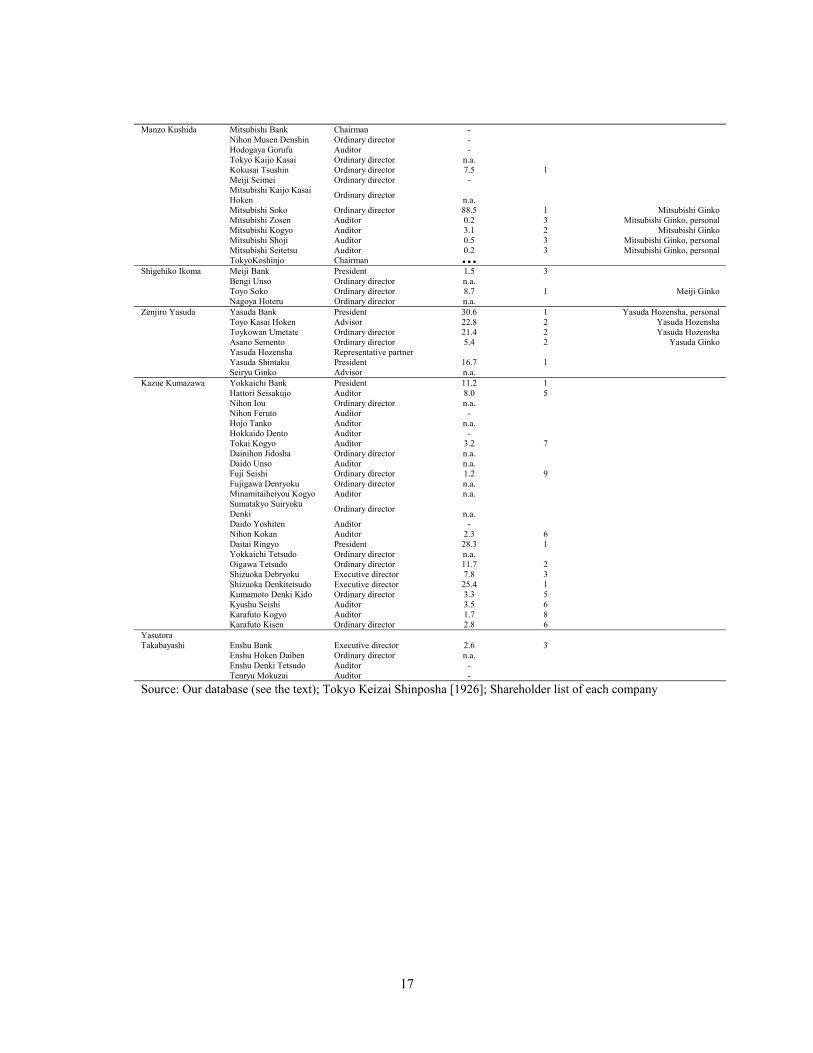
Table 5. Interlocking and Investment of the Top Executives of the Selective Banks
Name Company Name Position Share of the stocks(%) Ranking Remarks
Tomitaro Hara Yokohama Koshin Bank President 9.8 2 Nihon Yusen Ordinary director - Toyo Seitetsu Auditor - Taisho Kaijo Kasai Ordinary director 1.0 4
Yokohama Kasai Kaijo Hoken Ordinary director 4.6 5
Yokohama Seimei Hoken Auditor - Taisei Ordinary director n.a. Hara Partnership President Minami Manshu Tetsudo Auditor 0.5 4 Nikka Sanshi Ordinary director 1.2 4 Heizaburo Okawa Bushu Bank President 2.8 1 Okawa Partnership Nihon Feruto Ordinary director 30.8 1 Fuji Seishi, Karafuto Kogyo Nihon Konkurito Kogyo Ordinary director 1.0 9 Nihon Sakusan Seizo Ordinary director n.a. Nichiei Sekken Ordinary director n.a. Hojo Tanko Ordinary director n.a. Hokkaido Dento Ordinary director 36.0 1 Fuji Seishi, personal Tokai Kogyo President 3.8 6 Okawa Partnership Toyo Kisen Ordinary director 1.1 3 Okawa Partnership Tokyo Chika Tetsudo Ordinary director 1.5 5 Tokyo Kanaami Ordinary director 26.0 1 Fuji Seishi, Karafuto Kogyo Tokyowan Umetate Executive director 5.4 4 Okawa Partnership Okawa Tanaka Jimusho President n.a. Otaki Kozan Ordinary director n.a. Oshima Seikojo President 4.2 4 Okawa Partnership Dainihon Jidosha Ordinary director n.a. Tsurumi Rinko Tetsudo Ordinary director 5.0 7 Keihin Unga Ordinary director 0.8 8 Okawa Partnership Fuji Seishi President 5.9 2 Okawa Partnership Fujigawa Denryoku Ordinary director n.a. Enkaishu Mokuzai Ordinary director n.a. Asano Semento Ordinary director 4.5 3 Okawa Partnership Kyodo Parupu Ordinary director n.a. Kyodo Yoshi Ordinary director n.a. Joto Denki Kido President 3.4 4 Okawa Partnership Ninju Seimei Ordinary director - Seibu Tetsudo Ordinary director 2.2 3 Okawa Partnership Ishiwata Sureto Auditor 1.0 8 Okawa Partnership Representative partner Osaka Hoteru Ordinary director 2.5 4 Okawa Partnership Nakanoshima Seishi Ordinary director 3.7 5 Okawa Partnership Teikoku Jinzo Hiryo Ordinary director - Nihon Kokan President 4.6 3 Okawa Partnership Shizuoka Denryoku President 38.5 1 Personal, Okawa Partnership Shizuoka Denki Tetsudo President 1.2 10 Okawa Partnership Kumamoto Denki Ordinary director 6.1 3 Karafuto Kogyo, Okawa Partnership Kumamoto Denki Kido President 23.0 1 Karafuto Kogyo, Okawa Partnership Kizan Tetsudo President n.a. Kyushu Seishi President 12.1 1 Okawa Partnership Toho Tanko Ordinary director n.a. Karafuto Kogyo President 7.2 1 Okawa Partnership Karafuto Tetsudo Ordinary director 53.8 1 Fuji Seishi, personal Karafuto Kisen President 32.5 1 Karafuto Kogyo, Okawa Partnership Karafuto Seishigenryo Chairman n.a. Chosen Tetsudo Auditor 1.6 7 Okawa Partnership Chosen Denki Kogyo Auditor 1.0 1 Okawa Partnership Oryokuko Seishi Vice Chairman 28.8 2 Karafuto Kogyo, Okawa Partnership Genemon Mitsui Mitsui Bank President 0.3 10 Mitsui Bussan Representative director - Mitsui Partnership Executive partner Matsujito Ueno Shimotsuke Chuo Bank President - Higashino Tetsudo Auditor - Utsunomiya Gas President 2.9 9 Shimotsuke Seishi Ordinary director n.a. Sohei Ozawa Joshu Bank President 6.3 1
Daini Azumagawa Denryoku Ordinary director n.a.
Daiwa Insatsu President n.a. Azumagawa Denryoku Ordinary director n.a. Ozawa Shoten Ordinary director n.a. Takasaki Soko Ordinary director n.a. Marugami Ueno Unsoten Representative director n.a. Joshu Kenshi Boseki Ordinary director 1.9 8 Joshin Denki Vice president 2.5 4 Shinei Un'yu Ordinary director n.a.
17
Manzo Kushida Mitsubishi Bank Chairman - Nihon Musen Denshin Ordinary director - Hodogaya Gorufu Auditor - Tokyo Kaijo Kasai Ordinary director n.a. Kokusai Tsushin Ordinary director 7.5 1 Meiji Seimei Ordinary director -
Mitsubishi Kaijo Kasai Hoken Ordinary director n.a.
Mitsubishi Soko Ordinary director 88.5 1 Mitsubishi Ginko Mitsubishi Zosen Auditor 0.2 3 Mitsubishi Ginko, personal Mitsubishi Kogyo Auditor 3.1 2 Mitsubishi Ginko Mitsubishi Shoji Auditor 0.5 3 Mitsubishi Ginko, personal Mitsubishi Seitetsu Auditor 0.2 3 Mitsubishi Ginko, personal TokyoKoshinjo Chairman ••• Shigehiko Ikoma Meiji Bank President 1.5 3 Bengi Unso Ordinary director n.a. Toyo Soko Ordinary director 8.7 1 Meiji Ginko Nagoya Hoteru Ordinary director n.a. Zenjiro Yasuda Yasuda Bank President 30.6 1 Yasuda Hozensha, personal Toyo Kasai Hoken Advisor 22.8 2 Yasuda Hozensha Toykowan Umetate Ordinary director 21.4 2 Yasuda Hozensha Asano Semento Ordinary director 5.4 2 Yasuda Ginko Yasuda Hozensha Representative partner Yasuda Shintaku President 16.7 1 Seiryu Ginko Advisor n.a. Kazue Kumazawa Yokkaichi Bank President 11.2 1 Hattori Seisakujo Auditor 8.0 5 Nihon Iou Ordinary director n.a. Nihon Feruto Auditor - Hojo Tanko Auditor n.a. Hokkaido Dento Auditor - Tokai Kogyo Auditor 3.2 7 Dainihon Jidosha Ordinary director n.a. Daido Unso Auditor n.a. Fuji Seishi Ordinary director 1.2 9 Fujigawa Denryoku Ordinary director n.a. Minamitaiheiyou Kogyo Auditor n.a.
Sumatakyo Suiryoku Denki Ordinary director n.a.
Daido Yoshiten Auditor - Nihon Kokan Auditor 2.3 6 Daitai Ringyo President 28.3 1 Yokkaichi Tetsudo Ordinary director n.a. Oigawa Tetsudo Ordinary director 11.7 2 Shizuoka Debryoku Executive director 7.8 3 Shizuoka Denkitetsudo Executive director 25.4 1 Kumamoto Denki Kido Ordinary director 3.3 5 Kyushu Seishi Auditor 3.5 6 Karafuto Kogyo Auditor 1.7 8 Karafuto Kisen Ordinary director 2.8 6 Yasutora Takabayashi Enshu Bank Executive director 2.6 3 Enshu Hoken Daiben Ordinary director n.a. Enshu Denki Tetsudo Auditor - Tenryu Mokuzai Auditor -
Source: Our database (see the text); Tokyo Keizai Shinposha [1926]; Shareholder list of each company
18
4. The Influence of the Governance Structure on Bank Performance
In this section we will qualitatively examine the influence of interlocking on bank performance. First, the relationship between interlocking and financial condition in 1926 can be checked by equation (1). X = 1*INTERLOCK+ 2*FORM + 3*URBAN const.+ (1)
X denotes the variables indicating the bank�s financial condition, namely CAPDEP, LOANDEP, RESDEP or ROA. The notations of the variables are the same as those in Section 3. INTERLOCK denotes the number of interlocks, namely, the number of positions as director and auditor of non-banking companies held by the directors and auditors of each bank. In addition, we use two control variables. FORM is a dummy variable, which equals 1 if the bank is a joint-stock company, and otherwise equals 0. URBAN is a dummy variable which equals 1 if the headquarters of the bank is located in an urban area, namely in Tokyo, Kanagawa, Aichi, Osaka, Kyoto or Hyogo prefectures. Otherwise it equals 0.
Equation (1) is estimated by OLS, except in the case of ROA. Since the profit data available from the Ministry of Finance (1928) was censored, the equations using ROA as a dependent variable are estimated using a tobit model. As reported in Table 6, the coefficients of INTERLOCK are negative and statistically significant in the equations with CAPDEP and ROA as dependent variables, implying that banks with interlocking were less profitable and had riskier financial structures.
It may be that poor financial condition itself lowered the valuation of the bank in the financial market. In fact, Yabushita and Inoue (1993) examined the relationship between bank�s financial conditions and the probability of their closure during the financial crisis in 1927, and found that poor financial condition increased the probability of closure. Based on Yabushita and Inoue (1993), we estimated the following equations (equations (2) (5)). CLS =Π γ1*INTERLOCK+γ2*FORM +γ3*URBAN const.+ε (2)
RUN=Π γ4*INTERLOCK+γ5*FORM +γ6*URBAN const.+ε (3) BCON=Π γ7*INTERLOCK+γ8*FORM +γ9*URBAN const.+ε (4) BCON=Π γ10*INTERLOCK+γ11*FORM +γ12*URBAN +γ13*CAPDEP +γ14*LOANDEP +γ15*RESDEP γ16*ROA const.+ε (5)
Π ( ) is a logistic cumulative distribution function. CLS is a dummy variable, which equals 1 if the bank was closed in the period from 1927 to 1929; otherwise it equals 0. RUN is a dummy variable which equals 1 if a run on the bank occurred in the period from 1927 to 1929, while BCON is a dummy variable which equals 1 if CLS or RUN is 1; otherwise it equals 0.
The information on bank closures and runs was collected from various issues of Ginko Jiko Geppo (Monthly Report on the Bank Issue) by the Bank of Japan, reprinted

19
a. Dependent Variable : CAPDEP(OLS)INTERLOCK -4.64E-03 (-1.84) *FORM 0.330 (2.11) **URBAN -8.75E-02 (-1.56)constant 0.377 (2.44) **adj-R squares 0.01
b. Dependent Variable : LOANDEP(OLS)INTERLOCK -2.99E-03 (-0.33)FORM 0.352 (0.63)URBAN 0.390 (1.94) *constant 1.1487 (2.06) **adj-R squares 0.00
c. Dependent Variable : RESDEP(OLS)INTERLOCK 2.03E-04 (0.56)FORM -5.71E-03 (-0.25)URBAN 2.83E-02 (3.51) ***constant 6.92E-02 (3.11) ***adj-R squares 0.01
d. Dependent Variable : ROA(Tobit)INTERLOCK -3.89E-04 (-4.03) ***FORM 3.67E-03 (0.62)URBAN -1.22E-02 (-5.68) ***constant 4.47E-02 (7.49) ***Log-likelihood Function 2227.2Limit 0Limit observations 57All observations 1190
in the Bank of Japan (1964). Unlike Yabushita and Inoue (1993), we focus not only on bank closures under the financial crisis, but also on bank closures and runs in ordinary periods.
The results of the Logit estimation are reported in Table 7. In equations (2), (3) and (4), the coefficients of INTERLOCK are positive and statistically significant at the 1% level.
These results indicate that interlocking lowered the valuation of banks in the financial market. Also, in equation (5), we find that low CAPDEP, high LOANDEP, low RESDEP, and low ROA increased the probability of bank closures and runs, which confirms Yabushita and Inoue (1993).
At the same time, in equation (5) the coefficient of INTERLOCK is positive and statistically significant at the 5% level, which means that interlocking was evaluated as additional negative information, adding to poor financial indices in the financial market.
Finally, we examine the valuation of the banks in the financial market using different data, namely the interest rate data by bank. In Toyo Keizai Shinposha (1928), the profit and loss accounts of 115 banks are available; of them, 114 are common to our samples. Although there may be a sample selection bias, it is the second best solution available under the constraint of data availability.
We regress the interest rates of deposit and loan to INTERLOCK. As reported in Table 8, in the equation using the deposit interest rate as a dependent variable, the coefficient of INTERLOCK is positive and statistically significant, implying that the market evaluated the deposits of banks with interlocking relationships as relatively risky. On the other hand, in the equation using loan interest rates as a dependent variable, the coefficient of INTERLOCK is not statistically significant.
While the banks with interlocking had to pay risk premiums to depositors to gather deposits, they were not able to earn higher interest rates from their loans. In other words, their profit margins were relatively small, which is consistent with the results of Table 6.
Table 6. Estimation Results of Equation (1)
INTERLOCK The number of interlocking the Bank had in 1926. FORM = 1 if the bank was the stock company, otherwise 0.
URBAN = 1 if the bank wasin the urban area (Tokyo, Kanagawa, Aichi, Osaka, Kyoto, Hyogo), otherwise 0.
CAPDEP =[paid-in capital + fund]/deposits LOANDEP =loan/deposits RESDEP =reserve/deposits ROA =profit/[deposits+paid-in capital+fund] t-values in parentheses *** significant at 1% level. ** significant at 5% level. * significant at 10% level.

20
Equation (2) (3) (4) (5)INTERLOCK 0.021 (2.05) ** 0.050 (3.77) *** 0.031 (3.51) *** 0.022 (2.28) **FORM 25.926 (0.00) 24.173 (0.00) 25.847 (0.00) 25.164 (0.00)URBAN 0.652 (2.30) ** 0.212 (0.37) 0.616 (2.39) ** 0.336 (1.24)CAPDEP -1.636 (-2.94) ***LOANDEP 0.107 (2.03) **RESDEP -4.718 (-2.27) **ROA -27.716 (-3.47) ***constant -29.304 (0.00) -29.304 (0.00) -29.078 (0.00) -26.501 (0.00)Log-likelihood Function -219.9 -74.8 -256.1 -219.9Maddala R-squares 0.01 0.01 0.02 0.01dependent variable CLS RUN BCON BCONobservations at one 56 15 70 56observations at zero 1134 1175 1120 1134total observations 1190 1190 1190 1190
INTERLOCK The number of interlocking the Bank had in 1926.FORM equals 1 if the bank was the stock company, otherwise 0.URBAN equals 1 if the bank wasin the urban area(Tokyo, Kanagawa, Aichi, Osaka, Kyoto, Hyogo), otherwiCAPDEP [paid-in capital + fund]/depositsLOANDEP loan/depositsRESDEP reserve/depositsROA profit/[deposits+paid-in capital+fund]CLS equals 1 if the bank closed within 3 years after the Showa Financial Crisis in 1927, otherwise 0.RUN equals 1 if the bankrun occured within 3 years after the Showa Financial Crisis in 1927, otherwise 0BCON equals 1 if CLS or RUN is 1, otherwise 0.t-values in parentheses*** significant at 1% level.** significant at 5% level.* significant at 10% level.
Table 7. Estimation Results of Equations (2)-(5)
a. Dependent Variable: interest rate of depositEstimation-2 dependent variable : deposit rateINTERLOCK 1.78E-04 (2.62) ***DEPOSIT -4.67E-05 (-4.69) ***constant 4.53E-02 (26.33) ***adj-R squares 0.16
b. Dependent Variable: interest rate of loanINTERLOCK 1.25E-04 (1.32)LOAN -6.14E-11 (-3.87) ***constant 6.20E-02 (25.97) ***adj-R squares 0.10
t-values in parentheses*** significant at 1% level.** significant at 5% level.* significant at 10% level.
Table 8. Estimation of the Risk Premium
1 if the bank was in the urban area (Tokyo, Kanagawa, Aichi, Osaka, Kyoto, Hyogo), otherwise 0.
1 if the bank was in the urban area (Tokyo, Kanagawa, Aichi, Osaka, Kyoto, Hyogo), otherwise 0.
21
5. Concluding Remarks
More than forty years ago, Kato (1957) posited the organ bank hypothesis, which has become one of the most basic hypotheses on the financial history of pre-war Japan. In this paper, we tested the organ bank hypothesis using quantitative data and econometric methodology.
First, we compiled a comprehensive database of company directors and auditors, based on the 1926 issue of Zenkoku Shogaisha Yakuinroku (Shogyo Koshinjo (1926)). Using the database we identified the interlocking of directors and auditors between banks and non-banking companies, and found that it was pervasive. In nearly 90% of ordinary banks, at least one director or auditor had a position as director or auditor of a non-banking company, and the average number of interlocking connections per bank was as large as 7.80. In addition, observations of banks by scale demonstrated that interlocking with non-banking companies was universal across the bank scale.
Second, using the interlocking variables, we examined the influence of interlocking of directors and auditors on bank performance. Through regression analyses we found that banks with interlocking were less profitable and had riskier financial structures, and that interlocking increased the probability of bank closures and runs. Further, the interest rates of the deposits of those banks with interlocking were relatively high, implying that the financial market evaluated interlocking negatively.
These findings support the organ bank hypothesis. In pre-war Japan, banking business practices, based on the connections of the directors and auditors, made the banking system unsound, and eventually caused the Showa Financial Crisis of 1927. In this sense, as we mentioned in Section 1, the Showa Financial Crisis can be seen as a precursor of the Asian Crisis of 1997.
Finally, we would like to discuss the evolutionary dynamics of the corporate governance and the banking system in economic development, integrating the results of this paper and our recent researches (Okazaki [2001]; Okazaki [2002]). It is said that organ bank relationship was already pervasive in early twentieth century (Kato [1957]). In this period, even Mitsui Bank, the largest zaibatsu bank loaned large amounts of funds to its affiliated companies (Tatsuki [1976]). On the other hand, instability of the financial market was not so serious compared with 1920�s. The basic reason is supposed to be the high equity ratio of the bank (Figure 2). High equity ratio not only enhanced the risk-bearing capacity of the bank, but also alleviated agency problems between depositors and the bank, as Lamoreaux [1994] discussed concerning banks in early nineteenth century New England.
Expansion of the Japanese economy and upsurge of savings changed the environmental condition of the banking industry. While equity ratios of the banks declined due to the sharp increase of deposits, many banks loaned substantial amounts of funds to newly developed heavy and chemical companies, which brought about a serious agency problem. On the other hand, around this period, major zaibatsu carried out organizational reforms to establish holding companies. Through this reform, accounts of businesses including banking were made independent one another.
Also, concerning major zaibatsu, multiplicity of businesses, as well as the fact that affiliation of banks and companies was common knowledge in the business society, lowered the incentive of the core members of them to exploit minority shareholders and
22
depositors. For sharking was easily detected ex post, and if it were detected, penalties for it impacted on multiple businesses of the zaibatsu which sharked thorough decline of reputation (Matsushima [1998]). In our opinion, this is a basic reason why zaibatsu affiliated banks and companies achieved high performance, apart from effective monitoring by the holding companies which was stressed in Okazaki [2001].
Furthermore, after that zaibatsu exerted selection pressure on unsound banks not to speak of, zaibatsu banks competing with them in the financial market. As a matter of fact, it is well known that market share of zaibatsu banks substantially went up in 1920�s, which in turn made financial conditions of the other banks still worse. And as we indicated in this paper, the probability of closure was higher, if financial conditions of a bank were bad, which implies bad performing banks tended to be selected to exit (Okazaki [2002]). Additionally, zaibatsu merged and acquired many companies including banks in 1920�s and 1930�s to restructure them. Through these M&A, zaibatsu directly participated in the process of selection and evolution.
23
References Aoki, M. (2001), Towards A Comparative Institutional Analysis, Cambridge, MA: MIT
Press. Aoki, M., Sheard, P. and Patrick, H. (1994), �The Japanese Main Bank System: An
Introductory Overview,� in M. Aoki and H. Patrick (eds.), The Japanese Main Bank System: Its Relevance for Developing and Transforming Economies, New York: Oxford University Press.
Asakura, K. (1988), Shinpen Nihon Kin�yu Shi (Japanese Financial History: New
Edition), Tokyo: Nihon Keizai Hyoronsha. Bank of Japan (1933), �Kanto Shinsai yori Showa 2nen Kin�yu Kyoko niitaru Waga
Zaikai,� (The Japanese Economy from the Kanto Earthquake to the Financial Crisis in 1927) in Bank of Japan (ed.) Nihon Kin�yushi Shiryo (Resources on Japanese Financial History) Meiji Taisho edition, vol. 22, Printing Bureau of the Ministry of Finance.
Bank of Japan (1983a), Nihon Ginko Hyakunen Shi (100 Years History of the Bank of
Japan), Vol.2, Tokyo: Bank of Japan. Bank of Japan (1983b), Nihon Ginko Hyakunen Shi (100 Years History of the Bank of
Japan), Vol.3, Tokyo: Bank of Japan. Claessens, S., Djankov, S. and Lang, L. (1998), �East Asian Corporates: Growth,
Financing and Risks over the Last Decade,� mimeo., World Bank. Goto, S. (1970), Nihon no Kin�yu Tokei (Financial Statistics of Japan), Tokyo: Toyo
Keizai Shinposha Goto, S. (1991), Ginko Godo no Jisshoteki Kenkyu (Empirical Studies on Bank
Mergers), Tokyo: Nihon Keizai Hyoronsha. Ishii, K. (1999), �Hyaku Sanjo Ginko to Matsumoto Jutaro,� (Hyaku Sanju Bank and
Jutaro Mastumoto) in K. Ishii, Kindai Nihon Kin�yu Shi Josetsu, (Towards a Theory of the Modern Financial History of Japan), Tokyo: The University of Tokyo Press.
Imuta, T. (1966), �Shohyo: Kazuo Shibagaki, Nihon Kin�yu Shihon Bunseki,� (Book
Review of Kazuo Shibagaki�s Analysis of the Japanese Financial Capital,� Keizaigaku Zasshi (Osaka Municipal University), vol.54-2.
Imuta, T. (1976), �Taishoki niokeru Kin�yu Kozo (Introduction of the Analysis of the
Financial Crisis in 1927),� in Gendai no Zaisei Kin�yu (Contemporary Fiscal and Financial Issues), Tokyo: The University of Tokyo Press.
24
Kato, T. (1957), Honpo Ginkoshi Ron (History of Banks in Japan), Tokyo: The University of Tokyo Press.
Kobayakawa, T., Suzuki, T. and Wada, K. (1999a), �Meijiki no Kaisha oyobi Keieisha
no Kenkyu: Nihon Zenkoku Shogaisha Yakuinroku (Meiji 31 issue) no Bunseki (Firms and Corporate Executives in Japan: An Analysis of the National Directory of Corporate Executives (1898),� Sangyo Keizai Kenkyujo Kiyo (Chubu University), vol.9.
Kobayakawa, T., Suzuki, T. and Wada, K. (1999b), �Meijiki no Kaisha oyobi Keieisha
no Kenkyu: Nihon Zenkoku Shogaisha Yakuinroku (Meiji 40nenban) no Bunseki (Firms and Corporate Executives in Japan: An Analysis of the National Directory of Corporate Executives (1907),� Keizai Ronshu (Gakushuin University) vol.36-3
Lamoreaux(1994) Insider Lending : Banks, Personal Connections, and Economic
Development in Industrial New England, New York, Cambridge University Press Lang, L. (2001), �Exploitation,� mimeo., Chinese University of Hong Kong. Matsushima, H.(1998) �Multimarket Contact, Imperfect Monitoring, and Implicit
Collusion�, CIRJE Discussion Paper, F-24. Ministry of Finance (1928), Ginkokyoku Nenpo (Year Book of the Bank Bureau of the
Ministry of Finance) 1926 issue. Ministry of Industry and Commerce (1928), Kaisha Tokeihyo (Corporate Statistics)
1926 issue. Miwa, Y. and M. Ramseyer (2000), �The Value of Prominent Directors: Lessons in
Corporate Governance from Transition Japan,� (mimeo., The University of Tokyo and Harvard University).
Murakami, H. (1983), �Futsu Ginko,� (Ordinary Banks), in T. Kato (ed.) Nihon Kin�yu
Ron no Shiteki Tenkai (History of Research on the Japanese Financial System), Tokyo: The University of Tokyo Press.
Okazaki, T. (1999), Mochikabu Gaisha no Rekishi (History of Holding Companies in
Japan), Tokyo: Chikuma Shobo. Okazaki, T. (2001), �The Role of Holding Companies in Pre-war Japanese Economic
Development: Rethinking Zaibatsu in the Perspective of Corporate Governance,� forthcoming in Social Science Japan.

25
Okazaki, T. (2002) �Ginkogyo niokeru Kigyo Tota to Keiei no Koritsusei,� (Selection, Exits and Efficiency in the Japanese Banking Industry: An Historical Perspective), in M. Saito ed. Kin�yu Shisutemu no Saisei (Revival of the Financial System), Chuo Keizaisha
Okazaki, T. and Yokoyama, K. (2001), �Governance and Performance of Banks in Pre-
war Japan: Testing the �Organ Bank� Hypothesis Quantitatively,� CIRJE Discussion Paper F-111 (The University of Tokyo).
Shibagaki, K. (1965), Nihon Kin�yu Shihon Bunseki (Analysis of the Financial Capital
in Japan), Tokyo: The University of Tokyo Press. Shibuya, R. Ishiyama, S. and Saito, K. (1983), �Taishou-shoki No Dai-Shisanka Meibo
(Large Asset Holders List in the Early Taisho Period)� Chihou Kin�yushi Kenkyu, 14: 20-107.
Shleifer, A. and Vishney, R. (1997), �A Survey of Corporate Governance�, The Journal
of Finance 52: 737-783. Shogyo Koshinjo (1926), Zenkoku Shigaisha Yakuinroku (Directory of Company
Directors of Japan), 1926 issue, Tokyo: Shogyo Kishinjo. Sugiyama, K. (1976), �Gomeigaisha Mitsui Ginko no Kikan Ginko teki Seikaku,�
(Attributes of the Organ Bank observed in Mitsui Bank,) in T. Ouchi (ed.), Gendai Kin�yu (Contemporary Finance).
Takahashi K. and Morigaki, W., (1968) Showa Kinyu Kyoko Shi (History of the Showa
Financial Crisis), Tokyo. Tatsuki, M. (1976) �Nichiro Daiichiji Taisen kan no Mistui Ginko,� (Mitsui Bank
between Russo-Japanese War and the First World War,) in T. Ouchi ed. Gendai Kin�yu (Contemporary Finance), Tokyo, University of Tokyo Press
Teranishi, J. (1982), Nihon no Keizai Hatten to Kin�yu (Japanese Economic
Development and Finance), Tokyo: Iwanami Shoten. Teranishi, J. (2000), �The Fall of the Taisho Economic System� in Aoki, M. and G. R.
Saxonhouse (eds.), Finance, Governance, and Competitiveness in Japan, Oxford: Oxford University Press, 2000.
Toyo Keizai Shinposha (1926), Kabushiki Gaisha Nenkan, vol.4, (Year Book of Joint-
stock Companies), Tokyo: Toyo Keizai Shinposha. Toyo Keizai Shinposha (1928), Ginko Nenkan (Year Book of Banks), Vol.5, Tokyo:
Toyo Keizai Shinposha.

26
Toyo Keizai Shinposha (1991), Kanketsu Showa Kokusei Soran (Final Version of the Collected Statistics of the Showa Era), Vol.2, Tokyo: Toyo Keizai Shinposha.
Wada, K., Kobayakawa, T. and Shiomi, H. (1992a) �Meiji 40nen Jiten no Chikyo
Zaikai niokeru Juyaku Kennin: Zenkoku Shigaisha Yakuinroku (Meiji 40nenban) no Bunseki,� (Interlocking of Directors in the Business Society of Chukyo District in 1907: An Analysis of the National Directory of Corporate Executives (1907), Nanzan Kenkyu (Nanzan University), vol.6-3.
Wada, K., Kobayakawa, T. and Shiomi, H. (1992b) �Meiji 31nen Jiten no Chikyo
Zaikai niokeru Juyaku Kennin: Zenkoku Shogaisha Yakuinroku (Meiji 31nenban) no Bunseki,� (Interlocking of Directors in the Business Society of Chukyo District in 1898: An Analysis of the National Directory of Corporate Executives (1898)), Nanzan Kenkyu (Nanzan University), vol.7-2.
Wada, K., Kobayakawa, T. and H. Shiomi (1993), �Taisho 7nen Jiten no Chikyo Zaikai
niokeru Juyaku Kennin: Zenkoku Shogaisha Yakuinroku (Taisho 7nenban) no Bunseki,� (Interlocking of Directors in the Business Society of Chukyo District in 1918: An Analysis of the National Directory of Corporate Executives (1918)), Nanzan Keiei Kenkyu (Nanzan University), vol.8-1.
Yamazaki, H. (2000), Showa Kin�yu Kyoko (The Showa Financial Crisis) Tokyo: Toyo
Keizai Shiposha. Yabushita, S. and Inoue, A. (1993), �The Stability of the Japanese Banking System: A
Historical Perspective,� Journal of the Japanese and International Economies, vol.7-4.
Yokohama City (Ed.) (1971), Yokohamashi Shi, (History of Yokohama City), vol.5-1,
Yokohama City. Yui, T. and Asano, T. (1989), Zenkoku Shogaisha Yakuinroku Kaisetsu and Fukenbetsu
Sakuin, (Commentary of the Directory of the Company Directors of Japan, and Index of Companies by Prefecture), Tokyo: Kashiwa Shobo.
27
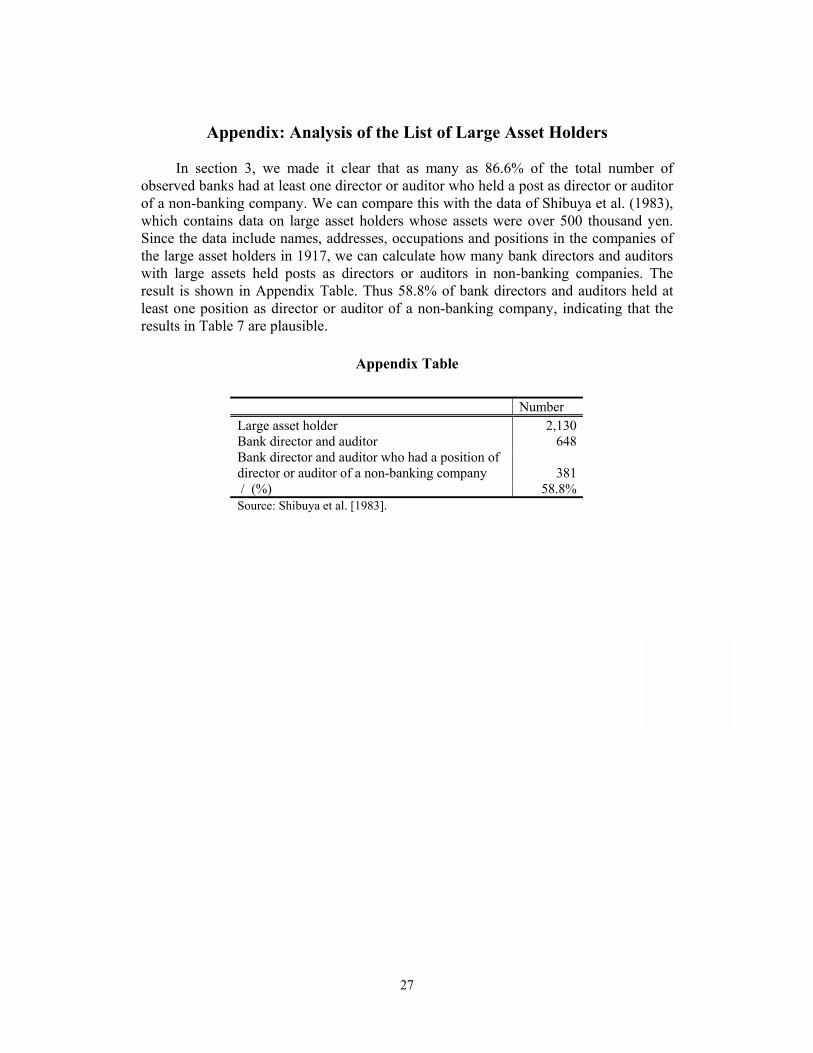
Appendix: Analysis of the List of Large Asset Holders In section 3, we made it clear that as many as 86.6% of the total number of
observed banks had at least one director or auditor who held a post as director or auditor of a non-banking company. We can compare this with the data of Shibuya et al. (1983), which contains data on large asset holders whose assets were over 500 thousand yen. Since the data include names, addresses, occupations and positions in the companies of the large asset holders in 1917, we can calculate how many bank directors and auditors with large assets held posts as directors or auditors in non-banking companies. The result is shown in Appendix Table. Thus 58.8% of bank directors and auditors held at least one position as director or auditor of a non-banking company, indicating that the results in Table 7 are plausible.
Appendix Table
Number
Large asset holder 2,130 Bank director and auditor 648 Bank director and auditor who had a position of director or auditor of a non-banking company 381 / (%) 58.8% Source: Shibuya et al. [1983].

HOW TO CONTACT US?
Asian Development Bank InstituteKasumigaseki Building 8F3-2-5 Kasumigaseki, Chiyoda-ku,Tokyo 100-6008 Japan
Tel: +81 (03) 3593-5500Fax: +81 (03) 3593-5571E-mail: [email protected]
Papers are also available online at the ADBI Internet site:http://www.adbi.org/publications/
RESEARCH PAPER SERIES
Family-Based Business Groups: Degeneration of Quasi-Internal Organizations �and Internal Markets in Korea�December 2001 Code: 28-2001 by Sang-Woo Nam
Can “Moral Hazard” Explain the Asian Crises?�December 2001 Code: 29-2001 by Luiz A. Pereira da Silva and Masaru Yoshitomi
Avoiding Double Mismatches and Withstanding Regional Financial Crises:�The Singapore Experience�December 2001 Code: 30-2001 by Khee-Giap Tan, T. Karigane, and M. Yoshitomi
The Political Ecology of Famine: The North Korean Catastrophe and Its Lessons�January 2002 Code: 31-2002 by Meredith Woo-Cumings
Road from State to Market–Assessing the Gradual Approach to Banking Sector Reforms in India–�February 2002 Code: 32-2002 by Sayuri Shirai
Growth and Poverty: Lessons from the East Asian Miracle Revisited�February 2002 Code: 33-2002 by M. G. Quibria
Did East-Asian Developing Economies Lose Export Competitiveness in the Pre-Crisis 1990s? �Assessing East-Asian Export Performance from 1980 to 1996March 2002 Code: 34-2002
A New Approach to Modeling the Impacts of Financial Crises on Income Distribution and Poverty�March 2002 Code: 35-2002 by Iwan J. Azis
Increasing Incomes for the Poor and Economic Growth: Toward a Simple Taxonomy for PoliciesApril 2002 Code: 36-2002 by Jere R. Behrman
The Role of the Global Economy in Financing Old Age: The Case of SingaporeMay 2002 Code: 37-2002 by Mukul G. Asher
Have India’s Financial Market Reforms Changed Firm’s Corporate Financing Patterns?�June 2002 Code: 38-2002 by Sayuri Shirai
Measuring the Extent and Implications of Director Interlocking �in the Pre-war Japanese Banking Industry�July 2002 Code: 39-2002 by Tetsuji Okazaki and Kazuki Yokoyama
ADB INSTITUTE RESEARCH PAPER 39