
MEASURING THE EIS t ECTTVENESS - INSEAD
20
MEASURING THE EI S t ECTTVENESS OF OVERLAPPING DEVELOPMENT ACTIVITIES by C. TERWIESCH* and C.H. Loaf" 98/45/TM (revised version of 97/47/TM) Assistant Professor of Operations Management, The Wharton School, University of Pennsylvania, USA. Associate Professor of Operations Management at INSEAD, Boulevard de Constance, 77305 Fontainebleau Cedex, France. A working paper in the INSEAD Working Paper Series is intended as a means whereby a faculty researcher's thoughts and fmdings may be communicated to interested readers. The paper should be considered preliminary in nature and may require revision. Printed at INSEAD, Fontainebleau, France.
Transcript of MEASURING THE EIS t ECTTVENESS - INSEAD

MEASURING THE EIS t ECTTVENESSOF OVERLAPPING DEVELOPMENT ACTIVITIES
by
C. TERWIESCH*and
C.H. Loaf"
98/45/TM(revised version of 97/47/TM)
Assistant Professor of Operations Management, The Wharton School, University of Pennsylvania,USA.
Associate Professor of Operations Management at INSEAD, Boulevard de Constance, 77305Fontainebleau Cedex, France.
A working paper in the INSEAD Working Paper Series is intended as a means whereby a faculty researcher'sthoughts and fmdings may be communicated to interested readers. The paper should be considered preliminaryin nature and may require revision.
Printed at INSEAD, Fontainebleau, France.
Measuring the Effectiveness of Overlapping
Development Activities
Christian Terwiesch Christoph H. Loch
The Wharton School INSEAD
June 16, 1998
Abstract
Overlapping development activities is widely used to reduce project completion
times in product development. However, research on the applicability of the concept
in different technological environments remains scarce. So far, very few, industry
specific, studies have statistically confirmed an accelerating effect of overlap. In the
present article we statistically measure the effectiveness of overlapping development
activities in reducing project completion time. Building on analytical research in
Operations Management, we argue that this effectiveness differs with the organiza-
tion's capability to resolve uncertainty early in the process. Projects benefit more
from overlap if they are able to resolve uncertainty early. This contingency view
to overlapping development activities is tested based on data from 140 completed
development projects across several global electronics industries.
1 Introduction
Time-to-market in product development has been viewed as an important factor for suc-cess in the 1990s (e.g., Blackburn 1991, Wheelwright and Clark 1992). Landmark studiesby Takeuchi and Nonaka (1986) and Clark and Fujimoto (1991) demonstrated that over-lapping of activities is a powerful tool for reducing product development times in theautomobile industry. Overlapping has also been used successfully in developing airplanes(Sabbagh 1996) and software (Cusumano and Selby 1995). Today, overlapping activities
1

and the surrounding organizational activities needed to support it are widely used andoften referred to as simultaneous engineering (Griffin 1996).
Despite many success stories, there is recent evidence that overlapping activities can comeat the expense of development rework, especially if development uncertainty is not resolvedearly during a project. Such rework may outweigh the overlap benefits of parallel taskexecution. First, based on managerial experience, several authors recommend restrictingthe practice of overlapping to environments of low uncertainty (e.g. Cordero 1991, Lincke1995). Second, there is a growing body of literature in Operations Management that hasmodeled the question of when one should overlap development activities and has, at leastpartially, drawn similar conclusions (Krishnan et al. 1997, Ha and Porteus 1995, Loch and
Terwiesch 1996).
The contribution of the present article is twofold. First, we confirm the acceleration impactof overlap on project completion time. This relationship has only been statistically con-firmed in very few, industry specific, studies. Second, building on the above-mentionedOperations Management literature, we provide a model that hypothesizes the optimaloverlap level to depend on the uncertainty resolution in the project. We operationalizethe concept of uncertainty resolution and statistically show how it influences the effective-ness of overlap using data from 140 completed development projects across several global
electronics industries.
The article is organized as follows: Section 2 reviews the relevant literature on activityoverlap in development. In Section 3, we develop the hypotheses. After a description ofour methodology (Section 4) we test the hypotheses in Section 5. The article ends with adiscussion of our results and a preview of future research.
2 Literature Background
Overlapping development activities has been recognized as a key component of concurrentengineering for reducing development times over the last decade. Imai et al. (1985) andTakeuchi and Nonaka (1986) report that faster development processes can be achievedby overlapping activities. Similar observations were reported by Sabbagh (1996) in thedevelopment of the Boeing 777, and by Cusumano and Selby (1995), as well as Blackburn
et al. 1996 for software development.
In their famous study of product development practices in the world automobile indus-
2

try, Clark and Fujimoto (1991) showed that overlapping activities accelerated the productdevelopment process. With their construct "Engineering Simultaneity Ratio" , they werethe first to operationalize overlapping development activities and to identify a statisticallysignificant accelerating effect on engineering lead times. In addition, Clark and Fujimotoexamined the organizational context, in which overlapping activities is beneficial. Usingan information processing framework (Galbraith 1973, Tushman and Nadler 1978), theyidentified intensive communication as a key success factor. These ideas were refined in fur-ther studies, including those by Wheelwright and Clark (1992) and Clark and Wheelwright(1994).
In their study of the world computer industries, Eisenhardt and Tabrizi (1995) identify sub-stantial differences in development strategies across industries. For the stable and maturemainframe and microcomputer industries, the authors find that a compression strategysignificantly reduces time-to-market. The compression strategy is based on overlappingactivities, shortening activities, and rewarding developers for attaining the compressedschedule. However, in rapidly changing markets such as printers and personal computers( "high velocity environments" in the words of Eisenhardt 1989), the compression strat-egy (and thus overlap) does not provide a significant acceleration. The most performingstrategy under such conditions is an experiential strategy, which means using frequentiterations and short times between milestones. Eisenhardt and Tabrizi argue that com-pressing the development process through activity overlaps only yields a time reduction ifthe market environment is stable and predictable. Reports based on managerial experiencealso caution that overlapping should be used mainly for "moderate levels of innovation"(Cordero 1991).
Recently, a number of analytical models have been developed uncovering trade-offs in-volved in overlapping activities. Krishnan et al. (1997) develop an illustrative frameworkof two development activities, an information supplying upstream activity and an informa-tion absorbing downstream activity. The framework introduces the concepts of upstreamevolution and downstream sensitivity. Upstream evolution is defined as the reliability ofpreliminary information released by the upstream activity. If one takes the creation of adesign parameter (e.g., an axle diameter) as an example for the upstream output, one canplot the set of possible outcomes as a sequence of intervals. Initially, the interval for theparameter is wide, then narrows over time and converges to the outcome parameter. Thespeed of this convergence is called the evolution function. Thus, fast evolution representsan early resolution of uncertainty. Downstream .sensitivity is a measure of dependence and
3

describes how much downstream rework is caused by modifications coming from upstream.
Loch and Terwiesch (1996) conceptualize uncertainty in the form of engineering changes:the more uncertain the upstream activity, the more engineering changes (ECs) will occurduring the project. ECs have the universal characteristic that they become more difficultto implement the later they occur. Loch and Terwiesch formalize the problem of findingthe level of activity overlap that minimizes expected project duration, where engineeringchanges are generated stochastically. By performing sensitivity analysis on the optimallevel of activity overlap, they find that overlap gains increase with fewer and earlier engi-neering changes. They also show the impact of different communication patterns on theoverlap problem.
Ha and Porteus (1995) model the situation of two interdependent activities, product designand process design. In this situation, overlap is the "natural" way to proceed becauseotherwise severe quality problems result. Quality gains have to be traded off with timepenalties for cross functional meetings. The key question is how often to meet and update("how far to let one activity run ahead" ). The model shows that a weakening of thereciprocal dependence (i.e., the quality problems) makes the situation more similar to anupstream-downstream problem as in the models above, calling for less overlap. In addition,the authors recommend less overlap in the presence of high communication costs.
The present article uses the emerging Operations Management literature on activity over-lapping to develop a refined model of the relationship between overlap and project com-pletion time. It thus extends the earlier work on overlap by Takeuchi and Nonaka (1986)and Clark and Fujimoto (1991). The model is built around the new concept of uncertaintyresolution. We operationalize uncertainty resolution by providing a first measure and showhow it significantly influences the effectiveness of overlap. With the concept of uncertaintyresolution, we provide a more detailed description of project uncertainty than Eisenhardtand Tabrizi (1995), who view uncertainty as largely driven by the market environment.Having a measure of uncertainty resolution allows us to use a wider range of industriesin our sample (13 segments of the electronics industries compared to 4 in Eisenhardt andTabrizi) and thus to use a different econometric methodology.
4

3 Development of Hypotheses
The acceleration impact of overlap on project completion time has been reported in count-
less articles. The underlying reasoning for this acceleration effect is simple. Instead of
organizing a development project in a purely sequential manner performing one task af-
ter the other (Takeuchi and Nonaka call this "relay race"), the team should concurrently
work on several tasks. This facilitates communication between the tasks and also yields
an overall compressed development process.
Despite the popularity of the concept, few studies have managed to measure an acceleration
effect of overlap. Clark and Fujimoto (1991) find such an effect in their study of engineering
problem solving in the automobile industry. They define the "simultaneity ratio" as the
proportion of die development time that occurs in parallel to the die cutting process. Using
regression analysis, they then show a significant time-reducing effect of the simultaneity
ratio on engineering lead time (significant at the 5% level).
Using the same overlap measure, Eisenhardt and Tabrizi (1995) find similar results in
the mainframe and workstation industry (significant at the 10% level). These statistical
findings together with the widely quoted anecdotal evidence motivate our first hypothesis:
Hypothesis 1: Overlapping activities reduces project completion time.
However, a compression of the development process through overlapping requires a situa-
tion with limited uncertainty where changes are foreseeable and can be kept under control.
Otherwise, overlapping may cause substantial rework outweighing the time gain from over-
lapping. This is consistent with the Operations Management approaches to the problem
reviewed above. Krishnan et al.'s concept of the evolution function operationalizes the
resolution of uncertainty over time. The Krishnan et al. model hypothesizes larger over-
lap benefits for situations with fast evolution (uncertainty is reduced early) in contrast to
those with slow evolution: "Overlapping activities is generally easier when the upstream
evolution is fast rather than when it is slow (Krishnan et al. 1997)" . The concept is
illustrated for the case of a door handle, a pager, and for parts of a dashboard (Krishnan
1996).
In an analytical model, Loch and Terwiesch (1996) describe the concept of uncertainty
resolution as. the distribution of engineering changes over the course of the project. The
later an engineering change occurs, the more time it takes to adjust work by other activities
that are done concurrently. For example, a geometric change in the design of a plastic
5

component can be instantaneously implemented as long as the tooling process is working ata CAD level. Even with prototype tools changes can be performed rapidly. However, oncethe molds are made from a material suitable for volume production, the same engineeringchange can create major delays (Terwiesch 1997, Gatenby et al. 1994). Thus, the timegains resulting from overlapping activities are larger if uncertainty is reduced early in theprocess.
The idea of increasing the benefits of overlap by moving forward engineering changes hasalso been extensively discussed by practitioners under the name of "Frontloading". Front-loading refers to a number of methodologies including early reviews, rapid prototyping,and CAx technologies, that allow an earlier detection of potential engineering problems(Fujimoto 1996) and thus an earlier final specification of the product. Taking togetherthis industrial practice and the Operations Management approaches, we state our secondhypothesis as:
Hypothesis 2: In projects with fast uncertainty resolution, time gains from activity over-
lap are larger than in projects with slow uncertainty resolution.
Based on Hypothesis 2, it would be natural to expect that project managers minimizeproject completion time by optimizing overlap. Even if this optimization is not exact, onewould expect that the overlap decision at least goes in "the right direction," that is, thatless overlap is used when uncertainty resolution is slow.
This is consistent with the theoretical literature on overlap reviewed above (Krishnan et
al. 1996, Loch and Terwiesch 1996). It also is in line with previous research on projectmanagement as well as reports from practitioners (Cordero 1991). For example, bothMorris and Hough (1987) and Lincke (1995) recommend less overlap for high technology/ high uncertainty projects. We therefore state Hypothesis 3 as:
Hypothesis 3: Projects with fast uncertainty resolution use more activity overlap than
projects with slow uncertainty resolution.
From a methodological perspective, Hypothesis 2 suggests a moderation effect of uncer-tainty resolution: the impact of overlap on project duration increases with the abilityof the project team to reduce the uncertainty early in the process. The correspondingstatistical test for such a hypothesis consists of comparing regression coefficients acrossdifferent values of the moderating variable (Arnold 1982, Venkatraman 1989). Thus, weuse multiple regression analysis as our primary statistical tool. A support for Hypothesis 1would require a significant effect in a model with project completion time as the dependent
6

variable and overlap as an independent variable. Hypothesis 2 is supported, if the regres-
sion coefficients for the overlap variable differ across different levels of the uncertainty
resolution variable. Finally, support for Hypothesis 3 requires uncertainty resolution to
be a significant predictor of overlap.
4 Empirical Methodology
Our analysis is based on a sample of 102 electronics companies in the US, Japan, and
Europe. During 1992-1993, these companies completed detailed questionnaires on opera-
tions and strategy for one business unit as part of the "Excellence in Electronics" project
jointly undertaken by Stanford University, the University of Augsburg and McKinsey &
Company. Parts of the sample have already been used for other research projects (e.g.,
Eisenhardt and Tabrizi 1995, Terwiesch et al. 1996). Many worldwide leading electronics
companies agreed to participate in the survey, providing us with data on 12 of the 25
leading computer producers and four of the six biggest TV manufacturers. The unit of
analysis of our work is the individual development project. Each participating business
unit contributed two new product development projects.
4.1 Data Collection
Our analysis of product development in the electronics industry is only one part of a
larger data collection effort. In addition to product development, the overall instrument
contained questions on marketing, manufacturing, finance and top management, which
were used in other research projects (e.g. Terwiesch et al. 1998). The product development
part consisted of a group of general questions concerning product development practices
of the business unit, and a subsection for each of two specific projects. These were used for
the research presented in this article. To avoid biases coming from hindsight reasoning and
retrospective sensemaking, we focused on technical questions with closed form answers.
We organized the 204 projects into 14 product groups such as TV, medical devices, PC,
telephone, etc. This grouping allowed us to compare similar development projects with
one another and to standardize certain measures within a product subsample (see below).
Some of the projects were small, peripheral modifications involving only one or two engi-
neers. Since our research focus is on product development projects, we decided to omit 64
7

projects that had an effort of under five person years from our statistical analysis. Twoother projects were excluded because their technical content was unique in the sample,prohibiting benchmarking with others. The remaining sample included 140 observations.The subgroup sizes are reported in Table A in the appendix.
4.2 Measures
The duration of a development project is not only influenced by overlap. Previous researchidentified and confirmed the importance of several other predicting variables (e.g., Eisen-hardt and Tabrizi 1995), namely the use of testing, time span between milestones, thenumber of design iterations, and the length of the redesign intervals (to be defined below).We include these predictors in our regression analysis for two reasons. First, leaving outvariables which influence the dependent variable (project duration) can potentially createbiases. Second, in addition to the hypothesized moderating effect on overlap, uncertaintyresolution could also have similar effects on these other variables. The additional effectsof uncertainty resolution are thus interesting by-products of our statistical analysis.
Since our research focus is on development time, we used the standardized project duration
as our dependent variable. Project duration was defined as the time from the first projectmeeting until the targeted production volume had been reached and the production pro-cess had been stabilized. The standardization was performed by taking the differencebetween the project duration and its industry subsample average, divided by the industrysubsample average. That is, a project of average length in its product group was giventhe measure zero. Although projects within a subsample are homogeneous concerning thedeveloped product, they can still differ in their technical content. In this article we arenot interested in this size effect, but in the effect of different project management deci-sions. Since it is reasonable to assume that large projects take longer than small ones, wecontrolled for this size effect by including a control variable in the regressions. Size wasmeasured by project effort (in person years) and standardized as previously described.
In the questionnaire, a development project was structured into six phases: pre- develop-ment study (to completion of basic product requirements), conceptual design (to specifica-tion of all product functions), product design and engineering (to system testing release),system testing (to production release), final process development and scale-up (throughcompletion of pilot production run) and production start-up (to stabilization).
We measured overlap as the sum of the overlaps between subsequent phases divided by the
8

gross duration of the project without deducting overlap (i.e. the sum of the development
phases). The higher this ratio, the more overlap was used in the project. This measurement
of project concurrency follows the approach by Clark and Fujimoto (1991) and that of
Eisenhardt and Tabrizi (1995). Similarly, we defined testing as the ratio of the testing
phase duration and the sum of the other phase durations.
Time between milestones was measured by the average number of weeks between two of-
ficially scheduled project reviews. Only milestones with a detailed project review were
included. We measured the number of design iterations by asking how many redesign iter-
ations the product took before stabilization (as defined above: stable volume production).
A redesign iteration was defined as a modification of more than 10% of product compo-
nents. Prototyping is a typical example of such a type of iteration, whereas debugging
does not classify as an iteration. As products in the electronics industry are significantly
influenced by their software, we used as our measure the larger of the number of hardware
iterations and software iterations. For example, if a project had five hardware iterations
and seven software iterations, we used seven for our measure. Finally, we included the
frequency with which the focal business unit redesigns its products. This variable, called
redesign intervals, is measured in months. Frequent redesigns should yield a faster de-
velopment process as the business unit has more recent experience in undertaking similar
development projects and the level of technical obsolescence of the current product is lower.
As the magnitude of these items might substantially differ across product subsamples, all
three were standardized in the same way as project duration.
While the previous measures could be derived directly from the questionnaire, our measure
of uncertainty resolution had to be constructed by combining different items. An opera-
tionalization of the residual uncertainty over the project duration is not straightforward.
As a proxy, we used the three milestones "preliminary information release" , "detailed
specifications defined" and "specifications frozen" . These are well- known industry terms,
which we link with relative phase durations to create an uncertainty curve.
As an illustration, consider two projects. Project A (left in Figure 1), reaches the level
of preliminary information release after 10% of project time, detailed specifications were
defined after 30%, and the final specifications were reached after 50%. Project B first
releases information after 20%, detailed specifications after 50% and freezes the design
after 90% of the total project time. These data provide an uncertainty resolution curve.
As a measure of uncertainty resolution, we used the area of the shaded rectangles in Figure
1. Uncertainty resolution is faster for Project A which has the larger shaded rectangle area.
9

Project BProject A
FinalizedSpecification
DetailedSpecifications
ConceptSpecified
A 4,.. 4p ci,,.....,.....ii..„,:.1.y,?t,c...4.t. ...:.- sp. • - t".• r.,,, . , ),,..;
10% 30% 50% 100% Proportion ofProject Time
20% 50% 90% 100%
Figure 1: Measure of uncertainty resolution: uncertainty resolution is fast in the left
project (project A) and slow in the right project (project B)
Descriptive statistics and correlations among all variables are also given in the Appendix.
5 Regression Results
Model 1 shows the control effect of project size on the dependent variable. As expected,
the control variable is significant, but only 24% of the variance in project duration can be
explained by size. The second regression model adds the variables that we expected would
influence project duration. The estimated coefficients, model fit and significance are also
reported in Table 1.
Looking at the beta coefficient of overlap (-.59) and its significance level (1%) we find a
significant overlap benefit across levels of the contextual variable "uncertainty resolution".
More overlap yields shorter project duration with high statistical significance. We thus
find strong support for the main effect as outlined in Hypothesis 1. The overall fit of
Model 2 is surprisingly high: 45% of the variance is explained by our model, of which only
24% can be attributed to the control variable. This compares to 36% in the Clark and
Fujimoto study (where simultaneity ratio is significant at 5% level) and 35% to 47% in the
Eisenhardt and Tabrizi study (the authors have multiple regression models with overlap
being significant at the 10% level).
10
Variable Model 1 Model 2Project Size .155 *** .130 ***
Overlap -.591 ***Testing -.593 *
Time between Milestones .152 ***Iterations .146 ***Redesign Intervals .127 **Uncertainty Resolution -.044
Adj. R 2 .24 *** .445 ****<.10; **<.05; ***<.01;N=140
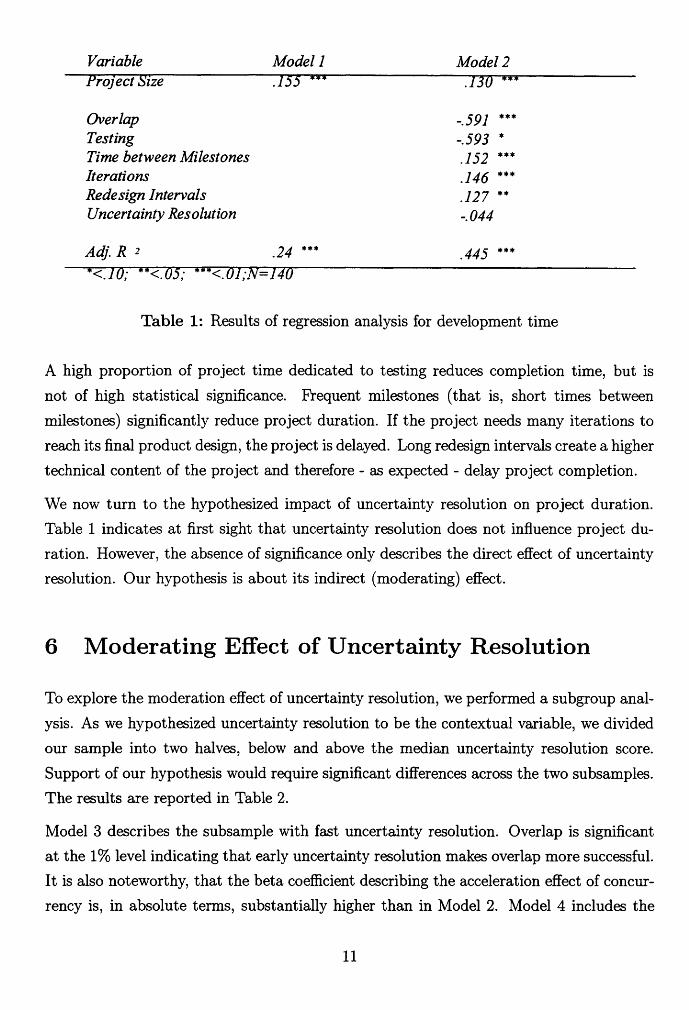
Table 1: Results of regression analysis for development time
A high proportion of project time dedicated to testing reduces completion time, but isnot of high statistical significance. Frequent milestones (that is, short times betweenmilestones) significantly reduce project duration. If the project needs many iterations toreach its final product design, the project is delayed. Long redesign intervals create a highertechnical content of the project and therefore - as expected - delay project completion.
We now turn to the hypothesized impact of uncertainty resolution on project duration.Table 1 indicates at first sight that uncertainty resolution does not influence project du-ration. However, the absence of significance only describes the direct effect of uncertaintyresolution. Our hypothesis is about its indirect (moderating) effect.
6 Moderating Effect of Uncertainty Resolution
To explore the moderation effect of uncertainty resolution, we performed a subgroup anal-ysis. As we hypothesized uncertainty resolution to be the contextual variable, we dividedour sample into two halves, below and above the median uncertainty resolution score.Support of our hypothesis would require significant differences across the two subsamples.The results are reported in Table 2.
Model 3 describes the subsample with fast uncertainty resolution. Overlap is significantat the 1% level indicating that early uncertainty resolution makes overlap more successful.It is also noteworthy, that the beta coefficient describing the acceleration effect of concur-rency is, in absolute terms, substantially higher than in Model 2. Model 4 includes the
11

Variable Model 3 a Model 4 bProject Size .155 ' .118 m
Overlap -.913 *** -.339Testing .041 -1.699 ***Time between Milestones .178 *** .111 *Iterations .196 *** .138 ***Redesign Intervals .106 .102
Adj. R 2 .48 *** .47 ****<.10; **<.05; '<.01a N=70: fast uncertainty resolutionb N= 70: slow uncertainty resolution
Table 2: Split sample analysis with uncertainty resolution
observations that have a slower uncertainty resolution than the median. The significantinfluence of overlap (at the 1% level in Model 3) disappears.
The significant influence of testing observed in Model 4, is in contrast to Model 3 (wheretesting has a positive sign). That is, testing in projects with fast uncertainty resolutionseems to have a delaying, rather than an accelerating effect. In a project with slowuncertainty resolution in contrast, testing contributes significantly to short developmenttimes. Its beta coefficient is, in absolute terms, far higher than in the overall regressionand highly significant (0.1% in Model 4).
In addition to testing and overlap, other variables also change significance: the practiceof frequent milestones seems less applicable in the case of late uncertainty resolution. Ifthe path of the project can not be predicted initially, milestones are difficult to defineand are thus a less effective way of time reduction. However, if the project is highlypredictable, milestones provide a useful tool for project management in keeping diverseactivities coordinated and maintaining control of the total project. This result is remark-able, as Eisenhardt and Tabrizi make "time between milestones" part of their experientialstrategy. Our observation that the effect of frequent milestones on project duration ismoderated by uncertainty resolution provides an interesting alternative explanation. It-eration has a delaying impact in both subsamples and remains unchanged from Model2. The variable redesign intervals loses its significance, compared to Table 1. As thesigns of the corresponding beta coefficients remain unchanged, we can attribute this loss
12

of significance to the reduced sample sizes (now 70 instead of 140).
The different beta coefficients and significance levels reported in Table 2 suggest thatuncertainty resolution has a moderating effect on project duration rather than a directone. However, to formally support our hypothesis, we need to test for a statistical differencebetween the beta coefficients of Models 3 and 4 (see our discussion under Hypothesis 3).This can be done using a simple t-test, which compares the value of the beta coefficients(-.913 vs -.339) relative to the estimated standard errors. The test is significant at the 5%level.
In order to test whether the way we divided the sample into subsamples was robust toperturbations, we used splits based on other subsample sizes (80:60, 60:80) in addition tothe median split (70:70). Repeating the statistical analysis as presented in Table 2 on thesemodified subsamples, we found that the structure of our results remained unchanged.
A more formal way of testing for the equality of coefficients of different regressions isgiven by the Chow-test (Chow 1960). To test whether the assumption of two separateregression models is correct, one starts with the null hypothesis that the regressions areidentical and sees whether or not this hypothesis can be rejected. The test is based on acomparison of the sum of squares for the two separate models (Models 3 and 4) and thesum of squares from the overall model (Model 2). In econometric terminology the modelusing two separate regressions is called unrestricted and the overall regression is calledrestricted. The Chow-test is an F-test where the degrees of freedom are given by thesample sizes (70 each in our case) and the number of restrictions on the beta coefficients.For our specific case, the test rejects the null hypothesis (at 5% significance), thus thebeta coefficients do change across subsamples.
To test Hypothesis 3, we divided our sample into two subgroups, below and above the me-dian value of the uncertainty resolution measure. Support of the hypothesis would requirea significant difference in overlap across these two subsamples. However, comparing themean overlaps across the two subgroups did not show any significant difference. More-over, a regression analysis with overlap as the dependent and uncertainty resolution as anindependent variable does not explain any variance. Thus, Hypothesis 3 is not supportedby our data.
Project managers in our sample did not choose the overlap level according to uncertaintyresolution. We admit that the recommendation to choose overlap in line with uncertaintyresolution is easily made ex-post. In other words, it is easy for the researcher to recommend
13
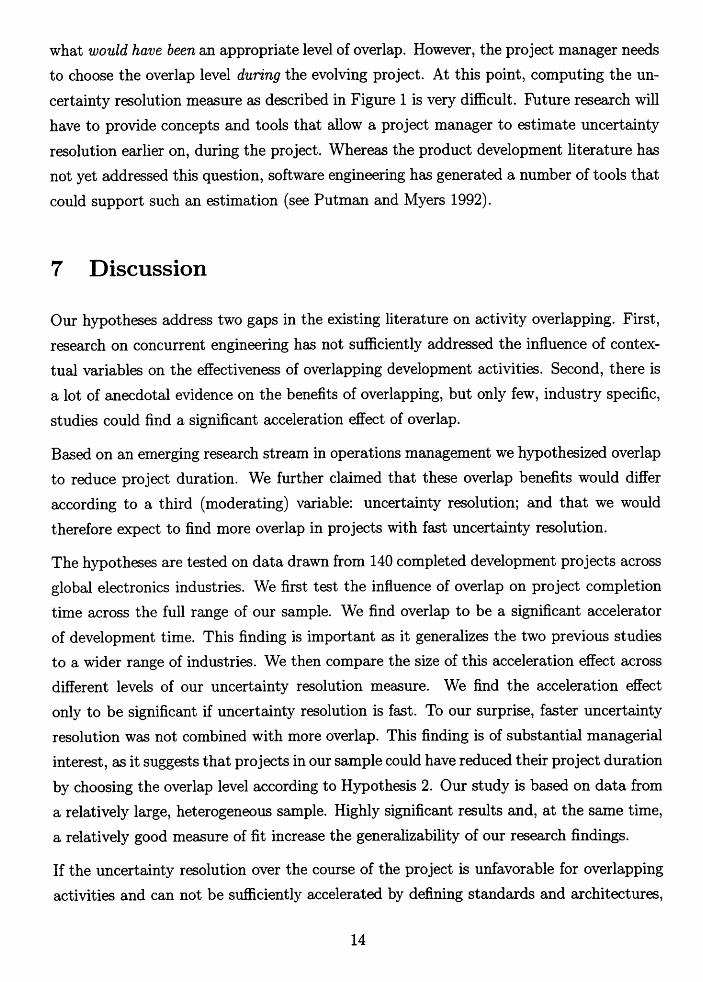
what would have been an appropriate level of overlap. However, the project manager needsto choose the overlap level during the evolving project. At this point, computing the un-certainty resolution measure as described in Figure 1 is very difficult. Future research willhave to provide concepts and tools that allow a project manager to estimate uncertaintyresolution earlier on, during the project. Whereas the product development literature hasnot yet addressed this question, software engineering has generated a number of tools thatcould support such an estimation (see Putman and Myers 1992).
7 Discussion
Our hypotheses address two gaps in the existing literature on activity overlapping. First,research on concurrent engineering has not sufficiently addressed the influence of contex-tual variables on the effectiveness of overlapping development activities. Second, there isa lot of anecdotal evidence on the benefits of overlapping, but only few, industry specific,studies could find a significant acceleration effect of overlap.
Based on an emerging research stream in operations management we hypothesized overlapto reduce project duration. We further claimed that these overlap benefits would differaccording to a third (moderating) variable: uncertainty resolution; and that we wouldtherefore expect to find more overlap in projects with fast uncertainty resolution.
The hypotheses are tested on data drawn from 140 completed development projects acrossglobal electronics industries. We first test the influence of overlap on project completiontime across the full range of our sample. We find overlap to be a significant acceleratorof development time. This finding is important as it generalizes the two previous studiesto a wider range of industries. We then compare the size of this acceleration effect acrossdifferent levels of our uncertainty resolution measure. We find the acceleration effectonly to be significant if uncertainty resolution is fast. To our surprise, faster uncertaintyresolution was not combined with more overlap. This finding is of substantial managerialinterest, as it suggests that projects in our sample could have reduced their project durationby choosing the overlap level according to Hypothesis 2. Our study is based on data froma relatively large, heterogeneous sample. Highly significant results and, at the same time,a relatively good measure of fit increase the generalizability of our research findings.
If the uncertainty resolution over the course of the project is unfavorable for overlappingactivities and can not be sufficiently accelerated by defining standards and architectures,
14

the project organization has to search for other means of uncertainty resolution. The useof prototypes is a well-known project management decision in such a contingency (e.g.,Wheelwright and Clark 1992). Instead of following an overlapped phase process, design-build-test loops are used as a learning facility. In that case, a project then experiences ahighly non-linear and iterative process which relies on experiencing product performancebased on testing. The regression reported above suggests testing as an alternative wayof reducing development time for projects where fast uncertainty resolution can not beachieved. The corresponding beta coefficient changes in the opposite direction to the oneof overlap. Such an approach is consistent with the Eisenhardt and Tabrizi concept of"experiential strategy" that relies on frequent iterations and the rapid building of experi-ence.
In our analysis, we have treated uncertainty resolution as an exogenous variable, thusoutside the scope of our model. As can be seen in Table B, this approach is correct froma purely statistical perspective: none of the other variables shows a significant correlationto uncertainty resolution. In an industrial context however, a project manager has moredecision variables than overlap alone. For example, Thomke (1997) shows how simulationand experimentation can help to eliminate uncertainty early in the development process.What exactly drives uncertainty resolution, how it can be estimated, and how it can bechanged by managerial action seems to be an interesting subject for future research.
8 Conclusion and Future Research
This article links two, up to now distinct, streams of research on concurrent engineering.The emerging construct of uncertainty resolution is found to significantly moderate theimpact of overlap on project duration (e.g. Eisenhardt and Tabrizi 1995). This confirmstheoretical work in operations management (Krishnan et al. 1997, Loch and Terwiesch1996) that indeed there are trade-offs in choosing the appropriate overlap level.
This view of concurrent engineering creates several opportunities for future research. First,new measures of uncertainty resolution will have to be developed. New measures shouldexplicitly consider the specific needs of project managers, who have to know the uncertaintyresolution ex-ante rather than ex-post. Second, we did not address the question of whereuncertainty resolution originates. Both, rapidly changing markets or uncertainty inherentin the technology may force project teams to freeze their specifications late. On the other
15

hand, uncertainty resolution may be an organizational capability that can be learned overthe course of several projects. Thus, demonstrating the importance of a fast uncertaintyresolution is only the first step. A next research step must provide better insights into theprocess of this uncertainty resolution. With the growing impact of information technologieson the product development process, the way companies resolve project uncertainty isdrastically changing and provides a third opportunity for further research.
References
Arnold, H. J., "Moderator Variables: A Clarification of Conceptual, Analytic, and Psy-chometric Issues", Organizational Behavior and Human Performance, 29 (1982), 143-174
Blackburn, J.D. (ed.) Time Based Competition: The Next Battleground in AmericanManufacturing, Business One Irwin, Homewood, 1991
Blackburn, J.D., G. Hoedemaker and L.N. Van Wassenhove, "Concurrent Software En-gineering: Prospects and Pitfalls" , IEEE Transactions on Engineering Management 43(1996), 179 - 188
Chow, G. C., "Tests of Equality between Sets of Coefficients in Two Linear Regressions",Econometrica, Vol. 28, July 1960, 591-605
Clark, K.B. and T. Fujimoto, Product Development Performance: Strategy, Organizatio-nand Management in the World Auto Industry, Harvard Business School Press, Cambridge1991
Clark, K. B. and S. C. Wheelwright (Editors), The Product Development Challenge,Harvard Business Review Book Series, 1994
Cordero, R., "Managing for Speed to Avoid Product Obsolescence: A Survey of Tech-niques", Journal of Product Innovation Management, 8 (1991), 4, 289-294
Cusumano, M. A. and R. W. Selby, Microsoft Secrets: How the World's Most PowerfulSoftware Company Creates Technology, Shapes Markets, and Manages People, The FreePress, New York 1995
Cusumano, M. A. and R. W. Selby, "How Microsoft Competes", Research TechnologyManagement, January - February 1996, 26 - 30
Eastman, R. M., "Engineering Information Release Prior to Final Design Freeze" , IEEETransactions on Engineering Management 27 (1980), 37 - 41
16

Eisenhardt, K.M., "Making Fast Strategic Decisions in High-Velocity Environments",Academy of Management Journal, Vol. 32 (1989), No 3, 543-576
Eisenhardt, K.M. and B. N. Tabrizi, "Accelerating Adaptive Processes: Product Inno-vation in the Global Computer Industry", Administrative Science Quarterly, 40 (1995),84-110
Fujimoto, T., "Corporate Engineering and Frontloading", Presentation at BMW Engi-neering Center, December 1996
Galbraith, J., Designing Complex Organizations, Addison Wesley, 1973
Gatenby, D., "Concurrent Engineering: An Enabler for Fast, High, Quality Product Re-alization", AT&T Technical Journal, Jan. 1994
Griffin, A., "The Impact of Engineering Design Tools on New Product Development Effi-ciency and Effectiveness", Proceedings of the 3rd EIASM International Product Develop-ment Conference, Fontainebleau, 1996, 363 - 380
Ha, A. Y., E. L. Porteus, "Optimal Timing of Reviews in Concurrent Design for Manu-facturability" , Management Science, Vol. 41 (1995), No. 9, 1431-1447
Imai, K., I. Nonaka, and H. Takeuchi, "Managing the New Product Development Pro-cess: Howthe Japanese Companies Learn and Unlearn", in The Uneasy Alliance, K.B.Clark,R.H. Hayes, and C. Lorenz Editiors, Harvard Business School Press, Boston 1985
Jaccard, J., R. Turrisi, C. K. Wan, Interaction Effects in Multiple Regression, Sage Uni-versity Paper (72), 1990
Krishnan, V., "Managing the Simultaneous Execution of Coupled Phases in ConcurrentProduct development", IEEE Transactions on Engineering Management, 43(1996), 210 -217
Krishnan, V., S. D. Eppinger, and D. E. Whitney, "A Model-Based Framework to OverlapProduct Development Activities", Management Science, Vol. 43 (1997), No. 4, 437-451
Lincke, W.,Simultaneous Engineering, Hanser 1995
Loch, C. H., C. Terwiesch, "Communication and Uncertainty in Concurrent Engineering",INSEAD Working Paper 68/96/TM, revised version is forthcoming in Management Science
Morris, P. W. G., and G. H. Hough, The Anatomy of Major Projects, Wiley, 1987
Putman, L., W. Myers, Measures for Excellence: Reliable Software on Time, Within
17

Budget, Prentice-Hall, 1992
Sabbagh, K., Twenty-First Century Jet, Scribner, New York 1996
Takeuchi, H. and I. Nonaka, "The New Product Development Game", Harvard BusinessReview 64 (1986), 137-146
Terwiesch, C., "Time and Information Problems in Overlapping Development Activities",PhD Dissertation, INSEAD, 1997
Terwiesch, C., C. H. Loch, M. Niederkofler, "Managing Uncertainty in Concurrent Engi-neering", Proceedings of the 3rd EIASM Conference on Product Development, 1996
Terwiesch, C., C. H. Loch, M. Niederkofler, "Where Product Development PerformanceMakes a Difference: A Statistical Analysis in the Electronics Industry" , Journal of ProductInnovation Management, Vol. 15, No. 1, 1998, 3-15
Thomke, S., "The Impact of Simulation on R&D Performance: Evidence from AutomotiveDevelopment", Working Paper HBS, WP#97-089
Tushman, M.L. and D.A. Nadler, "Information Processing as an Integrating Concept inOrganizational Design", Academy of Management Review, 21 (1978), 613-624
Venkatraman, N., "The Concept of Fit in Strategy Research: Toward Verbal and Statis-tical Correspondence", Academy of Management Review, Vol. 14 (1989), No 3, 423-444
Wheelwright, S. C. and K. B. Clark, Revolutionizing Product Development, The Free
Press, New York 1992
18
Appendix
The following two tables provide information on the sample composition and basic de-
scriptive statistics.
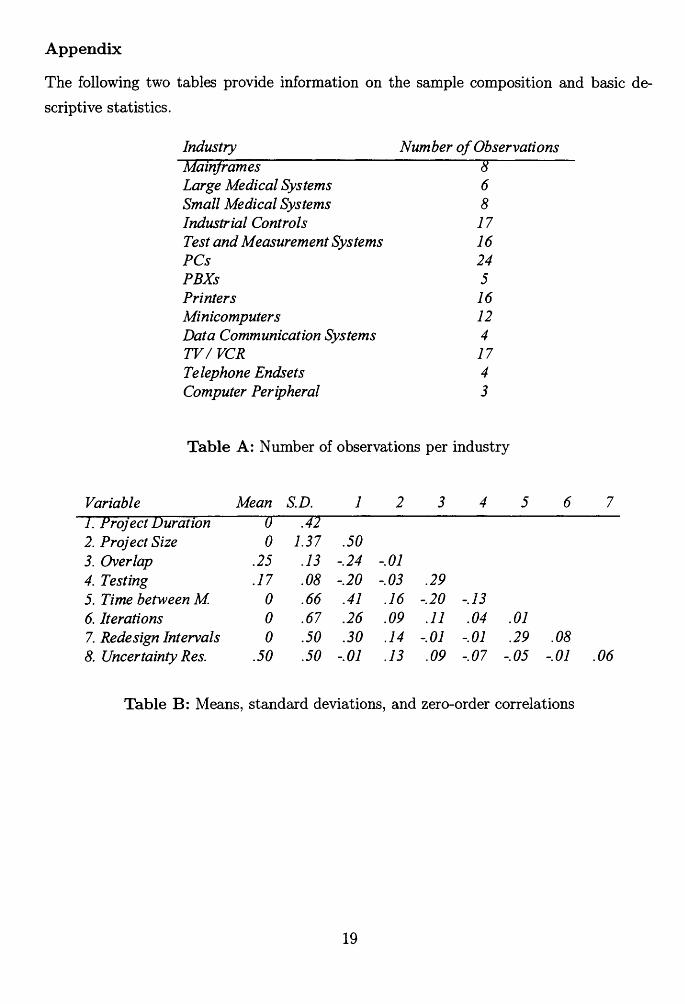
Industry Number of ObservationsMainframes 8Large Medical Systems 6Small Medical Systems 8Industrial Controls 17Test and Measurement Systems 16PCs 24PBXs 5Printers 16Minicomputers 12Data Communication Systems 4TV/ VCR 17Telephone Endsets 4Computer Peripheral 3
Table A: Number of observations per industry
Variable Mean S.D. 1 2 3 4 5 6 7I. Project Duration 0 .422. Project Size 0 1.37 .503. Overlap .25 .13 -.24 -.014. Testing .17 .08 -.20 -.03 .295. Time between M 0 .66 .41 .16 -.20 -.136. Iterations 0 .67 .26 .09 .11 .04 .017. Redesign Intervals 0 .50 .30 .14 -.01 -.01 .29 .088. Uncertainty Res. .50 .50 -.01 .13 .09 -.07 -.05 -.01 .06
Table B: Means, standard deviations, and zero-order correlations
19