MEASURING TECHNICAL AND ENVIRONMENTAL EFFICIENCY OF SUGARCANE FARMERS IN PUNJAB, PAKISTAN ·...
22
J Agric. Res., 2017, Vol. 55(2):387-408 ISSN: Online: 2076-7897, Print:0368-1157 http://www.jar.com.pk MEASURING TECHNICAL AND ENVIRONMENTAL EFFICIENCY OF SUGARCANE FARMERS IN PUNJAB, PAKISTAN Muhammad Salman Afzal, Maqsood Hussain*, Sarwat Zia**, Muhammad Ali Imran* and Arshed Bashir*** ABSTRACT This study was conducted at Institute of Agricultural and Resource Economics, University of Agriculture, Faisalabad, Pakistan during the year 2012 to sort out technical as well as environmental efficiency related to sugarcane crop in district Faisalabad. Stochastic production frontier approach (SFA) was used to estimate determinants. Primary data (120 respondents) were collected by conducting surveys of four villages of district Faisalabad through simple random sampling. The results showed that sugarcane producers were 88.8 percent technically efficient. Environmental efficiency for use of nitrogenous fertilizer alone was estimated at 50.2 percent and for pesticide alone was estimated at 38 percent. Environmental efficiency for both nitrogenous fertilizer and pesticide environmental efficiency was estimated at 45 percent because of more efficient use of fertilizer. This study also depicted that medium and large famers were environmentally less efficient as compared to small farmers. The findings suggest that role of agricultural extension is a big question. There is a need to train the farmers in a manner to achieve higher and efficient yield. Program should be initiated to educate the farmers regarding the optimum quantity use of inputs and at proper timings. Farmers should be informed to use recommended level of pesticide and fertilizer for the production of sugarcane. KEYWORDS: Saccharum officinarum; Stochastic frontier approach; technical; environmental; efficiency; pesticides; fertilizers; Pakistan. INTRODUCTION Sugarcane (Saccharum officinarum L.) is one of major cash crops of Pakistan that is cultivated twice (February and September) in a year. It contributes 0.7 and 3.4 percent share in gross domestic production (GDP) *Institute of Agricultural and Resource Economics, University of Agriculture, Faisalabad, **Pest Warning and Quality Control of Pesticides, (Plant Protection), Faisalabad, ***Social Sciences Research Institute (PARC), AARI, Faisalabad. Pakistan.
Transcript of MEASURING TECHNICAL AND ENVIRONMENTAL EFFICIENCY OF SUGARCANE FARMERS IN PUNJAB, PAKISTAN ·...
J Agric. Res., 2017, Vol. 55(2):387-408 ISSN: Online: 2076-7897, Print:0368-1157
http://www.jar.com.pk
MEASURING TECHNICAL AND ENVIRONMENTAL
EFFICIENCY OF SUGARCANE FARMERS IN
PUNJAB, PAKISTAN
Muhammad Salman Afzal, Maqsood Hussain*, Sarwat Zia**, Muhammad Ali Imran* and Arshed Bashir***
ABSTRACT
This study was conducted at Institute of Agricultural and Resource Economics,
University of Agriculture, Faisalabad, Pakistan during the year 2012 to sort out
technical as well as environmental efficiency related to sugarcane crop in
district Faisalabad. Stochastic production frontier approach (SFA) was used to
estimate determinants. Primary data (120 respondents) were collected by
conducting surveys of four villages of district Faisalabad through simple
random sampling. The results showed that sugarcane producers were 88.8
percent technically efficient. Environmental efficiency for use of nitrogenous
fertilizer alone was estimated at 50.2 percent and for pesticide alone was
estimated at 38 percent. Environmental efficiency for both nitrogenous fertilizer
and pesticide environmental efficiency was estimated at 45 percent because of
more efficient use of fertilizer. This study also depicted that medium and large
famers were environmentally less efficient as compared to small farmers. The
findings suggest that role of agricultural extension is a big question. There is a
need to train the farmers in a manner to achieve higher and efficient yield.
Program should be initiated to educate the farmers regarding the optimum
quantity use of inputs and at proper timings. Farmers should be informed to
use recommended level of pesticide and fertilizer for the production of
sugarcane.
KEYWORDS: Saccharum officinarum; Stochastic frontier approach; technical;
environmental; efficiency; pesticides; fertilizers; Pakistan.
INTRODUCTION
Sugarcane (Saccharum officinarum L.) is one of major cash crops of Pakistan that is cultivated twice (February and September) in a year. It contributes 0.7 and 3.4 percent share in gross domestic production (GDP)
*Institute of Agricultural and Resource Economics, University of Agriculture,
Faisalabad, **Pest Warning and Quality Control of Pesticides, (Plant Protection),
Faisalabad, ***Social Sciences Research Institute (PARC), AARI, Faisalabad. Pakistan.

M.S. Afzal et al.
J. Agric. Res., 2017, 55(2)
388
and value added in agriculture, respectively. The cultivated area and production of sugarcane both increased by 3.9 and 2.3 percent respectively in 2013-14 as compared to previous year. However, productivity or yield of sugarcane showed a minute positive growth of 0.9 percent in 2013-14 because water received very slowly in sugarcane areas (3). Punjab is the most important and biggest producer by producing 69 per cent of total production of sugarcane. As compared to other sugarcane growing countries, Pakistan ranked 6
th in
area, 11th in production and 60
th in yield in 2012-13 but in 2013-14 Pakistan
jumped up and ranked 5th among major sugarcane producing countries.
Although, Pakistan stays on 5th position in sugarcane production but in terms
of yield it stays on very low position among other countries. Yield of Pakistani sugarcane remains between 40-45 thousand tons per hectare which is significantly less than those obtained in other countries. As sugarcane is one of the major cash crops, therefore, efforts are required to improve its productivity (3). The efforts like improved seed production, quality control and distribution may bring substantial improvement in sugarcane yield but these efforts are highly dependent on availability of competent and skilled labor (5). The main reason of low yield is late payments made by sugar mills to farmers, so due to getting late and not gentle price, farmers got discouraged from the production of sugarcane. Late payments keep farmers out of money which delay irrigation time and fertilization. So farmers are not able to apply inputs timely which effects yield by getting it down. Second reason is that as sugarcane is water loving crop but it has to face insufficient availability of irrigation water. This may lead farmer towards inefficiency and wastage of resources and farmer doesn’t receive maximum output by using minimum inputs. So farmers have to focus on technical environmental inefficiency related issues and their all possible consequences. Technical efficiency measures maximum output produced by minimum use of inputs. Even though production of sugarcane is increased by 2.3 percent in 2013-14 as compared to last year but there are some factors affecting technical efficiency of sugarcane are extension services, availability of inputs, education, land holding, subsidies and market price. Sugarcane is water consuming crop and farmers are facing scarcity of this resource. Lack of availability of inputs on time also affects technical efficiency which results in

Technical and environmental efficiency of sugarcane farmers
J. Agric. Res., 2017, 55(2)
389
decrease in production. Now a days prices of fuel (diesel and petrol) are so much high that small farmers are not able to fulfill the requirement of crop because of limited budget. Extension services and technological advancement should also be introduced to farmers in to make them aware of new varieties and techniques to get maximum production of crop. Bakhsh (6) estimated technical efficiency and profitability of vegetable growers by adopting stochastic frontier production function in the province Punjab. He selected four vegetables (potato, carrot, radish, and bitter gourd) for the study. In this study the efficiency results of mean level of technical efficiency were 72, 82, 66 and 70 percent for carrot, reddish, bitter gourd and potato, respectively. He found that level of education and extension services showed positive results to technical efficiency but age factor was negatively related with efficiency. So, technical efficiency of vegetable growers could be increased by providing extension services and education to the farmers. On other side old farmers were technically less efficient than young farmers. Idiong (15) worked out to find technical efficiency of rice grown in Nigeria by taking sample of 112 small sale rice farmers. He adopted stochastic production function to evaluate efficiency and to find out factors causing inefficiency through maximum likelihood procedure. This study showed that mean value of technical efficiency among small scale farmers was 77, ranging between 48-99 percent. According to author, credit access, level of education and timely availability of inputs significantly contribute towards technical efficiency. So it is required to provide rice growers education, extension services, and credit facilities to increase their technical efficiencies. Travisi and Nijkamp (20) investigated and checked out multiple negative externalities of pesticide use in agriculture sector involving food safety related issues and destruction of farm land. This study was conducted in Northern Italy for estimating economic value of reduction in pesticide usage by adopting Choice Experiment approach. In this approach negative effects of pesticide usage were given monetary value that was cost of pesticides. The study concluded that respondents showed a high level of willingness to pay (WTP) a premium on agricultural goods produced within environmental friendly ways. Abedullah et al. (1) estimated technical and environmental efficiency of rice production by adopting translog stochastic production frontier approach. Author used chemical, pesticides and fertilizer as environmentally detrimental inputs. The mean value of technical efficiency index was very high (89

M.S. Afzal et al.
J. Agric. Res., 2017, 55(2)
390
percent) as comared to environmental efficiency that was only 14 percent. The results found that with high level of productivity can be achieved by reducing use of environmental detrimental inputs. Author concluded that by decreasing use of weedicide will save Rs.297 per acre and Rs.1307.3 million may be saved from rice crop in Punjab. Less use of weedicide will improve production of rice and the quality of environment. Bakhsh (8) estimated technical and environmental efficiency of bitter gourd in two districts of Punjab Pakistan. He used stochastic frontier production function to evaluate the technical efficiency but environmental efficiency was estimated by method generated by Reinhard et al. (18, 19). This study was carried out by taking sample from 90 bitter gourd growers. The mean level of technical efficiency was found 0.64 and environmental efficiency scores were 0.06 for pesticide and 0.69 for chemical fertilizer. So pesticides were not contributing so much to environment as compared to chemical fertilizer. The results of this study showed that irrigation water showed negative impacts towards technical efficiency and excessive use of chemicals and pesticides also showed less percentage of environmental efficiency. The present study was planned to estimate technical and environmental efficiency of sugarcane among different farmers, to evaluate factors causing inefficiencies in production of sugarcane and to suggest the recommendations related to inefficiency problem of sugarcane production.
MATERIALS AND METHODS
This study was conducted at the Institute of Agricultural and Resource Economics, University of Agriculture, Faisalabad, Pakistan. The study was based on set of cross sectional (primary) data collected during the year 2013, on a set of variables such as sugarcane yield, quantity of seed, quantity of nitrogenous and phosphorous fertilizer, and tube-well irrigations, number of tractor and labor hours and finally plant protection measures (pesticide and weedicide). In this nitrogen fertilizer and plant protection measures are used as environmental detrimental variables. In order to collect data simple random sampling technique was used. Data was collected from district Faisalabad of Punjab. Four tehsils i.e. Faisalabad, Samundri, Tandlianwala and Jaranwala were selected and one village was selected from each of tehsil for data collection. A sample of 120 farmers was taken as total by dividing equally into three groups (large, medium and small) by farm size. Environmental efficiency is defined as the ratio of minimum feasible use to an observed use of environmentally detrimental inputs, conditional on

Technical and environmental efficiency of sugarcane farmers
J. Agric. Res., 2017, 55(2)
391
observed level of output and the conventional inputs (17). So, environmental efficiency explains degradation impact on environment by use of an environmentally detrimental input. It is an input–oriented single factor measure of the technical efficiency of the environmentally detrimental input. This efficiency also shows differential reduction in application of inputs (4, 21). Environmental efficiency equation can be written as;
……………………………..(i)
Where is the minimum feasible use of environmentally detrimental input,
given production frontier is F ( and input and output are observed
conventional inputs and output. Technical efficiency is an output-oriented measure, as the ratio of observed to maximum feasible output, with given level of input and technology. Technical efficiency can be measured as;
T = …………………… (ii)
Analytical framework The present study is employing stochastic frontier production approach (SFA) introduced earlier (5, 6, 7). The general stochastic production frontier can be specified as,
……………………………………………… (iii)
Where respondents and inputs are represented by subscripts and ,
respectively. Yi = is sugarcane yield per acre Xij = is a vector (n×5) of normal inputs (with Xi1 is the seed, Xi2 is no. of
irrigation, Xi3 is no. of labor hours, Xi4 is active nutrients of nitrogen, Xi5 is is active nutrients of phosphorus, Xi6 is cost of pesticide).
Zij = is a vector (n×3) of environmentally detrimental inputs (with Zi1 is
active nutrients of nitrogen and Zi2 is cost pesticide and Zi3 is combined effect of Zi1 and Zi2).
Β = is parameter vector to be estimated.
M.S. Afzal et al.
J. Agric. Res., 2017, 55(2)
392
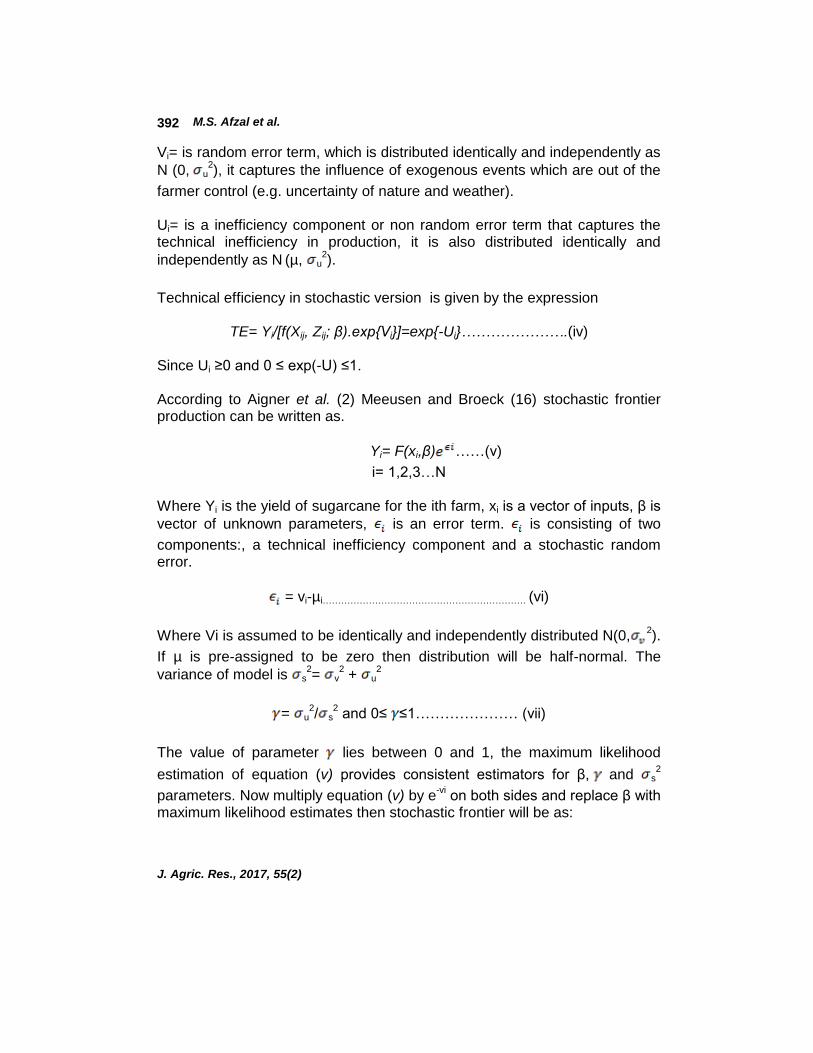
Vi= is random error term, which is distributed identically and independently as
N (0, u2), it captures the influence of exogenous events which are out of the
farmer control (e.g. uncertainty of nature and weather). Ui= is a inefficiency component or non random error term that captures the technical inefficiency in production, it is also distributed identically and
independently as N (µ, u
2).
Technical efficiency in stochastic version is given by the expression
TE= Yi/[f(Xij, Zij; β).exp{Vi}]=exp{-Ui}………………….(iv)
Since Ui ≥0 and 0 ≤ exp(-U) ≤1. According to Aigner et al. (2) Meeusen and Broeck (16) stochastic frontier production can be written as.
Yi= F(xi,β) ……(v)
i= 1,2,3…N
Where Yi is the yield of sugarcane for the ith farm, xi is a vector of inputs, β is
vector of unknown parameters, is an error term. is consisting of two
components:, a technical inefficiency component and a stochastic random error.
= vi-µi………………………………………………………… (vi)
Where Vi is assumed to be identically and independently distributed N(0,2).
If µ is pre-assigned to be zero then distribution will be half-normal. The
variance of model is s2= v
2 + u
2
= u2/ s
2 and 0≤ ≤1………………… (vii)
The value of parameter lies between 0 and 1, the maximum likelihood
estimation of equation (v) provides consistent estimators for β, and s2
parameters. Now multiply equation (v) by e-vi
on both sides and replace β with maximum likelihood estimates then stochastic frontier will be as:

Technical and environmental efficiency of sugarcane farmers
J. Agric. Res., 2017, 55(2)
393
Yi*= F(Xi, β
*)e
-ui= Yie
-vi ……………………………(viii)
Where Y
* is yield of sugarcane of ith farm adjusted for statistical random
noise captured by vi. Β* shows vector of parameters which are estimated by
maximum likelihood technique. The technical efficiency is captured by the one sided error term µi ≥ 0.
e-ui
=[Yi/F(Xi, β*)e
vi]…………………… (ix)
Technical inefficiency can be written as linear function of socio- economic and management factors.
IEi=F(Zj)……………………………. (x) Second thing is environmental efficiency which is to be determined. Environmental efficiency index is ratio of minimum feasibility to an observed input which is environmentally detrimental (18). Environmental efficiency can be determined by frontier function
………………..(xi)
Here, x is vector of inputs and Z shows those inputs which are environmentally detrimental like pesticide, fertilizer and chemicals. Y is output. The translog form of this function can be written as
…………………. (xii)
Environmental efficiency index can be measured as, where shows
environmental efficiency.
EE = Exp (lnEE) = θ = (θZ / Z) ………………(xiii)
Empirical analysis The fitness of frontier model is tested by using generalized likelihood-ratio test “LR”.
L=LR= -2ln[L(H0)/L(H1)] ………………… (xiv)

M.S. Afzal et al.
J. Agric. Res., 2017, 55(2)
394
Where L(H0) is the value of likelihood function for the frontier model and L(H1) is the value of the likelihood function for the general frontier model. Where L (H1) and L (H0) are the log-likelihood value of the full specification model and of the half specified respectively, specified by formulated null-hypothesis. The test statistics L is done under a chi-square distribution where degree of freedom is equal to the number of parameters, which is assumed to be zero in the null hypothesis. We cannot reject the null hypothesis when L is lower than the correspondent critical value (for a given significance level) and vice versa. The two most commonly used packages for estimating of stochastic production frontiers and inefficiency are FRONTIER 4.1 (12) and LIMDEP (14). In this study stochestic production function was estimated because this study also involves estimation of environmental efficiency and Cobb-Douglas production function cannot add new information in environmental efficiency analysis, so a stochastic translog production function was used to carry on this study. Translog production function can be written as, LnY = β0 + β1LnX1 + β2LnX2 + β3LnX3 + β4LnX4 + β5LnX5 + β6LnX6 +
β11LnX12 + β22LnX2
2 + β33LnX3
2 + β44LnX4
2+ β55LnX5
2 + β66LnX6
2
+β12LnX1LnX2+β13LnX1LnX3+β14LnX1LnX4+β15LnX1LnX5+β16LnX1LnX6 + β23LnX2LnX3 + β24LnX2LnX4 + β25LnX2LnX5 + β26LnX2LnX6 +β34LnX3LnX4+β35LnX3LnX5+β36LnX3LnX6+β45LnX4LnX5+ β46LnX4LnX6 + β56LnX5LnX6 + (Vi-Ui) ………..(xv)
Yi = yield of sugarcane per acre (monds/acre) X1 = amount of seed per acre (kg) X2 = no. of irrigations by tubewell X3 = no. of labor hours spent X4 = nutrients of nitrogen fertilizer (kg) X5 = nutrients of phosphorous fertilizer (kg) X6 = cost of pesticide (Rs.) Vi = it accounts for random variation in output due to those factors on
which farmers have no control, e.g. weather and disease outbreak.
Ui = represents inefficiency in production relative to stochastic frontier. Ln = represents the logarithms to the base and i-subscript shows ith
farmer. Second objective is to estimate environmental efficiency of sugarcane crop by considering X6 (cost of pesticide) as environmental detrimental input. In above equation X6 will be changed as Z and new equation will generate.

Technical and environmental efficiency of sugarcane farmers
J. Agric. Res., 2017, 55(2)
395
Ln = β0+β1LnX1 + β2LnX2 + β3LnX3 + β4LnX4 + β5LnX5+β6LnZ6 + β11LnX12
+ β22LnX2
2 + β33LnX3
2 + β44LnX4
2 + β55LnX5
2 + β66LnZ6
2 + β12LnX1LnX2+
β13LnX1LnX3+β14LnX1LnX4+β15LnX1LnX5+β16LnX1LnZ6+β23LnX2LnX3+β24LnX2
LnX4+β25LnX2LnX5+β26LnX2LnZ6+β34LnX3LnX4+β35LnX3LnX5+β36LnX3LnZ6+β4
5LnX4LnX5+β46LnX4LnZ6+β56LnX5LnX6+(Vi-Ui) ……….(xvi)
Now replace Z with Z by assuming technical inefficiency of farmers
approaches to zero (Ui=0). Where Z shows the efficient level use of
pesticide. LnY = β0 + β1LnX1 + β2LnX2 + β3LnX3 + β4LnX4 + β5LnX5 + β6Ln Z6+ β11LnX1
2
+ β22LnX22 + β33LnX3
2 + β44LnX4
2 + β55LnX5
2 + β66Ln Z6
2 + β12LnX1LnX2 +
β13LnX1LnX3 + β14LnX1LnX4 + β15LnX1LnX5 + β16LnX1Ln Z6 + β23LnX2LnX3 +
β24LnX2LnX4 + β25LnX2LnX5 + β26LnX2Ln Z6 + β34LnX3LnX4 + β35LnX3LnX5 +
β36LnX3Ln Z6 + β45LnX4LnX5 + β46LnX4Ln Z6 + β56LnX5Ln Z6 + (Vi-
Ui)…………(xvii) Now by using equation (xii) subtracting equation (xvi) from equation (xvii), we
will be able to get L Z-LZ which is equal to LnEE.
0 = β66(Ln Z-LnZ)
2 +(β6 + β16LnX1+β26LnX2+β36LnX3+β46LnX4+β56LnX5)+u
For the estimation of environmental efficiency include the nitrogen fertilizer (X4) alone the equation becomes
0= β44(Ln Z-LnZ)
2 + (β4 + β14LnX1 + β24LnX2 + β34LnX3+β45LnX5+β46LnX6)+ u
For the estimation of combined environmental efficiency of both pesticide and nitrogen fertilizer the quadratic equation can be written as,
0 = β44 + β66 + β46(Ln Z-LnZ)
2 + β4 + β6 + β14LnX1 + β24LnX2 + β34LnX3 +
β45LnX5 + β16LnX1 + β26LnX2 + β36LnX3 + β46LnX4 + β56LnX5(Ln Z-LnZ) + u
All of above quadratic equations can be solved by using quadratic formulae —————
-b +√B2 – 4AC LnEE =Ln Z-LnZ = ————————
2a

M.S. Afzal et al.
J. Agric. Res., 2017, 55(2)
396
Determinants of inefficiencies The index of technical and environmental inefficiencies is regressed on socio-economic variables indicating possible effects of farmer’s personal characteristics and farming conditions on technical formulation could be used to influence these variables so as to enhance the technical efficiency of the farmers.
Ui = δ0 + δ(Z1) + δ(Z2) + δ(Z3) + δ(Z4) + δ(Z5) + δ(Z6) + δ(Z7) Z1 = is the Age in year of the ith farmer Z2 = is the farming experience in year of ith farmer Z3 = is the off farm income Z4 = is the dummy variable: 1 if farmer avails extension services, 0
otherwise Z5 = size of household of farmers Z6 = is dummy variable: 1 if farmer avails credit, 0 otherwise Z7 = is distance between farm and market
For the measurement of farm specific technical efficiency (T.E.) following model was used:
T.Ei = Yi/Y* = exp(-Ui)
Yi*
= frontier output, Output elasticities εi = ϐLny/ϐLnXi and Cross Elasticities εij = [βij/εi + εj ]+1.
RESULTS AND DISCUSSION
The software FRONTIER 4.1 was used to estimate stochastic frontier production function for the study of cross sectional data. Coelli (13) proposed a model in which inefficiency effects in a stochastic production frontier are a function of other explanatory variables.
The variance parameters are expressed in terms of parameterization, σv2 +
σu2 = σs
2 and σu
2 /σs
2, where the parameter has a value between 0 and
1. This study comprises an objective of estimation of technical efficiency of sugarcane. Here we use maximum likelihood method to determine either inefficiency exists or not. In hypothesis Ho it is assumed that there is no technical inefficiency. So here log likelihood ratio is used to find results, as given below,
λ = -2*Ln[L(H1) – L(H0)]

Technical and environmental efficiency of sugarcane farmers
J. Agric. Res., 2017, 55(2)
397
Here L(H1) is log likelihood value obtained from ordinary least square regression. L(H0) is log likelihood value obtained from maximum likelihood estimates. If value of λ is greater than the table value of mixed chi-square distribution, then reject H0 specifying that there is no technical inefficiency. Λ = -2*[79.2-140.83], σ
2 = 0.207, γ = 0.82, λ = 123.26, Table value = 10.17
So, H0 will be rejected by showing the existence of technical inefficiency.
Table 1. Estimated values of parameters of trans log stochastic production function.
Parameters Values T- Ratios
β0 00.121 0.13ns
β 1 -0.368 -5.2
β 2 -2.95 -3.16*
β 3 -0.812 -2.6*
β 4 0.67 0.71ns
β 5 -0.49 -0.45ns
β 6 3.14 4.17*
β 11 0.745 1.44ns
β 22 -0.588 -2.4*
β 33 0.13 0.81ns
β 44 0.265 0.85ns
β 55 -0.352 -1.23ns
β 66 -0.153 -0.81ns
β 12 0.236 2.57*
β 13 0.72 2.39*
β 14 -1.73 -7.5*
β 15 0.94 5.06*
β 16 -0.0882 -8.3*
β 23 -0.637 -1.6ns
β 24 0.907 5.25*
β 25 -0.543 -2.87*
β 26 0.243 3.04*
β 34 0.547 2.7*
β 35 -0.166 -0.85ns
β 36 -0.322 -2.9*
β 45 0.373 2.61*
β 46 -0.231 -2.87*
β 56 -0.103 -2.08* Source: Author’s own calculation
Output elasticities
The data (Table 2) show that output elasticity for the amount of seed is positive and it can be explained as one percent increase in amount of seed is

M.S. Afzal et al.
J. Agric. Res., 2017, 55(2)
398
sown the output will increase by 6.1 percent. There is a positive relationship between output and amount of seed sown in farm for the production of sugarcane crop. So output can be increased upto a certain limit by increasing the seed of sugarcane upto an appropriate level. The output elasticity of numbers of irrigations is positive and it can be expressed as one more irrigation of water is applied then output will be increased by 5.8 percent. There is a positive relation between output and number of irrigation water. As sugarcane is water loving crop it requires large number of irrigations . Although surface water has become vanished and farmers are utilizing more of ground water, which is not of good quality and not good for agricultural crops. The output elasticity for labor hour spent in farm practices is positive, it can be expressed as; one more hour will be spent, more the output will increase by 0.045 monds. It can also be expressed as labor hour spent increase by one percent then output will increase by 4.5 percent. This factor is causing a significant variation in output of sugarcane because of having positive relationship. When more time will be given to farm practices, seed bed preparation, hoeing and planking then quality of soil will improve and it will generate maximum output. These results are in line with earlier findings (1, 6, 7).
Table 2. Output Elasticities
Variables Mean Maximum Minimum Standard
deviation
X1 0.06193 0.072 0.049 0.00534
X2 0.058 0.041 0.067 0.00535
X3 0.0454 0.131 -0.010 0.0258
X4 0.102 0.178 -0.09 0.05
X5 0.04 0.045 0.031 0.003
X6 0.064 0.069 0.061 0.0019 Source: Author’s own calculation
The output elasticity for application of nitrogenous fertilizer is also positive and it can be explained as one percent increase in application of nitrogenous fertilizer will cause output to increase by 10.2 percent. Punjab soils are almost deficient in nutrients necessary for the production of agricultural crops. So level of such nutrients is recovered by application of fertilizer, it gears up ability of soil to produce optimum production level. So that’s why there is positive relation between output and nitrogenous fertilizer. The output elasticity of phosphorous fertilizer is also positive but it is causing smaller variation in output as compared to nitrogenous fertilizer. It can be expressed as one percent increase in phosphate will lead to increase in output by 4

Technical and environmental efficiency of sugarcane farmers
J. Agric. Res., 2017, 55(2)
399
percent. Phosphate is used in lesser amount as compared to nitrogen. Because farmers use DAP and urea and nitrogen is present in both fertilizers but phosphate is present only in DAP. Mostly farmers use more bags of urea as compared to DAP. So, that’s why phosphate nutrients show less variation in output of sugarcane. The output elasticity for cost of pesticide use is also positive which can be expressed as one percent increase in use of pesticide causes to increase in output by 6.4 percent or it may be expressed as one more rupee is spent on use of pesticide it will lead to increase in output by 0.064 maunds. These findings are in line with previous results (15,19,20,21).
Cross elasticities
Cross elesticities show the effects of interaction terms on output of sugarcane. If cross elasticity of two inputs is negative then it shows that these two inputs are competitive with each other. If cross elasticity between two inputs is positsive then it shows complementary relation between those inputs. Competitive inputs are those if one input can be applied in place of other input showing competitive relationship between them. There are five negative cross elaticities showing competitive relationship and 11 are positive cross elasticities showing complementary relationship with each other (Table 3).
Table 3. Cross elasticities
Variables Values Standard deviation
X12 0.565 0.254
X13 1.56 10.00
X14 9.76 0.010
X15 -0.174 0.0265
X16 -0.0663 0.16
X23 0.481 1.17
X24 0.526 1.85
X25 0.568 0.011
X26 -0.162 0.0011
X34 0.469 0.099
X35 0.211 3.53
X36 0.398 0.333
X45 -3.706 2.43
X46 -0.99 104.11
X56 0.0421 0.00814 Source: Author’s own calculation
The cross elasticity between amount of seed and number of irrigation is positive showing complementary relationship with each other. The cross elasticity between amount of seed and number of labor hour is positive also showing complementary relationship with each other. The cross elasticity

M.S. Afzal et al.
J. Agric. Res., 2017, 55(2)
400
between amount of seed and nitrogen nutrients is positive showing a complementary relationship with each other. The cross elasticity between amount of seed and phosphorous nutrients is negative showing a competitive relationship with each other. The cross elasticity between amount of seed and pesticide cost is also negative showing a competitive relationship with each other. The cross elasticity between number of irrigations and labor hour is positive showing a complementary relationship with each other. The cross elasticity between number of irrigation and nitrogen nutrients is positive showing a complementary relation with each other. The cross elasticity between number of irrigations and phosphorous is positive showing complementary relationship with each other. The cross elasticity between number of irrigations and pesticide cost is negative showing a competitive relationship with each other. The cross elasticity between labor hour and nitrogen nutrients is positive which means a complementary relationship between them. The cross elasticity between labor hour and phosphorous nutrients is positive showing a complementary relationship. The cross elasticity between the labor hour and pesticide cost is positive sowing a complementary relation with each other. The cross elasticity between nitrogen nutrient and phosphorous is negative showing competitive relationship with each other. The cross elasticity between phosphorous and pesticide cost is negative which shows a competitive relation with each other. These results are comparable with earlier studies (1, 6, 7).
Estimates for technical efficiency
The data (Table 4) indicated that overall average estimated technical efficiency is 88 percent for the production of sugarcane. It means that farmers are 88 percent technically efficient and almost 12 percent are technical inefficient because of socioeconomic factors, as it is discussed earlier that technical inefficiency is caused by socioeconomic factors. According to data, where range of technical efficiency and number of farmers are given, between the range 0.4-0.59, there are only 6 farmers with percentage of 5, 0.60-0.89 contains 37 farmers with 30.8 percent and 0.89-1 contains 77 farmers with 64.16 percent. So this study reveals that large farmers were more than 89 percent technical efficient. Similar findings have also been reported earlier (1, 6, 15).

Technical and environmental efficiency of sugarcane farmers
J. Agric. Res., 2017, 55(2)
401
Table 4. Estimates for technical efficiency
Values Frequency Percentage Cumulative
Frequency
Percentage
0.4-0.59 6 5 6 5
0.6-0.89 37 30.8 43 35.8
0.88-1 77 64.16 120 100
Total 120 100 120 100 Source: Author’s own calculation
Estimates for environmental efficiency for the pesticide use alone Pesticide is one of environmental detrimental inputs, it can create many severe environmental and health for the farmers who work in field. Table 5 shows that farmers are environmentally less efficient for use of pesticide. The overall average value for environmental efficiency only for the use of pesticide is 39 percent, which may be expressed as output can be sustained by decreasing the pesticide cost by 52 percent. This means that pesticide was not so much good for the best interest of farmers and environment.
Table 5. Estimates for environmental efficiency for pesticide alone
Values Frequency Percentage Cumulative
Frequency
Percentage
0.1-0.39 65 54.1 65 54.1
0.40-0.69 42 35 107 89.16
0.7-0.89 9 7.5 116 96.6
0.9-1 4 3.33 120 100
Total 120 100 120 100 Source: Author’s own calculation
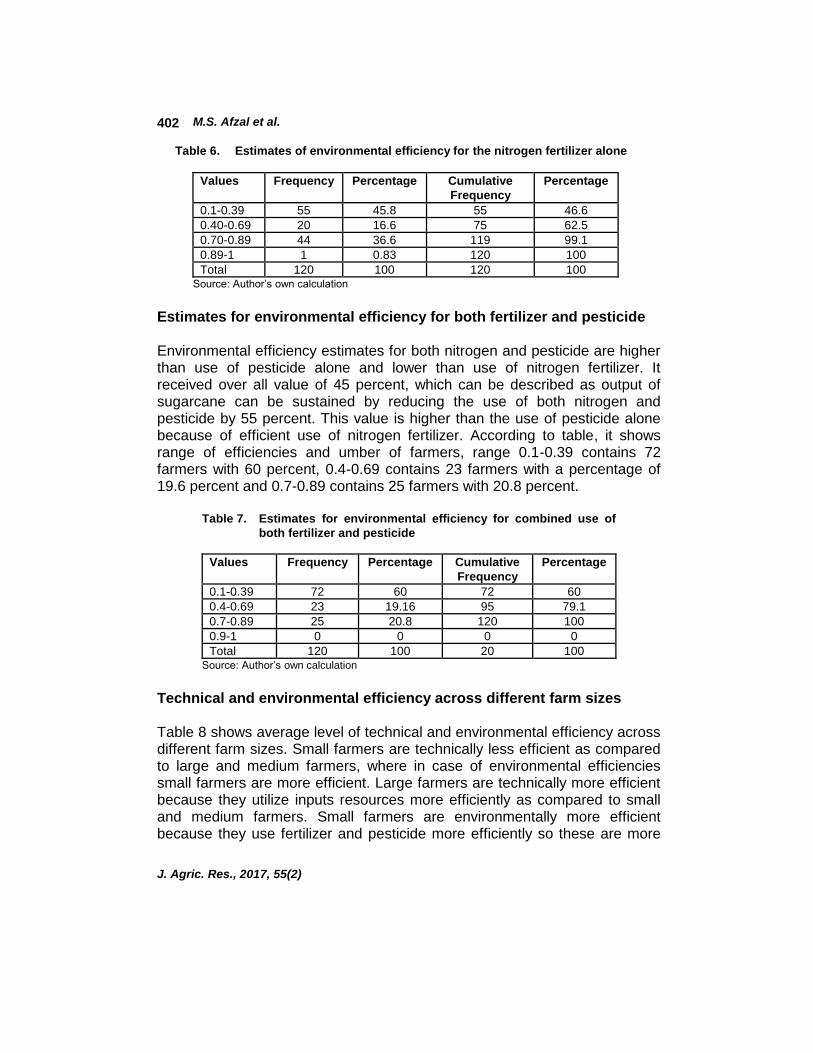
Estimates of environmental efficiency for the nitrogen fertilizer use
alone
In this study over all environmental efficiency for the use of nitrogenous fertilizer is estimated at 50.2 percent, it explains that output can be sustained by decreasing the nitrogenous fertilizer by 49.8. percent. According to data, where range of environmental efficiency and number of farmers are given, 0.1-0.39 contains 55 farmers with a percentage of 45.8 percent, 0.40-0.69 contains 20 farmers with 16.6 percentage, 0.70-0.89 contains 36.6 percent of farmers, 0.89-1 contains 1 farmer with 0.83 percentage. It describes that fertilizer was used more efficiently as compared to pesticide.
M.S. Afzal et al.
J. Agric. Res., 2017, 55(2)
402
Table 6. Estimates of environmental efficiency for the nitrogen fertilizer alone
Values Frequency Percentage Cumulative
Frequency
Percentage
0.1-0.39 55 45.8 55 46.6
0.40-0.69 20 16.6 75 62.5
0.70-0.89 44 36.6 119 99.1
0.89-1 1 0.83 120 100
Total 120 100 120 100 Source: Author’s own calculation
Estimates for environmental efficiency for both fertilizer and pesticide Environmental efficiency estimates for both nitrogen and pesticide are higher than use of pesticide alone and lower than use of nitrogen fertilizer. It received over all value of 45 percent, which can be described as output of sugarcane can be sustained by reducing the use of both nitrogen and pesticide by 55 percent. This value is higher than the use of pesticide alone because of efficient use of nitrogen fertilizer. According to table, it shows range of efficiencies and umber of farmers, range 0.1-0.39 contains 72 farmers with 60 percent, 0.4-0.69 contains 23 farmers with a percentage of 19.6 percent and 0.7-0.89 contains 25 farmers with 20.8 percent.
Table 7. Estimates for environmental efficiency for combined use of
both fertilizer and pesticide
Values Frequency Percentage Cumulative
Frequency
Percentage
0.1-0.39 72 60 72 60
0.4-0.69 23 19.16 95 79.1
0.7-0.89 25 20.8 120 100
0.9-1 0 0 0 0
Total 120 100 20 100 Source: Author’s own calculation
Technical and environmental efficiency across different farm sizes Table 8 shows average level of technical and environmental efficiency across different farm sizes. Small farmers are technically less efficient as compared to large and medium farmers, where in case of environmental efficiencies small farmers are more efficient. Large farmers are technically more efficient because they utilize inputs resources more efficiently as compared to small and medium farmers. Small farmers are environmentally more efficient because they use fertilizer and pesticide more efficiently so these are more

Technical and environmental efficiency of sugarcane farmers
J. Agric. Res., 2017, 55(2)
403
efficient as compared to large and medium farmers. By reducing use of fertilizer by 55 percent the cost of production for small, medium and large farmers will decrease and they will save Rs.4433.55, Rs.5197.5 and Rs.6042.94 respectively. For reducing the use of pesticide small, medium and large farmers can save Rs.612.87, Rs.999.9 and Rs.1225.27 respectively. These results are also in lines with previous findings (1, 6, 7).
Table 8. Technical and Environmental efficiency across different farm size
Farm size T.E (%) EE for nitrogen
(%)
EE for pesticide
( %)
EE for combined
fertilizer+pesticide (%)
Small 85 63 41.4 58
Medium 88 48 36.2 42
Large 92.9 39 34.1 35 Source: Author’s own calculation
Determinants of inefficiencies Second objective of this study was to find determinants of inefficiencies in production of sugarcane. Technical and environmental inefficiencies are caused by socioeconomic variables e.g., age, experience, off-farm income, extension services, excess to credit, size of household and market distance. Table 9 shows that experiences, off-farm income, size of household and market distance are significant at 5 percent level of significance while age, extension services and access to credit are significant at 1 percent level of significance.
Table 9. Coefficient estimates of determinants of inefficiency.
Parameters Coefficients Standard
Deviation
T ratios
δ0 0.0042 0.99 0.0042**
δ1(age) 0.017 0.054 0.33**
δ2 (experience) -0.061 0.055 1.09*
δ3 (off-farm inc) -0.000052 0.00001 1.53*
δ4 (ext.srvc) -0.0044 0.098 0.044**
δ5 (H.H. size) -0.058 0.0215 2.7*
δ6 (credit facilities) -0.00106 0.0511 0.027**
δ7 (market distance) 0.0091 0.00696 1.31* Source: Author’s own calculation, Note: *, **shows significance at 5,1 percent respectively)
In socioeconomic factors age and market distance contribute in inefficiency positively, whereas experience, access to credit, availability of extension services, size of household and off farm income contribute in inefficiency

M.S. Afzal et al.
J. Agric. Res., 2017, 55(2)
404
negatively. It means age and large distant from market farmers were more inefficient and experienced, credit availed, large family size farmers more efficient in the production of sugarcane crop. According to this study large farmers are able to get credit facilities more easily, so they are technically more efficient than small and medium farmers. Small farmers are not able to avail and get extension services as easily got by medium and small farmers, so they are not so much aware of new cropping technologies and techniques for the production of sugarcane. The farmers with large family size and locating near markets are also technically more efficient in the production of sugarcane. These results of inefficiency agree to those of earlier findings (1, 6, 7, 15).
CONCLUSIONS The technical efficiency was found in this study at 88.8 percent, this means that 11 percent output could be increased by using same resources more efficiently. The average values of technical efficiency for small, medium and large farmers were 85, 88 and 92.9 percent, respectively. This study shows that large farmers were technically more efficient as compared to small and medium farmers. Fertilizer and pesticide were selected as environmental detrimental inputs for the estimation of environmental efficiency. The results of this study showed that use of pesticide alone yields environmental efficiency about 38 percent and the use of nitrogenous fertilizer alone is responsible for 50.2 percent. It means that nitrogenous fertilizer was being used more efficiently as the combination of both nitrogenous fertilizer and pesticide is responsible for about 45 percent environmental efficiency. Environmental efficiency with 45 percent means that substantial reallocation by decreasing the both nitrogen and pesticide by 55 percent out could be increased. For the use of nitrogen fertilizer alone the average environmental efficiencies for small, medium and large farmers were found 63 percent, 48 percent and 39 percent, respectively. For the use of pesticide alone the average environmental efficiency for small, medium and large farmers were found 41.4, 36.2 and 34.1 percent, respectively. For the combined use of nitrogen fertilizer and pesticide the average environmental efficiency for small, medium and large farmers were found 58, 42 and 35 percent, respectively. The results showed that small farmers were more technically efficient because they use lesser fertilizer and pesticide as compared to medium and large farmers. Provision of extension services, experience, size of land holding, credit facility and off farm income are major factors of technical efficiency. In this

Technical and environmental efficiency of sugarcane farmers
J. Agric. Res., 2017, 55(2)
405
study it is found that large farmers have more technical efficiency than small farmers because of having more extension services, experience, size of land holding and off farm income as compared to small farmers. Large farmers are financially strong so it is easy for them to get agriculture information regularly and consistently. Because of having large land holding they can use more modern and mechanized methods for production of sugarcane. Ease in credit access and high off farm income also keep level of large farmers up as compared to small farmers. As large farmers are full of resources they use more fertilizers and pesticides which harm the environment so it leads them to be more environmentally inefficient as compared to small farmers.
RECOMMENDATIONS In view of foregoing findings of the study, the following suggestions are put forth for the consideration of scientist, planner and policy makers. The role of agricultural extension is a big question in study area. The important role that it can play in increasing the productivity of this major cash crop and improve the efficiency of sugarcane farmers in study area is being ignored continuously. District Government should checked whether the extension department in the study areas is playing its important role in the fields on daily basis. Agricultural extension department should conduct workshops on regular basis in the fields to train the farmers in a manner to achieve higher and efficient yield. Thus in order to have a significant effect of credit on productivity, it is suggested that the small farmers should be provided an easy access to credit. Administrative hurdles should be eliminated and strict vigilance in the use of credit be ensured. It is also recommended that credit should be given to farmers in the shape of kind rather than cash to reduce the chances of its mis-utilization. Credit for mechanization in agriculture should be increased in order to capture its long-run impact on productivity. The field officers responsible for monitoring the activities of farmers should also be trained and motivated to ensure proper utilization of resources. This will help in fetching fair returns from the utilization of credit thus leading to improvement in productivity of sugarcane crop in study area. The results of present study shows that education has also been observed to affect the technical efficiency of the sugarcane farmers in positive manner. Therefore the extension department of the study area should initiate the programme to educate the farmers regarding the optimum quantity use of

M.S. Afzal et al.
J. Agric. Res., 2017, 55(2)
406
inputs and at proper timings. This department should also organize seminars, demonstration plots, radio/TV programs and informal training programmes, etc. that can help the farmers besides the formal schooling to obtain maximum net returns. Farmers should be regularly contacted by the agricultural extensions workers and different pesticides and fertilizer technical field staff through various ways and means (seminars, research trials, field days, team training, farmers meeting) in the study area. The basic purpose of these activities is to enhance farm productivity & profitability by improving farmer's knowledge & perception on balanced pesticides and fertilizer use in the study area. This educational programme should be run on well planned activities. Farmer should be informed to use recommended level of pesticides and fertilizers recommended by agricultural department for the production of sugarcane crop in particular area to make the farmers environmental efficient with respect to the application of fertilizers and pesticides in study area. According to Sugar Factories Control Act (1950) the purchaser is bound to make payments within one week after demand. The Deputy Commissioners should take steps under existing laws to ensure timely payments and recover outstanding payments of the farmers. Supervisory committees should monitor the weigh bridges and take strict actions where discrepancies are detected and Government should announce a faire support price for sugarcane crops farmers that leads to welfare of farmers in the shape of maximum net returns.
REFERENCES
1. Abedullah, S. Kouser and K. Mushtaq. 2010. Environmental efficiency
analysis of basmati rice production in Punjab Pakistan: Implications for the sustainable Agricultural Development. The Pakistan Development Review., 49(1):57-72.
2. Aigner, D. J., C. A. K. Lovell and P. Schmidt. 1977. Formulation and estimation of stochastic frontier production function models. Econometrics. 6(2):21-37.
3. Anon. 2014. Pakistan Economic Survey 2013-14. Economic Advisor’s Wing, Finance Division, Government of Pakistan, Islamabad.
4. Anon. 2013. Production, yield and sugar recovery rate of sugarcane in Pakistan., Pakistan Sugar Mills Association (PSMAC) Available online at http://www.psmacentre.com/aboutus.

Technical and environmental efficiency of sugarcane farmers
J. Agric. Res., 2017, 55(2)
407
5. Anon. 2013. Worldwide comparison of production of sugarcane, Pakistan Board of Investment (PBOI) Available online at sugarcane.pakboi.gov.pk/world/Sugar percent20.doc.
6. Bakhsh, K. 2007. An analysis of technical efficiency and profitability of growing potato, carrot, radish, and bitter gourd: A case study of Pakistani Punjab. Unpublished Ph.D. Dissertation, Department of Farm Management, University of agriculture, Faisalabad, Pakistan.
7. Bakhsh, K. 2012. Environmental and technical efficiency analysis in the bitter gourd production, Pak. J. Agri. Sci., 49(4):583-588.
8. Battese, G. E. and T. J. Coelli. 1992. Frontier production functions, technical efficiency and panel data: With application to paddy farmers in India. Journal of productivity Analysis., 3(2):153-169.
9. Battese, G. E. and T. J. Coelli. 1988. Prediction of arm level technical efficiencies with a generalized frontier production functions and panel data. Journal of Econometrics., 38(4):387-399.
10. Ball, V. E., C. A. K. Lovell, R. F. Nehring and A. Somwaru. 1994. Incorporating undesirable outputs into models of production: An Application to U.S. Agriculture. Cahiers d’ Economique et sociologie Rurales. 31(3):59-73.
11. Bravo-Ureta, B. E. and L. Rieger. 1991. Dairy farm efficiency measurement using stochastic frontiers and neoclassical duality. American Journal of Agricultural Economics., 73(2):421-428.
12. Coelli, T. J. 1995. Recent Development in frontier modeling and efficiency measurement. Australian Journal of Agricultural Economics, 39(1):11-16.
13. Coelli, T. J. 1996. A guide to DEAP version 2.1. A data envelopment analysis (Computer Program). CEPA working paper 96/08, Deparment of Econometrics, University of New England, Armidale.
14. Greene, W. 1995. LIMDEP (version 7): User’s Manual and Reference guide., Econometric software Inc. New York.
15. Idiong, I. C. 2007. Estimation of farm level technical efficiency in small scale swamp rice production in Cross River State of Nigeria: A stochastic frontier approach. World J. Agric. Sci., 3(2):653-658.
16. Meeusen, W. and V. D. Broeck. 1977. Efficiency estimation from Cobb-Douglas production functions with composed error, International Economic Review. 18(2):435-444.
17. Reinhard, S., C.A.K. Lovell and G. Thijssen. 1999. Econometric estimation of technical efficiency and environmental efficiency: an application to Dutch dairy farms”, Amer. J. Agric. Econ. 81(1):44-60.

M.S. Afzal et al.
J. Agric. Res., 2017, 55(2)
408
18. Reinhard, S., C.A.K. Lovell and G. Thijssen. 2000. Environmental efficiency with multiple environmentally detrimental variables; estimated with SFA and DEA. Europe. J. O. Res., 121(2):287-303.
19. Reinhard, S., C. A. K. Lovell and Thijssen. 2002. Analysis of environmental efficiency variation. Amer. J. of Agric. Econ. 84:1054-1065.
20. Travisi, C. and P. Nijkamp. 2008. Valuing environmental and health risk in agriculture: A choice experiment approach to pesticides in Italy. Ecological Economics. 67(2):598-607.
21. Tyteca, D. 1997. Linear programming models for the measurement of environmental performance for firms: concepts and empirical results. J. Product. Anal. 8(2):183-198.
Received: May 02, 2014 Accepted: June 22, 2016
***
CONTRIBUTION OF AUTHORS:
Muhammad Salman Afzal : Collected data, prepared writeup and
participated in focus group discussion
Maqsood Hussain : Planned the study, selected research model,
review the paper and focus group discussion
Muhammad Ali Imran : Helped in data collection, prepared writeup
Sarwat Zia : Made first draft of paper and analysed data
Arshad Bashir : Reviewed the paper, selected research area
and participated in focus group discussion