Measuring Supply Chain Performance with Fluidity...
17
Measuring Supply Chain Performance with Fluidity Data Findings from I-95 Corridor Coalition Freight Fluidity Measures Pilot Project 5 th International Transportation Systems Performance Measurement & Data Conference June, 2015 Marygrace Parker, I-95 Corridor Coalition Joseph Bryan, Parsons Brinckerhoff Denver, CO
-
Upload
hoangnguyet -
Category
Documents
-
view
223 -
download
0
Transcript of Measuring Supply Chain Performance with Fluidity...

Measuring Supply Chain Performance with Fluidity Data Findings from I-95 Corridor Coalition Freight Fluidity Measures Pilot Project
5th International Transportation Systems Performance Measurement & Data Conference
June, 2015
Marygrace Parker, I-95 Corridor Coalition Joseph Bryan, Parsons Brinckerhoff
Denver, CO
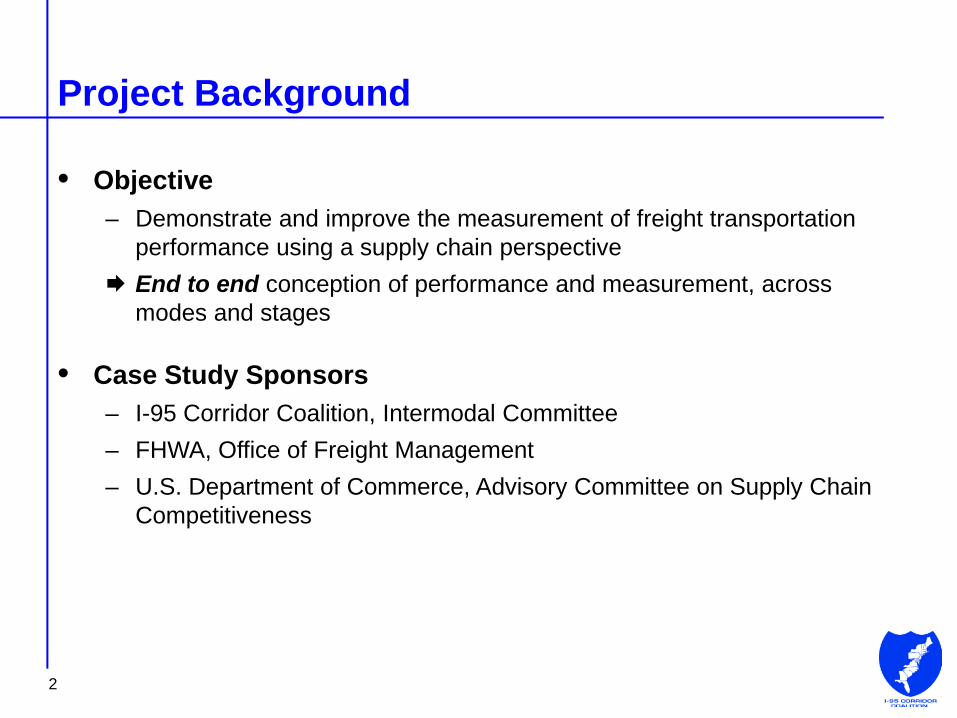
Project Background
• Objective – Demonstrate and improve the measurement of freight transportation
performance using a supply chain perspective End to end conception of performance and measurement, across
modes and stages
• Case Study Sponsors – I-95 Corridor Coalition, Intermodal Committee – FHWA, Office of Freight Management – U.S. Department of Commerce, Advisory Committee on Supply Chain
Competitiveness
2

Why the I-95 Corridor Coalition is Sponsoring
3
Supply chains and supply chain performance are multi-jurisdictional. So are we: • 16 states with District of Columbia:
− $4.7 trillion economy (40% of US GDP)
− 21% of nation’s road miles; 35% of nation’s VMT
− 5.3 billion tons of freight shipments annually
− Multimodal corridor • 2 Canadian Provinces (Quebec,
New Brunswick)

Multimodal Supply Chain Case Studies
• Autos – General Motors auto parts – From US and NAFTA suppliers to auto assembly plant in Tennessee
• Retail – Target® consumer goods – From Ports of Los Angeles/Long Beach and Seattle/Tacoma via Chicago to
metropolitan New York
• Electronics – Panasonic electronics – Between manufacturing and assembly facilities in San Diego and Tijuana
• Agriculture – Soybean exports – From Illinois farms to Louisiana port
• Food – Perdue processed chicken – From DelMarVa region to Mid-Atlantic markets
4

What Data: Performance Measures and Metrics Market-Driven Factors
5
Measure Metric
Transit time Travel time in days (or hours) Reliability 95% travel time in days (or hours) Cost Dollars Safety Fatality and injury rate Risk Disruption
(storms, labor, infrastructure failure, political forces…)
Capacity expansion delays (physical, regulatory limitations and delays…)
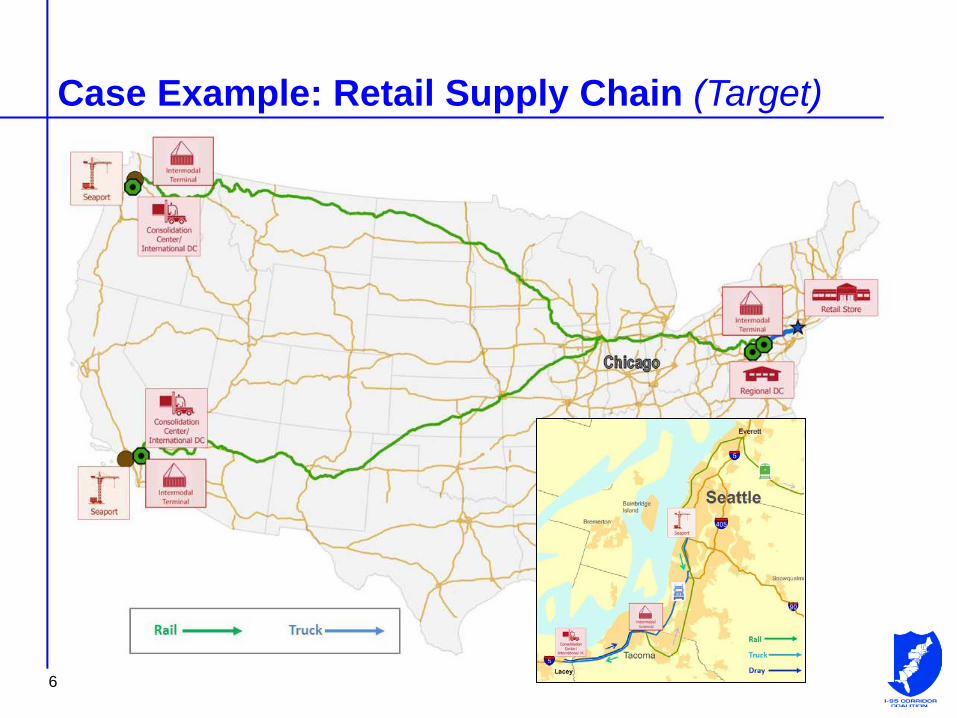
Case Example: Retail Supply Chain (Target)
6

Retail Supply Chain Measures Seattle to New York
7
Links and Nodes Sources Notes West Coast port (Seattle) Dray move ATRI, Chainalytics Transload or Consolidation Center Dray move ATRI, Chainalytics West Coast rail intermodal terminal TransCore, Chainalytics Rail move TransCore, Chainalytics Midwest rail intermodal interchange TransCore, Chainalytics Rail move Available for purchase East Coast rail intermodal terminal Available for purchase Dray move ATRI, Chainalytics East Coast Regional Distribution Center Truck P&D move ATRI, Chainalytics Retail Store

Retail Supply Chain Performance Seattle to New York
8
Links and Nodes Transit Time/Dwell Time
(Hours) Reliability
(95% travel time) Cost
(2014 $’s) West Coast port (Seattle)
Dray move 1.0 1.4 $299
Transload or Consolidation Center
Dray move 1.0 2.25 $308
West Coast rail intermodal terminal 20
Rail move 104 154 $3,178
Midwest rail intermodal interchange 71 160
Rail move
East Coast rail intermodal terminal
Dray move 1.1 1.4 $318
East Coast Regional Distribution Center
Truck P&D move 6.0 9.5 $775
Retail Store
Totals $4,878
Estimated using ATRI data for truck transit times, TransCore data for rail times, Chainalytics data for costs. Reliability factor for Midwest interchange was produced for sum of West Coast plus Midwest dwell, but most of delay is in Midwest (Chicago)

Sources for Modal Fluidity Data
9
Measure Mode Sources Transit Time & Reliability Truck ATRI, NPMRDS, Google/TTI (& others) Rail Intermodal TransCore (& Railinc)
Rail Carload RSI Logistics (& Railinc) Waterway ACE Automatic Identification System
Port (dwell) ATRI (some)
Cost Truck Chainalytics Rail Intermodal Chainalytics Rail Carload STB Waybill Waterway ACE (partial)
Comment on Fluidity Data Sources Speed & Reliability: Truck
• ATRI quality and coverage strong, accessibility below national/federal level a limitation – Custom work at a cost – But readily repeatable for tracking
• NPMRDS (“HERE”) data derive from ATRI, need tools to manage – Loss of detail (e.g., real route) – Indirect instead of direct (subsidized) cost – Computationally intensive to assemble highway segments into routes
(but tools could be developed to automate the process and statistical analyses)
• Google/TTI cheap and widely available, but an approximation – Factual but general basis
10

Comment on Fluidity Data Sources Speed & Reliability: Rail
• TransCore covers major intermodal lanes – Transit and dwell times available – No Mexico traffic; full scope unclear – Cost seems manageable at federal level
• RSI Logistics covers carload traffic – From car tracking; should include dwell time – Cost and full scope TBD (not needed in pilot)
• Railinc presumably captures everything – Requires rail industry cooperation (as in Canada)
11
Comment on Fluidity Data Sources Speed & Reliability: Water
• Army Corps Automatic (vessel) Identification System (AIS) a high quality, public source – Waterway coverage expanding – No acquisition cost issues – Custom analysis required, but tools could be developed to automate
route definition and statistical analyses
• Port dwell to be determined – ATRI capable of capturing truck turnaround via geofencing – Broader definition requires port/operator cooperation
12

Comment on Fluidity Data Sources Cost: Truck and Rail
• Chainalytics a high quality, repeatable primary source, covering: – Truckload: dry van, reefer, flatbed
• No bulks, LTL • No private/dedicated, but can use proxies
– Rail: intermodal only • STB Waybill a fallback source for carload
– US and NAFTA, long and short haul
• Cost to be determined – Consortium, and not their normal business model – Expect practical at federal level, at least
13

Comment on Fluidity Data Sources Cost: Water
14
• No direct sources identified – Army Corps has cost data; price data may be possible – Others may have spot coverage
• Charge for access, and not necessarily repeatable

Findings: Feasibility
• We can measure and track the high-level performance of representative supply chains with market-driven metrics – Demonstrated feasibility
• Key measures and metrics are common across supply chains and can be scaled for national, multistate and metropolitan use – Travel time and travel time reliability are available from public and
private sources, but “some assembly is required…” – Cost data can be purchased from private suppliers – Safety data are available, but not readily accessible – Risk data can be estimated, but are not readily available
15

Findings: Data Application Issues
• Data characteristics? – Definitions – Reliability and validity – Continuous or periodic or seasonal – Time series and historical
• Data availability, access and cost? – National and nationwide – Downward scalability (proliferation)
• Who acquires & marshals fluidity data? – Public program should not be limited to public sources – Federal role for main constructs (akin to FAF, NPMRDS) – Corridor coalition model for pooling regional resources: acquisition and
application (akin to I-95 ICAT/INRIX)
16

Questions?
17
Marygrace Parker: [email protected] www.i95coalition.org
Joseph Bryan: [email protected]