Measuring Student Engagement and Motivation · achievement – cradle through ... relationship to...
60
Measuring Student Engagement and Motivation What we are learning from early efforts in the Road Map Region Washington Educational Research Association December 11, 2014
Transcript of Measuring Student Engagement and Motivation · achievement – cradle through ... relationship to...

Measuring Student Engagement and Motivation
What we are learning from early efforts in the Road Map Region
Washington Educational Research Association
December 11, 2014

Sarah Terry Data and Outcomes Manager Youth Development Executives of King County [email protected]
Eric Anderson
Director of Research, Evaluation, and Assessment
Seattle Public Schools
Anna Sytnik Cruz
Assessment Data Analyst
Renton School District
Who We Are

• Why measure student engagement and motivation in the first place (i.e. how did we get here?) (Sarah Terry)
• What quantitative analysis of survey data tells us (Anna Sytnik Cruz)
• How districts are reporting and using engagement and motivation data (Eric Anderson)
• Moving forward (i.e. what are our next steps?) (All)
Today’s Agenda

OUR MISSION: To build and organize the youth development field in King County. OUR VISION: Every young person has the opportunity to learn, lead, work, thrive, contribute and connect with active support from organized, networked and unified youth development efforts in King County. WHO WE ARE: We are Executive Directors, CEOs and other key leaders of non-profit organizations directly serving youth ages 5 through young adulthood within King County.
About YDEKC

The Road Map Project is a collective impact initiative aimed at getting dramatic improvement in student achievement – cradle through college and career in South Seattle and South King County.
About the Road Map Project
In 2012, PSESD was awarded a five-year, $40 million Race to the Top grant to support some of the Road Map Project’s work.

Indicators of Student Success

Factors related to motivation and engagement that have been shown to be associated with a higher likelihood of dropping out:
• Poor attendance
• Lack of involvement in extracurricular activities
• Disciplinary referrals and/or low behavior grades
• Grade retention
• Poor academic performance
There are several types of dropouts; those referred to as “fadeouts” or “disengaged” may simply fail to connect to school or school-related goals, and leave for non-academic reasons.
Why do Motivation and Engagement Matter?

Thinking Beyond High School
“Many students drop out because of academic failure, behavioral problems, and life issues; many more stay in school but drop out in their heads – gradually disengaging from what school has to offer. These disengaged students pass the tests and get passing grades, but they limp to a tainted graduation and a diploma that papers over their lack of readiness for successful postsecondary learning and work.”
Washor, E. & Mojowski, C. (2014, May). Student disengagement: It’s deeper than
you think. Phi Delta Kappan, p. 8.

Percentage of teachers and school administrators who see the following issues
as a “moderate” or “serious” problem in their school, from a recent survey of K-
12 teachers and school-based administrators (n=504):
• Students not completing homework assignments: 74%
• Lack of parental involvement: 71%
• Lack of student engagement and motivation in school: 69%
• Poverty: 67%
• Student Apathy: 65%
• Student tardiness: 57%
• Student Absenteeism: 43%
• Students dropping out of school: 23%
• Violence and crime: 15%
Education Week Research Center (2014). Engaging students for success: Findings from a national survey. Bethesda, MD: Editorial Projects in Education. Retrieved from http://www.edweek.org/media/ewrc_engagingstudents_2014.pdf, pp. 25-26
Disengagement: How Big is the Problem?

Define Measure Move

Some of the seminal work that emerged from our review of the education and
psychology literature on academic motivation, engagement, and 21st-century
skills:
• Hope (Shane Lopez, C. R. Snyder)
• Role Models, “Possible Selves” (Hazel Markus, Paula Nurius, Daphna Oyserman,
Deborah Bybee, Kathy Terry)
• Self-Efficacy (Albert Bandura)
• Grit (Angela Duckworth)
• Growth Mindset, Mastery Orientation (Carol Dweck)
• Stereotype Threat, Theories of Intelligence (Catherine Good, Joshua Aronson,
Michael Inzlicht)
Also spent time looking at research on positive youth development, high school
dropout and stopout behavior, social and emotional factors, school belonging,
and college access and success.
Literature Review: Key Researchers


Define Measure Move

“Not everything that counts can be counted, and not everything that can be counted counts.” Albert Einstein BUT… there are a number of common measures that can serve as proxies for motivation and engagement (e.g. Attendance, Behavior, and Coursework). AND… youth can reliably report on their feelings about themselves and their relationship to their schooling, and this can be a useful complement to other kinds of data that we collect. HOWEVER… Only 29% of respondents to a recent survey reported that their school uses student surveys or focus groups to assess motivation and engagement. Education Week Research Center (2014). Engaging students for success: Findings from a national survey. Bethesda, MD: Editorial Projects in Education. Retrieved from http://www.edweek.org/media/ewrc_engagingstudents_2014.pdf, p.29
Measuring Motivation and Engagement

Selecting a Survey Instrument
Instruments Reviewed
Full Surveys:
• Gallup Student Poll
• Healthy Youth Survey (School Engagement
items)
• Youth Truth
• ACT Engage
• Various school climate instruments
Public Domain Survey Scales:
• Patterns of Adaptive Learning scales
• Grit Scale for Children
• Implicit Theories of Intelligence Scale
• Motivated Strategies for Learning
Questionnaire
• Student Report of Academic Self-Efficacy
• Hope Scale for Children (and other measures
from Child Trends’ Flourishing Children Project)
Decision Criteria
• Cost
• Feasibility of implementation
• Burden
• Purpose of instrument
• Content of instrument
Used items from several of these, but not full scales

• Version 1.0 piloted in Renton in 2012 (Grades 5-12, n≈6,000) • 35 questions covering motivation, engagement & 21st century skills • Basic psychometric data from pilot informed first revision
• Version 2.0 used in four Road Map districts in 2013-2014, usually as a supplement to Climate Surveys (43 items)
• Anonymous, but with some self-reported demographic and performance data

Quantitative Analysis of Survey Scores
• Who took the test?
• What does psychometric analysis tell us? • Item analysis
• Factor analysis
• Reliability
• What can we learn from disaggregating the data?
• What themes emerged?
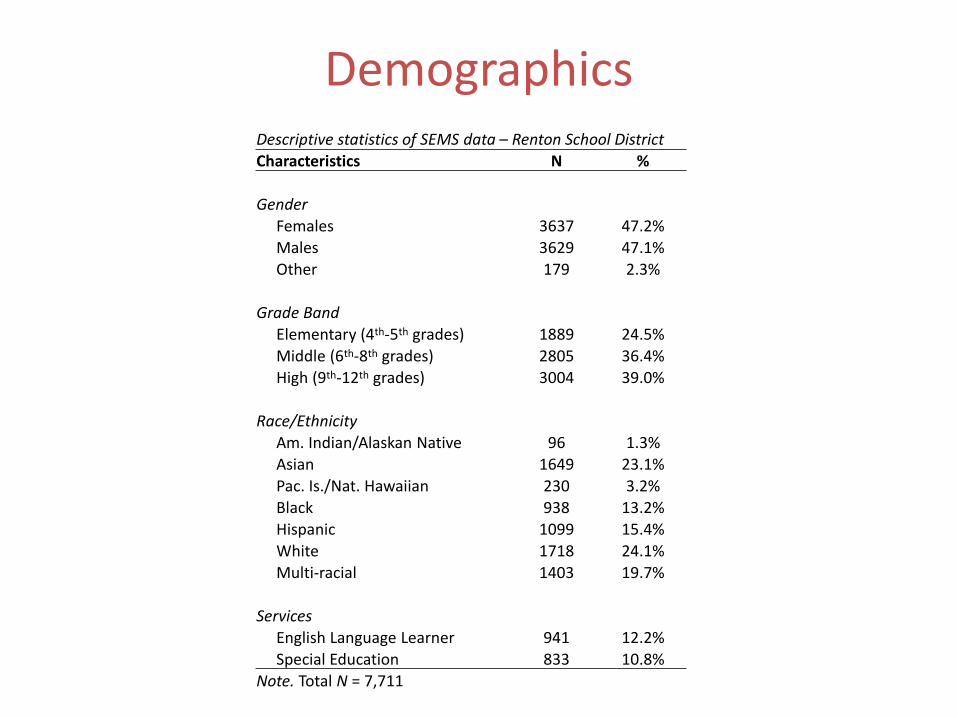
Demographics Descriptive statistics of SEMS data – Renton School District
Characteristics N %
Gender
Females 3637 47.2%
Males 3629 47.1%
Other 179 2.3%
Grade Band
Elementary (4th-5th grades) 1889 24.5%
Middle (6th-8th grades) 2805 36.4%
High (9th-12th grades) 3004 39.0%
Race/Ethnicity
Am. Indian/Alaskan Native 96 1.3%
Asian 1649 23.1%
Pac. Is./Nat. Hawaiian 230 3.2%
Black 938 13.2%
Hispanic 1099 15.4%
White 1718 24.1%
Multi-racial 1403 19.7%
Services
English Language Learner 941 12.2%
Special Education 833 10.8%
Note. Total N = 7,711

Item Analysis
• Variety of statistical procedures designed to examine the quality of the items
• Provides information about how participants responded to each item, as well as well as how each item relates to the overall performance on the survey
– Means and standard deviations
– Normality (skeweness)
– Nonresponse rates
– Corrected item-total correlations
– Cronbach’s alpha if item deleted

Item Analysis
• Lowest mean – I feel proud of my school (M = 3.67, SD = 1.19)
• Highest mean – It’s important to me that I improve my skills this year
(M = 4.49, SD = .78)
• All items are negatively skewed • Most students answered positively on all items
• Corrected item-total correlations were computed for each item
• Measures the correlation between each item and adjusted total score
• Alpha level would stay the same (α = .95) if any individual item was deleted

Item Analysis
Items with highest item-total correlations – I take responsibility for working on my goals (.68)
– I am a hard worker (.67)
– I am good at staying focused on my goals (.66)
Items with lowest item-total correlations – In my school, I feel that I belong to a group of friends (.42)
– I have a plan for what I want to do after high school (.42)
– I am a creative person (.40)

Item Nonresponse Rate
Elementary
– I have a clear sense of my ethnic background (7.4%)
– I am comfortable interacting with people from a different racial or ethnic background (5.8%)
– Setbacks don’t discourage me (6.9%)
– How smart I am is something that I can change (6.7%)
– I solve problems by first breaking them into smaller
steps (5.1%)

Item Nonresponse Rate
Middle
– Setbacks don’t discourage me (6.2%)
– How smart I am is something that I can change (6.5%)
– I solve problems by first breaking them into smaller
steps (5.7%)
High
– Nonresponse rate for all items is less than 5%

Elementary
Items with highest agreement: – It’s important to me that I improve my skills this year (94%)
– I am hopeful about my future (91%)
– I can learn the things taught in school (89%)
Items with lowest agreement: – It is easy for me to communicate my thoughts and ideas (72%)
– I am good at figuring out the best solution to problems I'm facing (72%)
– I can calm myself down when I am excited or upset (73%)

Middle
Items with highest agreement: – It’s important to me that I improve my skills this year (91%)
– I am hopeful about my future (86%)
– I am comfortable interacting with people from a different racial or ethnic background (86%)
Items with lowest agreement: – I feel proud of my school (54%)
– I am comfortable asking my teacher(s) for help (60%)
– It is easy for me to communicate my thoughts and ideas (60%)

High School
Items with highest agreement: – It’s important to me that I improve my skills this year (88%)
– I know I will graduate from high school (88%)
– I am comfortable interacting with people from a different racial or ethnic background (87%)
Items with lowest agreement: – I feel proud of my school (52%)
– What we do in school will help me succeed in life (54%)
– It is easy for me to communicate my thoughts and ideas (58%)

Agreement Differences
0%
10%
20%
30%
40%
50%
60%
70%
80%
90%
100%
I feel proud of my school I am comfortable asking myteacher(s) for help
I am hopeful about myfuture
What we do in school willhelp me succeed in life
Grade Band Agreement Differences - Specific Items
Elementary Middle High

Factor Analysis
• “Set of statistical procedures designed to determine the number of distinct constructs needed to account for the pattern of correlations among a set of measures” (Fabrigar & Wegener, 2011)
• Data reduction technique – provides important information about dimensionality of the scale
• Exploratory Factor Analysis (EFA) - unrestricted – no expectations about the number of underlying
constructs (factors), nor which specific items each factor will influence

Exploratory Factor Analysis (EFA)
• Conducting EFA involves several steps – Examining factorability of the data
– Choosing extraction method • Principal Component Analysis (PCA)
– Determining the number of factors to extract
– Choosing rotation • Promax
– Examining communalities and factor loadings • Iterative process
– Interpretation of the results

Exploratory Factor Analysis (EFA) High School
Survey Item Factors and Loadings Commu-
nalities 1 2 3 4 5 6 7
I work hard at school .900 -.135 -.102 .682
I complete my schoolwork regularly .878 -.177 .634
I concentrate on my homework .812 .637
I am a responsible student .793 .614
I am a hard worker .787 -.102 .660
I am diligent (hard working and careful) .778 .107 .715
I am good at staying focused on my goals .660 .140 .112 -.189 .616
I take responsibility for working on my goals .504 .114 .148 .540
I finish whatever I begin .490 .219 .480
It's important to me that I improve my skills this year .415 .228 -.246 .184 .283 .556
What we do in school will help me succeed in life .782 -.101 .220 .601
One of my goals in class is to learn as much as I can .250 .664 .597
I solve problems by first breaking them into smaller steps .633 .111 .459
How smart I am is something that I can change -.148 .571 .119 .205 .450
I try to think of many solutions when I have a problem .552 .371 .103 .617
I am good at figuring out the best solution to the problems I'm facing .457 .263 -.113 .325 -.142 .601
I can come up with new ideas .813 .708
I like to imagine new ways to do things .175 .736 .633
I am a creative person .924 -.179 -.117 .610

Exploratory Factor Analysis (EFA) High School
Survey Item Factors and Loadings Commu-
nalities 1 2 3 4 5 6 7
There is at least one adult in this school I can talk to if I have a problem .290 .706 -.116 .544
I feel proud of my school .369 .586 -.107 .576
I am comfortable asking my teacher(s) for help .191 .580 .508
In my school, I feel that I belong to a group of friends -.136 .562 .215 .243 -.108 .471
I am treated with as much respect as other students .217 -.194 .541 .128 .139 .545
I work well in a group or team -.101 .316 .445 .195 .404
I can calm myself down when I am excited or upset .158 -.178 .853 .620
I can discuss a problem with a friend without making it worse -.101 .147 .729 .186 .610
I can resist doing something when I know I shouldn't do it .293 -.117 -.165 .530 -.107 .194 .454
It is easy for me to communicate my thoughts and ideas .186 .219 .564 -.134 .576
I have a clear sense of my ethnic background -.110 .849 .134 .641
I feel good about my cultural or ethnic background -.107 -.134 .874 .160 .712
I have a plan for what I want to do after high school .156 .616 -.327 .510
I am hopeful about my future .247 .525 .514
I know I will graduate from high school .362 -.198 .437
I respect other points of view, even when I disagree .133 .152 .552 .526
I feel bad when someone gets their feelings hurt .147 .676 .557
I am comfortable interacting with people from a different racial or ethnic background
-1.880 .308 .204 .585 .555

Exploratory Factor Analysis (EFA) High School
The following items were excluded during EFA due to low factor loadings (below .30) or crossloadings
– I pay attention to how I feel
– I can do almost all the work in class if I don’t give up
– Setbacks don’t discourage me
– I try things even if I might fail
– I can learn the things taught in school
– When my solution to a problem is not working, I try to figure out what went wrong

Exploratory Factor Analysis (EFA) High School
Correlations among seven latent factors
Factor 1 2 3 4 5 6 7
1 ---
2 .58 ---
3 .45 .42 ---
4 .43 .39 .26 ---
5 .46 .46 .56 .39 ---
6 .50 .40 .45 .40 .48 ---
7 .36 .39 .15 .29 .25 .29 ---
Note. All correlations are significant at the .01 level (two-tailed).

Reliability
• Overall internal consistency of the Student Engagement and Motivation Survey (SEMS) scores is .95 (Cronbach’s alpha).
– Factor 1 (10 items) α = .92 Academic Perseverance
– Factor 2 (6 items) α = .80 Mindsets
– Factor 3 (3 items) α = .75 Creativity
– Factor 4 (5 items) α = .73 Belonging
– Factor 5 (5 items) α = .74 Interpersonal Skills
– Factor 6 (5 items) α = .77 Optimism
– Factor 7 (3 items) α = .64 Empathy

Emerging Themes
• Student responses become less positive as grade level increases
• More dimensions of motivation and engagement emerge at higher grade levels
• Girls are generally more positive on items that refer to hard work, responsibility, cultural awareness, and emotional awareness
• Boys are generally more positive on items that refer to problem solving, creativity (new ideas), and communication
• Hispanic students have the lowest level of agreement on most items, whereas Asian students have the highest

Recommendations
• Very high reliability indicates that that overall number of items can be reduced
• “Think aloud” interviews with students
• Different versions for different grade bands
• Reducing the number of constructs to measure with one survey
– Potentially separating motivation and engagement from 21st century skills

37
How we are beginning to use SEMS data
• District Scorecard
• School Performance Analysis
Patterns in our SEMS Data
• Demographics Analysis
• Correlation Analysis
Seattle Public Schools

Who are our underachieving students?

39
Profile Indicators 1. Students of Color 2. Limited English (ELL) 3. Special Education (SPED) 4. Mobile/Transfer Students 5. Low Attendance 6. Discipline Incidents 7. Course Failures
If zero indicators are true the student is likely to perform at Level 4
Student Profiles by Performance Level
7th Grade Mathematics (2013)
17
207
260
82
62
211
77
6
230
494
95
6
891
650
41
1
0%
10%
20%
30%
40%
50%
60%
70%
80%
90%
100%
L4 Students
L3 Students
L2 Students
L1 Students

40
Personalized Supports Understanding Each Student’s Unique Matrix
Academic/ Cognitive
Skills
Habits of Mind/
Disposition
Family & Community Resources
Social- Emotional/
Behavior

Ensure educational excellence and equity for every student
Improve systems district-wide to support academic outcomes
Strengthen school, family and community engagement
2013–2018 Strategic plan

District Scorecard Measures
42
Kindergarteners demonstrating readiness to be successful learners
3rd graders demonstrating grade level proficiency in reading
3rd graders demonstrating grade level proficiency in mathematics
5th graders demonstrating grade level proficiency in science
7th graders demonstrating grade level proficiency in reading
7th graders demonstrating grade level proficiency in mathematics
8th graders demonstrating grade level proficiency in science
9th graders earning sufficient credits
10th graders pass ing a l l s tate exams required for graduation
High school s tudents graduating in four years or fewer
Students taking and pass ing the dis trict a lgebra course by 8th grade
Students taking and pass ing a col lege level course by 12th grade
11th graders demonstrating col lege and career readiness in reading
11th graders demonstrating col lege and career readiness in mathematics
Opportunity Gap in grade level reading proficiency (3rd-8th grades)
Opportunity Gap in grade level mathematics proficiency (3rd-8th grades)
Proportional i ty Gap for s tudents in specia l education programs (K-12th)
Proportional i ty Gap for s tudents suspended or expel led (6th-12th grades)
Students participating in a l icensed pre-school program before kindergarten
Students receiving instruction in arts/mus ic and phys ica l education (K-12th)
Climate/Learning Environment Pos itive s tudent responses to school cl imate survey
Student Motivation/Engagement Pos itive s tudent responses to motivation and engagement survey
School Professional Environment Pos itive school s taff responses to profess ional environment survey
Early Learning Foundations
Core Academic Development
Commitment to
Equity
Equitable Access and Opportunity
Academic
Milestones
On-Time Graduation
Proportionality Gaps
Opportunity Gaps
Positive School
Environments
College & Career Readiness

District Scorecard Measures
43
POSITIVE SCHOOL ENVIRONMENTS

School Environment
44

School Environment
45
Patterns in our MES data

Summary School Results by Level
47
SEMS
Climate
Survey
Mean 80% 70%
Std. Deviation 3% 6%
Minimum 73% 51%
Maximum 89% 82%
Mean 73% 54%
Std. Deviation 3% 7%
Minimum 67% 43%
Maximum 82% 68%
Mean 65% 56%
Std. Deviation 6% 11%
Minimum 57% 44%
Maximum 78% 80%
High School
(n=16)
Middle School
(n-18)
Elementary
(n=67)

48
Summary School Results by Level
SEMS School Climate
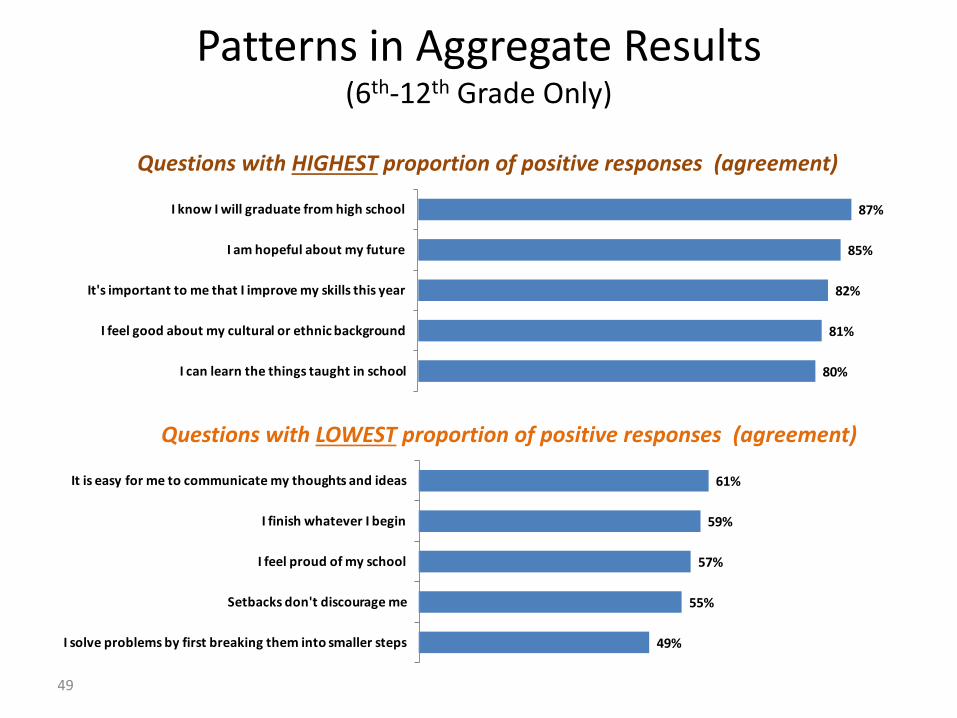
Patterns in Aggregate Results (6th-12th Grade Only)
49
Questions with HIGHEST proportion of positive responses (agreement)
Questions with LOWEST proportion of positive responses (agreement)
80%
81%
82%
85%
87%
I can learn the things taught in school
I feel good about my cultural or ethnic background
It's important to me that I improve my skills this year
I am hopeful about my future
I know I will graduate from high school
49%
55%
57%
59%
61%
I solve problems by first breaking them into smaller steps
Setbacks don't discourage me
I feel proud of my school
I finish whatever I begin
It is easy for me to communicate my thoughts and ideas

50
Questions with largest differences favoring FEMALE Students
Questions with largest differences favoring MALE Students
Patterns in Aggregate Results (6th-12th Grade Only)
57%
62%
73%
67%
63%
54%
60%
72%
66%
62%
Setbacks don't discourage me
It is easy for me to communicate my thoughts and ideas
I like to imagine new ways to do things
I can calm myself down when I am excited or upset
I am good at figuring out the best solution to problems …
FemaleMale
67%
72%
71%
70%
70%
74%
80%
80%
80%
83%
I concentrate on my schoolwork
I work hard at school
I respect other points of view even when I disagree
I am a responsible student
I feel bad when someone gets their feelings hurt
FemaleMale

51
Patterns in Aggregate Results (6th-12th Grade Only)
Survey Item Mostly A's
Mostly C's
or Lower Diff.
I complete my schoolwork regularly 90% 32% 58%
I concentrate on my schoolwork 85% 39% 46%
I work hard at school 89% 44% 45%
I am a respons ible s tudent 89% 46% 43%
I am di l igent (hard working and careful ) 83% 42% 41%
I am a hard worker 86% 49% 37%
I am good at s taying focused on my goals 76% 41% 35%
I finish whatever I begin 70% 37% 33%
I take respons ibi l i ty for working on my goals 86% 54% 31%
I can learn the things taught in school 88% 60% 29%
I can do a lmost a l l the work in class i f I don't give up 88% 59% 28%
I know I wi l l graduate from high school 94% 66% 28%
I am treated with as much respect as other s tudents 75% 51% 25%
Questions with largest differences favoring students with Strong Course Grades

Correlation with Student Achievement (Aggregate Math Achievement - Elementary)
52
Proficiency
SCI
Adjusted
Proficiency
Value-
Added
(Growth) Proficiency
SCI
Adjusted
Proficiency
Value-
Added
(Growth)
Pearson Correlation .317 .111 .126 .261 .082 -.075
Sig. (2-tailed) .009 .374 .319 .034 .514 .553
N 66 66 65 66 66 65
Pearson Correlation .561 .239 .089 .515 .267 -.052
Sig. (2-tailed) .000 .054 .483 .000 .030 .678
N 66 66 65 66 66 65
SEMS
School
Climate
Math
Reading
• Both surveys significantly correlated with aggregate proficiency • Stronger correlation with School Climate • Not correlated with proficiency adjusted for student demographics • Not correlated with value added growth model

Correlation with Student Achievement (Aggregate Math Achievement - Middle School)
53
Proficiency
SCI
Adjusted
Proficiency
Value-
Added
(Growth) Proficiency
SCI
Adjusted
Proficiency
Value-
Added
(Growth)
Pearson Correlation .342 .237 .055 .282 .153 .293
Sig. (2-tailed) .164 .344 .828 .256 .546 .237
N 18 18 18 18 18 18
Pearson Correlation .653 .105 -.064 .632 .114 .113
Sig. (2-tailed) .003 .677 .800 .005 .652 .655
N 18 18 18 18 18 18
SEMS
School
Climate
Math
Reading
• School Climate (only) significantly correlated with aggregate proficiency • Neither correlated with proficiency adjusted for student demographics • Neither correlated with value added growth model

Correlation with Student Achievement (Aggregate School Math Proficiency, Grades 3-5)
54
Survey Item
Pearson
Correlation
I complete my schoolwork regularly 0.699 ***
I am treated with as much respect as other students 0.637 ***
I feel bad when someone gets their feelings hurt 0.562 ***
I am a responsible student 0.523 ***
I work hard at school 0.523 ***
I can resist (stop myself) doing something when I know I shouldn't do it 0.48 ***
I am a creative person 0.472 ***
I feel good about my cultural or ethnic background 0.472 ***
I can do almost all the work in class if I don't give up 0.467 ***
I concentrate on my schoolwork 0.432 ***
I can come up with new ideas 0.410 ***
I feel proud of my school 0.408 ***
I can learn the things taught in school 0.398 ***
I am a hard worker 0.367 **
When my solution to a problem is not working I try to figure out what went wrong 0.351 **
My family expects me to go to college 0.324 **
I pay attention to how I feel 0.296 *
I am comfortable asking my teacher(s) for help 0.285 *
How smart I am is something that I can change 0.267 *
In my school I feel that I belong to a group of friends 0.263 *
* Significant at p <.05 level ** Significant at p < .01 level *** Significant at p < .001 level

Correlation with Student Achievement (Aggregate School Math Proficiency, Grades 6-8)
55
Survey Item Correlation
In my school I feel that I belong to a group of friends 0.863 ***
I am treated with as much respect as other students 0.857 ***
I feel bad when someone gets their feelings hurt 0.856 ***
I can calm myself down when I am excited or upset 0.824 ***
How smart I am is something that I can change 0.775 ***
I respect other points of view even when I disagree 0.772 ***
I can resist (stop myself) doing something when I know I shouldn't do it 0.735 ***
I try to think of many solutions when I have a problem 0.716 ***
I am good at figuring out the best solution to problems I'm facing 0.678 **
When my solution to a problem is not working I try to figure out what went wrong 0.675 **
I can discuss a problem with a friend without making it worse 0.674 **
I am comfortable interacting with people from a different racial or ethnic background 0.627 **
I like to imagine new ways to do things 0.613 **
I am comfortable asking my teacher(s) for help 0.612 **
I am a creative person 0.589 **
I concentrate on my schoolwork 0.580 *
I try things even if I might fail 0.577 *
I can learn the things taught in school 0.570 *
I know I will graduate from high school 0.560 *
I work hard at school 0.509 *
I solve problems by first breaking them into smaller steps 0.497 *
I take responsibility for working on my goals 0.490 *
* Significant at p <.05 level ** Significant at p < .01 level *** Significant at p < .001 level

Looking Ahead…

Define Measure Move

School-wide and Community-based Strategies to Improve Motivation and Engagement

Foundational Practices: • Cultural Responsiveness
• Positive School Climate
• High-Quality Instructional Practice
Deepening Relationships: • Trauma-Informed Practice
• Mentoring
Transforming Discipline: • Positive Behavioral Interventions and Supports
• Restorative Justice
Building Skills: • Growth Mindset
• Social and Emotional Learning
• College and Career Readiness
• Arts Integration
Leveraging Partnerships: • Expanded Learning Opportunities
• Community Schools
Featured Strategies
Although these are presented as discrete
strategies, they are interrelated and
complementary; and are based on the idea
that students learn best when they are
safe, supported, known, appreciated,
and challenged.

Lessons Learned and Next Steps
• Probably need a 3.0 version of the survey that improves upon:
– Reliability and validity
– Length
– Conceptual clarity
• Need to support schools, districts, and partners in interpreting and using data