Measuring Salinity of Water...dissolved salt content of water is important as aquatic organisms,...
2
Introduction Salinity is the measure of the amount of dissolved salts in water. It is usually expressed in parts per thousand (ppt) or percentage (%). Freshwater from rivers has a salinity value of 0.5ppt or less. Within the estuary, salinity levels are referred to as oligohaline (0.5-5.0 ppt), mesohaline (5.0-18.0 ppt), or polyhaline (18.0-30.0 ppt). Near the connection with the open sea, estuarine waters may be euhaline, where salinity levels are the same as the ocean at more than 30.0 ppt. 1 Salinity varies from place to place in the oceans, but the relative proportions of the most major dissolved constituents remain virtually constant. Even though there are smaller quantities of other ions in seawater (e.g., K + , Mg 2+ , SO 4 2- ), sodium (Na + ) and chloride (Cl - ) ions represent about 91% of all the seawater ions. Freshwater has much lower levels of salt ions. 2 Salinity is often derived from electrical conductivity (EC) measurement. EC is measured by passing an electric current between two metal plates or electrodes in the water sample and measuring how readily current flows between the plates. The use of EC measurements to estimate the ionic content of seawater led to the development of Practical Salinity Scale 1978 (PSS-78). 3 The PSS-78 has been considered by the Joint Panel on Oceanographic Tables and Standards and recommended by all oceanographic organizations as the scale in which to report future salinity data. The practical salinity of a sample of seawater is defined in terms of the ratio of the electrical conductivity of the seawater sample at the temperature of 15ºC and the pressure of 1 standard atmosphere, to that of a potassium chloride (KCl) solution containing a mass of 32.4356 g KCl in a mass of 1 kg of solution at the same temperature and pressure. A ratio equal to 1 corresponds to a practical salinity 35 (standard seawater). 4 As the definition is a ratio, practical salinity is expressed as dimensionless number. The LAQUAtwin Salt 11 pocket meter measures the conductivity value of a sample then converts it to salinity value based on the salinity standard curve selected. The sensor has two titanium metals coated with platinum black that resist corrosion and temperature sensor for accurate measurement. The meter is programmed with two standard calibration curves—seawater and sodium chloride (NaCl). The former Application Note 08-2016 Continued at the back Measuring the salinity or the dissolved salt content of water is important as aquatic organisms, livestock, and crops thrive at different salinity levels. Freshwater has a salinity value of less than 0.5 ppt while seawater has an average salinity of 35 ppt. Measuring Salinity of Water OCEAN <30.0 ppt Euhaline (Marine) Polyhaline Mesohaline Tidal Fresh Water Non-Tidal Fresh Water (During Low Flow Conditions) Tidal Limit <18.0 ppt <5.0 ppt <0.5 ppt Average Annual Salinity Figure 1: Estuarine salinity slowly increases as one moves away from freshwater sources and toward the ocean. Source: Chapter 14 Salinity. Voluntary Estuary Monitoring Manual.
Transcript of Measuring Salinity of Water...dissolved salt content of water is important as aquatic organisms,...

IntroductionSalinity is the measure of the amount of dissolved salts in water. It is usually expressed in parts per thousand (ppt) or percentage (%). Freshwater from rivers has a salinity value of 0.5ppt or less. Within the estuary, salinity levels are referred to as oligohaline (0.5-5.0 ppt), mesohaline (5.0-18.0 ppt), or polyhaline (18.0-30.0 ppt). Near the connection with the open sea, estuarine waters may be euhaline, where salinity levels are the same as the ocean at more than 30.0 ppt.1
Salinity varies from place to place in the oceans, but the relative proportions of the most major dissolved constituents remain virtually constant. Even though there are smaller quantities of other ions in seawater (e.g., K+, Mg2+, SO4
2-), sodium (Na+) and chloride (Cl-) ions represent about 91% of all the seawater ions. Freshwater has much lower levels of salt ions.2
Salinity is often derived from electrical conductivity (EC) measurement. EC is measured by passing an electric current between two metal plates or electrodes in the water sample and measuring how readily current flows between the plates. The use of EC measurements to estimate the ionic content of seawater led to the development of Practical Salinity Scale 1978 (PSS-78).3 The PSS-78 has been considered by the Joint Panel on Oceanographic Tables and Standards and recommended by all oceanographic organizations as the scale in which to report future salinity data. The practical salinity of a sample of seawater is defined in terms of the ratio of the electrical conductivity of the seawater sample at the temperature of 15ºC and the pressure of 1 standard atmosphere, to that of a potassium chloride (KCl) solution containing a mass of 32.4356 g KCl in a mass of 1 kg of solution at the same temperature and pressure. A ratio equal to 1 corresponds to a practical salinity 35
(standard seawater).4 As the definition is a ratio, practical salinity is expressed as dimensionless number.
The LAQUAtwin Salt 11 pocket meter measures the conductivity value of a sample then converts it to salinity value based on the salinity standard curve selected. The sensor has two titanium metals coated with platinum black that resist corrosion and temperature sensor for accurate measurement. The meter is programmed with two standard calibration curves—seawater and sodium chloride (NaCl). The former
Ap
plication N
ote
08-2016
Continued at the back
Measuring the salinity or the dissolved salt content of water is important as aquatic organisms, livestock, and crops thrive at different salinity levels. Freshwater has a salinity value of less than 0.5 ppt while seawater has an average salinity of 35 ppt.
Measuring Salinity of Water
OCEAN<30.0 ppt Euhaline
(Marine)
Polyhaline
Mesohaline
TidalFresh Water
Non-TidalFresh Water
(During Low FlowConditions)Tidal Limit
<18.0 ppt
<5.0 ppt
<0.5 ppt
AverageAnnualSalinity
Figure 1: Estuarine salinity slowly increases as one moves away from freshwater sources and toward the ocean. Source: Chapter 14 Salinity. Voluntary Estuary Monitoring Manual.
IMSHORIBA Group is operating Integrated Management System (IMS)
ISO9001 JOA-0298 / ISO14001 JOA-E-90039 / ISO13485JOA-MD0010 / OHSAS18001 JOA-OH0068
Horiba Instruments (Singapore) Pte Ltd83 Science Park Drive, #02-02A,
The Curie, Singapore 118258Tel. +65 6908 9660
E-mail: [email protected]
http://www.horiba-laqua.com
Continued from the front
pH COND Na+ K+ NO3– Ca2+ Salt EC
LAQUAtwin Pocket Ion Meters Lineup
SALT 11 (NaCl) Meter
2 PTCAL
ECCONV
WATERPROOF
MICRO VOLUME
FeaturesIP67 Rated salt pocket meter with robust titanium/platinum black cell that resists corrosion. NaCl and seawater standard calibration curves for accurate salinity readings
Applications includeAgriculture, Shrimp Farming, Food Quality Control, Health Management
SALT 11 (NaCl)
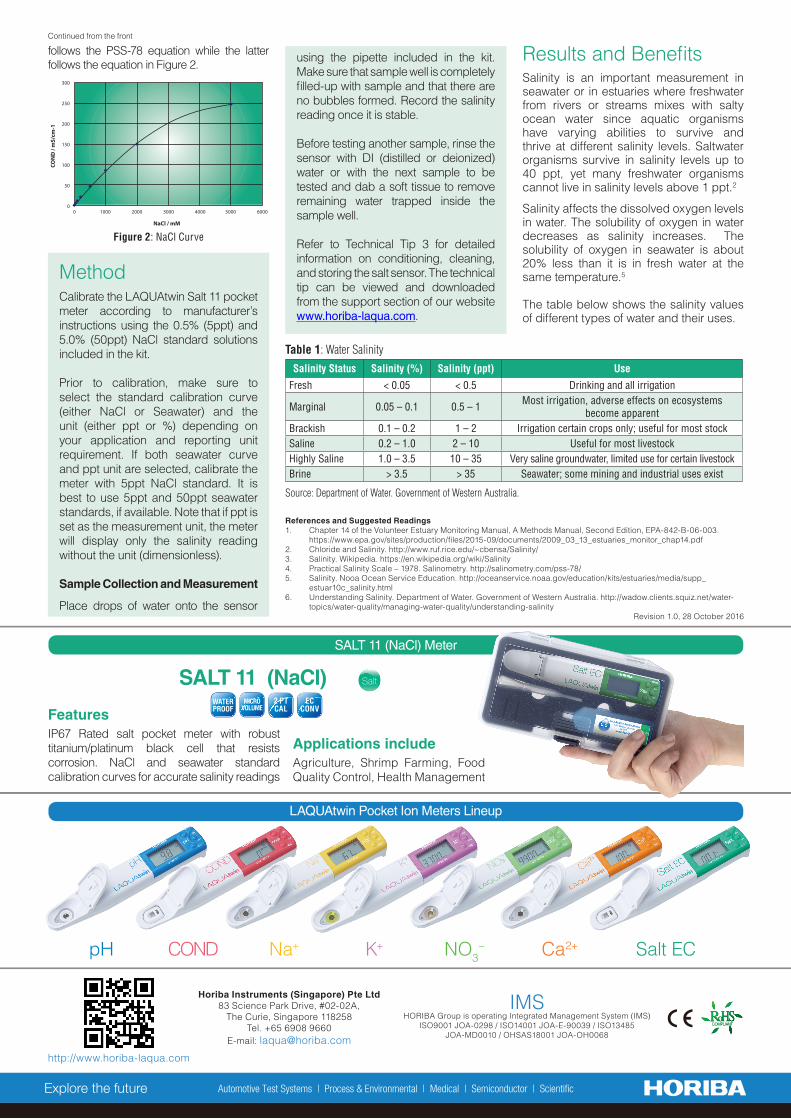
MethodCalibrate the LAQUAtwin Salt 11 pocket meter according to manufacturer’s instructions using the 0.5% (5ppt) and 5.0% (50ppt) NaCl standard solutions included in the kit.
Prior to calibration, make sure to select the standard calibration curve (either NaCl or Seawater) and the unit (either ppt or %) depending on your application and reporting unit requirement. If both seawater curve and ppt unit are selected, calibrate the meter with 5ppt NaCl standard. It is best to use 5ppt and 50ppt seawater standards, if available. Note that if ppt is set as the measurement unit, the meter will display only the salinity reading without the unit (dimensionless).
Sample Collection and Measurement
Place drops of water onto the sensor
using the pipette included in the kit. Make sure that sample well is completely filled-up with sample and that there are no bubbles formed. Record the salinity reading once it is stable.
Before testing another sample, rinse the sensor with DI (distilled or deionized) water or with the next sample to be tested and dab a soft tissue to remove remaining water trapped inside the sample well.
Refer to Technical Tip 3 for detailed information on conditioning, cleaning, and storing the salt sensor. The technical tip can be viewed and downloaded from the support section of our website www.horiba-laqua.com.
300
250
200
150
100
50
00 1000 2000 3000 4000 5000 6000
NaCl / mM
CON
D /
mS/
cm-1
Figure 2: NaCl Curve
References and Suggested Readings1. Chapter 14 of the Volunteer Estuary Monitoring Manual, A Methods Manual, Second Edition, EPA-842-B-06-003.
https://www.epa.gov/sites/production/files/2015-09/documents/2009_03_13_estuaries_monitor_chap14.pdf2. Chloride and Salinity. http://www.ruf.rice.edu/~cbensa/Salinity/3. Salinity. Wikipedia. https://en.wikipedia.org/wiki/Salinity4. Practical Salinity Scale – 1978. Salinometry. http://salinometry.com/pss-78/5. Salinity. Nooa Ocean Service Education. http://oceanservice.noaa.gov/education/kits/estuaries/media/supp_
estuar10c_salinity.html6. Understanding Salinity. Department of Water. Government of Western Australia. http://wadow.clients.squiz.net/water-
topics/water-quality/managing-water-quality/understanding-salinityRevision 1.0, 28 October 2016
Results and BenefitsSalinity is an important measurement in seawater or in estuaries where freshwater from rivers or streams mixes with salty ocean water since aquatic organisms have varying abilities to survive and thrive at different salinity levels. Saltwater organisms survive in salinity levels up to 40 ppt, yet many freshwater organisms cannot live in salinity levels above 1 ppt.2
Salinity affects the dissolved oxygen levels in water. The solubility of oxygen in water decreases as salinity increases. The solubility of oxygen in seawater is about 20% less than it is in fresh water at the same temperature.5
The table below shows the salinity values of different types of water and their uses.
Table 1: Water SalinitySalinity Status Salinity (%) Salinity (ppt) Use
Fresh < 0.05 < 0.5 Drinking and all irrigation
Marginal 0.05 – 0.1 0.5 – 1 Most irrigation, adverse effects on ecosystems become apparent
Brackish 0.1 – 0.2 1 – 2 Irrigation certain crops only; useful for most stockSaline 0.2 – 1.0 2 – 10 Useful for most livestockHighly Saline 1.0 – 3.5 10 – 35 Very saline groundwater, limited use for certain livestockBrine > 3.5 > 35 Seawater; some mining and industrial uses exist
Source: Department of Water. Government of Western Australia.
follows the PSS-78 equation while the latter follows the equation in Figure 2.