Measuring Reputational Risk: The Market Reaction to Operational
34
Measuring Reputational Risk: The Market Reaction to Operational Loss Announcements ∗ Jason Perry † and Patrick de Fontnouvelle Federal Reserve Bank of Boston Current Draft: October 2005 PLEASE DO NOT QUOTE WITHOUT PERMISSION Abstract We measure reputational losses by examining a firm’s stock price reaction to the announcement of a major operational loss event. If the firm’s market value declines by more than the announced loss amount, this is interpreted as a reputational loss. We find that market values fall one-for-one with losses caused by external events, but fall by over twice the loss percentage in cases involving internal fraud. We find that for firms with weak shareholder rights, there is not a significant difference between internal fraud and non-internal fraud events on market returns; however, for firms with strong shareholder rights, while we do not find evidence that the market reacts more than one- to-one for non-internal fraud announcements, we find strong and robust evidence that the market does fall more than one-to-one for internal fraud announcements. These results are consistent with there being a reputational impact for losses due to internal fraud while externally-caused losses have no reputational impact. ∗ We are extremely grateful to Christine Jaw and Ricki Sears for their research assistantship. In addition, we thank Kabir Dutta and Eric Rosengren for their comments on the initial drafts and Jameson Riley and Trang Nguyen for help with the construction of the database. The views expressed in this paper do not necessarily reflect the views of the Federal Reserve Bank of Boston or the Federal Reserve System. † Federal Reserve Bank of Boston, Mail Stop T-10, 600 Atlantic Avenue, P.O. Box 55882, Boston, MA 02205, tel: 617-973-3620, fax: 617-973-3219, email: [email protected].
Transcript of Measuring Reputational Risk: The Market Reaction to Operational
Measuring Reputational Risk: The Market Reaction toOperational Loss Announcements∗
Jason Perry†
andPatrick de Fontnouvelle
Federal Reserve Bank of Boston
Current Draft: October 2005PLEASE DO NOT QUOTE WITHOUT PERMISSION
Abstract
We measure reputational losses by examining a firm’s stock price reaction to theannouncement of a major operational loss event. If the firm’s market value declines bymore than the announced loss amount, this is interpreted as a reputational loss. Wefind that market values fall one-for-one with losses caused by external events, but fallby over twice the loss percentage in cases involving internal fraud. We find that forfirms with weak shareholder rights, there is not a significant difference between internalfraud and non-internal fraud events on market returns; however, for firms with strongshareholder rights, while we do not find evidence that the market reacts more than one-to-one for non-internal fraud announcements, we find strong and robust evidence thatthe market does fall more than one-to-one for internal fraud announcements. Theseresults are consistent with there being a reputational impact for losses due to internalfraud while externally-caused losses have no reputational impact.
∗We are extremely grateful to Christine Jaw and Ricki Sears for their research assistantship. In addition,we thank Kabir Dutta and Eric Rosengren for their comments on the initial drafts and Jameson Riley andTrang Nguyen for help with the construction of the database. The views expressed in this paper do notnecessarily reflect the views of the Federal Reserve Bank of Boston or the Federal Reserve System.
†Federal Reserve Bank of Boston, Mail Stop T-10, 600 Atlantic Avenue, P.O. Box 55882, Boston, MA02205, tel: 617-973-3620, fax: 617-973-3219, email: [email protected].

1 Introduction
Over the past decade financial scandals, large lawsuits, and terrorist attacks have seized
international headlines and brought increased attention to operational losses. Some of the
largest recent loss announcements exceeded 1 billion US dollars. However, the announced
dollar amounts likely understate the effect of operational losses on the financial sector. This
is because in addition to inflicting direct financial losses upon a firm, operational loss events
may have an indirect impact on a firm via reputational risk. Disclosure of fraudulent activity
or improper business practices at a firm may damage the firm’s reputation, thereby driving
away customers, shareholders, and counterparties.
Reputational risk has been the subject of significant attention in both academic literature
and the financial press, yet direct evidence of reputational losses at financial firms has been
limited. In a recent survey of financial services institutions, more respondents cited reputa-
tional risk than any other risk class as the greatest potential threat to their firm’s market
value.1 Our paper is closely related to recent work by Cummins, Lewis and Wei (2004), who
also assess the impact of operational loss announcements on the market value of financial in-
stitutions. These authors focus on the relationship between operational losses and Tobins Q,
and find that operational loss announcements have a larger market impact for firms with bet-
ter growth prospects. The current paper focuses on the relationship between the magnitude
of an operational loss, the nature of the loss, and the governance structure of the firm where
the loss occurred. Our results from doing so suggest that operational losses have important
reputational consequences, an issue only tangentially considered by Cummins et. al.
1See “Uncertainty Tamed? The Evolution of Risk Management in the Financial Services Industry,” Price-waterhouseCoopers/Economist Intelligence Unit (2004).
1

Despite the recent attention focused on operational losses, however, there has been only
minor progress in quantifying reputational risk. We approach this problem indirectly by
examining the reputational impact of operational losses. More specifically, we measure rep-
utational losses by examining a firm’s stock price reaction to the announcement of a major
operational loss event. Loss percentages are computed as dollar losses divided by the firm’s
market capitalization, and a market model is used to determine abnormal returns for each
organization. The abnormal return for a firm is defined as the difference between the firm’s
actual return and the expected return based on a one-factor market model. Any decline in a
firm’s market value that exceeds the announced loss amount is interpreted as a reputational
loss.
We have gathered data on 115 operational losses occurring at financial firms worldwide
between 1974 and 2004. We find that the announcement of an operational loss has an imme-
diate and significant impact upon a firm’s market value. We also find that market values fall
one-for-one with losses caused by external events, but fall by over twice the loss percentage
in cases involving internal fraud. These results are consistent with there being a reputational
impact for losses due to internal fraud while externally-caused losses have no reputational
impact.
We further investigate whether the reputational impact of losses due to internal fraud is
different for firms with weak shareholder rights versus firms with strong shareholder rights.
We use the corporate governance index described by Gompers, Ishii and Metrick (2003) as
a proxy for shareholder rights and find that for firms with weak shareholder rights, there is
not a significant difference between internal fraud and non-internal fraud events on market
returns; however, for firms with strong shareholder rights, while we do not find evidence
2

that the market reacts more than one-to-one for non-internal fraud announcements, we find
strong and robust evidence that the market does fall more than one-to-one for internal fraud
announcements. In particular, our point estimates suggest that the market declines by more
than 6 times the announced internal fraud loss when the loss is made by a firm with strong
shareholder rights.
Our findings have several important implications beyond reputational risk. First, it is
sometimes argued that operational losses are not capital events. That is, most operational
events are one-time losses that do not affect the revenue stream. Since losses tend to be small,
they should not have a market impact, and it is not necessary to hold capital for such events.
While one may object to this argument on theoretical grounds, our results provide a solid
empirical rejection. The market reaction to operational losses is immediate and significant,
even when the loss amount is small relative to firm size. Thus, the market does consider
operational losses to be capital events.
The remainder of the paper is organized as follows: In Section 2 we highlight the concepts
pertaining to reputational risk and review the recent literature. In Section 3 we describe
our data sources and the construction of the main data set. We use Section 4 to outline
the methodology used to derive the empirical results in Section 5. Finally, in Section 6 we
conclude and suggest some possible avenues for future research.
2 Background
In this section we provide important background information concerning the issue at hand. We
first outline the risk definitions used throughout the analysis. Then, we review the previous
3

literature focusing on operational risk and the reputational consequences that operational
losses have on firms.
2.1 Risk Definitions
Much of the work in the field of risk management has been focused on defining and quanti-
fying market and credit risk. However with institutions now facing larger and more severe
operational losses, operational risk has moved to the fore of the field. Recently, there has
also been recognition that organizations should hold capital in proportion to the operational
risks to which they are exposed. The Basel Committee on Banking Supervision has been
proposing that banks hold regulatory capital for operational risk as part of a new Basel Ac-
cord. According to the Basel Committee (2003) definition, operational risk is “the risk of loss
resulting from inadequate or failed internal processes, people and systems, or from external
events.” This definition excludes both strategic risk and reputational risk.
Reputational risk remains one of the more elusive risks because of the difficulty in mea-
suring it as well as a lack of understanding of the mechanisms that generate this risk. A
regulatory definition of reputational risk as defined by the Board of Governors of the Federal
Reserve System (2004) is:
Reputational risk is the potential that negative publicity regarding an institution’s
business practices, whether true or not, will cause a decline in the customer base,
costly litigation, or revenue reductions.
In general a reputational risk is any risk that can potentially damage the standing or estimate
of an organization in the eyes of third-parties. Oftentimes the harm to a firm’s reputation is
4

intangible and may surface gradually. However, there is strong evidence that equity markets
immediately react to the reputational consequences of some events.
In a simple model, a firm’s stock price is equal to the present discounted expected value
of the cash flows it will generate. Any reputational event that reduces present or future
expected cash flows will reduce the equity value of the firm. For instance, this can happen
if a loss announcement is viewed as a signal that the firm has a poor control environment.
Shareholders may sell stock if they believe that future losses are imminent. Reputational losses
can also materialize when shareholders infer that there may be direct negative consequences
for future cash flows. There are several paths by which reputational risk can induce losses for
a firm:
• Loss of current or future customers2
• Loss of employees or managers within the organization, an increase in hiring costs, or
staff downtime
• Reduction in current or future business partners
• Increased costs of financial funding via credit or equity markets
• Increased costs due to government regulations, fines, or other penalties
Thus, reputational risk either erodes firms’ expected future cash flows or increases the mar-
ket’s required rate of return. Hence, an indirect way of measuring a reputational event is to
estimate the impact of a loss announcement on a firm’s equity value. This is the approach we
take in this paper. We do not attempt to distinguish among the third-parties that may be
inducing reputational losses at a firm. We merely attempt to measure the aggregate impact
2Typically this involves a reduction in expected future revenues, but it could also involve an increase incosts if, for example, increased advertising expenditures are necessary to curb reputational damage.
5

of all third-parties on the equity value of firms. Furthermore, we are implicitly assuming
that investors expect that the announced loss amounts are unbiased estimates of the actual
incurred losses.3
2.2 Previous Literature
Cummins, Lewis and Wei (2004) assess the market value impact of operational loss announce-
ments by US banks and insurance companies. Their results reveal that equity values respond
negatively to operational loss announcements, with insurance stocks having a larger reac-
tion than bank stocks. Cummins et al. also find a positive relationship between losses and
Tobin’s Q, suggesting that operational loss announcements have a larger market impact for
firms with better growth prospects. In addition, they find some evidence that market value
losses are more severe than the announced losses, perhaps implying that the losses convey
adverse imformation about future cash flows.
Palmrose, Richardson and Scholz (2004) assess the market reaction to earnings restate-
ment announcements. Instead of using a proprietary database like OpVar, they compile their
own data set by searching through Lexis-Nexis and SEC filings. They find that over a 2-day
window surrounding the announcement, average abnormal returns are approximately -9%.
Perhaps their most interesting finding is that the market reaction is more negative for re-
statements involving fraud. Palmrose et al. posit that investors are more concerned about
restatements that have negative implications for management integrity than for restatements
due to “technical accounting issues.”
3This is a critical assumption because if this bias is correlated with the loss percentage or any other firmcharacteristic, our implications regarding reputational risk may be biased.
6

Karpoff and Lott (1993) analyze the reputational losses that firms experience when they
face criminal fraud charges. In a sample of corporate fraud announcements from 1978 to 1987,
they find that the initial announcements of frauds against private parties and government
agencies correspond to average stock declines of about 1.3% and 5.1% respectively. They also
find that the actual court-imposed costs, penalties, and criminal fines amount to less than
10% of the total market value loss. Under reasonable assumptions the authors find it unlikely
that the declines in the large market value are due to shareholders’ greater expected penalties
for future fraud. They also find some evidence that a firm’s earnings decline after a fraud
announcement.
Murphy, Shrieves and Tibbs (2004) examine the market impact on firms alleged to have
committed acts of misconduct such as antitrust violations, bribery, fraud, and copyright
infringements. They find that of these types of misconduct, fraud has the greatest negative
impact on stock prices. In addition, they find that firm size is negatively related to the
percentage loss in firm market value and that allegations of misconduct are accompanied by
increases in the variability of stock returns. Murphy et al. attribute the influence of firm size
on market losses to both an economy of scale effect and a reputation effect. In the economy
of scale effect, if acts of misconduct impose fixed costs on the firm, then percentage losses will
be smaller for larger firms. With a reputation effect, larger firms with better brand names
may more easily counter the reputational damage of an allegation, hence reducing the loss
impact.
Our paper is similar to the previous event studies in that we assess the market reaction to
loss announcements. We hypothesize that operational loss announcements with more severe
negative market reactions are a consequence of reputational effects. We extend the literature
7

by linking these reputational effects to characteristics of the announcement such as the loss
type, the business line incurring the loss, and the strength of shareholder rights of the firm
making the announcement.
3 Data and Sample Selection
Two proprietary data sets from Algorithmics were used to identify a preliminary set of op-
erational losses occurring at financial institutions. These data sets are Algo OpData and
OpVantage FIRST. OpData (formally called OpVar) has been used by de Fontnouvelle,
DeJesus-Rueff, Jordan and Rosengren (2004) to quantify operational risk for large, inter-
nationally active banks. We also executed several direct searches of on-line news archives to
expand the preliminary set of operational loss announcements. This collection of events was
filtered to remove events that were not “surprises” to the market or announced losses that
were not sufficiently large enough to have a material impact on the firm. With this in mind,
we created the following criteria for loss announcements to meet in order to be included in
our final analysis:
• The parent company was publicly traded in North America, Europe, Japan, New
Zealand, or Australia and price and market capitalization data were available at the
time of the loss announcement.
• The loss was operational, and must have been known to be so at the time of the
announcement.
• There had been no prior announcement of the loss, either through rumor or miscella-
8

neous charge-offs.4
• A precise loss amount or exposure was announced on the day of the first announcement,
or shortly thereafter.
• There were no obvious confounding events (e.g., the loss was not announced as part of
a quarterly report).
Because of the strictness of these criteria, very few events remained. For instance, there were
no lawsuits included in our final database because an exact loss amount cannot be ascertained
on the day of the lawsuit announcement. Suits do not settle until several months or years
after the original announcement. More than half of the events in the OpData database were
eliminated due to this issue.
In the Algo databases, the event dates are “settlement dates,” which correspond to the
determination of the final loss amount. Our announcement date was chosen as the date of
the initial news article even if the announcement of the actual loss amount appeared several
days later. If an announcement occurred on a weekend, the announcement date was chosen
to be the next trading day.5
For US-domiciled firms meeting these criteria, stock price and shares outstanding data
for the parent companies were obtained from CRSP; data for foreign-domiciled firms were
obtained from Bloomberg. All stock prices were adjusted for splits and dividends.6 To
4Some events had future announcements adjusting the original loss to a significantly higher amount. Ifan additional loss announcement was made 75 or more trading days after the original announcement, thesubsequent announcement was treated as a separate event. We did not consider future loss announcementsthat modified the loss to a lower amount.
5The loss amounts recorded in the Algo databases are finalized loss amounts. These may differ fromthe loss amounts used in our analysis because our loss amounts are the ones reported in the original newsannouncement. The reason for this is that we assume that the market reaction only depends upon informationannounced by the media at the time of the original event.
6Some daily shares outstanding data were unavailable. In these cases, the closest annual shares outstandingdata were used.
9
market-adjust returns, we collected data on the corresponding country’s stock index.7
Several categorical variables were created for each of the announced operational losses.
First, each loss was classified into the following event type categories: Internal Fraud; Ex-
ternal Fraud; Execution, Delivery, and Process Management; Employment Practices and
Workplace Safety; Business Disruption and System Failure; and Clients, Products and Busi-
ness Practices. A dummy variable was created to indicate whether the loss had an internal
cause. Similarly, a dummy variable was created to indicate whether the loss had an external
cause. If an event has both internal and external causes, then both dummies are one. Each
announced loss amount was classified as either a loss or an exposure (i.e., maximum possible
loss). Losses were further stratified by business line. Finally, dummy variables were created to
indicate whether insurance coverage was mentioned in the loss announcement. Pre-tax losses
were recomputed to after-tax values assuming a marginal tax rate of 35% for all firms. This
is not a completely realistic assumption because tax rates differ across countries. However,
assuming a flat tax rate of 35% among all firms makes the problem of comparing losses across
countries far more tractable.8
For each firm in our data, we also consider the value of the corporate governance index G
described in Gompers, Ishii and Metrick (2003).9 The index G is a measure of shareholder
rights. G can potentially take values from 0 to 24 with higher numbers representing weaker
shareholder rights (or equivalently stronger managerial control). The index is constructed by
7The following indexes were used as market factors: S&P 500 (US firms), S&P TSX (Canadian firms),AEX (Dutch firms), AS30 and AS51 (Australian firms), BEL20 (Belgian firms), CAC (French firms), DAX(German firms), FTASE (Greek firms), IBEX (Spanish firms), MIB30 (Italian firms), OMX (Swedish firms),SMI (Swiss firms) and TOPIX (Japanese firms). The FTSE Eurotop 100 index was tested for all Europeanfirms, and similar results were found.
8The tax rate of 35% was chosen because it is close to the average marginal corporate tax rate for USfirms. The loss was assumed to be pre-tax unless otherwise stated in the loss announcement.
9These data are available from http://finance.wharton.upenn.edu/ metrick/data.htm as of August 2005.
10

considering 24 unique charter, bylaw, and state-level provisions for each firm. The provisions
take into account voting rights, director protections (such as golden parachutes and severance
payments), takeover defenses (such as poison pills and antigreenmail), and state laws (such as
cash-out laws and fair price laws).10 To keep the index as objective and replicable as possible,
no determination is made with regard to the strength of these provisions at each firm. The
index is either increased or decreased by a value of 1 for each provision present, depending
upon whether the provision strengthens or weakens shareholder rights.
The value of the corporate governance index is only available for US firms. In addition,
the index value is computed only for the following years: 1990, 1993, 1995, 1998, 2000, 2002,
and 2004. For each event date we used the value of G immediately prior to the announcement
date. If the event occurred before 1990, we used the value of G from 1990. This is somewhat
innocuous because Gompers et al. find that the value of G is very stable for each firm over
time. We found this to be the case in our sample as well. For the full sample in Gompers et
al. (2003), the median of G is 9, and G has a range from 1 to 19.
4 Methodology
We measure a firm’s stock price reaction to operational loss announcements. It is hypothesized
that in the absence of reputational effects, a firm’s market value will decline one-for-one with
the announced loss. Using an event study analysis, we interpret reputational losses as any
losses that exceed the announced loss amount.11 The goal of this analysis is to ascertain the
observable event variables that are correlated with the implied reputational impacts.
10See Gompers et al. (2003) for definitions of these terms.11See MacKinlay (1997) for an overview of event studies in economics and finance.
11

We begin with the assumption that the equity markets are efficient in that public infor-
mation is incorporated into market prices within a short period of time. To account for the
possibility of information leakage, we choose event windows that include days prior to the an-
nouncement. Throughout the analysis we use a one-factor market model to adjust individual
stock returns for changes in the overall market. Specifically, we assume that for each event
i = 1, . . . , n at time t,
rit = αi + βirmt + εit (1)
where n is the total number of events in the sample, rit is the firm’s logarithmic return, rmt is
the return on an appropriate equity index, αi and βi are parameters, and εit is the disturbance
term. All stock prices are adjusted for dividends and splits.
For each event, Model 1 is estimated using OLS regressions over 250-trading-day periods,
which terminate 15 days prior to the announcement so as not to overlap the market model
estimation period with the event window period. We define an event window as the length
of time beginning τ0 days prior to the announcement and τ1 days after the announcement.
Hence, the length of the event window is τ1−τ0 days.12 For each period t in the event window
interval [τ0, τ1], we estimate abnormal returns for each event i as
ARit = rit − (α̂i + β̂irmt) (2)
where α̂i and β̂i are the OLS estimates of αi and βi from Model 1. Typically, τ1 is chosen to
be large enough to allow the market to completely react to the announcement information.
Throughout the analysis we will compute abnormal returns over a wide variety of event
12It is customary to use t = 0 as the date of the announcement so that τ0 is a negative number.
12
windows as a robustness check.
In order to quantify the complete impact of an announcement over the event window,
it is important to aggregate abnormal returns in some fashion. We do this by constructing
a cumulative abnormal return (CAR) over the interval [τ0, τ1] for each event i using the
abnormal returns estimated in Equation 2:
CARi[τ0,τ1] =
τ1∑t=τ0
ARit. (3)
For example, CARi[−10,20] denotes the cumulative abnormal return for event i where the
event window begins 10 days prior to the announcement and terminates 20 days after the
announcement.
5 Empirical Results
The results are divided into three subsections: Descriptive Results, Full Sample Regression
Results and Corporate Governance Regression Results. Section 5.1 highlights the basic struc-
ture of the loss database after the event filters have been applied. Several figures are shown to
illustrate the effect of the announcements on the aggregate cumulative abnormal returns. In
Section 5.2 we report the results of regressions of CARs on event variables for the full sample,
while in Section 5.3 we discuss the link between corporate governance and reputation.
5.1 Descriptive Results
Table 1 shows aggregated sample statistics in loss percentages. A loss percentage is com-
13

Table 1: Aggregated Sample Statistics for the Distribution of Loss Announcement Percentages
puted as the announced loss amount in the currency reported in the article divided by the
market capitalization of the firm in the same currency.13 The advantage of working with loss
percentages as opposed to loss amounts is that loss comparisons can be made across firms in
different countries because exchange rates do not affect loss percentages.
The table is divided into three main sections: all companies, US companies, and non-US
companies. There are 115 operational loss announcements in total of which a little under
half are from US firms. Almost 40% of the sample consists of internal fraud events and about
another 40% of the events had an external cause. The average operational loss announcement
was around 1.9% of market capitalization, and the median was about 0.4%.
13In most cases the local currency was reported in the news announcement.
14

For the full sample of events, the distribution of loss percentages for US and non-US
firms appears equivalent. The mean, median, standard deviation, and skewness are almost
equivalent. For internal fraud events, the distribution of loss percentages for US and non-US
firms appears somewhat equivalent. Although it may seem in Table 1 that there are small
differences in the point estimates between US and non-US firms when the sample is broken
into event types, these differences are not statistically significant. Furthermore, the event
filters were determined ex ante and were applied consistently to each announcement. Hence,
we conclude that US and non-US firms can be treated equivalently in the analysis.
One way to visualize the market reaction of an operational announcement is to estimate
the CAR for each event, aggregate the CARs across events, and graph the results. Because
the market reaction for each event depends upon the magnitude of the loss, aggregating the
CARs using a simple arithmetic average is not very meaningful. Instead, we propose to use
a weighted average approach.
First, the CAR for each event i is divided by the actual loss percentage in order to compute
a “normalized” CAR. The normalized CAR is denoted NCAR. Formally,
NCARi[τ0,τ1] ≡CARi[τ0,τ1]
�i
where �i is the loss percentage for event i. The variable NCAR can be used as a measure
of the reputational impact of the loss announcement. If the market is efficient and there are
no reputational effects from the announcement, we hypothesize that NCAR will be equal to
negative one. In other words, NCAR equals negative one when the announced loss percentage
is exactly equal to the percentage reduction in the firm’s equity value over the event window.
15

Once the NCARs are computed for each event, they can be aggregated by giving more
weight to the events with the largest loss percentages. We construct the weighted average
cumulative abnormal return, NCAR, by simply weighting each NCAR in an average:
NCAR[τ0,τ1] ≡n∑
i=1
⎛⎜⎜⎝NCARi[τ0,τ1] · �i
n∑i=1
�i
⎞⎟⎟⎠ =
n∑i=1
CARi[τ0,τ1]
n∑i=1
�i
. (4)
Because NCAR is a weighted average of the NCARs, NCAR will also take a value of negative
one if, on average, there are no reputational effects from the loss announcements. If aggregate
losses create reputational damage, NCAR will be less than negative one.
The reputational impacts of operational loss events can be visualized by plotting a time
series of NCARs. This is done by computing NCAR[τ0,τ ] for all τ ∈ [τ0, τ1] and plotting
the NCARs sequentially in time. Figure 1 illustrates NCAR[−15,60] in this manner for all
operational events in the sample as well as the sub-sample of internal fraud events. It is
clear from the graph that there is an immediate and large negative stock price reaction to
loss announcements. It appears as though the market reaction is about 1.5 times the loss
announcement for all events; however, the market loss is not statistically greater than a one-to-
one loss. Judging from the graph, it appears as though the market reacts by a factor of about
2 to the internal fraud announcements. In this case, we do find statistically significant results
in favor of there being a larger than one-to-one market reaction. These tests of statistical
significance are discussed in Section 5.2.
Another way to visualize the market reaction of an operational announcement is to esti-
mate the CAR for each event and plot this against the loss percentage. Figure 2 provides a
16

Figure 1: Estimated NCAR Over the Event Window for All Events and Internal Fraud Events
graphical overview of the loss data in a [-15,30] window in the form of a traditional scatter
plot. The horizontal axis indicates each firm’s announced loss amount as a percentage of
the firm’s market capitalization, and the vertical axis indicates the negative of each firm’s
CAR[−15,30]. The solid line plots the 45 degree line. Any point that lies along this line repre-
sents an event where the percentage market decline was one-for-one with the announced loss
percentage. There is a positive relationship between the announced loss percentage and the
CAR[−15,30].
Visual inspection suggest that the slope of this relationship is near one, although there is
significant noise. This noise is consistent with Roll (1988) who shows that less than half of
17

Figure 2: Scatter Plot of −CAR[−15,30] Versus Loss Percentages for All Operational Events
a stock’s price variation can be attributed to industry conditions, general economic trends,
and company news announcements. The points in the scatter plot are separated into internal
fraud events and operational events that are not internal fraud. On average, the internal
fraud events lie at a further distance above the 45 degree line. This implies that the market
reaction is larger for internal fraud events relative to other types of operational events.
5.2 Full Sample Regression Results
In order to more precisely estimate the impact of operational loss announcements on the
market value of firms, we estimate a series of regressions of the CAR for each event on the
18

firm’s announced loss percentage. Formally, we assume a simple linear regression model,
−CARi[τ0,τ1] = ρ · �i + ξi, i = 1, . . . , n, (5)
where ρ is a parameter that represents the average impact factor of loss announcements on
the market value for firms given the sample of n events, and ξi is the disturbance term for
event i. The regression model lacks a constant term because when there is no announced loss
(�i = 0), the average CAR should theoretically be zero. In other words it is assumed that
after controlling for changes in the overall stock market, expected firm stock prices only react
to new information.
To test whether loss announcements have any effect at all on the market value of firms,
we use the following hypothesis test:
H0 : ρ = 0
H1 : ρ �= 0.
A rejection of the null hypothesis would be consistent with the results of Cummins et al.
(2004). The more interesting test is to determine whether there are any reputational impacts
on the market value of firms that make operational loss announcements. In the absence
of reputational effects, ρ in Model 5 should be equal to one. If the market overreacts to
announcements (meaning that firm market values tend to decline by a larger percentage
than the announced loss percentage), then ρ will exceed unity. Hence, we use the following
one-tailed test to examine the reputational impact of operational loss announcements:
H0 : ρ = 1
H1 : ρ > 1
19

In order to check for robustness, we run OLS regressions of Model 5 over a wide variety of
event windows and sub-samples. There are three starting values for τ0 (-15, -10, and -5 days),
and there are five terminating values for τ1 (10, 15, 20, 30, and 60 days) for a total of fifteen
different event windows. In addition to the full sample of operational events, the sub-samples
containing only internal events, external events, internal fraud, and internal events excluding
internal fraud are also included.
Table 2 reports the results of these regressions for the first hypothesis test. The estimated
value of ρ̂ is greater than zero for all sub-samples and event types. For the full sample of
operational events, internal fraud events, and internal events, the null hypothesis ρ = 0 is
rejected at the 1% level for all of the event windows in the table. For external events and
internal events that exclude internal fraud, the null hypothesis ρ = 0 is rejected at the 1%
for the majority of the event windows tested. This is strong evidence that operational loss
announcements have an immediate and significant negative impact on a firm’s market value.
Table 3 reports the results of the second hypothesis test for ρ = 1. The null hypothesis is
rejected for the sub-sample of internal fraud events, but not for the other event categories. For
internal fraud events, the null hypothesis ρ = 1 is rejected at the 1% level for all event windows
except for windows terminating 30 and 60 trading days after the announcement, where the
null is rejected at the 5% and 10% level respectively. One might expect to see statistical
significance decline as the event window expands due to an increase in noise. We find no
evidence that external event announcements induce reputational losses for firms. These results
are consistent with the assumption that reputation only impacts operational events involving
internal fraud. In fact, the estimated value of ρ̂ ranges from about 2.4 and 3.0 for internal
fraud events depending upon the particular event window chosen. A point estimate for ρ of
20

Table 2: Model 5 OLS Regressions with Hypothesis Tests for ρ = 0
21

Table 3: Model 5 OLS Regressions with Hypothesis Tests for ρ = 1
22

3.0 implies that on average, a firm making an internal fraud announcement will see its market
value drop by three times its announced loss percentage. This is evidence that internal fraud
events are the most costly for firms’ reputations. An internal fraud announcement may signal
to investors that there are fundamental internal control problems at a firm.
5.3 Corporate Governance Regression Results
In the previous section we showed that there is a link between the market reaction to an oper-
ational loss announcement and whether that loss is due to internal fraud or not. The market
reaction may also be correlated with characteristics of the firm making the announcement.
One of the more interesting firm characteristics that we consider is the strength of shareholder
rights at the firm. Gompers et al. (2003) construct a corporate governance index to mea-
sure the strength of shareholder rights for a large sample of US firms. They find that their
corporate governance index G is highly correlated with firm performance. Specifically, they
find that firms with weaker shareholder rights (higher values of G) have lower stock returns,
lower firm value (as measured by Tobin’s Q), lower profits, and lower sales growth. Perhaps
differences in firms’ corporate governance structures are also correlated with the magnitude
of reputational consequences following an operational loss announcement.
One could hypothesize that when an operational loss occurs at a firm with strong share-
holder rights, the reputational effect may be small because investors are confident that they
will have enough control over management to mitigate any future consequences from the loss.
Conversely, one could argue that the opposite hypothesis. Because it is easier for shareholders
to modify the control environment in a firm with strong shareholder rights, then these firms
should have better control environments. If investors link the degree of shareholder rights at
23

a firm to the effectiveness of its control environment, then following an operational loss at
a firm with strong shareholder rights, reputational damage is more pronounced given that
investors may be more surprised to see a loss occur at a firm where investors have had more
control.
Clearly, the type of event is of primary interest as well. Losses that are viewed as un-
controllable by management, such as certain external losses, should have the same effect on
the market value of a firm whether it has weak or strong shareholder rights. Whereas losses
due to internal fraud, which were results of faulty management control, may have differing
impacts on firms with weak versus strong shareholder rights.
To test these hypotheses we examine the sub-sample of events for which there exists a value
for G. We are left with only 40% of the original sample because the index is only available
for larger US firms. For consistency we check to see whether the results from Section 5.2 hold
for the sub-sample. Indeed, we do find that we only reject the null that the coefficient on the
announced loss percentage is equal to one for the set of internal fraud events. Because we find
that it is only for internal fraud events that the market reacts more than one-to-one with the
loss announcement, we restrict our attention throughout the remainder of this section to the
differential market impact of internal fraud and non-internal fraud announcements for firms
with strong or weak shareholder rights.
Table 4 enumerates the number of sample observations for each event type that fall into
each corporate governance index category. The median value of the index for each event
type falls between 8 and 11. Because the corporate governance index G may not be linearly
correlated with reputation, we sorted firms into two groups: those with weak shareholder
rights (high values of G denoted by GH) and those with strong shareholder rights (low values
24

Table 4: Frequency of Corporate Governance Index by Event Type
of G denoted by GL). We base our conclusions on a threshold of 10 for G because this
threshold resulted in approximately equal-sized samples. Our results are robust to other
threshold choices as well.
We assume a linear regression model for the m events in the sub-sample,
−CARi[τ0,τ1] = γ1 · �i + γ2 · �i · Di + ξi, i = 1, . . . , m, (6)
where Di is a dummy variable that equals one if event i is an internal fraud event and equals
zero otherwise. The parameter γ1 represents the average impact factor of non-internal fraud
loss announcements on the market value for firms, and γ1 + γ2 represents the average impact
factor of internal fraud loss announcements on the market value for firms. Hence, γ2 signifies
the differential impact of loss announcements on firm market value between internal and non-
internal fraud announcements. Model (6) is estimated for both GH firms and GL firms over
a variety of event window intervals [τ0, τ1].
25
As before, we wish to test whether internal fraud events impact reputation more than
events that are not internal fraud for firms with weak and strong shareholder rights. Formally,
we make the following hypothesis tests:
Test I Test II Test III
H0 : γ1 = 1 H0 : γ2 = 0 H0 : γ1 + γ2 = 1
H1 : γ1 > 1 H1 : γ2 �= 0 H1 : γ1 + γ2 > 1.
Table 5 shows the results from the Model (6) regressions where GH is defined as the sample of
firms having G ≥ 10. This division of firms into weak and strong shareholder rights partitions
the sample into somewhat equal-sized groups. The table is divided into three sections with the
coefficients γ1, γ2, and γ1 + γ2 presented from top to bottom. The t-statistics in parentheses
correspond to the appropriate hypothesis test given in the left-most column of the table.
According to the results in the top section of Table 5, hypothesis Test I is rejected for
only the firms with weak shareholder rights. This result appears to be consistent across the
different event window intervals. Thus, we find no evidence of reputational damage for non-
internal fraud events in firms with strong shareholder rights; however we do find that the
market reacts by a factor greater than 2.5 for firms with weak shareholder rights. This result
is significant at the 5% level in all but one event window.
The estimates presented in the middle section of Table 5 are relevant in determining
whether internal fraud events impact the market value of firms to a greater or lesser extent
than non-internal fraud events. Because it is not clear a priori the direction of the impact,
hypothesis Test II is a two-tailed test. The results indicate that there is not a significant dif-
ference between internal fraud and non-internal fraud events for firms with weak shareholder
26

Table 5: Model 6 Regressions with Hypothesis Tests for GH and GL with Threshold G ≥ 10 for GH .
27
rights; however, there is a positive significant difference (Test II is rejected) for firms with
strong shareholder rights.14
The bottom section of Table 5 illustrates the relationship between internal fraud events
and the market value for firms. Hypothesis Test III is strongly rejected for firms with strong
shareholder rights, whereas there is only weak rejection for firms with weak shareholder
rights. The strong rejection refers to the rejection at the 1% level for many of the window
intervals. The weak rejection refers to the hypothesis not being rejected for the shortest
window intervals.15 Furthermore, the point estimate of the sum γ1 + γ2 for the GL firms is
about double that for the GH firms. Thus, we conclude that the market reacts more to internal
fraud events for firms with strong shareholder rights than those with weak shareholder rights.
In order to display the results in a more robust fashion, we present the same type of
regressions presented in Table 5, except that GH firms are now defined as firms with G ≥ 9
instead of G ≥ 10. These results are shown in Table 6. In terms of the coefficient estimates,
there is not much difference between Table 5 and Table 6. Most of the t-statistics, however,
are lower in Table 6. Also, hypothesis Tests I and III are rejected for GH firms in most of the
event windows in Table 5, but we fail to reject these hypotheses in Table 6. Although there
appears to be somewhat less significant results for GH firms, the overall results are still quite
significant for GL firms. When we separate firms into weak and strong shareholder rights
using different thresholds, the results look similar to those presented in Table 6.
In summary, we find that for firms with weak shareholder rights, there is some evidence
14The difference is significant at the 1% level for the shortest windows beginning 5 days prior to theannouncement: [−5, 10], [−5, 15], and [−5, 20]. At the 5% significance level hypothesis Test II is rejected forall firms with windows of 30 days or more after the announcement date.
15We would expect to be less likely to reject any hypothesis test when the event window is longer. Longerevent windows imply that there will be more noise present in the CAR.
28
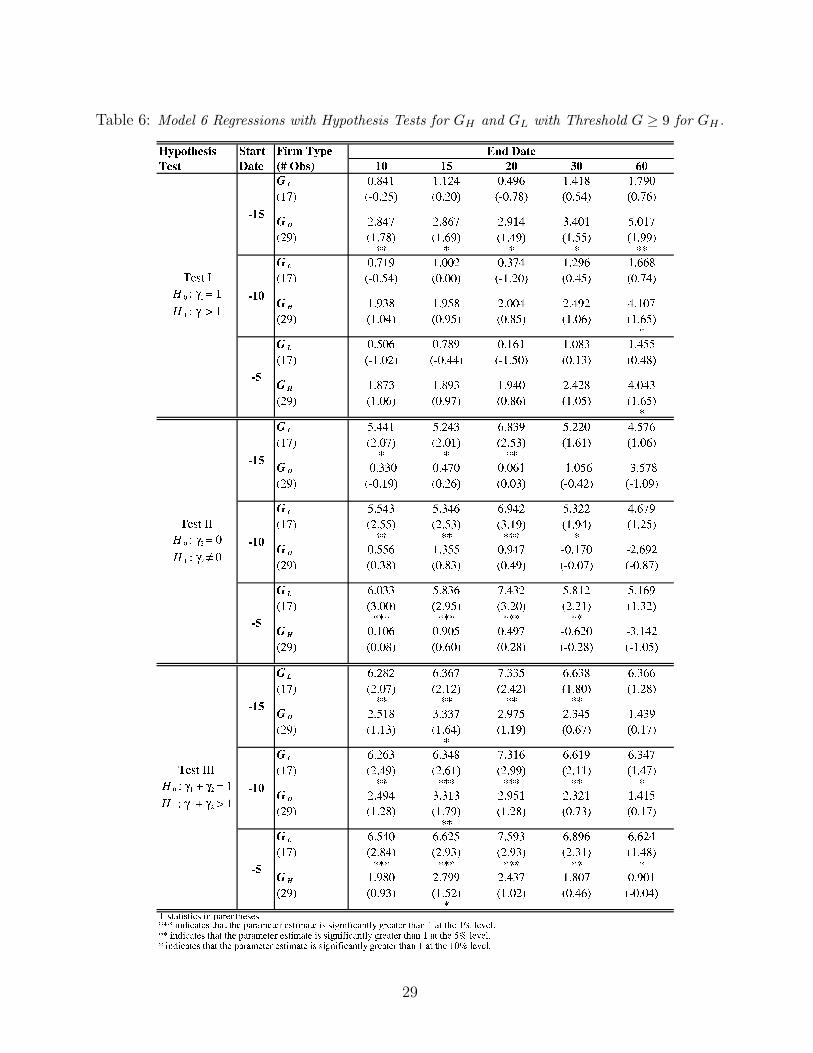
Table 6: Model 6 Regressions with Hypothesis Tests for GH and GL with Threshold G ≥ 9 for GH .
29

that the market reacts more than one-to-one with both internal fraud and non-internal fraud
announcements. We do not find any significant difference between internal fraud and non-
internal fraud events in terms of the their differential impact on the market returns of firms
with weak shareholder rights. For firms with strong shareholder rights, while there is no
evidence that the market reacts more than one-to-one for non-internal fraud announcements,
we find fairly strong and robust evidence that the market does fall more than one-to-one for
internal fraud announcements. In fact, we find that the market drops by more than 6 times
the announced internal fraud loss. This is the strongest result we find related to corporate
governance in terms of both economic as well as statistical significance. These results are
consistent with there being large reputational effects for internal fraud announcements made
by firms with strong shareholder rights. Our evidence is also consistent with there being
some weak reputational effects for both internal fraud and non-internal fraud announcements
made by firms with weak shareholder rights. We find no evidence consistent with reputational
effects for non-internal fraud announcements made by firms with strong shareholder rights.
6 Conclusion
In the previous sections, we have seen that the market reaction to operational loss announce-
ments is significantly worse if the loss is due to internal fraud rather than other loss types.
We have interpreted this finding as evidence of a reputational effect. This result has a very
practical implication. Assume a bank is unaware of which types of losses impose the greatest
reputational risk, and also that the bank is spending a certain fraction of its budget on im-
plementing controls for internal fraud. If a bank were told that internal fraud events trigger
30
much larger reputational losses relative to other loss events, it may wish to devote a larger
share of its risk management budget to controlling internal fraud.
We also found that the market reaction to internal fraud losses is most severe when the
losses occur at firms with strong shareholder rights. This may be evidence that investors
expect these losses to occur less frequently or less severely at firms with strong shareholder
rights, and so these loss announcements could have a greater negative impact given that they
are less anticipated at these firms. This result does not suggest that firms are better off if
they reduce certain shareholder rights because Gompers et al. (2003) find that the market
already penalizes firms with weak shareholder rights via reduced equity returns and lower
value as measured by Tobin’s Q.
Although the main findings of the paper contribute to a better understanding of reputa-
tional risk, it still remains unclear by what mechanism reputational risk is adversely affecting
stock prices. Perhaps the finding can be interpreted as a “smoking gun” effect. That is,
investors may view externally-caused losses as one-off occurrences, but view losses caused by
internal fraud as indicators that further losses are more likely to occur in the future. Al-
ternatively, investors may fear more direct future losses due to losses in customers, business
partners, etc.
One could potentially examine this issue in future research by analyzing the cross-bank
impact of operational loss announcements. (If one bank announces a loss due to internal
fraud, how do its competitors’ stock prices react?) Under the reputational hypothesis, the
cross-bank reaction should be positive because the bank’s loss of clients should directly benefit
its main competitors. Under the smoking gun hypothesis, the cross-bank reaction should be
zero, as the quality of internal controls at one bank should not alter the perceived probability
31

of future losses at other banks.
Finally, we should note that a cross-bank analysis of operational loss announcements
should also contribute to ongoing research on contagion and systemic risk. As discussed in
Gropp and Moerman (2003), much of this literature suffers from an identification problem:
a purported contagion effect is identified, but the hypothesis of a common risk factor cannot
be completely ruled out. Operational loss announcements are a perfect solution to this iden-
tification problem because the causal events are unarguably idiosyncratic to the institutions
at which they occur. Thus, any finding that the announcement of a loss at one bank has
an adverse impact on other banks’ stock prices would be direct evidence of financial market
contagion.
32
References
Basel Committee, “Sound Practices for the Management and Supervision of OperationalRisk,” 2003. Bank for International Settlements.
Board of Governors of the Federal Reserve System, “Commercial Bank ExaminationManual,” November 2004. Division of Banking Supervision and Regulation.
Cummins, J. David, Christopher M. Lewis, and Ran Wei, “The Market Value Impactof Operational Losses For U.S. Banks and Insurers,” 2004. Unpublished Working Paper.
de Fontnouvelle, Patrick, Virginia DeJesus-Rueff, John Jordan, and Eric Rosen-gren, “Using Loss Data to Quantify Operational Risk,” 2004. Unpublished Working Paper,Federal Reserve Bank of Boston.
Gompers, Paul A., Joy L. Ishii, and Andrew Metrick, “Corporate Governance andEquity Prices,” The Quarterly Journal of Economics, 2003, 118 (1), 107–155.
Gropp, Reint and Gerard Moerman, “Measurement of Contagion in Bank EquityPrices,” 2003. Unpublished Working Paper.
Karpoff, Jonathan and John R. Lott, “The Reputational Penalty Firms Bear for Com-mitting Criminal Fraud,” Journal of Law and Economics, 1993, 36, 757–802.
MacKinlay, A. Craig, “Event Studies in Economics and Finance,” Journal of EconomicLiterature, 1997, 35, 13–39.
Murphy, Deborah L., Ronald E. Shrieves, and Samuel L. Tibbs, “Determinates ofthe Stock Price Reaction to Allegations of Corporate Misconduct: Earnings, Risk, andFirm Size Effects,” 2004. Unpublished Working Paper.
Palmrose, Zoe-Vonna, Vernon J. Richardson, and Susan Scholz, “Determinants ofMarket Reactions to Restatement Announcements,” Journal of Accounting and Economics,2004, 37, 59–89.
Roll, Richard, “R2,” The Journal of Finance, 1988, 43, 541–566.
33


![How is Reaction Rate Measured? Is Reaction Rate Constant?€¦ · 2] 0.085 0.017 0.051 6 Measuring Reaction Rates Can define an average rate of reaction: A measurement of the rate](https://static.fdocuments.in/doc/165x107/5f070a717e708231d41b00e2/how-is-reaction-rate-measured-is-reaction-rate-constant-2-0085-0017-0051-6.jpg)