Measuring Productivity in Accounting and Finance Offices · hl Accounting And Finance Offices ......
58
Measuring Productivity hl Accounting And Finance Offices Joint Financial Management Improvement Program
Transcript of Measuring Productivity in Accounting and Finance Offices · hl Accounting And Finance Offices ......

Measuring Productivityhl Accounting And
Finance Offices
Joint Financial Management Improvement Program

WHAT IS JFMIP ?
The Joint Financial Management Improvement Program(JFMIP) is a joint and cooperative undertaking of theOffice of Management and Budget, the General AccountingOffice, the Department of the Treasury, and the Officeof Personnel Management, working in cooperation witheach other and with operating agencies to improve finan-cial management practices. The Program was initiated in1948 by the Secretary of the Treasury, the Director ofthe Bureau of the Budget, and the Comptroller General,and was given statutory authorization -in the Budget andAccounting Procedures Act of 1950.
The overall objective of JFMIP is to improve andcoordinate financial management policies and practicesthroughout the Government so that they will contributesignificantly to the effective and efficient planningand operation of governmental programs. Activitiesaimed at achieving this objective include;
—Reviewing and coordinating central agencies'
activities and policy promulgations to avoidpossible conflict, inconsistency, duplicationand confusion.
—Acting as a clearinghouse for sharing anddisseminating financial management informationabout good financial management techniques andtechnologies.
—Reviewing the financial management efforts ofthe operating agencies and serving as a cata-
lyst for further improvements.
--Undertaking special projects of a Government-
wide nature to resolve specific problems.
—Providing advisory services in dealing withspecific financial management problems.
The JFMIP plays a key role in mobilizing resourcesand coordinating cooperative efforts in the improvementof financial management practices, and relies on theactive participation of Federal agencies to be success-ful.

MEASURING PRODUCTIVITY IN
ACCOUNTING AND FINANCE OFFICES
September 1981
The Joint Financial Management Improvement Program
FOREWORD
As part of a continuing effort to improve financialmanagement in the Federal Government^ the Joint FinancialManagement Improvement Program has actively participatedin promoting productivity improvements and the use ofproductivity measurement systems in finance and accountingoperations for some time. We have conducted workshops and
issued publications on these subjects. We also haveparticipated in the design and implementation of aproductivity measurement system at the Department ofCommerce.
The Federal financial management community should berightfully proud that its productivity increased at anaverage rate of 2.5 percent per year between fiscal years1966 and 1979, while.the rest of the Government wasstruggling at an annual rate of 1.4 percent. However,
Federal financial managers should not be complacent aboutthis past achievement. They should continue to emphasizethe importance of productivity and strive for greaterachievements.
Productivity improvement will continue to command ourinterest and attention as Federal agencies operate withaustere budgets. Agencies will be asked to do more withless resources. To do this, agencies need good productivitymeasurement systems. Yet productivity improvement is notjust productivity measurement. Productivity improvementrequires measurement, but more importantly, it must usemeasurement data to evaluate and improve operations soagencies can operate more efficiently and effectively.
This booklet describes four productivity systems—theirdesign, implementation and use. Although these productivitymeasurement systems apply primarily to finance and accountingoperations, the principles apply to any operations. We hopethat this booklet.will sufficiently stimulate financial man-agers to design, develop and implement productivity systemsnot only in finance and accounting operations but also inoperating and mission activities.
In publishing this booklet, we pay tribute to the manywho have pioneered and enhanced productivity improvementprograms in the Government. We also acknowledge and thankthe many officials in the agencies who assisted us in thepreparation of the booklet. Readers of this publication areinvited to comment or provide suggestions on its usefulness.
1

In addition, those who are aware of other meaningful anduseful productivity measurement systems that could bebeneficial to financial managers are encouraged to contactus. Comments and requests for copies of this publicationshould be sent to the Joint Financial Management ImprovementProgram.
Susumu UyedaExecutive Director
September 1981
11 -
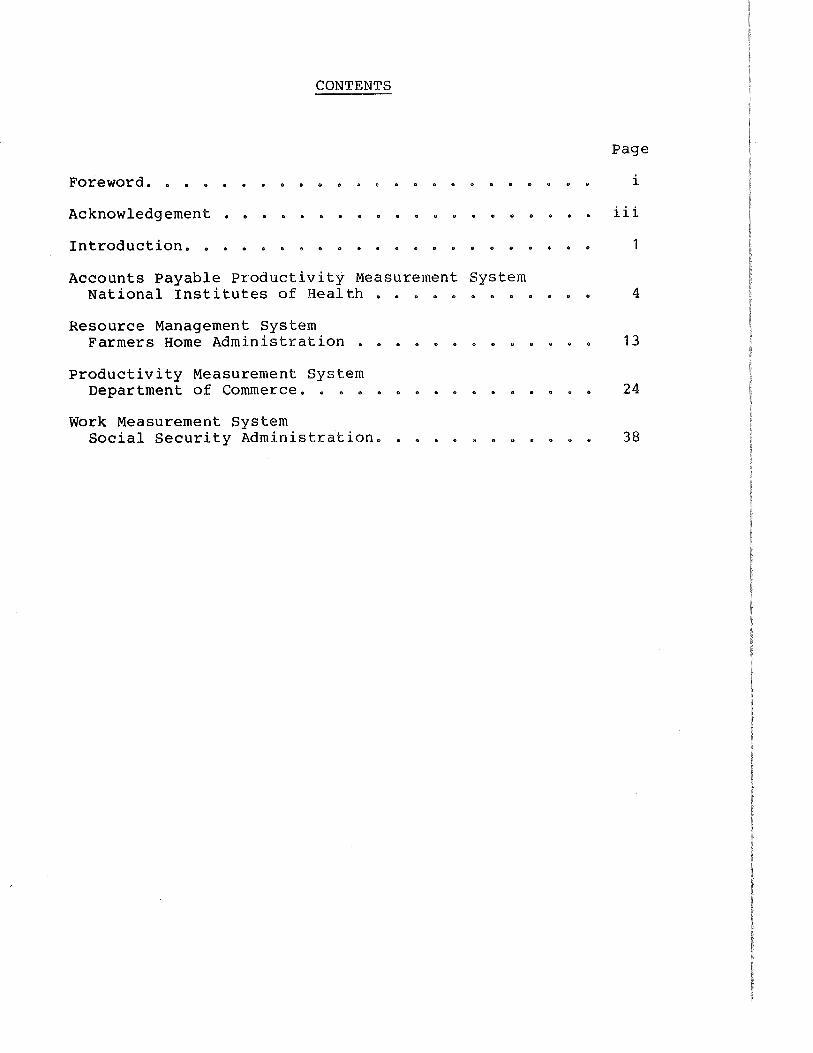
CONTENTS
Page
Foreword. .......... ........o »... i
Acknowledgement .................... iii
Introduction. ..................... 1
Accounts Payable Productivity Measurement SystemNational Institutes of Health ............ 4
Resource Management SystemFarmers Home Administration ...... o. ..... 13
Productivity Measurement SystemDepartment of Commerce. . ....... ....... 24
Work Measurement SystemSocial Security Administration. ........... 38


ACKNOWLEDGEMENT
We gratefully express our appreciation to the followingindividuals for their contributions in making this publica-tion possible.
Sam GeorgeNational Institutes of Health
Virgle CunninghamFarmers Home Administration
Joseph FreburgerFarmers Home Administration
Clyde AhrnsbrakDepartment of Commerce
Earl LoeMaritime Administration
Dennis PolivkaEconomic Development Administration
Matthew SchwienteckSocial Security Administration
Ill -

INTRODUCTION
The declining rate of productivity growth—both in thepublic and the private sectors—has been blamed for manynational problems such as inflation and unemployment. More-over, in today's environment of tighter budgets. Federalmanagers are faced with the difficult challenge of gettingthe job done with less resources. To help improve produc-tivity, managers must know how efficient and effective theirorganizations are performing. With good productivitymeasurement systems, managers can assess and improve theperformance of their organizations and justify budget andresource allocations.
The Bureau of Labor Statistics annually collectsproductivity data for the Federal agencies through itsFederal Productivity Measurement System. Organizationaland agency indices are developed by the system and reportedto each organization submitting the data. The Bureau, inconjunction with the Office of Personnel Management, pub-lishes the overall measures for the Federal Government.
In fiscal year 1979, the Bureau reported that theproductivity of the Federal civilian workforce increasedonly .5 percent. In fact, Government's productivity hasonly increased an average of 1.4 percent annually over thepast thirteen years. This information is based on input from50 Federal agencies representing two-thirds of the Federalcivilian workforce.
Under the Bureau of Labor Statistics' system productiv-ity and related measures are also reported for 28 functionalcategories which are comprised of organizations performingsimilar activities. One functional category is the financeand accounting area, in which the Bureau stated that produc-tivity increased 2»6 percent in fiscal year 1979 with anaverage annual increase of 2.5 percent over the past 13years. This information is based on input from 14 Federalagencies covering 20,000 employees in finance and accountingoperations. This in itself is a good record, but thefinancial management community can do better. Also, thefinancial management community needs to design and applyproductivity measurement systems to cover a larger portionof its workforce.
While the Bureau of Labor Statistics provides compositeor aggregate productivity indices on an annual basis,managers in the agencies need a more detailed productivitymeasurement system to manage their day-to-day operations.
Accordingly, a number of agencies have developed and
1 -

implemented productivity measurement systems. While thesystems vary in approaches and techniques, managers arefinding them to be indispensable tools. Some common lessonslearned from the successful implementation of the productiv-ity measurement systems include;
--Obtain top level management support and commitmentbefore the development of the system.
—Keep employees informed about what the system will doand how they will become involved.
--Obtain participation of all involved. Participationof employees and unions will greatly aid in gainingacceptance of the system.
—Explain how the system will be used. An explanationof the purpose of the system and how management willuse the data should be given to employees duringsystem development.
—Use a top down approach. It is easier to begin withgross measures at the aggregate level and then refinefhese measures to yield more accurate data and to gaingreater management visibility.
--Tailor the productivity measures to the system, notthe system to fche measures.
—Use existing systems as much as possible rather thantrying to create an entirely new system. When defin-ing measures, use data presently available in themanagement information system or data which can begenerated easily.
--Be cost effective. "In defcermining the magnitude of
the measurement system^ consider the costs involved indata collection and system development work, and weighthe costs and benefits of a sophisticated measurementsystem versus those for a simple measurement system.
—Keep the system as simple as possible. Use a systemthat is practical and easy to use. Causes for changesin productivity should be identified through the useof the measurement system.
--Design a flexible system that will enable futureexpansion or refinement.
2

--Be realistic about the system capabilities. Identifythe system's shortcomings and be prepared to deal withcriticism.
To share some of the success stories with you, wesummarized several systems for measuring productivity inaccounting and finance operations in this booklet. TheNational Institutes of Health's Accounts Payable ProductivityMeasurement provides productivity data at organizational andindividual levels. Standards are set by assigning different"equivalent units" to each type of work in accordance withthe difficulty in performing them« Managers use the reportsgenerated in conjunction with employee performance evalua-tions.
The Resource Management System at Farmers Home Adminis-tration measures the productivity of an organizational levelrather than individual productivity. Its standards aredeveloped through direct observation of program activitiesin field offices. The system uses standardSy workload counts,productivity computations and computer-generated reports toinform managers on the productivity of their organizationalunits.
The system at the Department of Commerce also measuresthe productivity at the organizational unit. The majorfunctional areas identified and measured are (1) payrollprocessing, (2) operational accounting, (3) controlaccounting, and (4) general administration. This systemutilizes a work sampling technique to collect labor inputdata.
The Social Security Administration uses a Goal andPerformance Measurement System to monitor the productivity,quality and effectiveness of its operations at the organi-zational level. It also uses a work sampling technique tocollect labor input measure data and collects output measuredata through other systems.
Managers can use these systems for making key decisionsto reallocate staff resources, to analyze operations anddetermine corrective actions and to formulate and justifyexecutive budgets. The major emphasis in using these systemsis to improve the productivity of the organization. Althoughthese systems were developed for finance and accountingoperations, the same principles can be applied to otheroperational areas.
ACCOUNTS PAYABLE PRODUCTIVITY MEASUREMENT SYSTEMNATIONAL INSTITUTES OF HEALTH
BACKGROUND
The National Institutes of Health (NIH) conducts andsupports biomedical research into the causes, preventionand cure of diseases? supports research training and thedevelopment of research resources; and makes use of modernmethods to communicate biomedical information. The NIH isa component of the Public Health Service of the Departmentof Health and Human Services and has 10 Institutes (e.g.,National Cancer Institute, National Heart, Lung and BloodInstitute and National Institute of Aging), 2 Centers and aNational Library of Medicine.
The finance and accounting services are centralizedat NIH in the Division of Financial Management and organizedas shown in Illustration No. 1 (page 9). The NIH's produc-tivity measurement system is used in the Accounts PayableSection. The Accounts Payable Section is organized as aunit of the Operations Accounting Branch of NIHy reportingto the Assistant Director for Finance under the Director ofFinancial Management. There are 4 subsections within theAccounfcs Payable Section with about 10 persons in eachsubsection. The section examines approximately 30,000payment vouchers monthly handling a variety of transactions(e.g., transportation requests, Government bills of ladingand contracts) and a variety of documents for paymentpurposes {e.q., purchase orders^ receiving reports, invoices,
etc.).
ACCOUNTS PAYABLE PRODUCTIVITY MEASUREMENT SYSTEM
The voucher examiners of NIH process different types ofvouchers in varying proportions. The types of vouchersprocessed vary in complexityy knowledge required, extent ofexamination, and consequently the time required to completethe voucher examination. Therefore/ the comparison of thetotal numbers of vouchers processed among employees, teams,
or subsections is meaningless. A more meaningful method isneeded to measure and compare the work of the voucherexaminers»
To do this, NIH employs the concept of measurement by"equivalent units»" In order to establish "equivalentunits," standard processing time for each type of voucher wasfirst established based on engineering or time-and-motion
4 -
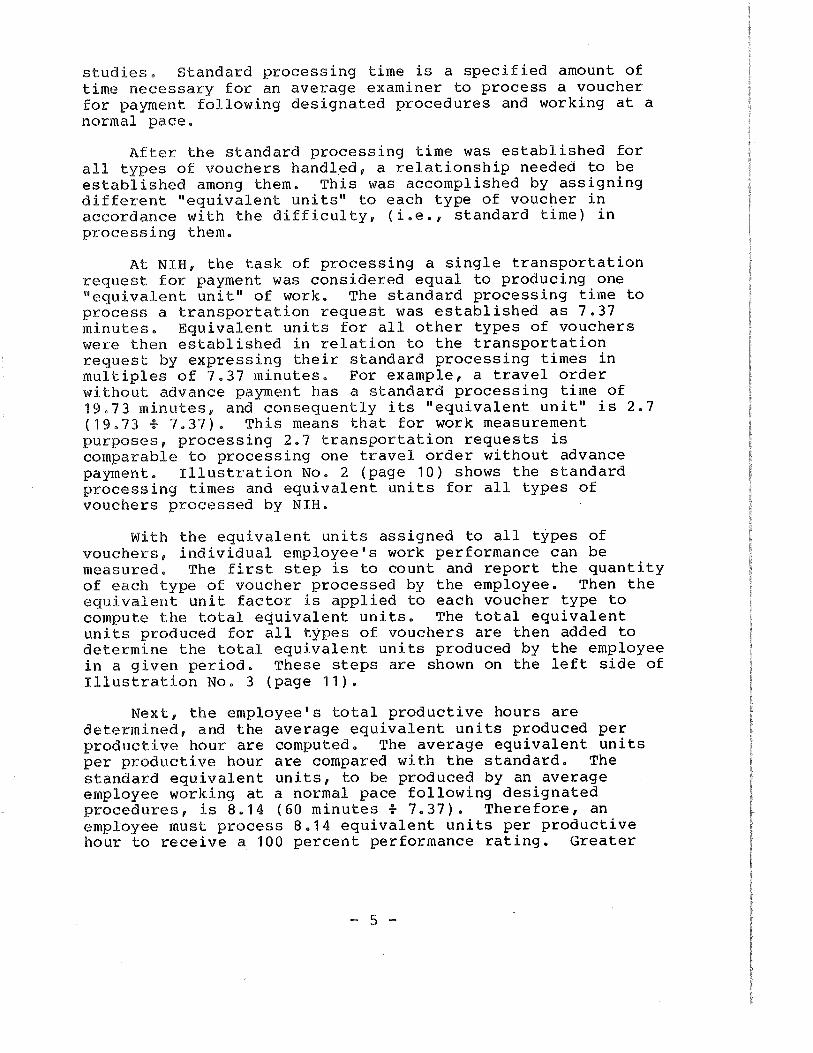
studies. Standard processing time is a specified amount oftime necessary for an average examiner to process a voucherfor payment following designated procedures and working at anormal pace.
After the standard processing time was established forall types of vouchers handled, a relationship needed to beestablished among them. This was accomplished by assigningdifferent "equivalent units" to each type of voucher inaccordance with the difficulty, (i.e.y standard time) inprocessing them.
At NIH, the task of processing a single transportationrequest for payment was considered equal to producing one"equivalent unit" of work. The standard processing time toprocess a transportation request was established as 7.37minutes. Equivalent units for all other types of voucherswere then established in relation to the transportationrequest by expressing their standard processing times inmultiples of 7.37 minutes. For example, a travel orderwithout advance payment has a standard processing time of19.73 minutes, and consequently its "equivalent unit" is 2.7(19.73 T 7.37). This means that for work measurementpurposes, processing 2.7 transportation requests iscomparable to processing one travel order without advancepayment. Illustration No. 2 (page 10) shows the standardprocessing times and equivalent units for all types ofvouchers processed by NIHo
With the equivalent units assigned to all types ofvouchers, individual employee's work performance can bemeasured. The first step is to count and report the quantityof each type of voucher processed by the employee. Then theequivalent unit factor is applied to each voucher type tocompute the total equivalent units. The total equivalentunits produced for all types of vouchers are then added todetermine the total equivalent units produced by the employeein a given period. These steps are shown on the left side ofIllustration No. 3 (page 11).
Nexty the employee's total productive hours aredetermined^ and the average equivalent units produced perproductive hour are computedo The average equivalent unitsper productive hour are compared with the standard. Thestandard equivalent units, to be produced by an averageemployee working at a normal pace following designatedprocedures, is 8014 (60 minutes r 7.37). Therefore, anemployee must process 8.14 equivalent units per productivehour to receive a 100 percent performance rating. Greater
5 -

production, of course, would receive a commensurately higher
rating and vice versa. These steps are depicted on the rightside of Illustration No. 3 (page 11). Note also that thenumber of errors chargeable to the individual is also shown.
Once the above information is available for all voucherexaminers, comparisons among individuals, teams and units are
made. Illustration No. 4 (page 12) is an example report thatcompares individual team performance of a unit containingthree teams and 19 voucher examiners. By using this report,one can readily spot individuals and teams that areperforming above or below the standard level of performance.In the Illustration, only the current month's performance isshown. Actually, NIH produces this report with performancedata for "first prior month," "second prior'month," and
"three month average." With these additional data^ managerscan detect favorable and unfavorable trends and takenecessary action as appropriate.
NIH also uses the performance measurement system in
conjunction with employee performance evaluations. Forexample^ for quantitative performancey the following criteriaare applied to employee ratings;
Length ofService
Relation toStandard
PerformanceApplicable
Time Period Rating
Over 1 year over 100% Six Successive
MonthsOutstanding
Over 1 year 93% - 100% Six Successive Above AverageMonths
Over 1 year over 92% Consistently Satisfactory
6 months to1 year 75% - 90% Consistently Satisfactory
Less than6 months 50% - 75% Consistently Satisfactory
6 -

Also, qualitative performance requirements are estab-lished and used in employee ratings as follow;
Length ofService
Percent ofErrors
ApplicableTime Period Rating
Over 1 year Less than 1.0% Six SuccessiveMonths
Outstanding
Over 1 year 1.0% - 2.9% Six Successive
MonthsAbove Average
Over 1 year Less than 3% Consistently Satisfactory
6 months to1 year Less than 5% Consistently Satisfactory
Less than6 months Less than 10% Consistently Satisfactory
NIH procedures further provide that all files which aremaintained by an examiner must be neat, and documents are tobe properly filed according to current procedures with littleor no misfiling. Each examiner must use the "first-in/first-out" basis for processing voucher invoices. Problem
invoices are to be brought to the attention of the examiner'ssupervisor. No invoice should be in the files for more than30 days without the employee taking action according toestablished procedures. The voucher examiner must maintainthe invoices so that 90 percent or more of all invoices areprocessed within 30 days. If an examiner exceeds the 90percent standard by more than 5 percent, performance isconsidered above average. If the standard is exceeded by 7percent, performance is considered outstanding.
If an employee has achieved an outstanding category,consideration must be given to rewards such as cash awards,quality step increases, and commendation. NIH categorizessubstandard performance into "below average, but not to agreat degree" and "below average to a great degree."
7 -

When an employee is rated "below average, but not to agreat degree," the individual is counseled by his immediatesupervisor and specific action is recommended to a higherauthority. When an employee is rated "below average to agreat degree," the individual is counseled by his immediatesupervisor and provided with a written summary of thecounseling interview. If the individual does not improve,specific recommendations are made, in writing, to a higherauthority, which could include dismissal.
NIH's productivity measurement system has not onlyhelped increase the productivity of the accounts payablesection, but also pinpointed areas in which improvements canbe made. The NIH is currently automating its paymentprocess, and will revise its productivity measurement systemaccordingly. The changes will include using the latesttechnological advances to increase the productivity of thesection even further. The changes will be implemented duringthe summer of 1981.
8 -

ILLUSTRATION N0.1 ILLUSTRATION N0.1
NATIONAL INSTITUTES OF HEALTHORGANIZATION CHART
DIVISION OF FINANCIAL MANAGEMENT
Directorof
FinancialManagement
AssistantDirector
forFinance
AssistantDirector
forBudget
FederalAssistanceAccounting
Branch
Reports andAccountsControl
Branch
OperationsAccounting
Branch
AccountingSection
Accounts
PayableSection
Subsection# ,1
Teams]
FinanceAdministrative
ServicesBranch
DisbursingServicesSection
FundManagement
and CostAnalysis
Subsection# ,2
Teams
Subsection# ,3
Teams!
Subsectionl# ,4
Teamsl
9 -

ILLUSTRATION NO. 2 ILLUSTRATION NO. 2
TYPE OF VOUCHER
Transportation Request
Cashier
Telephone Charge Order
Government Bill of Lading (Freight)
Cashier (With NO Advance Payment)
Travel Advance
Contract (With Social Security Number) 10.66
Cashier (With Advance Payment)
Book Order
Purchase Order (No Record of Call)
Contract (With ESnployee ID Number)
Purchase Order (With Record of Call)
Travel Wucher. (No Advance Payment)
Travel Voucher (Advance Payment)
Government Bill of Lading(With Household Goods) 59»00 8.0
STANDARDPKOCESSnC TIME
(IN MINUTES)
7.37
8.11
8.91
9.36
9.74
10.66
er) 10.66
12.96
14.59
15.65
16.36
) 16.68
19.73
20.98
EQUIVALENT UNIT
1.0
1.1
1.2
1.3
1.3
1.4
1.4
1.8
2.0
2.1
2.2
2.3
2.7
2.8
10 -

STA
TIST
ICA
L A
NA
LYSI
S B
Y IN
DIV
IDU
AL
NA
ME
Tea
m 0
2 E
MP
LO
YE
E F
WR
KST
ATI
ON
15
PE
RIO
D R
EP
OR
TE
D J
UN
E 2
TO
JU
NE
28,
198
0
EQU
IVT
XP
E O
F V
OU
CH
ER
S P
KD
CE
SSE
D U
NIT
S
TELE
PHO
NE
CH
AH
Z O
RD
ER
HJK
CH
ASE
OR
DE
R -
N3
IOC
PU
RC
HA
SE
OR
DE
R -
RX
RESE
ARCH
OM
CRAC
T
CO
NT
RA
CT
- H
X
CO
NT
RA
CT
- N
O H
X
LIB
RA
RY
MO
D
TO
TA
L I
NV
OIC
ES
PK
3CE
SSE
D
INV
OIC
ES
PR
OC
ES
SE
DQ
UA
NT
ITY
BQ
UIV
. UN
ITS
1.2
0
2.1
0
2.3
0
2.8
0
2.3
0
2.2
0
2.1
0
170
197
237 2
341 51 47
1,0
45
204.0
0
41
3.7
0
54
5.1
0
5.6
0
784.3
0
112.2
0
98
.70
2,1
63
.60
*T
his
is a
sen
ior l
evel
em
plo
yee w
ho
sp
en
ds q
uit
e a
bit
of
tim
e t
rain
ing
oth
ers w
hic
h i
s r
ep
orte
d a
s n
on
-p
rod
ucti
ve h
ou
rs.
TO
TA
L A
VA
IIA
BIE
BO
OK
S
I£SS
AN
NU
AL
IE
AV
E
LE
SS S
ICK
LE
AV
E
LESS
OTH
ERS
TO
Tft
L R
H3J
IAR
KX
JES
PLU
S O
VE
RTI
ME
HO
UR
S
TOTA
L fS
XB
S W
OR
KE
D
LESS
NO
NPB
DD
UC
TIV
E B
OO
KS
TOTA
L PR
3DU
CTI
VE
HO
UR
S
EQ
UIV
ALE
NT
UN
ITS
PKO
DU
CE
DPE
R P
RO
DU
CTI
VE
HO
UR
PE
RF
OR
MA
NC
E B
AT
ING
(17
.31
7 8.
14)
TCV
mL
TRE
ASU
RY
RE
JEC
TIO
NS
CH
AR
GE
D T
O T
HE
IN
DIV
IDU
AL
r t I i § § u
152 40 192 67 *
125
17.3
1
213%
2
M t- r1 a M i-3 I M Q z § w

ILLUSTRATION NO. 4 ILLUSTRATION NO. 4
NAME
ABcDE
Team 01 TOTALS
FGHIJ
Team 02 TOTALS
STATISTICAL ANALYSIS BY UNIT
UNIT 01
PERIOD REPORTED JUNE 1980
QUANTITY
638227585940424
2,814
1 ,045561756564652
3,578
EQUIVALENTUNITS
1,294.30435.80
1,125.801,727.20
784.60
5,367.70
2,163.601 ,050.201,559.901,162.001,358.50
7,294.20
EQUIVALENT UNITSPRODUCED PER
PRODUCTIVE HOUR
9.753.69
10.148.934.90
7.52
17.316.357.886.058.25
8.63
KLMN0pQRs
Team 03 TOTALS
UNIT 01 TOTALS
564
12485
773
7,165
1
1
14
,085.50
245.10200.20
,530.80
,192.70
7.15
8.53
4.74
7.54
12 -

RESOURCE MANAGEMENT SYSTEMFARMERS HOME ADMINISTRATION
BACKGROUND
The Farmers Home Administration (FmHA) was establishedin 1946 as the successor to agencies set up during the 1930's—the Resettlement Administration and the Farm Security
Administration—to make loans to depression-stricken farmfamilies. For a number of years, FmHA was concerned prima-
rily with its original mission as a supervised credit agencyfor low-income farmers, with loan volumes of about $300million per year. During the 1960's and 1970's, however,many new programs were added, and FmHA became a diversifiedcredit institution for rural development. The growth hasbeen particularly rapid during the last 10 years. The cur-rent annual loan volume is about $13 billion, but reductionshave been proposed for Fiscal Year 1982.
FmHA manages more than 30 loan programs grouped in thefollowing major types: Farmer Loans, Rural Housing Loans,Community Loans, and Business and Industrial Loans. Most ofthe loans are insured loans that are originated, made, andserviced by FmHA personnel. Notes are sold to investors,backed by the full faith and credit of the Federal Govern-ment, and the investors' money replenishes a revolving loanfund. Interest rates to borrowers for most programs aredetermined by the current cost of Federal borrowing, but somerates are established by statute.
There also are several guaranteed loan programs in whichloans are made and serviced by private lenders. On suchloans FmHA guarantees to limit any loss to a specified per-centage. Interest rates are established between borrower andlender unless the rate is established by law. FmHA loans areintended to be a supplemental source of credit to augment theefforts of private lenders rather than compete with them.Most FmHA programs require that a borrower "graduate" tocommercial credit when able to do so.
FmHA is headed by an Administrator, who reports to theAssistant Secretary for Rural Development, U.S. Department ofAgriculture. In addition to the National Office in Wash-ingfcon, D.C., there are 46 State Offices covering all buttwo of the 50 States, 300 District Offices^ and about 2,000County Offices in all 50 States. FmHA also has a FinanceOffice in St. Louis, Missouri, and maintains close workingrelationships with the USDA National Finance Center inNew Orleans, Louisiana. FmHA has about 8,500 permanentemployees, of whom about 6,000 are at the District and County
13 -

Office levels. There also are about 3,000 temporary orpart-time employees, mostly in clerical positions in theCounty Offices.
Most loans are made and serviced in District and CountyOffices. Generally County Offices are responsible foradministering loan programs aimed at individual borrowers;whereas. District Offices are responsible for administeringloan programs to associations, corporations and localcommunities.
THE RESOURCE MANAGEMENT SYSTEM
The Resource Management System was developed under acontract to replace the Work Measurement System used by theFarmers Home Administration during fiscal years 1976, 1977,and 1978. Operation of the System was started for Countiesin October 1979, for Districts in April 1980, and for Statesin October 1980. A revised system which combines County andDistrict Office reporting was implemented in April 1981.
The Resource Management System provides useful manage-ment information, not only for the National Office, but alsofor S,tate, District and County Offices, to be used for:
—Budget formulation and fund allocation,
—Personnel projections and allocations,
—Decisions on opening, closing and staffing of fieldoffices,
—Identification of opportunities for operationalimprovements, and
—Measurement of performance against objectives andstandards.
The Resource Management System uses work measurement
standards, workload counts^ productivity computations andcomputer-generated reports to serve these management
purposes. Major components of the System are:
—Work measurement standards developed through directobservation of program activities in District andCounty Offices,
—Monthly operating reports on workload counts orprogram output from all District and County Offices,
14 -

—Computer-generated monthly reports on program
accomplishmejits and productivity of the District orCounty Offices, and
--Summary reports and special management analyses.
Work Measurement Standards. Standards have been developedfor the major functions within each of the major programscarried on in District and County Offices. Each standardreflects the time required for an average experiencedemployee, working with reasonable skill and effort undernormal conditions, to perform one unit or cycle at anacceptable quality level following prescribed procedures.The normal working conditions found in FmHA offices includeminor interruptions such as telephone calls and inquiries.The time values do not represent optimum working conditionsor abnormal working speeds. The standards are agency-wideand represent the time spent performing the work; they do notinclude travel time and are used for all locations.
The process of developing standards started with thereview of available data from prior systems, analyses of thework flow using flow charts developed previously, and thedefinition and analysis of the work steps or elements of themajor functions for each program. Trained analysts thenvisited a number of field offices for direct observation ofthe work performed. Results were reviewed with employees andsupervisors. Key indicators were identified and compositestandards were developed. The direct observations at variouslocations and the judgement of knowledgeable National Officeand field personnel were used in establishing and revisingthe representative times or standards. There will becontinuing monitoring of work processes to ensure thatstandards are representative of the work being performed.
The standard for a function is a composite of the timerequired for several activities. For example, a "loanmaking" function consists of the following activities:"preapplications received," "applications received,""eligibility determinations," "loans processed", "loansclosed," and "construction inspection." Each of theseactivities require several steps. For example "applicationsreceived" activity requires the following steps: "applicantpicks up application," "explanation of program," "assistapplicant with application" and "initial interview." Timevalues and frequencies are determined for each step, andstandards are established for each step and activity. Thisprocess is illustrated below by using the steps involved inthe "application received" activity:
15 ~

TIME INMINUTES
ACTIVITY—APPLICATIONS RECEIVED
Steps in the Activity;
1. Applicant Picks Up Application
2. Explanation of Program
3. Assist AppUcant with Application
4. Initial Interview
STANDARD TIME TOR ACTBTITY
AVERAGE*FREQUENCY
FOR EACHAPPLICATION
ADJUSTEDTIME INMINUTES
5
30
20
30
1.00
4.75
0.75
1.00
5
143
15
30
193
*This factor is used to adjust for the average frequency ofeach step to process one work unit; i.e.y an application inthis example. In another words, "1.00" means the step istaken only once for each application, "4.75" means that thestep is taken on an average of 4.75 times for eachapplication, etc.
Ogerating Reports. Each County or District Office isrequired to submit a one-page Operating Report on the lastworking day of each month, (Illustration No. 1, page 20).This is used to report work performed by function and activ-ity during the month for each major FmHA program. The reportalso includes the status of unprocessed items on hand as ofthe end of the month, e.g., loans and grants outstanding.
With respect to the employee working hours, theOperating Report does not require reporting the time spenton each program, function or activity., Rather^ the reportshows the grand total hours worked (productive hours) in eachCounty or District Office, hours spent in formal training andhours spent on travel. The entry for total hours workedrelates to the entire staff. It includes regular timey paidovertime, uncompensated voluntary time by exempt employees,and time worked by employees detailed from other FmHAoffices. It excludes all annual, sick and other leave.
The Operating Reports are submitted by the County andDistrict Offices to the Management Systems and OrganizationPlanning Division in the National Office for review andcomputer processing.
16 -

Reports on Accomplishments and Productivity. Two basicoutput reports are generated by computer in the NationalOffice on a time schedule geared to distributing reports backto each County or District Office before the next monthlyOperating Reports are submitted.
The County/District Office Accomplishment Report (Illus-tration No. 2, page 21) recapitulates, for each program,function and activity, the information on quantity of workaccomplished during the month and month-end status of work tobe accomplished. Information is shown for the current monthand the fiscal year-to-date. This report is prepared for theCounty and District Offices and submitted to the NationalOffice.
The County/District productivity Report (IllustrationNo. 3, page 22) provides the computation of earned time foreach County or District Office (page 1 of Illustration No. 3)and compares current performance against standards (page 2 ofIllustration No. 3). Earned time is defined as the timerequired for the work performed when employees work at thestandard rate. With the work performed data that werereported in the County/District Operating Report (Illustra-tion No. 1) the computer applies the standard time againstthe work performed data for each program, function or activ"ity and computes the earned time for each program, functionand activity for a County or District Office. The earnedtime for each program, function and activity is then printedwith the total earned time for the Office or District on page1 of the County/ District Productivity Report (IllustrationNo. 3). A percentage distribution of earned time againstmajor loan programs as well as functions is also provided.
On page 2 of the County/District Productivity Report(Illustration No. 3), computations of productivity andperformance factors are performed. Under the FmHA system,productivity is measured at a composite County or DistrictOffice level and not at the program, function or activitylevel. Computation of productivity for each County orDistrict Office starts with the total hours worked asreported by the County or District Office. The time spent intravel, the time in training and an allowance for time spenton administrative and general activities are then subtractedfrom the total hours worked to determine the net program(direct) fcime worked. The percent of program hours earned isthen calculated to see how, efficient each County or Districthad been by using the following formulas
Total Earned TimePercent of Program Hours Earned =
Net Program Hours
17 -

100 percent means that the County or District had performedat par with the standards? above 100 percent means betterthan standard performance and vice versa.
The resulting percentage numbers haye been grouped intosix performance categories as shown be lows
FACTORCATEGORIES
PF 1PF 2PF 3PF 4PF 5PF 6
PERCENT OF PROGRAMHOURS EARNED
above 110101-11091-10081-9071-80
70 or less
Each month, a County or District Office is rated by theperformance factor category^ and the monthly ratings areprinted on page 2 of Illustration No. 3.
Summary Reports and Special Analyses. The system generates aseries of summary reports on a monthly or quarterly basis.These reports compare summaries of accomplishments andproductivity at the District and State levels, accomplish-ments by program at the State and national levelSy accom-plishroents of all programs for each State Office and nationaltotals, and productivity for each State Office and nationaltotals.
The State Quarterly Analysis Report aids State andNational Office managers in reviewing the performance ofeach State and the offices within the State. This quarterlyreport uses a Composite Performance Factor which representsthe hours worked by all employees in a State (includingCounty, District and State Offices) per each hour of directearned time (the sum of earned time totals for County andDistrict Offices).
USE OF RMS FOR BUDGET AND PERSONNEL MANAGEMENT
Projections of personnel requirements by program can be madeby developing budget work factors based on the basic workstandards and applying these factors to caseload estimates.The results are useful for budget preparation, allocation ofstaff within approved budgets, and staffing analyses through-out the year.
18 -

The detailed work standards can be aggregated into twobroad budget work factors which can be used to project amajor portion of overall workload requirements. For example,loan making workload for the Multi-Family Housing Program canbe computed by multiplying the caseload by a budget workfactor consisting of the following activities;
—Preapplications Received,--Applications Received,—Eligibility Determination,--Loans Processed,
—Loans Closed,—Construction inspections, arid—Construction Related Activities
Computation of the budget work factor for loan making startswith the basic work standards for direct program effort foreach activity. A frequency factor is then applied to eachstep and the resulting products are added to obtain directprogram time for loan making. An appropriate overhead factorcan then be added.
Similarly, a single budget work factor can be used forthe loan servicing functions for all programs. The budgetwork factors are multiplied by caseload to obtain totalworkload in terms of hours. These numbers can then beconverted to staff years and to numbers of people atdifferent grade levels.
Also, this approach can be used to allocate staff tofield offices after the budget has been approved and fundsappropriated. In the allocation process, however, there maybe problems in applying standard budget work factors for allfield offices. It usually is necessary to take into accounta number of special factors. The budget work factors couldbe adjusted for some locations to take into account suchspecial factors as recent productivity experience, targetsfor productivity improvement, and unusual circumstances whichmay warrant deviation from a "normal" pattern.
19 -

10 0
Off
ice S
tate
Dis
tric
t C
ou
nty
Level N
o. N
6. N
o.
FAR
ME
RS
HO
ME
NSS
mLS
SSK
TIO
SRE
SOU
RCE
MftN
BGEM
ENT
SYST
EMC
OO
NTY
/bIS
TRIC
F O
FFIC
E O
PER
ftTI
NG
BE
SOR
FM
onth
Yea
r
AD
DR
ES
S :
TC
W? :
SE
fSE
& Z
IP:
WK
K P
ER
TO
RM
ED
IH
IS M
CM
HLO
AN
MA
KIN
G
co
co .
§co
si-
4&2
Iflf
iN S
ER
VIC
ING
12
coft
ST
A3U
S fS
EN
DO
F M
OU
TH
f t-> a 03 ^ I Q 3, §
co 0<|p
< j-j
|
1. H
OR
AL
HC
XJS
ING
- 50
22. H
OO
SM
G 8
EP
MR
- 5
04
3. F
RE
W. O
WN
ER
SH
IP4.
FA
RM
OP
ER
AT
ING
5. E
ME
K3E
NC
T &
BE
SO
IL &
WM
ER
CO
NSE
Kyf
tTIO
N7.
BIO
MA
SS
EN
ER
GY
8. M
DL
TI-
FA
MIL
Y B
OD
SIN
Gf 1-* a co i-a i Q z z 0
9. C
P -
WA
TE
R &
WA
ST
E10. C
P -
^C
O?m
NC
TY
-F
AC
ILIT
IES
11. H
JSIN
ES
S &
IN
DD
ST
BY
12. O
TH
ER
13. T
CX
EA
L
14. B
OO
KS
TR
AV
EL
LE
DT
RM
NIN
G B
OO
KS
VJS
SL B
JJB
S W
OR
KE
D

FAR
ME
RS
HO
ME
AD
MIN
ISTR
ATI
ON
RE
SOU
RC
E M
AN
AG
EM
EN
T SY
STE
M
10
ST
AT
E:
X D
IST
RIC
T:
07 O
FF
ICE
WO
RK
PE
RFO
RM
ED
DU
RIN
3 M
ON
TH
LOA
N M
AK
ING
Preap
pli
cati
on
s r
eceiv
ed
Ap
pli
cati
on
s r
eceiv
ed
Eli
gib
ilit
y D
ete
rmin
ati
on
sL
oan
s P
rocessed
Loa
ns
Clo
sed
Con
str
ucti
on
In
sp
ecti
on
sL
OA
N S
ER
VIC
ING
Secu
rit
y S
ervic
es
Su
pervis
ory C
on
feren
ces
Ba
nk
ing S
erv
ices
Deli
nq
uen
t A
ccou
nts
Serv
ed
Paym
ent
Agre
emen
tsR
ep
ort
s E
va
lua
tion
Loa
ns S
ett
led
OTH
ER P
rop
erti
es A
cq
uir
ed
Prop
erti
es D
isp
osed
Of
Ap
pea
ls C
ase
sR
ura
l D
evel.
Mfc
gs.
STA
TU
S A
T E
ND
OF
MO
NT
H:
Loa
ns
an
d G
ran
ts O
uts
tan
din
gD
eli
nq
uen
t L
oa
ns
Ou
tsta
nd
ing
Deli
nq
uen
cy R
ate
Pre
ap
pli
cati
on
s o
n H
an
dA
pp
lica
tion
s e
n H
an
dP
rop
erti
es i
n I
nven
tory
: A H
OU
SIN
G50
2C
UR
* 0 10 14 11 3 8 3 14 42 54 4 0 3 0 0 0 0
575
112 19 0 26 12
OFF
ICE
ACQ
OM
PLIS
HM
EWT
REPO
RT
HO
USI
NG
RE
PA
IRC
UM
** C
UR
CU
M
0 10 14 11 3 8 3 14 42 54 4 0 3 0 0 0 0
575
112 19 0 26
0 2 1 3 0 1 0 1 0 1 0 0 2 0 0 0 0/
32,
/
0 2 1 3 0 1 0 1 0 1 0 0 2 o/
o/ / .
/ / / / ,7
/ ,2
6/
// /
12
, ,0
0 4 0
PRO
GRM
yBFA
RMO
WN
ER
.CU
R 0 2 2 0 0 0 1 1 13
CUM 0 0 2 0 0 o/ / / / /
/ /
o/
// /
,0 ,0/ / 2
/ / ,0 ,0 / 0 0 29 20 69 0 5 0
0 0 0 0 29 20 69 0 5 0
MO
NTH
:
FA
RM
/ /
ILO
PE
R.
/CU
Rcu
/7 /
o/ /
/ /,2 ,4
/ /
9/ / ,0 / /
13 53 328 6 0 0 2 0 0 0 0
302 52 17 0 8 0
47 0 13 53 328 6 0 0 0 0 0 0 0
302 52 17 0 8 0
&/W
ATER
/CU
R 0 0 1 0 0 0 0 1 0 0 0 0 0 0 0 0 0 3 2 67 0 1 0
CUM 0 0 1 0 0 0 0 1 0 0 0 0 0 0 0 0 0 3 2 67 0 1 0
AP
RIL
YE
AR
: ]
BIO
MA
SSEN
ERG
YC
UR
CU
M
0 0 0 0 0 0 0 0 0 0 0 0 0 0 0 0 0 0 0 0 0 0 0
:UM 0 0 0 0 0 0 0 0 0 0 0 0 0 0 0 0 0 0 0 0 0 0 0
L981
TOTA
LCU
R 0 15 25 23 53 9 18 73 408 61 4 0 8 0 1 1
971
204 21 0 47 12
CUM 0 15 25 23 53 9 18 73 408 61 4 0 8 0 1 1
971
204 21 0 47 12
1-1
t-*
t~l a en ^3 > h€ M Q 2; 0 • t-J
1—1 f t-1 a en i-3 » > h3 M z §
* C
urr
en
t iV
bn
th** C
um
ula
tive F
or
Fis
cal
Yea
rt<
J

ST
AT
E:
X
FAR
ME
RS
HO
ME
AD
MIN
ISTR
ATI
ON
RE
SOU
RC
E M
MS1
AG
EM
EN
T SY
STE
MC
OU
NT
Y/D
IST
RIC
F O
FF
ICE
PR
OD
UC
TIV
m R
EP
OR
TE
AR
NE
D T
IME
RE
POR
TD
IS
TR
IC
T: 07 O
FF
IC
E: A
MO
NT
H: A
PR
IL
YE
AR
: 1981
PRO
GRA
MS
LOA
N M
AK
ING
WO
RK
ITE
MS
Prea
pp
lica
tion
s R
eceiv
ed
Ap
pli
ca
tion
s R
eceiv
ed
KH
HR
50
2 5
04
FO
OL
EM
BIO
- M
-F C
P O
OM
TO
TA
L %
DIS
TK
E-
EE
S&
W M
AS
S H
OU
S W
&W
FA
C B
&I
OT
HE
R H
OU
RS
BU
TIO
N0 25
0 40 0
0 0E
ligib
ilit
y D
ete
rm
ina
tion
s 6
7 -
4 2
6 2
2L
oa
ns P
rocessed
5
3 9
0
0
0 6 38 22L
oan
s C
losed
8
Con
str
ucti
on
In
sp
ecti
on
s 4
Con
str
ucti
on
Rela
ted
Act.
0TO
TAL
LOA
N M
AK
ING
LO
AN
SE
RV
ICm
GS
ecu
rity S
ervices 5
Su
pervis
ory C
on
feren
ces 1
4^
Ba
nk
ing S
ervic
es 1
1D
eli
nq
uen
t A
ccou
nts
Serv
ed
16
0 1 0
0 0 0
6 1
33
0 0
0 0
0 0 11 0 0 0 0
0 0 0 0 0 0 0
6 0 0 0 0 0 0
0 0 0 0 0 0 0
0 0 0 0 0 0 0
0 0 0 0 0 0 0
0 9 0 0 8 0 0
0 44 168 84 155 5 0
15
7 1
8 2
6 2
8 1
99
1T
0 0
0-
T7
^56~
Paym
ent
Agre
emen
tsR
ep
ort
s E
va
lua
tion
Loa
ns S
ett
led
TO
TA
L W
M S
ER
VIC
EPK
DPE
RTY
Prb
perE
ies
Acq
uir
ed
Prop
erti
es M
?t.
Servic
es
Prop
erti
es D
isp
osed
of
TO
TA
L P
RO
P.
M3
W.
OTH
ERA
pp
ea
ls C
ase
sR
ura
l D
evel.
Mtg
s.
TOTA
L C
OH
ER
TOTA
L E
AR
NE
D T
IME
4 0 4
0 1 0 0 0 0 2
4 2 3 0 0 0 0
2 5 6 0 0 0 2
37 101 82 2 0 0 4
0 2 0 0 0 0 0
0 0 0 0 0 0 0
0 0 0 0 0 0 0
0 0 0 0 0 0 0
0 0 0 0 0 0 0
0 0 0 0 0 0 0
0 3 0 0 0 0 0
48 128
102 18 4 0 12
58
54 0 7 0 7 0 0 0
218
l 2
8
3 0 0 0 0 0 0 0^
21 3
9 0 0 0 0 0 0-0
-
35 4
15 0 0 0 0 0 0 0 43 5
226 0 0 0 0 0 0 0
425 54
^ 0 0 0 0 0 0 ^~
13 2
-0- 0 0 0 0 0 0 T 0 0
~0 0 0 0 0 0 0 ~0 0 0
~0- 0 0 0 0
~ 0 0~
0~ 0 0
~0 0 0 0 0 0 0
-0~ 0 0
CT 0 0 0 0 0 0-0
~ 0 0
T 0 0 0 0" 4 6
-To~
30 4
31
2" 0 7 0 T 4 6
~T
o~
785
~~
^Q T T
100
13
MB
) t-
1tQ
t-1
(D a en
-* n 0^ i-
ft i
-3 ME
-J 0 z B U
!
V M
d) f
tQ f
i(D
a w-' ^
3
o| hh
^3
1-1
bj
0 z § LL)

FAR
ME
RS
HO
ME
AD
MIN
ISTR
ATI
ON
RE
SOU
RC
E M
AN
AG
EM
EN
T SY
STE
MC
OU
NTY
/DIS
TRIC
T O
FFIC
E A
CO
OM
PLIS
HM
EN
T R
EPO
RT
ST
AT
E: X
DIS
TR
ICT
S 0
7 O
FF
ICE
: A
CO
WTO
ATI
CN
OF
PER
FOR
MA
NC
E F
AC
TOR
TOTA
L H
3UR
S W
3RK
ED
.
TE
AV
EL
, TR
AIN
ING
AN
D A
DM
INIS
TK
AT
IW
TRA
VE
L H
3UR
ST
RA
ININ
G H
XJR
SA
LL
OW
AN
CE
ED
R A
DM
INIS
TR
AT
ION
. .
(SJ u
TOTA
L N
3N-P
RD
GR
AM
HO
UR
S
NE
T PR
OG
RA
M H
3UR
S
TOTA
L E
AR
NE
D T
IME
% O
F PR
OG
RA
M H
OU
RS
EA
RN
ED
PE
RF
OR
MA
NC
E F
AC
TO
R.
MON
TH
SEP
oa?
NW
DEC
JAN
FEB
MAR
AP
R
80 80 80 80 81 81 81 81
PER
TOR
MA
NC
E F
AC
TOR
TR
EN
DS
PF C
ATA
GO
RIE
S
3 3 2 2 3 1 2 2*
MC
NB
Hs
AP
RIL
YE
AR
: 198
1
CURR
ENT
~938
27 014
1
168
770
785 2
*
%-T
OO
- 3 0 15 18 82 84 102
FY
-TO
-DA
TE
~T
H8~
198 0
1002
1200
5918
6280
2
%T
OO
" 3 0 17 20 80 88 no
v D)
>£1 CD ESJ
0 1-h M
M f f a o? h9 I i-3
h"l Q z z 0 U
>ti
1-1
{o t
-1tQ
E-i
(D a en
M i
-3 »0
>H
i ^
-3 MM
0 2; z 0 LO

PRODUCTIVITY MEASUREMENT SYSTEMDEPARTMENT OF COMMERCE
BACKGROUND
The Department of Commerce provides a wide variety ofprograms that encourage, serve and promote the Nation'seconomic health. The Department is decentralized with theOffice of the Secretary and 13 operating units performingsuch functions as offering assistance and information todomestic and international business, providing social andeconomic statistics and analyses for business and governmentplanners, and assisting in the development and operation ofthe U.S. Merchant Marines.
Three entities within the Department, along with theJoint Financial Management Improvement Program and the Officeof Personnel Management, developed a productivity measurementsystem for finance and accounting operations.
The diversity of functions within the three organiza-tions in Commerce helped to insure that most functionswithin a typical Federal finance and accounting officewould be reviewed and covered in the new system. Some ofthese activities are described in the following paragraphs.
The Office of the Secretary performs accounting andpayroll processing for itself and six operating units inthe Department. Its system accounts for administrativefunds. The Office maintains a revolving fund and receivesreimbursements for the accounting and payroll services itprovides to its "customers." This Office also is responsiblefor preparing consolidated accounting statements and reportsrequired of the Department.
The Economic Development Administration maintains anaccounting system for its program funds. A significantnumber of loan and grant activities are serviced throughthe system. The Administration also administers severalthousand letters of credit for its grant programs. However,it does not maintain its own payroll system, but relies onthe central payroll services provided by the Office of theSecretary.
The Maritime Administration performs payroll processingand accounting services for its administrative and programfunds. It administers a large number of interagency agree-ments and procurement contracts.
24 -

PRODUCTIVITY MEASUREMENT SYSTEM
To develop a productivity measurement system^ the firststep was to analyze the functions, activities and sub-activities of finance and accounting operations. The majorfunctional areas identified weres payroll processing,operation accounting, control accounting and generaladministration. These functional areas were further brokendown into activities and subactivities. For example,"operation accounting" was ..further identified as includingthe following activities; disbursement transactions, cashadvance monitoring, receipt transactions, other accountingtransactions, technical assistance, and other. The activityy"disbursement transactions" consisted of seven subactivities;reservation of funds, travel voucher examination, grant andcontract voucher examination, purchase order voucherexamination, loan and loan guarantee voucher examination,other voucher examination, and disbursements and drawdowns.
Since there were many interpretations, understandings,and conceptions of what each activity and subactivity underthe functional areas entailed, the task of defining theactivity using uniform terminology was very time consuming.However, this process of defining each activity had tobe completed so that there would be a common basis formeasurement and comparative analysis. The complete set ofdefinitions of the activities is provided in IllustrationNo. 1 (page 28).
The system utilizes output and input measures to gener-ate the necessary productivity data required by management.Output measures were identifed for each activity and sub-activity. Examples of output measures are "number ofemployees paid" for biweekly payroll and the "number ofvouchers" for voucher examination. The systeniy to a largeextent, was designed to use much of the output data that werealready being produced; however, modifications were made toaccommodate the functional and activity structures. Alloutput measures for the Commerce system are listed inIllustration No. 2 (page 35).
A system to collect input data had to be developed. Forthe present, only labor time is measured for input. Theaccounting and finance offices must furnish the total laborcosts for allocation to the activities and subactivities.Other inputs, such as automatic data processing costs, can bereadily included in the future. The system is flexible andconducive to future expansion and enhancement.
25 -

Labor input measures are either direct or indirect.Direct labor is defined as all employee time, professionaland clerical, used to directly produce the output in afunctional area. It is the "hands-on" time directly spenton producing the output and has been defined under thefunctional and activity categories. Indirect labor isdefined as time spent in general management, supervision,administration and clerical support, and nonproductive timesuch as leave, travel and training. The categories ofindirect labor and their definitions are provided inIllustration No. 3 (page 36)o
The system for collecting the labor input data uses arandom work sampling procedure that was originally developedby the Office of Personnel Management for personnel offices.This system was selected because it caused minimal workdisruption^ was accurafeey ensured confidentiality and waseasy to administer. It uses random sampling procedures formaking observations of what employees are doing. Based onthe aggregate observations^ a determination is made as to thepercent of time employees spend on various functions andactivities-
The sampling procedure was formulated to make a suffi-cient number of observations to insure a confidence levelof 95 percent and a precision level of plus or minus 5percent. The times for random sampling observations arecomputer generated and are based on the work schedule of theorganization, when a designated control person(s) announcesthe time of a sampling observation, each employee places amark on the survey sheet opposite the appropriate activityor subactivity he or she is performing at that time. The•survey sheet is shown in Illustration No. 4 (page 37). Theobservation and recotding are conducted five times a day fora sufficient number of days to meet the above statisticalcriteria.
At the end of the observation period, the survey sheetsare spot checked by supervisors and sent to the Office ofpersonnel Management for processing. The computer fchencomputes the percent of time spent for each activity andsubactivity based on the total number of observations.The number of labor hours attributable to each activity orsubactivity is computed by applying the percentage to thetotal number of hours available. Similarlyy the labor costof each activity or subactivity is computed by applying thepercentage to the total payroll costs.
26 -

The Office of Personnel Management has a standardprogram that generates productivity reports for agencymanagement. These reports include?
1. Labor hour distribution by activity and subactivity»
2. Productivity indices or total output/total laborinput,
3. Labor cost by activity or subactivity,
4. Unit labor cost for each quantifiable outputy and
5. Interoffice comparisons and trend analyses.
This system is open-ended for future enhancements., Thesurvey sheet can be changed to add other activities whenneeded. Other benefits of using this system includesminimal employee disruption and trainingy flexibility toaccommodate changes in office structure, and easytransferability to other offices within the Department.
The participants learned important lessons for success-fully implementing any productivity measurement system.
It is important and critical tos
—Have top level management support and commitmenl: ondeveloping and using the system,
—Keep employees informed from the early stages on whatthe system means to them and their participation init,
—Have outsiders participate in the development of thesystem^ since they can arbitrate "deadlocks" ondefinitions of activities and other matters,
—Have individuals with enough expertise develop theoverall system,
—Use existing data collection systems as much aspossible, instead of "reinventing the wheel,"
—Strive for a single system that can be readilyunderstood by all who are involved, and
—Develop a flexible system that can accommodate futurechanges and expansion.
27 -

ILLUSTRATION NO. 1 ILLUSTRATION NO. 1Page 1 of 7 Page 1 of 7
PRODUCTIVITY MEASUREMENT SYSTEMMAJOR FUNCTIONAL AREAS AND CATEGORIES
I. PAYROLL PROCESSING TRANSACTIONS
This area includes all professional, technical anddirectly related clerical staff time spent in processing thebiweekly payroll, including retroactive or supplemental pay,maintenance of ancillary pay records; preparation of employeeclose-out records? preparation and issuance of payrollrelated reports", assisting "customersy" and answering pay-
roll related questions. Time devoted to designing andreviewing the payroll systems should also be included.
A. Biweekly Payroll - All staff time spent in processingemployees' biweekly payroll, including changes in deductions(e-g.y bond and allotment deductionSy and tax levies),special pay, (e.g., night differential dutyy hazardous dutyand holiday payy etc.)y supplemental and retroactive pay,leave earned or used? balancing payroll to control totals?and maintaining time and attendance recordsy and changes onemployee pay files.
B. Payroll Reports and Records - All staff time spent inpreparing and reviewing reports on employee pay and deduc-tions from gross pay (e.g.y Federal, State and local taxes,FICAy Federal retirement^ life insurance^ and healthbenefits); retirement records? geographical distributionof employee pay? consultants? reemployed annuitants andother similar items including full time equivalency.
C. Close-Outs - All staff time spent in assembling,calculating and preparing final close-out documents foremployees who have terminated their employment by separation,retirement, or by death.
D. Management and Technical Assistance - All staff timespenfc in rendering assistance to employees and ex-employees,other Government agencies, and others regarding payrollmatters. This should include special analysis as well asanswering routine inquiries.
Eo Other - All staff time spent in payroll processing thatwas not defined in the above categories. Wh^n used, pleasespecify the activity on the survey form.
28 -

ILLUSTRATION NO. 1 ILLUSTRATION NO. 1Page 2 of 7 Page 2 of 7
II. OPERATION ACCOUNTING
This functional area includes all professional, techni-cat, and directly related clerical staff time spent by theaccounting office in the processing of routine accountingtransactions related to; fund authorizations, reservation offundSy voucher examination, processing of disbursements,letter of credit drawdowns, accounts receivable, collections,property, preparation of letters of credit, and systemreviews of designs related to processing of all routineaccounting functions. Keypunching and filing activitiesshould be recorded under the associated functional category(i»e., filing pay vouchers recorded under disbursements).Each category is defined in more detail below.
A. Disbursement Transactions
1. Reservation of Funds - All staff time spent in pro-cessing, recording^ and inputting individual commitments;"contingent liabilities?" obligations? simultaneoustransactions for commitmentSy obligations, accounts pay-able, and disbursements; accounts payable documents andchanges thereto.
The recording of individual documents on a day-to-daybasis includes time spent via the terminal receiving,reviewing and notifying each regional office on reser-vations of funds, memo entries such as "contingentliabilities," and changes to the amount and scope ofthe project. This also includes changes in obligationsreported by the recipient agencies of nonexpendituretransfers to and from other agencies. However, recordingreservations, obligations and accounts payable, based oneither actual documents or estimates available at the endof the reporting period, will be considered closingentries and reported under "Control Accounting."
2. Voucher Examination - All staff time spent inexamining and processing the following vouchers:
—Travel vouchers (e.g., local, standard per diem
ratesy actu&l expense, permanent change of station,international and other travel).
--Grant/contract vouchers (e.g»y program activities
involving contracts, grants, interagency agree-mentSy and loan and bond agreements).
29 -

ILLUSTRATION NO. 1 ILLUSTRATION NO. 1Page 3 of 7 Page 3 of 7
—Purchase order vouchers (e.g., matching purchase
orders, vendor invoices and receiving reports).This activity also includes verifying the accuracyof amounts billed and vouchered, contract payments(progress payments and final voucher), consultants,interagency invoices, working fund invoices, andsimilar vouchering activities.
--Loan guarantee transactions as reported by banks or
trustees.
--Other voucher examination functions not described
above.
3. Disbursements and Letter-of-Credit Drawdowns - All
staff time spent processing, recording and inputtingdisbursements involving a prior reservation of fundsincluding grants, loans, contracts, travel, workingcapital or other revolving funds, interagency transfersof funds utilizing SF-1080 and SF-1081, commercialinvoices, and others. The recording or processing ofletter-of- credit drawdowns, electronic transfers offunds, check issue dates, check "delivery dates, and
similar disbursement transactions, including time spenton cancelled, returned or lost Government issued checks.
Periodic recording of changes in disbursements reportedby recipient agencies of nonexpenditure transfers to andfrom other agencies will also be reported in thiscategory. Any disbursement transaction preceded by anaccounts payable transaction should be reported in thiscategory as a disbursement, and not as a reservation offunds. The disbursement process starts after the voucherexaminer has completed a review of the document forpayment. This is true even if the same person performsboth functions.
B. Cash Advance Monitoring - All staff time spent inmonitoring and controlling recipient drawdown practicesand balances of Federal funds advanced by either Treasurycheck or letter of credit, exclusive of the recording andprocessing of letter-of-credit drawdowns and the preparationof the letter of credifc itself. This includes identifyingrecipients with advance funding, processing and controllingreports on Federal Cash Transactions, reviewing and inputtingFederal dollars on hand from drawdown vouchers, recovering
30 -

ILLUSTRATION NO. 1 ILLUSTRATION NO. 1Page 4 of 7 Page 4 of 7
excessive drawdowns or interest earned by recipients exclu-sive of audit or receipt transactions, providing informationon recipients with balances of Federal funds to program offi-cials and overall statistical reporting. This also includesactions taken in connection with commercial banks holding orslowing down the drawdown process. The recording and pro-cessing of letter-of-credit drawdowns is included under PartII, item A3, "Disbursement and Lefcter-of-Credit Drawdowns,"
and the maintenance of the letter of credit is included underPart II, item D2, "Preparation of Letter of Credit."
C. Receipt Transactions
1. Accounts Receivable - All staff time spent inprocessing, recording and inputting individual amountsowed to the agency by employees, "other agencies' controlfundsy" private citizens, commercial firms, Stafce andlocal governments, and others. Included are receivablesarising from grants, loans, loan billings, contracts,purchased interest, participation loans, reimbursableservices performed, and fees. When processing individualdocuments on a day-to-day basis, this category shouldinclude safekeeping of notes and loans receivable,recording of memo entries related to the closeoutprocedure (e.g.y setting up a dollar amount to identify"subject to audit," amounts questioned, accountsreceivable, nonfinancial transactions, and write offs),and reversing any of the above entries.
The recording of other receivables, based on groupdocuments or estimates at the end of the reporting periodwill be considered closing entries and will not becounted under this category.
2. Collections - All staff time spent in preparing De-posit Tickets; processing, recording and inputting cashreceipts; and collection of amounts due the agency re-suiting from all types of overpayments, loan collections,advances, fee repayment agreements, miscellaneous income;and any analyses performed concerning the collection ofreceipts. This also includes the followup on open ac-counts receivable and collections made by other Federalagencies on the agency's behalf. Collection transactionspreceded by an accounts receivable transaction formeasurement purposes will only be counted under thiscategory, and not in the accounts receivable category.
31 -

ILLUSTRATION NO. 1 ILLUSTRATION NO. 1Page 5 of 7 . Page 5 of 7
D. Other Accounting Transactions
1. Property - All staff time spent in processing,recording, inputting transactions affecting the propertyowned by the agency or acquired by the agency through aloan default Or write of a, including property loaned toor received from others,, sold, under construction^purchased, acquired through a no-fund transfer, oracquired by the defaulted loan made by the agency.
2. Preparation of Letter of Credit - All staff timespent in setting up, controlling, maintaining, revoking,and amending letters of credit, including the maintenanceof the signature cards required for the drawdowns.
3. Management and Technical Assistance - This includesall staff time spent in answering inquiries and assistingothers concerning the operation accounting area.
III. CONTROL ACCOUNTING
This functional area includes all professional,technicaly and directly related clerical staff time spentperforming accounting and control activities involving theresolution of errors and corrections of routine accountingtransactions? preparation and control of closing, special andgeneral journal entries; reconciliation of control accountsto subsidiary accounts and related supporting documents;preparation and review of both internal and external account-ing and special financial reports issued^ and system analyseswork.
A. Fund Authorization - All staff time spent in processingand recording in the formal books of account," initial entriesonly for appropriation warrants, apportionments and reappor-tionmentSy allotmentSy and other budget limitation documentsor operation plans; and the initial entry from nonexpendituretransfers to and from other agencies (SF-1151). All sub-sequent entriesy such as periodic recording of changes inobligations and disbursements are not reported in thissubcategory.
B. Reconciliations - All staff time spent to research,direct, process, record and input entries into the accountingrecords to correct transactions that were erroneously entered
into the accounting system. This includes preparation of
32 -

ILLUSTRATION NO. 1 ILLUSTRATION NO. 1Page 6 of 7 Page 6 of 7
correcting entries needed to effect such corrections, and.reconciliations of control accounts to related subsidiaryaccounts, including reconciliations of letters of credit withthe Federal Reserve Board and the Department of the Treasury.It also includes preparation of supporting documentationassociated with preliminary closing procedures, accountingcontrols, and system reviews.
Co Reporting - All staff time spent in preparing, reviewingand issuing both internal and external periodic and specialreports to management, the Congress, and other FederalGovernment agencies. State and local governments, and others(i.e.y audit requests by CPA firms and certified statementsof account). This includes activities associated withcomparing "in-house" reports with those reports preparedexternally^ analyzing the differences, processing correctionswhen internal records are in error, and informing externalreporting sources of corrections needed in their records.This category excludes the time spent in the preparation ofadministrative nonfinancial reports (e.g., EEOy specialstudies, and other administrative reports).
IV. GENERAL ADMINISTRATION AND OTHER
This category includes all time spent by managementand clerical personnel in the overall management of theaccounting office which cannot be directly identified orassociated with any defined functional area. It alsoincludes planning, special assignments and tasksy overallcross-functional accounting design and review activities,and accounting program evaluations and reviews.
A. Planning - All staff time spent planning for accountingpersonnel resources, organizational changes, and budgetpreparation activities.
Be General Supervision - All staff time spent in generalmanagement of the accounting office and accounting systemwhich cannot be identified within a specific functionalarea.
C. Special Emphasis Program - All staff time spent workingon a program which is unrelated to, or cannot be identifiedwith, a program in a specific functional area (e.g., EqualEmployment Opportunity Programs).
33 -

ILLUSTRATION NO. 1 ILLUSTRATION NO. 1Page 7 of 7 Page 7 of 7
D, System Analysis - All staff time spent in review anddesign of the overall financial management system thataffects one or more functional area.
E. Management and/or Technical Assistance - All staff timespent to assist constituents on matters not currently beingprocessed elsewhere in the accounting office-
F. Other - This category is provided for the accountingoffice staff to record that nonspecific time which cannot beaccounted for in any of the above categories. Pleasewrite in the specific activity in which you were engaged whenthe sampling time was announced.
34 -

ILLUSTRATION NO. 2 ILLUSTRATION NO. 2
FINANCE AND ACCOUNTING PRODUCTIVITYMEASUREMENT SYSTEM'S OUTPUT MEASURES
Activity
Biweekly PayrollPayroll Reports & RecordsCloseout
Operation Accounting
Disbursement Transactions
Reservation of FundsTravel Voucher ExaminationsGrant/Contract Voucher Exam.Purchase Order Voucher Exam.Loans E! Guarantee Voucher Exam,
Other Voucher Exam.Disbursement and Drawdown
Receipt Transactions
Accounts ReceivableCollections
Other Accounting Transactions
PropertyPreparation of Letter of CreditCash Advance Monitoring
Control Accqunting
Fund AuthorizationReconciliationsReporting
Output Measure
No. of Employees PaidNo. of Reports IssuedNo. of Closeouts
No» of Transactions
No. of VouchersNo. of VouchersNo. of VouchersNo. of VouchersNo. of Vouchers
No. of Treasury Checksand Letter-of-CreditDrawdowns
No. of TransactionsNo. of Transactions
No. of TransactionsNo. of Letters of CreditNone
No. of Transactions
NoneNo„ of Reports Issued
35 -

ILLUSTRATION NO. 3 ILLUSTRATION NO. 3
CATEGORIES FOR INDIRECT LABOR
Supervision - refers to those job functions and responsibili-ties that supervisors and managers perform as an inherentpart of their jobs.
General Administration - refers to that time an employeespends in nonproduction work (e.g.y getting office supplies,attending general agency meetings, professional reading,etc.).
Cleri.cal - includes typing, mail distribution, filing^ andother administrative tasks.
Leave - includes all types of paid leave time (e.g., annual,sick, military, court, and administrative leave).
Training - refers to specific training courses, or seminarsthat an employee attends outside the office, as well ason-the-job training.
Travel - includes times in transit to and from aninstallation where work in a functional area is being done.
Personal Time - refers to that time required by the employeefor personal matters (e.g., rest breaks).
Npnfinancial Reports - refers to those nonfinancial reportsthat must be prepared and sent to other offices and agencies(e.g., EEO reports).
36 -

ILLUSTRATION NO. 4 ILLUSTRATION NO. 4
FINANCE AND ACCOUNTING PRODUCTIVITY MEASUREMENT SURVEY gygde
PAYROLL PROCESSING TRANSACTIONSBIWEEKLV PAYROLL ;
e B PAYROLL REPORTS & RECORDS.BOB CLOSEOUTSB SB MGT/TECH ASSISTANCE,0 -i • OTHER (StXdfy).
ADMINISTRATIVE/Ct.ERICALSUPERVISORYGENERAL ADMINISTRATION
gg CLERICAI-LEAVETRAININGPERSONAL TIME
OPERATION ACCOUNTING TRANSACTIONSDISBURSEMENT TRANSACTIONS—RESERVATION OF FUNDS—TRAVEL VOUCHER EX-AM~INATION-ORANT/CONTRACT VOUCHER EXAMINATION.—PURCHASE ORDERS VOUCHER EXAMINATION-l-OAN & GUARANTEE VOUCHER EXAMINATION-OTHER VOUCHER EXAMINATION,-OISBURSEMENTS «, DRAWDOWNS.
CASH ADVANCES'£• __._. •
u> ^ B RECEIPT TRANSACTlUNS-ACCOUNTS RECEIVABLE
J°_J-B -COLLECTIONS
OTHER ACCOUNTING TRANSACTIONS—PROPERTY ./..'.
—PREPARATION OF LETTER OF CREDITMOT/TECH ASSISTANCEOTHER (Sp«cl(y).
ADMINISTRATIVE/CLERICALSUPERVISORY
B GENERAL ADMINISTRATIVE-E S CLERICAL.
LEAVE.TRAININGPERSONAL TIME
CONTROI. ACCOUNTINGFUNDS AUTHORIZATIONRECONCILIATIONS
goi REPORTING .6 n B MGT/TECH ASSISTANCE.Q 3 B OTHER (Sp«clfy).
AOMINISTRATIVE/CLERICALSUPERVISORYOENERfiL ADMINISTRATIVE
0 CLERICAL.LEAVETRAINING ..............TRAVEI-PERSONAL TIME
GENERAt. ADMINISTRATIVEPt^NNINQQENERAL SUPERVISORY
&£B SPECIAL EMPHASIS PROGRAMS"SB tYSTEMS ANALYSIS
MQT/TECM ASSISTANCE.OTHER (Sp.clfy).
ADMINISTRATIVE/CLERICALtUPCRVISORYGENERAL ADMINISTRATIVE
K CLERICALg 0 LEAVE
TRAINING.TRAVELREPORTS (NontliunclU)WnSONAt.TIME
IUNCM
mr&i.
RANDOM TIMES
OAV 1 DAY 2 DAY 3 DAY « DAY 5TOTAL
[Do Not US<)
s;
?iSWSfM
J^^^^^i^S^^WAg^^
~""""~^
V!9SX
ffi!^^???:"'^
B'SiW^iSs
B
^y^^^::;t^%:^g:^::^^^.^^
I&^W^K^';.;^;.
37 -

WORK MEASUREMENT SYSTEMSOCIAL SECURITY ADMINISTRATION
BACKGROUND
The Social Security Administration administers anational program of contributory social insurance formost American workers and manages all aspects of programsinvolving retirement, survivor's and disability insuranceand supplemental security income. Accounting for thesetransactions and for administrative areas is handled by acentral Division of Finance in its headquarters office. TheDivision handles administrative payments for the agency butdoes not make the benefit payments.
The Division of Finance has three branches. TheAccounting Operations Branch, with four sections, isresponsible for the transaction processing and reportingoperations. The Administrative Payments and Recovery Branch,with five operating sections, is responsible for the auditingand filing relating to administrative payments, the prepara-tion and submission of schedule of payments to Treasury, theprocessing of travel documents, the collection of monies owedto the Administration, and the payroll operations. TheAccounting Policy and Systems Branch is responsible fordeveloping and monitoring policies and systems in the Divi-sion of Finance.
The Division utilizes a Goal and Performance MeasurementSystem to monitor the productivity^ quality and effectivenessof its operations. The System is used for budget formula-tiony justification and execution. It is also used bymanagement in making key decisions in the following areas;allocation of staff resources; analysis of operations anddetermination of corrective action^ formulation and executionof personnel ceiling, overtime and training plans? managementof projects; and decisions on merit pay. The Goal andPerformance Measurement System has many components thatprovide different information to management. The remainingparagraphs will discuss in detail the Work MeasurementSystem, a major segment of the Goal and PerformanceMeasurement System.
WORK MEASUREMENT SYSTEM
The Work Measurement System provides information on howstaff resources are used, and the type, complexity and flowof work processed in two of the branches (the AccountingOperations Branch and the Administrative Payments and Recov-ery Branch) in the Division of Finance. Approximately 75
38 -

percent of the 200 employees in the Division is monitored bythe System. The System does not cover professional, super-visory and some clerical support personnel.
To provide the basic framework for the System, thefunctions, activities and subactivities within the twobranches were identified and defined. The System has twocategories of workload—direct operations and indirectoperations. Direct operations cover the work that isprocessed in the Division that results in measurable outputs.Indirect operations include those activities that are notdirectly related to processing work, such as: training,leave, meetings and breaks.
Direct operations functions and activities that wereidentified in the two operational branches covered by theWork Measurement System are listed in Illustration No. 1(page 41). Illustration No. 2 (page 43) provides examplesof the definitions of each activity and subacfcivity for theTravel Operations Section of the Review and CertificationBranch.
The Work Measurement System utilizes a random worksampling technique to estimate the amount of labor expendedin each of the functions, activities and subactivitiesidentified. The work sampling is conducted once each quarterfor a period of one month. Five observations are made eachday. The times of the observations are randomly selected anddeveloped by a fiscal operations analyst who is in charge ofthe Work Measurement System in the Division of Finance.Supervisors and unit leaders act as observers for worksampling, and record what each employee is doing at themoment an observation is made. Observations are recorded ona survey sheet like the one shown in Illustration No. 3 (page46) .
The observers summarize and review the weekly totals andforward them to the fiscal operations analyst who developsratios or percentages on the number of observations made foreach work activity to the total number of the observations.These ratios then are applied to the total staff hours forthe period to distribute the staff hours among the variousactivities and subactivities. At the end of a quarter,totals are computed and summarized in a report that showsstaff time consumed in each function, activity and sub-activity. In the same report, the current year data arecompared with those of the previous fiscal year and thenext budget year. Also, the report, as shown in IllustrationNo. 4 (page 47), shows the percentage of total staff timeutilized for each activity and subactivity.
39 -

Significant variances on percentage of time spent oneach type of workload are pointed out to management. Anarrative report explaining why variances exist and otherfactors that affect the changes in productivity must be madefor management review. For this purpose, the systemgenerates other reports to keep managers informed of theproductivity of their operations. These include;
--Workload trend reports graphically depicting theworkload received and processed during the past threemonths?
--Workload reports showing the actual amount of workloador output for each subactivity^
—Productivity reports comparing actual staff time?workload and productivity statistics with budgetedfigures (Illustration No. 5, page 48); and
—Productivity indices reports showing graphically thetrend of manpower, workload and productivity indicesfor each operation during the fiscal year (Illustra-tion No. 6, page 49).
Management at the Social Security Administration can usethis information to justify budget estimates for staffingrequirements, allocate staff resources within the Division ofFinance, forecast workloads, formulate and execute personnel
ceilings^ make overtime and training plans, as well as tomake merit pay decisions.
40 -

ILLUSTRATION NO. 1 ILLUSTRATION NO. 1Page 1 of 2 Page 1 of 2
DIRECT OPERATIONS MEASURED
I. Accqunting Operations Branch
A. Receipt and Control of Documents
1. Open and Distribute Mail2. Batch and Control Documents3. Association and Filing4. Microfilming Operations
B. Auditing Operations
C. Transaction Operations
1. Payroll2. Fedstrip3. All Other4. Reviewing and Correction
D. Reports
1. Preparation2. Reconciliation and Correction3. Distribution
II. Administrative Payments and Recovery Branch
A. Receipt and Control of Documents
B. Payroll Operations
1. Timekeeper Control2. Time and Attendance Operations—Field3. Time and Attendance Operations--Cenfcral Office4. Check and Bond Distribution5. Timekeeper Training
C. Disbursing Operations
1. Certifying Officer Control2. Imprest Fund Operations3. Travel Advance Authorization
41 -

ILLUSTRATION NO. 1 ILLUSTRATION NO. 1Page 2 of 2 Page 2 of 2
II. Administrative Payments and Recovery Branch (Continued)
D. Collection Operations
1. Reimbursable Agreements Operations2. Collection and Deposit Operations3. Travel Advance Application Operations
E. Reports
F. Audit Operations
1. Voucher Operations2. Schedule Operations3. Paymenfc/Cashier Status Inquiries4. Cashier Payment Operations5. Cashier Maintenance Operations
G» Travel Voucher Operations
H. Travel Schedule Operations
I. Travel Training
Jo Travel Services
1. Travel Orders2. Teleticket Operations3. Transportation Requests4. Travel Assistance
K. Travel Assistance
L. Specialized Activities
42 -

ILLUSTRATION NO. 2 ILLUSTRATION NO. 2Page 1 of 3 Page 1 of 3
ADMINISTRATIVE PAYMENTS AND RECOVERY BRANCHTRAVEL OPERATIONS SECTION
WORKLOAD DEFINITIONS
I. VOUCHER OPERATIONS
This workload includes all activities related to theaudit of travel vouchers^ passenger bills and local travel.Subsidiary workloads are listed and defined below.
A. Voucher Examination - Time spent to review travel
vouchers and passenger bills for conformity with authoriza-tion documents and regulations; verify amounts on vouchers
including re-computing amounts; correct errors and calculate
adjustments,' review extended per diem requests and actualand necessary expense requests; review change of stationreimbursements for taxable income? compute income taxes to bewithheld; notify employees of amounts reportable as taxableincome and tax withheld," record and obtain common accountingnumbers and subobject classes to be recorded on vouchers^enter/underline data to be shown on vendor's check; xeroxrelated documents as needed? and certify and assembledocuments for scheduling.
B. Payment and Control Record Maintenance - Time spent
to establish and maintain payment records, includingestablishing and maintaining folders on travelers; maintainTransportation Request (TR) files^ and open and distributemail.
C. Exception Search and Query Activity - Time spent tocontact Social Security Administration (SSA) and non-SSAcomponents for missing data; prepare and review correspond-
ence on resolution of disputed claims, disallowance made,etc.,- and perform related typing and clerical activity.
D. Review - Time spent to review other voucher examiners'
work.
II. SCHEDULE OPERATIONS
h. Pre-Schedule Activity - Time spent to alphabeticallysort vouchers by category and appropriation,- batch vouchers;prepare tape by appropriation totals," and affix schedule andbureau voucher numbers on invoices.
43 -

ILLUSTRATION NO. 2 ILLUSTRATION NO. 2Page 2 of 3 Page 2 of 3
B. Typing Activity - Time spent to type schedules to beforwarded to Treasury for check issuance.
C. Proof and Verify - Time spent to proof schedules and toverify schedule totals.
D. Post/Schedule Activity - Time spent to certify paymentto Treasury, sort and distribute completed work to Treasuryand other Finance Division components; post control logs ofschedule and bureau voucher number; file schedules; and xeroxadditional schedules needed.
III. TRAVEL TRAINING
Time spent to develop and conduct training courses;compile required material; prepare and issue certificates;maintain statistical records for training.
IV. TRAVEL SERVICES
A. Travel Orders - Time spent to review change of stationand other travel orders including advance of fund applica-tions for all Office of Management, Budget and Personnel(OMBP) components. This includes determining costs, thenumber of trips to be taken, assigning travel order number,insuring all necessary forms are attached to the travel ordersuch as the Notification of Personnel Action (SF-50)yAuthorization of Moving and Related Travel Expenses, and theEmployee Agreement for change of station orders; forwardingtravel orders to OMBP components and the application foradvance of funds to the Collection and Payroll Section. Alsoit includes the review of all other travel orders for centraloffice personnel and the contacting of appropriate personnelto resolve errors or request additional information; andrelated typing and clerical activities.
B. Teleticket Operations - Includes preparation ofteleticket billing for processing the payment includingverifying ticket number, passenger name, travel ordernumber, amount, accounting data, dates of travel and
contractor airline code.
C. Transportation Requests - Time spent to screen incoming
TR's for those needing followup action; account for all TR'sissued to headquarters employees; maintain a daily inventoryof all Transportation Requests (TR's) received, issued, used
44 -
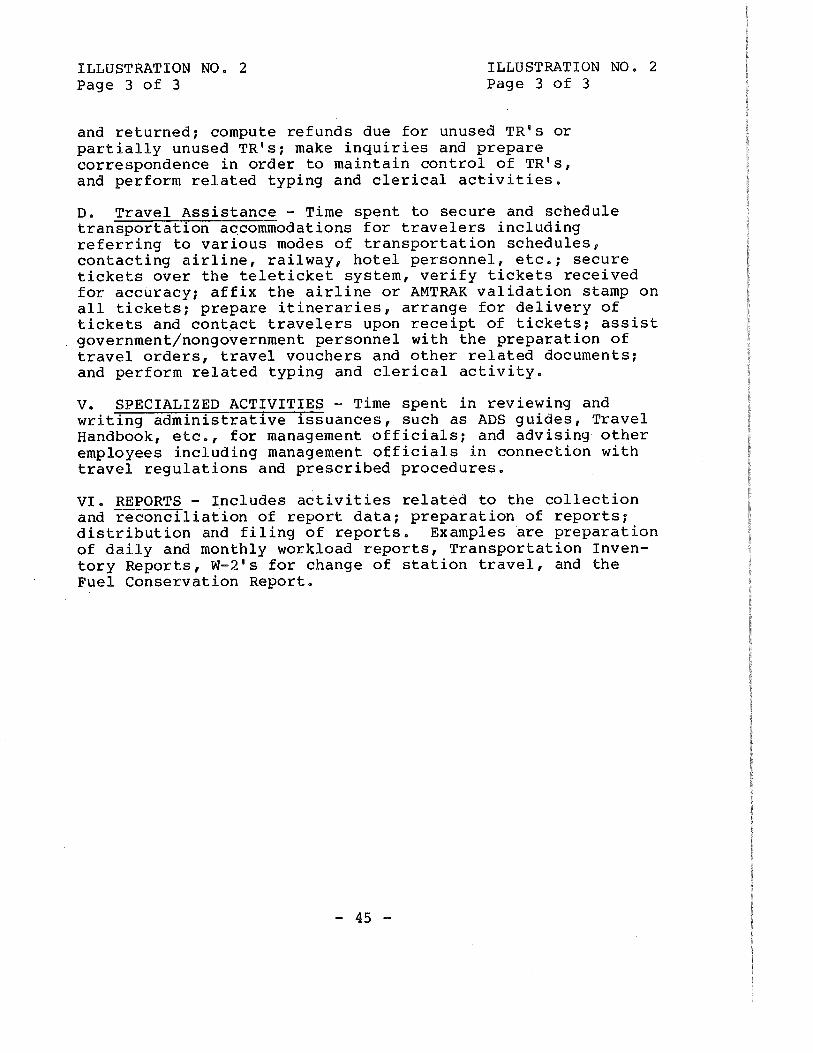
ILLUSTRATION NO. 2 ILLUSTRATION NO. 2Page 3 of 3 Page 3 of 3
and returned; compute refunds due for unused TR's orpartially unused TR's; make inquiries and preparecorrespondence in order to maintain control of TR's,and perform related typing and clerical activities.
Do Travel Assistance - Time spent to secure and scheduletransportation accommodations for fcravelers includingreferring to various modes of transportation schedules,contacting airline, railway, hotel personnel, etc.; securetickets over the teleticket system, verify tickets receivedfor accuracy; affix the airline or AMTRAK validation stamp onall tickets; prepare itineraries, arrange for delivery oftickets and contact travelers upon receipt of tickets; assistgovernment/nongovernment personnel with the preparation oftravel orders, travel vouchers and other related documents;and perform related typing and clerical activity.
V. SPECIALIZED ACTIVITIES - Time spent in reviewing andwriting administrative issuances, such as ADS guides. TravelHandbook, etc., for management officials; and advising otheremployees including management officials in connection withtravel regulations and prescribed procedures.
VI. REPORTS - Includes activities related to the collectionand reconciliation of report data; preparation of reports?distribution and filing of reports. Examples are preparationof daily and monthly workload reports. Transportation Inven-tory Reports, W-2's for change of station travel, and theFuel Conservation Report.
45 -

ILLUSTRATION NO. 3 ILLUSTRATION NO. 3
ADMINISTRATIVE PAYMENTS AND RECOVERY BRANCHTRAVEL OPERATIONS SECTION
MONTHLY WORK MEASUREMENT SUMMARY REPORT
MONTH OBSERVATIONS PERCENTAGES
OBSERVATION CATEGORY
I. DIRECT OPERATIONS
A. Voucher Operations1. Voucher Examination
2. Record Maintenance
3. Search and Query4. Review
B. Schedule Operations1. Pre-Schedule Activity
2. Typing Activity3. Proof and Verify4. Post/Schedule Activity
C. Travel Training
D. Travel Services1. Travel Orders2. Teleticket Operations3. Transportation Requests4. Travel Assistance
E. Specialized Activities
F. Reports
II. INDIRECT OPERATIONS
A. Training
B. Leave
C. Meetings and Miscellaneous
D. Breaks and OtherNon-Productive Time
TOTAL
TOTAL T 2 3 "T 5
46 -

>&•
-J
OB
SER
VA
TIO
N C
AT
EG
OR
Y
DIR
EC
T O
PE
RA
TIO
NS
A.
Vou
ch
er O
pera
tion
s
1. vou
ch
er E
xam
inatio
n2. R
ecord
Main
ten
an
ce
3. S
earch
an
d Q
uery
4. R
evie
w
B.
Sch
ed
ule
^ O
pera
tion
s
C. T
ravel
Train
in9
D.
Tra
vel
Servic
es
1. T
ravel
Ord
ers
2.
Tele
tic
ket O
pera
tio
ns
3.
Tra
nsp
orta
tio
n R
eq
uests
4.
Tra
vel
Assis
ta
nce
E.
Sp
ecia
lized
Activ
itie
s
F.
Rep
orts
IND
IRE
CT
OP
ER
AT
ION
S
A. T
rain
ing
B. L
eave
C.
Meeti
ngs a
nd
Mis
cell
an
eou
sD
, B
reak
s a
nd
Oth
er
Non
-Prod
ucti
ve T
ime
TO
TA
L S
TA
FF
MO
NT
HS
UT
ILIZ
ED
TR
AV
EL
OP
fiR
AT
ION
SU
TIL
IZA
TIO
N O
F D
IRE
CT
OP
ER
AT
ION
S S
TA
FF
MO
NT
HS
FO
R 1
980
CO
MP
AR
ED
WIT
H P
RIO
R F
ISC
AL
YE
AR
AN
D N
EX
T F
ISC
AL
YE
AR
BU
DG
ET
MA
NP
OW
ER
UT
ILIZ
ED
STA
FF
HO
NT
HS
PR
IOR
FY 9.2
5.1
3.1
0.6
0.3
1.1
0.8
0.0
3.3
0.8
0.1
0.4
2.0
0.0
0.0
3.1
0.4
1.6
0.1
12.1
CU
RR
EN
TFY 9.1
4.9
3.5
0.6
0.2
0.6
0.8
0.2
3^
1_
0.8
0.1
0.4
1.8
0.0
0.1
4.2
0.7
2.2
0.1
1._
2
13
.2
NE
XT
FX
10.3
5.3
3.5
0.7
0.3
0.8
0.9
0.5
3.6
0.9
0.1
0.4
2.2
0.0
0.0
3.7
0.5
2.0
0.1
1.1
14
.0
PR
IOR
FY
ST
AF
FM
ON
THS
-0.1
-0.2
+0.4
0.0
-0.1
-0.5
0.0
+0
.2
-0
.2
0.0
0.0
0.0
-0.2
0.0
+0.1
+1.1
+0.3
+0.6
0.0
+0
.2
•t-1
.0
%V
AR
IAN
CE
-1.1
%
-3.9
+1
2.9
0.0
-33.3
-45.5
0.0
<+
10
0.0
-6.1
0.0
0.0
0.0
-10.0
0.0
<+
10
0.0
+3
5.5
+7
5.0
+3
7.5
0.0
+2
0.0
+8
.1%
NiS
XT
FX
ST
AF
FM
ON
THS
-1
.2
-0.4
0.0
-0
.1
-0.1
-0.2
-0.1
-0
.3
-0
.5
-0.1 0.0
0.0
-0
.4
.
0.0
+0.1
+0.5
+0
.2+
0.2
0.0
+O
.J.
-0.7
(BU
DG
ET
)
%V
AR
IAN
CE
-11.7
%
7.5
0.0
-14.3
-33.3
-25.0
-11.1
-60.0
-13.9
-11.1 0.0
0.0
-18.2
0.0
<+
10
0.0
+1
3.5
+4
0.0
+1
0.0
0.0
•i-
9.1
-5.M
PE
RC
EN
T O
F T
OT
AL
PR
IOR
FY
74. sa
41
.5
25
.24.9
2.4
9.0
6^
5
0.0
26
.8
6.5
0.8
3.2
16
.3
0..0
u.o
25
.2
3.3
13.0
0.8
8.1
10
0.O
t
CU
RR
EN
T N
EX
TF
Y F
Y
68.4
%
36.8
26.3
4.5
1.5
4.5
6.0
1.5
23.3
6.0
0.8
3.0
13
.5
0.0
0.8
31.6
5.3
16
.50.8
8.0
10
0.0
%
73.3
%
37.5
25
.0.
5.0
1.7
5.8
6.7
3.3
25
.8
6.7
0.8
2.5
15.8
0.0
0.0
26.7
3.3
14.2
0.8
8.A
10
0.0
»
E-1 r a 03 ^ » > i-3 M 0 z 2; 0 >
&.
f r" a 03 h3 i-3 M Q 2; §

M f r a en t-3 i
TR
AV
EL
OP
ER
AT
ION
S
MO
NT
HL
Y P
RO
DU
CT
IVIT
Y R
EP
OR
T (
EX
CE
RP
T)
DIV
ISIO
N O
F F
INA
NC
E, O
FM
, O
MA
FIS
CA
L Y
EA
R 1
97
9 T
HR
OU
GH
JU
NE
1979
AV
ER
AG
E S
TA
FF
MO
NT
HY
EA
R T
O D
AT
E
I 1&.
00 I
Cu
rren
t F
YP
rio
r F
Y
Va
ria
nce
Cu
rren
t F
YN
ext
FY
(B
ud
get)
Va
ria
nce
AV
ER
AG
E W
OR
KL
OA
DY
EA
R T
O D
AT
EP
RO
DU
CT
IVIT
YA
IL^
D
13
.31
2.3
108.1
%
13.3
14.0
95
.0%
3,8
43
3,2
63
11
7.8
%
3,8
43
3,8
48 99
.9%
289
265
109.
289
275
105.
1% 1%
§ § M t-> f a en >-3 i Q 2! § (J1

•i^ w
MO
NT
HL
Y P
RO
DU
CT
IVIT
Y I
ND
ICE
S R
EP
OR
TT
RA
VE
L O
PE
RA
TIO
NS
FIS
CA
L Y
EA
R 1
979
TH
RO
UG
H J
UN
E 1
979
200
195
190
185
18C
175
17G
165
16C
155
150
145
140
135
130
125
12C
us
nc
105
10C 95 9C 8;
8C 7;
70 65 6C 55 5fl
>E
RC
EN
TA
GE
VA
RIA
NC
E F
RO
M P
RIO
R Y
EA
R-
^1 I OC
T
<a NO
VD
EC
Sl
hs.
h
.+
"'
,.•
'
JAN
*s ^ >%: f
,<?
>•
•'
SBM
AB
"ml
>"s
,
AP
E
'"i rtA
K

JOINT FINANCIAL MANAGEMENTIMPROVEMENT PROGRAM
SUITE 705666 ELEVENTH STREET NW.WASHINGTON, D.C. 20001
POSTAGE AND FEES PAID
U. S. GENERAL ACCOUNTING OFFICE
OFFICIAL BUSINESSPENALTY FOR PRIVATE USE t300
Third Class