Measuring Multidimensional Preferences in Non-consumer Choice: Results of a Conjoint Analysis with...
17
Measuring Multidimensional Preferences in Non-consumer Choice: Results of a Conjoint Analysis with Farmers Christian D. Schade, Wei-Shiun Chang, Christine Lauritzen The Institute for Entrepreneurial Studies and Innovation Management Humboldt-Universität zu Berlin Ravello (Italy): June 18 - 21, 2013 1
description
Measuring Multidimensional Preferences in Non-consumer Choice: Results of a Conjoint Analysis with Farmers. Christian D. Schade, Wei-Shiun Chang, Christine Lauritzen T he Institute for Entrepreneurial Studies and Innovation Management Humboldt-Universität zu Berlin - PowerPoint PPT Presentation
Transcript of Measuring Multidimensional Preferences in Non-consumer Choice: Results of a Conjoint Analysis with...

1
Measuring Multidimensional Preferences in Non-consumer Choice: Results of a Conjoint
Analysis with Farmers
Christian D. Schade, Wei-Shiun Chang, Christine LauritzenThe Institute for Entrepreneurial Studies and Innovation Management
Humboldt-Universität zu Berlin
Ravello (Italy): June 18 - 21, 2013
2
Outline
• Introductiono Motivation
• Theoretical backgroundo Previous Literatureo Methodology
• Experiment Design
• Findingso Preferences of farmerso Cluster analysis on farmers’
preferenceso Prediction of cluster
memberships
• Conclusion and Limitations
3
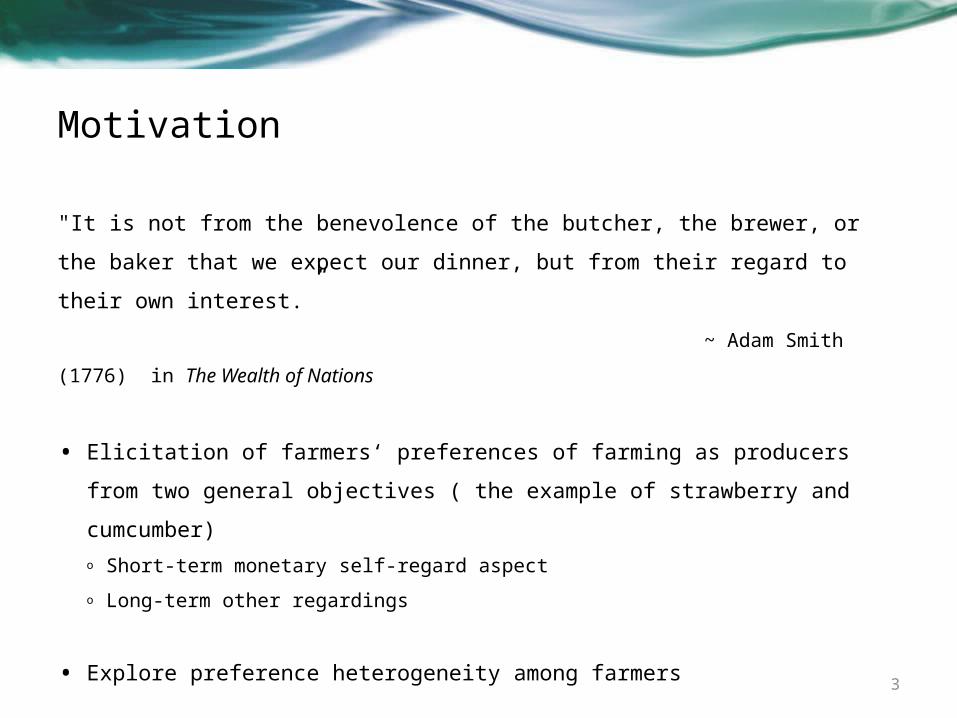
Motivation
"It is not from the benevolence of the butcher, the brewer, or the baker that we expect our dinner, but from their regard to their own interest.” ~ Adam Smith (1776) in The Wealth of
Nations
• Elicitation of farmers‘ preferences of farming as producers from two general objectives ( the example of strawberry and cumcumber)o Short-term monetary self-regard aspecto Long-term other regardings
• Explore preference heterogeneity among farmers

4
Previous Literature
• Measuring individual preferenceso Behavioral economics: Güth, 1982; Bolton and Ockenfels,
2000; Kahneman et al, 1986; Rabin, 1993; Fehr and Schmidt, 1999
o Consumer research (marketing): Green & Rao, 1971; Green, P. E., Srinivasan, 1978; 1990.
o Psychological and sociological literature: Austin et al. 1996; Beus and Dunlap, 1990; Petzelka et al., 1996; Maybery et al, 2005
o Environmental research: Alriksson and Öberg, 2008; Columbo et al., 2006; Maybery et al, 2005

5
Methodology
• Conjoint analysis with rank orders (Green &Srinivasan, 1978; Fishbein and Aizen, 1975)o Select important attributes with plausible levelso Generate scenarios with a bundle of potential attributes (reduced set, full
profile)o Each individual holds a set of utility weights for attribute levels, and the
individual assesses the overall utility for each scenario. o Conjoint analysis then calculates the individuals’ part worth utilities of the
attributes from the preference ordering of stimuli.
Where represents the importance (part worth utility) of the attribute i, and represents the desirability of level j of attribute i

6
Overview of attributes and corresponding levels• Net Income
- €20,000 - €60,000
• Income Volatility - Income ~UU(NI-10% , NI+10%)- Income ~UU(NI-30% , NI+30%)
• Degree of external effects of the farm onto the ecosystem - low concern of the farmer- high concern of the farmer
• Maintaining the fertility of the land - low concern of the farmer- high concern of the farmer
16 (2 x 2 x 2 x 2) possibilities. We use 8 sets based on orthogonal design.

7
8 Scenarios of farming situations to rank
1 being the most preferred, 8 the least
• A: I60,000, V10, EH, FL
• B: I20,000, V30, EH, FL
• C: I20,000, V10, EL, FL
• D: I20,000, V30, EL, FH
• E: I20,000, V10, EH, FH
• F: I60,000, V30, EH, FH
• G: I60,000, V30, EL, FL
• H: I60,000, V10, EL, FH
I: net income; V: volatility; E: negative externality; F: Fertility

8
Experimental Design
Participants went through 4 steps in the experiment
• Holt and Laury Lottery ( to measure risk propensity)
• Description of Attributes leading to different agricultural situations
• Subjects were asked to rank 8 different screnarios
• Questionnaire: (demographics, training/ experinecne for farming, farming history in family (students), farming related questions for farmers (farm size, years of possesssing, etc.)

9
Data
• 14 Students recruited from HU Agricultural Department, Sessions run in
Humboldt Decision Sciences Laboratory (HUDSciLab), November 2012
• 19 Farmers from Uelzen, Germany, Session run with 20-station mobile lab
in Uelzen, December 2012
• 35 Students from Georg August Universität, sessions run with mobile lab in Göttingen, January 2013

10
General statistics of participants Student Farmer Pooled
Age 24.06 (3.886) 30.68 (7.853) 25.91 (6.029)
Female ratio 0.286 0.156 0.250
Parents in farming 0.592 (0.497)
Farming as career 0.939 (0.242)
Organic-favored 0.305
Farm ownership ratio 0.842
Years of possession (farm) 5.684 (7.111)
# of employee 4.579 (2.341)
Farm size (hectares) 272.6 (220.0)
Risk aversion (turning
point)
6.182 (1.646)a 6.000 (1.732) 6.140 (1.652)
# of obs 49 19 68
Parentheses are standard deviation. a: sample size=44 for students, 13 for farmers, 57 for
pooled

11
Average ranking of situationSituation Description Ave. ranking Std. dev.
A I60,000, V10, EH, FL 3.176 (1.050)
B I20,000, V30, EH, FL 6.750 (1.164)
C I20,000, V10, EL, FL 7.265 (0.971)
D I20,000, V30, EL, FH 5.750 (1.250)
E I20,000, V10, EH, FH 1.676 (1.112)
F I60,000, V30, EH, FH 4.117 (1.399)
G I60,000, V30, EL, FL 5.162 (1.532)
H I60,000, V10, EL, FH 2.103 (1.161)
I: net income; V: volatility; E: negative externality; F: Fertility
作者
E, H, A 用同樣的顏色 加匡起來 從 situation 到ave. ranking. B, C, D用另一個顏色框起來然後用動畫,EHA的框先出來, 然後BCD的框再出來

12
Data analyses
• Conjoint analysis to analyze relative importance of attributes
• Cluster analysis to analyze preference heterogeneity among farmers
• Probit regressions to predict cluster memberships Y
o Dependent variables • Cluster 1 vs other clusters (Y=1 if cluster 1, otherwise =0)• Cluster 2 vs other clusters (Y=1 if cluster 2, otherwise =0)• Cluster 3 vs other clusters (Y=1 if cluster 3, otherwise =0)
o Independent variables • For students: age, gender, risk propensity, career plan (to be a
farmer), parents in agri-business, farm type inclination (organic vs conventional farm)
• For farmers: age, gender, risk propensity, ownership, years of possession, # of employee in farm, farm size

13
Findings 1 (conjoint analysis): Fertility is most important factor, followed by volatility, income and externality.
Part-worth utilities for all subjects
Attribute Ave. relative importance (%) Levels Utility
(part-worth)
Students (49) Farmers (19) Pooled
Income 26.292 22.563 25.25060000E .860
20000E -.860
Volatility 27.670 26.814 27.43130% -.945
10% .945
Externality 16.616 16.275 16.520Low -.570
High .570
Fertility 29.422 34.348 30.798Low -1.088
High 1.088
作者
加個框在從Fertility 然後後面三格Fertility 29.422 34.348 30.798 畫個框
作者
60000 E, 0.860 這裡加框圈起來下面,10% 0.945, High 0.570 跟 High 1.088 也是這些先出來, 然後再出來 Fertility 那個框

14
Finding 2 (Custer analysis): 3 clusters are identified; cluster 1 weighs heavily on externality, cluster 2 focuses on financial incentives, cluster 3 on fertility.
Cluster ANOVA
1 2 3 F Sig.
Income 12.50 32.05 13.96 65.929 .000
Volatility 18.75 32.79 18.01 23.519 .000
Externality 44.35 11.07 18.72 48.349 .000
Fertility 24.40 24.08 49.32 61.797 .000
# of farmers (% of
farmers)
1 (5.3%) 12
(63.2%)
6 (31.6%)
# of Agri Students (% of
st)
6
(12.2%)
31
(63.3%)
12 (24.5%)
Farmer ratio in cluster 14.3% 27.9% 33.3%
*: parentheses are numbers for student and farmer respectively.
作者
externality 跟44.35 加個框
作者
Fertility 跟49.32 加框,兩個框同時出來。(就是跳過中間兩個數字)
作者
Income and Volatility 框起來 然後 32..05 跟32.79框起來,一起出來
作者
先框中間這兩個12(63.2%),and 31(63.3%)然後框 右邊這兩個6() 跟 12 () 然後框 第一行1() 跟6 ()這些皆在上面那三個註解的框後面分批出來

15
Finding 3 (probit regression):
Only farm type inclination is significant to predict cluster membership in cluster 1 for students (Coefficients are 1.38 and 1.35 with P values of 0.022 and 0.029 in the models without or with risk propensity respectively).
16
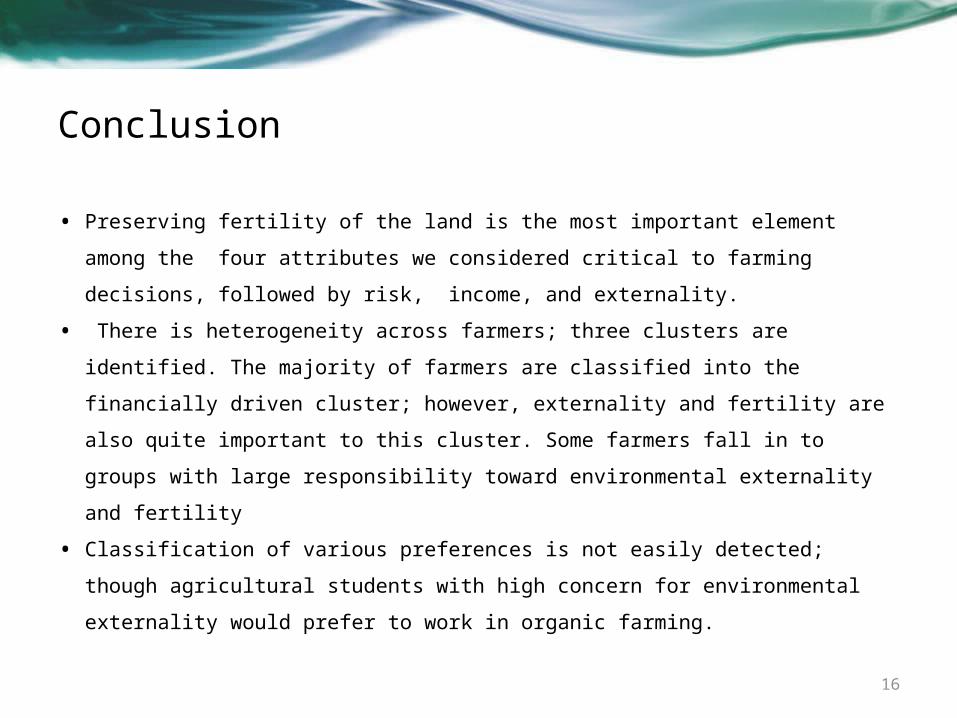
Conclusion
• Preserving fertility of the land is the most important element among the four attributes we considered critical to farming decisions, followed by risk, income, and externality.
• There is heterogeneity across farmers; three clusters are identified. The majority of farmers are classified into the financially driven cluster; however, externality and fertility are also quite important to this cluster. Some farmers fall in to groups with large responsibility toward environmental externality and fertility
• Classification of various preferences is not easily detected; though agricultural students with high concern for environmental externality would prefer to work in organic farming.
17
Limitations
• The findings are exclusively associated with German farming preferences for two reasons:o We ran the experiment with German farmers/agri students, the
preferences on financial incentives and environmental concerns are subject to this specific role and region.
o The findings are exclusively associated with the specific parameters (levels) of attributes to reflect German agricultural business.