MEASURING MAIN ACTIVITY IN LABOUR FORCE SURVEYS · 2019-02-04 · INTERNATIONAL LABOUR ORGANIZATION...
42
7 25 25 2 STATISTICAL METHODOLOGY SERIES STATISTICS Department of Statistics 7 MEASURING MAIN ACTIVITY IN LABOUR FORCE SURVEYS: Main findings from the ILO LFS pilot studies Elisa M. Benes, Kieran Walsh July 2018
Transcript of MEASURING MAIN ACTIVITY IN LABOUR FORCE SURVEYS · 2019-02-04 · INTERNATIONAL LABOUR ORGANIZATION...

725252
StatiStical methodology SerieS
STATISTICSDepartmentof Statistics
7MEASURING MAIN ACTIVITY IN LABOUR FORCE SURVEYS:
Main findings from the ILO LFS pilot studies
Elisa M. Benes, Kieran Walsh
July 2018

INTERNATIONAL LABOUR ORGANIZATION
Measuring Main Activity in
Labour Force Surveys:
Main findings from the ILO LFS pilot
studies1
ILO Department of Statistics –Geneva, Switzerland
1 This document is being reproduced without formal editing.

Copyright © International Labour Organization 2018 First published 2018 Publications of the International Labour Office enjoy copyright under Protocol 2 of the Universal Copyright Convention. Nevertheless, short excerpts from them may be reproduced without authorization, on condition that the source is indicated. For rights of reproduction or translation, application should be made to ILO Publications (Rights and Licensing), International Labour Office, CH-1211 Geneva 22, Switzerland, or by email: [email protected]. The International Labour Office welcomes such applications.
Libraries, institutions and other users registered with a reproduction rights organization may make copies in accordance with the licences issued to them for this purpose. Visit www.ifrro.org to find the reproduction rights organization in your country. Measuring main activity in labour force surveys: Main findings from the ILO LFS pilot studies ISBN: 978-92-2-131691-6 (print) 978-92-2-131692-3 (web pdf) The designations employed in ILO publications, which are in conformity with United Nations practice, and the presentation of material therein do not imply the expression of any opinion whatsoever on the part of the International Labour Office concerning the legal status of any country, area or territory or of its authorities, or concerning the delimitation of its frontiers.
The responsibility for opinions expressed in signed articles, studies and other contributions rests solely with their authors, and publication does not constitute an endorsement by the International Labour Office of the opinions expressed in them.
Reference to names of firms and commercial products and processes does not imply their endorsement by the International Labour Office, and any failure to mention a particular firm, commercial product or process is not a sign of disapproval.
Information on ILO publications and digital products can be found at: www.ilo.org/publns.
Printed in Switzerland

Measuring Main Activity in Labour Force Surveys: Main findings from the ILO LFS pilot studies 3
TABLE OF CONTENTS
I. Background ................................................................................................................................... 7
A. Latest international statistical standards...................................................................................... 7
II. Methodology .................................................................................................................................. 9
A. Testing strategy ........................................................................................................................... 9
B. Main activity approaches tested .................................................................................................. 9
III. Questions on Main activity – main findings ............................................................................. 12
A. Cognitive testing phase ............................................................................................................. 12
B. ‘All’ activities at present (field testing phase – version B only) ............................................... 19
C. Main activity ............................................................................................................................. 24
D. Concordance between all activities and Labour Force Status ................................................... 30
E. Concordance between current main activity and main activity in the last 12 months .............. 33
IV. Identified conclusions and recommendations ........................................................................... 35
V. References .................................................................................................................................... 37
VI. Supplementary tables ................................................................................................................. 38

Measuring Main Activity in Labour Force Surveys: Main findings from the ILO LFS pilot studies 4
LIST OF FIGURES
Figure 1. Different approaches to capturing Main Activity in the pilot questionnaires ....................... 10
Figure 2. Questions on Main activity included in the cognitive tests .................................................. 13
Figure 3. Questions on Main activity included in the field tests .......................................................... 18
Figure 4. Average number of activities reported by respondents, by country and model .................... 21
Figure 5. Difference in average of number of activities, Male minus Female, by country and model 21
Figure 6. Difference in average of number of activities, Urban minus Rural, by country and model 22
Figure 7. Difference in average of number of activities, proxy minus self-reporting, by country and
model .................................................................................................................................................... 22
Figure 8. Main activity, min, max and mean, across countries and models (% of WAP) .................. 25
Figure 9. Main activity of respondents by model, Ecuador (% of WAP) ........................................... 26
Figure 10. Percentage of respondents who report farming or fishing to produce foodstuff for the
family as one activity and as main activity by country and model ....................................................... 27
Figure 11. Percentage of respondents who report working to generate an income as one activity and
as main activity by country and model ................................................................................................. 27
Figure 12. Main activity, percentage point difference, Males minus Females by country and model . 28
Figure 13. Main activity distribuition, percentage point difference, Urban – Rural by country and
model .................................................................................................................................................... 29
Figure 14. Main activity by country and age group ............................................................................ 30
Figure 15. Percentage of respondents who reported working to generate an income and had the labour
force status "employed", by country and model .................................................................................. 31
Figure 16. Percentage of Employed respondents reporting "working to generate income" as an
activity, by country and model .............................................................................................................. 32
Figure 17. Correspondance between current main activity and main activity in the last 12 months , by
country and model ................................................................................................................................ 33
Figure 18. Percentage of respondents reporting same main activity in last 12 months as at present,
Namibia, Model 1 ................................................................................................................................. 34
Measuring Main Activity in Labour Force Surveys: Main findings from the ILO LFS pilot studies 5
LIST OF TABLES
Table 1. Pilot countries by version of “Main activity” module tested ................................................. 11
Table 2. Number of activities reported by respondents, by country and model (% of WAP) .............. 20
Table 3. Activities reported by country and model (% of WAP) ......................................................... 23
Table 4. Main activity distribution by country and model (% of WAP). ............................................. 24
Table A1. Activities reported by country and model (% of WAP) - Males ......................................... 38
Table A2. Activities reported by country and model (% of WAP) - Females ..................................... 39
Table A3. Main activity by country and model (% of WAP) - Males ................................................. 40
Table A4. Main activity by country and model (% of WAP) - Females .............................................. 41
Measuring Main Activity in Labour Force Surveys: Main findings from the ILO LFS pilot studies 6
ACKNOWLEDGEMENT _______________
The completion of the pilot studies and the preparation of the publications has been supported
by many colleagues both within and outside the ILO.
Numerous staff in each of the 10 pilot study countries provided technical expertise and
logistical support over a period of years to ensure the studies proceeded as planned. The authors would
like to express their gratitude for the dedication and expertise they offered at all stages of the process.
In addition to the in-kind contribution of staff time and expertise, the National Statistical Offices of
Namibia, Peru and Vietnam provided financial support for some or all of the field activities in those
countries.
The Pilot Study Programme was organised with the technical leadership of ILO Department of
Statistics supported by the ILO’s network of regional statisticians including: Africa: Yacouba Diallo,
Coffi Agossou and Honoré Djerma; Asia Pacific: Tite Habiyakare; Latin America and the Caribbean:
David Glejberman. In the case of the pilot study in Kyrgyzstan, additional technical support was
provided by Vladimir Ganta and Igor Chernyshev.
Within the ILO Department of Statistics, a small dedicated team of professional staff and interns
were responsible for processing and analysing the pilot study data and providing ongoing support for
documentation, planning and implementation of the studies. The authors would like to acknowledge the
contributions of Molka Abassi, Estefania Alaminos Aguilera, Anna Belianska, Umberto Cattaneo,
Francisco Guerreiro, Jacob Inganas, Carlos de Porres Ortiz de Urbina and Alina Rodríguez de Vuille,
all of whom were involved in different phases of the work. Many thanks are also due to Yves Perardel,
who provided substantial technical support during the implementation phase of the studies.
Logistical support was provided by a number of colleagues within the Management Support
Unit of ILO Department of Statistics including Ritash Sarna, Catherine Jensen, Michelle de Chaumont,
Agnes Kalinga and Virginie Woest.
Funding for the pilot studies and related activities was provided by ILO, Data2x and African
Development Bank.
Without the support, expertise and commitment of all those listed above this work would not
have been possible.

Measuring Main Activity in Labour Force Surveys: Main findings from the ILO LFS pilot studies 7
I. BACKGROUND _______________
1. The international recommendations on the measurement of people’s economic activities and the
production of related indicators including the employment to population ratio, labour force
participation rate and unemployment rate were updated at the 19th International Conference of
Labour Statisticians (ICLS) in 2013. The updated standards introduced a number of important
updates that will impact the way work and labour force statistics are collected and disseminated by
countries around the world in the years to come. To support their wide implementation, the 19th
ICLS called on the ILO to “conduct further conceptual and methodological work including testing”
and develop “technical manuals and model data collection instruments” aligned with the latest
standards (ILO, 2013).
2. As follow-up, between 2015 and 2017, the ILO implemented a global project of labour force survey
(LFS) pilot studies in collaboration with 10 countries from different world regions. The Project had
as main aim to develop and test alternative survey questionnaires to collect statistics on high priority
topics including employment, labour underutilization – comprising time-related underemployment,
unemployment and the potential labour force, and own-use production work, in line with the 19th
ICLS standards. The ultimate objective is to develop evidence-based guidance to support countries
in adopting the new standards. Related to these ‘core’ topics there were a selection of additional
measurement objectives on topics which may be measured through Labour Force Surveys.
3. This report presents the main findings on the measurement of main activity drawn from the Project.
The report is part of the ILO statistical methodology series that describe in detail the main findings
of the Project. The full series is available in the website of the ILO Department of Statistics. (ILO,
2018)2.
4. Section I provides a short overview of the background to the pilot studies on the topic of main
activity and the context of its inclusion in LFS questionnaires. Section II discusses the main issues
with the measurement of main activity explored through the ILO LFS pilot studies, the questions
tested and the analytical approach taken. The main findings are described in Section III. This is
followed by a summary of the identified good practices and practical recommendations that can be
made on the basis of the findings (Section IV). The final section (V) discusses some of the issues
for which further testing or evaluation is recommended.
A. Latest international statistical standards 5. Resolution I concerning statistics of work, employment and labour underutilization adopted by the
19th ICLS, updated the previous standards from 1982 that had played a critical role as reference for
the development of national systems of labour force statistics, and the design of labour force surveys
(ILO, 1982). The new standards have greatly expanded the scope of labour statistics by recognizing
the need to produce statistics on different forms of work, paid and unpaid, on a regular basis. They
also introduced a number of important changes to labour force statistics that includes a narrower
definition of employment as “work for pay or profit” and a set of measures of labour
2 http://www.ilo.org/stat/Areasofwork/Standards/lfs/WCMS_484981/lang--en/index.htm

Measuring Main Activity in Labour Force Surveys: Main findings from the ILO LFS pilot studies 8
underutilization to complement the unemployment rate. The standards are described in more depth
in a separate report in this series covering the background, objectives and methodology of the pilot
studies.
6. The labour force status classification outlined in the standards is not based on a person’s main
activity. Rather it aims to classify the working age population based on their relationship with the
labour market. To achieve this the labour force status classification operates through a priority rule
whereby a person with any employment activity (at least one hour in a short reference period) is
considered employed, while only those not employed can be considered unemployed or outside the
labour force. This combination of the priority rule and one hour criterion is critical for various
purposes, including ensuring that all types of jobs are covered, and ensuring that indicators on
labour underutilization (e.g. unemployment) only refer to those not engaged in any work for pay or
profit. As a consequence it will be the case that for some respondents their labour force status may
not reflect their main activity, such as a full-time student with a part-time job etc. As the primary
focus of dissemination is typically on the labour force status of individuals, the main activity is not
typically highlighted although some countries have been collecting and using this data for some
time.3
7. Reflecting the above, the concept of a person’s “main activity” is not a core part of the new
standards. However, there are some references to the possible use of a classification of main activity
as a supplement to indicators on employment, labour underutilization and participation in different
forms of work. The standards refer to the possible value of classification by ‘main form or work’
(para 17) or ‘main activity status as self-declared’ (para 80c). However, no detailed guidance is
provided on capturing or reporting this information, or how it might relate to information captured
on employment, unemployment etc. The inclusion of main activity as a topic in the pilot study
questionnaires was intended to serve multiple purposes including:
a. Development of guidance for collection of main activity through labour force surveys
b. Assessing and highlighting the relevance of a classification of the population by main
activity to inform social policy and to better understand the economic characteristics of the
population
c. Contribute to international efforts to develop standards covering main activity
measurement
3 See for example Table QLF23 at
http://www.cso.ie/px/pxeirestat/Database/eirestat/Labour%20Force%20Survey%20Quarterly%20Series/Labour%20Force%
20Survey%20Quarterly%20Series_statbank.asp?SP=Labour%20Force%20Survey%20Quarterly%20Series&Planguage=0

Measuring Main Activity in Labour Force Surveys: Main findings from the ILO LFS pilot studies 9
II. METHODOLOGY _______________
A. Testing strategy 8. The broader measurement objectives of the pilot studies and high level methodology are described
in a separate report in this series entitled ILO LFS pilot studies in follow-up to the 19th ICLS:
Background, objectives and methodology. Separate reports have also been published on the
cognitive and field testing phases of the project.
9. There are a number of issues of interest with respect to measurement of main activity. With
reference to the 19th ICLS an important issue is whether an approach which captures a person’s
main activity as part of a sequence of questions on employment can yield comparable information
to other approaches. Such ‘main activity’ based approaches have been adopted in questionnaires
used in certain regions of the world for Census of Population and other household surveys to capture
information on employment. For example, a review of country practices undertaken in preparation
for the19th ICLS, showed that 54 out of 140 countries collected information on main activity
through their Census of Population4, although not necessarily as a replacement for measurement of
current working activity. With the new standards in mind there is an absence of information on
whether such designs can yield comparable estimates to more ‘traditional’ LFS approaches.
10. In addition, main activity is an interesting analytical topic in its own right so there is interest in
testing different approaches to capturing this information even where not used to identify the labour
force status of the individual, or indeed using it as a supplement to labour force status information.
In this context, there is interest in assessing whether the inclusion of questions on main activity in
a sequence where labour force status is also captured impacts the measurement of the labour force
status, or main activity, or both.
11. Given the above issues the specific objective of the pilot tests in relation to main activity was to
develop and test alternative approaches to capturing this information within typical labour force
survey designs. It was decided to assess the questions on main activity during the cognitive
interviewing (CI) phase of the work to allow a detailed qualitative assessment of the questions. The
adapted questionnaires were then tested quantitatively during the field testing phase. The more
detailed objectives are discussed further below.
B. Main activity approaches tested 12. There were two major alternative approaches to capturing main activity incorporated within the
pilot studies (see Figure 1 below). The first approach (Version A) used a single question on main
activity as the starting point of the sequence to capture labour force status. Version A was
incorporated in model questionnaire 2 (M2), whereby the first question in the individual
questionnaire asked the respondent to report their main current activity. Depending on the answer
received the person could be treated as employed, or asked other recovery questions to capture
secondary employment activity. One rationale for this approach is that asking a general question at
the beginning ensures the questionnaire is relevant to all respondents from the outset. By contrast
traditional labour force survey questionnaires can ask a long set of questions on labour market
4 See http:/www.ilo.ch/wcmsp5/groups/public/---dgreports/---stat/documents/meetingdocument/wcms_222950.pdf

Measuring Main Activity in Labour Force Surveys: Main findings from the ILO LFS pilot studies 10
engagement which may be of no relevance to certain respondents (e.g. retired persons) and thus
introduce respondent fatigue.
13. In the other 4 model questionnaires Version B (an independent module of questions on main
activity) was included after questions had been asked covering employment, unemployment and
labour underutilization.
14. These two versions created different analytical possibilities. In the first instance it could be assessed
if the approaches impacted the measurement of main activity itself. Beyond that it could be assessed
if the differences between the versions appeared to impact the measurement of other phenomenon
captured through the questionnaires, such as employment, unemployment etc.
Figure 1: Different approaches to capturing Main Activity in the pilot questionnaires
Version A (Model Questionnaire 2) Version B (Model Questionnaires 1, 3, 4 and
5)
Not
employed
Employed
No
Yes
Any
other
main
activity
Mainly
for own-
use
Mainly
for sale
Working
(farming/fishing)
Working (non
farming/fishing)
Main activity
(single question)
Employed
Employment related
questions
Characteristics
of jobs
Main
intended
destination of
production
Any work for
pay/profit?
Not
Employed
Job search
and
availability (to
identify
unemployed
etc)
Main activity
(3 questions)

Measuring Main Activity in Labour Force Surveys: Main findings from the ILO LFS pilot studies 11
15. Model questionnaire 2 was tested in 3 of the pilot countries while all countries tested at least one
of the other 4 model questionnaires (see Table 1).
Table 1. Pilot countries by version of “Main activity” module tested
Country Version A Version B
Cameroon — M1 and M5
Ecuador — M3 and M5
Ivory Coast — M1 and M3
Kyrgyz Republic M2 M3
Moldova — M3 and M5
Namibia — M1 and M4
Peru — M3 and M4
Philippines M2 M3
Tunisia M2 M3
Vietnam M3 and M4
16. While the overall approaches were retained, substantial changes were made to the versions tested
following the CI tests. For that reason, the next sections of the report present the outcomes of the
CI tests, followed by the outcomes from the field tests.

Measuring Main Activity in Labour Force Surveys: Main findings from the ILO LFS pilot studies 12
III. QUESTIONS ON MAIN ACTIVITY – MAIN
FINDINGS _______________
A. Cognitive testing phase 17. During the first stage of the pilot studies, CI was used to evaluate questions on main activity. In
particular there was an assessment of respondent’s comprehension of the term ‘main activity’ and
whether this interpretation was consistent across countries, cultures and languages. Another key
issue assessed during the cognitive tests was the manner of administration of the question, i.e.
whether or not response categories needed to be read to the respondent. A further issue evaluated
was how respondents decided on their response, especially where people were engaged in multiple
different activities.
18. As shown in Figure 1 above there were two versions of the main activity questions. However, in
addition, during the cognitive testing phase two different variants of Version B were tested (see
Figure 2).
19. For Version A the cognitive test focussed on the single main activity question at the beginning of
the individual questionnaire. An important feature of the version tested at the cognitive phase was
that response categories were not read out. The question wording used in English was ‘What is your
main activity at present?’. One of the issues being assessed through this approach was the range of
valid response options for a question of this nature. This could be assessed based on the range of
the open ended responses received from the respondents. A wide range of coding categories (16),
more than normally used for household surveys, was initially developed to ensure the results could
be detailed enough to assess how many and which subset of categories would be sufficient.
20. For Version B, both variants had 3 questions in total and adopted the same structure (i.e. flow and
positioning within the questionnaire). The first question (QB1) covered the reference period at
present, i.e. as done with the single question in Version A. The next 2 questions focussed on the
reference period the last 12 months, first asking the respondent if the main activity over the last 12
months was different to at present (QB2), and if so, what was the main activity in the last 12 months
(QB3). The use of two different reference periods was designed to allow an assessment of any
differences in the relative difficulty of comprehension and reporting between at present and the last
12 months.
21. The difference between the two variants of Version B related to the mode of asking the questions.
For variant 1 (included in M4 and M5) the interviewer read out the response categories, whereas
for variant 2 (included in M1 and M3) a spontaneous subjective response was sought from the
respondent and subsequently coded by the interviewer. The rationale for this distinction was to
establish if reading out response categories was necessary to facilitate comprehension and reporting
for the respondent.

Measuring Main Activity in Labour Force Surveys: Main findings from the ILO LFS pilot studies 13
Figure 2: Questions on Main activity included in the cognitive tests
Version A (Model Questionnaire 2) Version B – Variant 1 (Model Questionnaires 4, 5) Version B – Variant 2 (Model Questionnaires 1, 3)
QA1. What is your main activity at present? (Do not read out list below)
Work for pay or profit
01. PAID EMPLOYEE
02. PAID APPRENTICE
03. EMPLOYER (WITH REGULAR EMPLOYEES)
04. OWN ACCOUNT WORKER (WITHOUT
REGULAR EMPLOYEES)
Work without pay
05. FARMING, FISHING MAINLY FOR SALE
06. FARMING, FISHING MAINLY FOR FAMILY
USE
07. HELPING IN A HOUSEHOLD/FAMILY
BUSINESS
08. HELPING A HOUSEHOLD/FAMILY MEMBER
WHO WORKS FOR SOMEONE ELSE
09. VOLUNTARY WORK/COMMUNITY WORK
Other activities
10. STUDENT
11. HOUSEHOLD DUTIES
12. HELPING FAMILY WITH HOUSEHOLD
DUTIES
13. SELF-CARE (DUE TO DISABILITY, INJURY,
ILLNESS)
14. CULTURAL/SPORTS/OTHER
RECREATIONAL ACTIVITIES
15. RETIRED, PENSIONER
16. NONE/DOES NOT DO ANYTHING
QB1. Which of the following best describes your main activity or
situation at present?
(Read out list below)
01. Working for pay or profit
02. Looking for work
03. Unemployed
04. Studying, training
05. Household, family responsibilities
06. Farming or fishing mainly for family consumption
07. Long-term illness, injury, disability
08. Retired, pensioner
09. Other (specify)
_____________________________________________________
QB2 …and thinking about your main activity or situation in the last
12 months, would you say it was the same or different?
01. SAME AS AT PRESENT→ SKIP QB3
02. DIFFERENT → QB3
_____________________________________________________
QB3. Which of the following best describes your main activity or
situation in the last 12 months?
(Read out list below)
01. Working for pay or profit
02. Looking for work
03. Unemployed
04. Studying, training
05. Household, family responsibilities
06. Farming or fishing mainly for family consumption
07. Long-term illness, injury, disability
08. Retired, pensioner
09. Other (specify)
QB1. How would you describe your main activity or situation at present?
(Do not read out list below)
01. WORKING FOR PAY OR PROFIT
02. LOOKING FOR WORK
03. UNEMPLOYED
04. STUDYING, TRAINING
05. HOUSEHOLD, FAMILY RESPONSIBILITIES
06. FARMING OR FISHING MAINLY FOR FAMILY
CONSUMPTION
07. LONG-TERM ILLNESS, INJURY, DISABILITY
08. RETIRED, PENSIONER
09. OTHER (SPECIFY)
______________________________________________________
QB2. …and thinking about your main activity or situation in the last 12
months, would you say it was the same or different?
01. SAME AS AT PRESENT→ SKIP QB3
02. DIFFERENT → QB3
______________________________________________________
QB3. How would you describe your main activity or situation in the last 12
months?
(Do not read out list below)
01. WORKING FOR PAY OR PROFIT
02. LOOKING FOR WORK
03. UNEMPLOYED
04. STUDYING, TRAINING
05. HOUSEHOLD, FAMILY RESPONSIBILITIES
06. FARMING OR FISHING MAINLY FOR FAMILY
CONSUMPTION
07. LONG-TERM ILLNESS, INJURY, DISABILITY
08. RETIRED, PENSIONER
09. OTHER (SPECIFY)

Measuring Main Activity in Labour Force Surveys: Main findings from the ILO LFS pilot studies 14
Main findings from CI
22. In combination the differences in the versions cognitively tested created the possibility to assess
whether there were any observed order effects (Version A versus Version B) or mode of
administration effects (Version B variant 1 versus Version A and Version B variant 2).
Issues specific to Version of the questions used
23. Starting with Version A, this was tested in 3 of the 10 pilot countries who used M2 (Kyrgyzstan,
Philippines, Tunisia). Multiple respondents across those countries were observed to have
difficulties with comprehension of the scope of the question. A first illustration of this is found
through the many reports of hesitation, confusion, requests for repetition and clarification, and
difficulties in answering. For example when probed about the difficulty of responding to the
question, one respondent in Philippines stated “it is a bit hard and you need to analyse so that you
will not be lost”.
24. In Tunisia, the comprehension difficulties resulted in some respondents listing multiple activities
(as opposed to one main activity) in response to the question, and others indicating that they were
doing nothing, but when probed then listing multiple activities they were currently engaged in. For
example one respondent asked for clarification of the question leading to the interviewer reading
out the response categories available. At that point the respondent said “I do nothing, I stay at the
house, I make bread, I keep chickens and sell the eggs”. When probed further the respondent said
“At the start I didn’t understand but it was easier when the list was read out”.
25. There was evidence that the degree of difficulty with the question was related to the situation of the
respondent. Respondents with regular employment generally answered the question confidently and
without hesitation. However their responses to probing suggested they may not have considered
their non-employment activities when formulating their response.
26. A related difficulty observed in Philippines was the respondent thinking that the question referred
to details of their work. More than one respondent who worked in farming responded by listing out
their main daily activities in farming. While this would not necessarily lead to misclassification of
the response it was indicative of the comprehension difficulties of some respondents and that some
activities were not being considered, even though they could potentially involve greater amounts of
time.
27. Another specific difficulty for those engaged in farming was that the information initially provided
was not sufficient to undertake the coding desired, whereby it was intended to split market oriented
farming (employment) from farming to produce goods for own use (own use production of goods).
Multiple respondents simply replied “Farming” which was insufficient thus requiring additional,
unscripted follow up questions in order to assign the proper response category.
28. For respondents who did not have regular employment/farming activities, e.g. students, those
looking for work, the comprehension difficulties appeared to be relatively greater. Another
respondent in Tunisia gave the response “Nothing” but when probed said “I’m in the process of
looking for work, but I don’t have work” and when asked what they thought the question referred
to they said “my job”. This was similar to the response received from other respondents in different
countries who reported that they felt the question was about their employment activities only.

Measuring Main Activity in Labour Force Surveys: Main findings from the ILO LFS pilot studies 15
29. For variant 2 of Version B (questions on main activity later in the sequence but response categories
not read out) similar comprehension and reporting difficulties were observed. For example, one
respondent in Philippines (M3) said ‘I came here to be interviewed and afterward will go to the
bank’, with similar types of responses received from others indicating a very short-term scope was
being considered. Other respondents considered relatively longer periods of time such as ‘the
months of this year’ suggesting that the period at present was not consistently understood, with
unclear impact on responses given.
30. In relation to the scope of activities being considered one respondent in Namibia, paused for a long
time when asked then question and then responded “I don’t know”. When subsequently probed
about the question he stated that he found the question difficult and had expected to be given options
to choose his response from. This, along with other examples of respondents giving responses out
of scope of those intended, highlight the difficulties respondents had in correctly interpreting the
question.
31. Further to this, as with Version A, different respondents understood the question to refer to their
paid working activities only. This was widespread among those in employment who often reported
their occupation, or specifically referred to the information already provided, e.g. a respondent in
Cote d’Ivoire remarked ‘It’s what I just said, I do knitting to sell’. However, as with Version A, this
difficulty was also observed among those not in employment with one young female in Namibia
saying that she thought the question referred to “work you do to support yourself, even though I am
still at school”. Despite being a full time student, this respondent had given her response as
unemployed as she felt the reference point was paid work.
32. Another issue of interest arising from analysis of Version A and variant 2 of Version B was whether
any order effect could be observed arising from the difference in order of the questions within the
questionnaire. In particular, it could be imagined that respondents for variant 2 of Version B may
have been even more likely to consider employment as the reference for the question given that
they would already have been asked a variety of questions about their employment or
unemployment. As already reported above there was evidence from both versions that respondents
with different profiles understood the question as referring to employment activities only. However,
respondents to variant 2 of Version B did directly reference the employment they had already
reporter earlier in the questionnaire when answering these questions, with some referring to the fact
they had already reported their main job, thus indicating they felt the question was repetitive. This
suggests that an order effect could exist and warranted further consideration in reviewing the
questionnaires in advance of the field tests.
33. In summary, the conclusions drawn from both Version A and variant 2 of Version B were that the
combination of the general question wording and lack of read out response categories created clear
comprehension and reporting difficulty for respondents. This added confusion and burden for
respondents and created risks of misclassifications. Additionally, and possibly related to difficulties
in understanding the scope of activities of interest, there was inconsistent understanding of the
period covered by the reference period at present, being sometimes understood as the immediate
present, the recent past or a longer period of months or potentially years. Whether employed or not
many respondents felt the question referred to their job or paid working activities which would
likely lead to under-reporting of non-employment activities such as looking for work or own-use
provision of services when the question is asked in this manner.
34. For variant 1 of Version B (response categories read out) there appeared in general to be lesser
difficulties, but some inconsistency in interpretation of the question remained. Respondents in

Measuring Main Activity in Labour Force Surveys: Main findings from the ILO LFS pilot studies 16
Vietnam reported a variety of difficulties related to the term main situation as used in the
Vietnamese translation. Some respondents reported considering their marital status or health
situation rather than their activities, and/or required the categories to be explained before arriving
at an answer. There was also some evidence that respondents gave priority to income generating
activity over other activities, regardless of the amounts of time involved. For example, when probed
a respondent to model 5 in Moldova stated that the main activity is that which “generates income
as one needs money to take care of family” even though the respondent also spent time caring for
their home and family. Notwithstanding these difficulties, variant 1 of Version B was observed to
present far less confusion and burden that variant 2 of version B for the countries who tested both.
Taking the case of Nambia the analysis concluded that a high likelihood of comprehension
difficulty existed in the case of variant 2 (response categories not read out) but that likelihood was
low for variant 1.
Issues of general relevance to the wording of the question(s)
35. Translation of the questions on main activity to different languages presented difficulties, regardless
of version tested. For example the words ‘main activity or situation’ were not easily translated in
all cases. In the case of Moldova the word situation could not be easily translated so a term more
closely translated to status was used. However the cognitive testing showed that ‘status’ was found
to be confusing for a number of respondents. For example one respondent considered this to refer
to their ‘status in society’ while another referred to ‘their status in the family, like head of
household’.
36. In cases in Latin America it was further observed that use of the term situation in the question,
when translated to Spanish, was interpreted as referring to sensitive topics, making respondents
think in particular about their health or psychological state. A number of respondents with health
difficulties referred to their only to their health status, regardless of other activities they may be
engaged in. In some of those cases respondents found the question upsetting as they were not
expecting to have to answer questions about their health status given the overall topic of the survey.
Similar sensitivity was observed in a case where the respondent was providing care for a household
member with disabilities, as well as with a respondent experiencing personal relationship problems.
37. The need for careful, rather than literal, translation was also clearly illustrated through the Spanish
version adopted in Peru. Initially the question included words corresponding to both “activity” and
“situation”, but early testing during the development phase showed this to be confusing or
interpreted as referring to sensitive topics. Instead it was decided to use an equivalent colloquial
phase for the cognitive tests that asked respondents what they were mainly “dedicated to” and this
wording was found to be generally well understood even where response categories were not read
out. This was similar to experience in other countries, whereby comprehension and reporting
difficulties were reduced when the translation focussed on what the person was mainly doing rather
than a status or situation.
38. For the two variants of Version B follow up questions were asked regarding the main activity in the
last 12 months. This longer reference period was observed to present additional difficulties for
respondents. When asked the period of time they had in mind respondents gave inconsistent answers
ranging from correct interpretations to the previous calendar year, recent years, or subsets of a year.
For example a respondent in Namibia understood the last 12 months as “January to December of
last year” even though the cognitive interviews took place in August. In addition respondents
reported through further probing that they found the question difficult to answer. One respondent

Measuring Main Activity in Labour Force Surveys: Main findings from the ILO LFS pilot studies 17
in Cameroon had reported without difficulty that their main activity at present was looking for work,
but said “Don’t know” when asked if their main activity in the last 12 months had been different.
Another respondent in Cameroon had believed they were being asked to compare their main current
situation to that exactly 12 months earlier, rather than their main situation over the 12 months. In
circumstances where the respondent had changed their activities relatively recently this could create
a risk of misreporting and at the very least created greater recall difficulties than at present.
Revisions introduced based on findings from the CI tests
39. Based on the findings from the cognitive studies substantial changes were made in advance of the
field tests. Figure 3 shows the versions adopted for the field test. Specifically the changes included:
a. Wording of the questions was updated (see Figure 3). In particular the wording ‘main
activity or situation’ was replaced by ‘mainly doing’ in line with feedback from the
countries and reflecting on the need to provide terminology which could be more easily
adapted to different languages.
b. The response categories presented were updated, and both Version A and Version B were
updated to ensure response categories were read out in all cases. This was critical to address
various difficulties arising due to a lack of clear context for respondents in answering the
question.
c. The structure of Version B was changed. In order to simplify response for respondents with
multiple activities at present, a new initial question was introduced. This new question
asked the respondent to indicate all activities which were relevant to them at present. In
addition to simplifying the response process this was also intended to address the order
effect identified for Version B to try to ensure respondents considered activities beyond
employment. This was followed by a question on main activity (for those who had more
than one current activity) and a question on main activity in the last 12 months.
40. The main difference between versions A and B remained the flow and purpose of the questions,
however an additional difference of note lay in the second and third response categories listed in
the questions (as highlighted in Figure 3).
41. In Version A (used in model 2) category 2 was ‘Work in farming or fishing’ while category 3 was
‘Working in a sector other than farming or fishing’. In this case category 2 included any work in
farming or fishing regardless of whether it was intended to produce goods for own use or sale.
Subsequent questions were used to identify the intended destination and thereby decide if that work
was employment or own use production of goods.
42. In Version B category 2 was ‘working to generate an income’ – theoretically intended to relate to
all employment work regardless of the sector of the activity, while category 3 was ‘farming or
fishing to produce foodstuff for the family’ (own use production of goods).
43. The difference in categories between Version A and Version B after the CI tests reflects the different
role of the questions. In Version A the question was part of the core employment sequence and as
such the additional questions on main intended destination of the production were considered
essential to ensure accurate assignment of respondents as employed or not. This reflects the
observed difficulties from the CI tests of coding cases of farming work to either employment or
own use production of goods using a single main activity question. However, in Version B the
questions were used as additional explanatory information so it was decided not to add burden by

Measuring Main Activity in Labour Force Surveys: Main findings from the ILO LFS pilot studies 18
also including extra questions to check intended destination of production which were in any case
already included earlier in the questionnaire during the employment sequence. The key point to
note is that this introduces some incomparability when comparing results from Version A to
Version B which is highlighted as needed in the analysis below.
44. The remainder of this report focusses on the findings from the field testing phase following the
order of questions in Version B, namely, all activities (Section III, B), then main activity at present
(Section III, C), the correspondence between all activities and labour force status (Section III, D)
and finally main activity in the last 12 months (Section III, E). As model questionnaire 2 only
included one question on main activity at present it is only discussed in Section III, C.
45. In considering the outcomes from the field tests it must be noted that, given the experimental design
of the field tests, the results are not generalizable to the larger population. Simple weights were
computed to account for random differences in the sex, age group and area distribution of the
samples achieved within a given country. The weights were derived by creating a “pooled
population” based on the average of the split samples within each country. More details on the
weighting strategy are available in the report describing the field test methodology.
Figure 3: Questions on Main activity included in the field tests
Version A (Model Questionnaire 2) Version B (Model Questionnaires 1, 3, 4, 5)
QA1. Which of the following best describes what
(NAME) is mainly doing at present?
(Read out list below)
01. Studying or training
02. Work in farming or fishing
03. Working in a sector other than farming or
fishing
04. Looking for work
05. Engaged in household or family
responsibilities
06. With a long-term illness, injury or disability
07. Retired or pensioner
08. Other (specify)
QB1 Which of the following applies to you at
present? Are you….?
(Read out list below and mark all that apply)
01. Studying or training
02. Working to generate an income
03. Farming or fishing to produce foodstuff for
the family
04. Looking for work
05. Engaged in household or family
responsibilities
06. With a long-term illness, injury or disability
07. Retired or pensioner
08. Other (specify)
QB2. And which of those describes best what you
mainly do at present?
(Read out only those selected in QB1)
01. Studying or training
02. Working to generate an income
03. Farming or fishing to produce foodstuff for
the family
04. Looking for work
05. Engaged in household or family
responsibilities
06. With a long-term illness, injury or disability
07. Retired or pensioner
08. Other (specify)

Measuring Main Activity in Labour Force Surveys: Main findings from the ILO LFS pilot studies 19
B. ‘All’ activities at present (field testing phase – Version B only)
Main findings
46. Following the experiences of the cognitive testing one of the major changes introduced to Version
B of the main activity questions was to include a starting question allowing the respondent to
indicate all activities they were currently engaged in from the pre-defined list. This was chosen for
3 reasons, firstly to assess if this generated useful analytical information, secondly to assess if this
appeared to make responding to the main activity question easier for respondents, and thirdly to
establish the intended scope of the question by reducing the possible order effect introduced to the
question placement after detailed questions on employment and unemployment .
47. As a supplement to the quantitative results generated by the field tests, countries were asked to
provide qualitative information based on interviewer experiences and observations. In the case of
the questions on main activity the countries, in general, reported that the questions appeared to work
well and not present major difficulties to respondents. This refers both to the one question on main
activity in M2 and the 3 questions in the other 4 models. Given the difficulties noted in the CI test
this suggests the changes introduced did improve the operation of the questions.
48. In Table 2, the distribution of the number of activities respondents reported is presented for every
country and model. For instance, 36% of the respondents to M1 in Cameroon reported having 1
activity, 39% report 2 activities and so on. The average number of activities for each country and
model, and the number of respondents who belong to the working age population (WAP) for each
country and model are also reported in the table. A space has been left for M2 (Version A) where
it was used in a country to facilitate ease of reading of the data but no data is presented as the
question was not included in M2.
49. As an initial observation on quality it can be noted that there were a small number of respondents
(max 2) in some countries who reported zero activities. This should not have been possible given
the questionnaire design but the low prevalence of this missing data does not indicate that this needs
to be considered as a major factor in the analysis.
QB3 And which of the following best describes
what you mainly did in the last 12 months?
(Read out list below)
01. Studying or training
02. Working to generate an income
03. Farming or fishing to produce foodstuff for
the family
04. Looking for work
05. Engaged in household or family
responsibilities
06. With a long-term illness, injury or disability
07. Retired or pensioner
08. Other (specify)
Measuring Main Activity in Labour Force Surveys: Main findings from the ILO LFS pilot studies 20
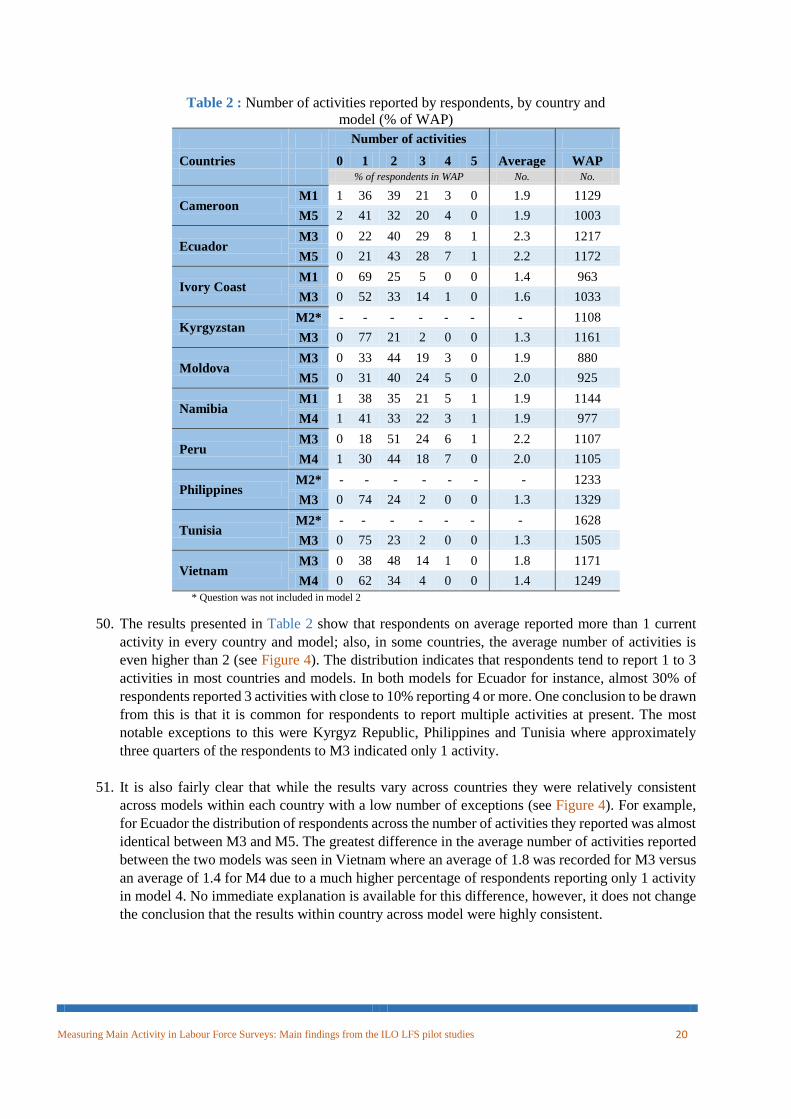
Table 2 : Number of activities reported by respondents, by country and
model (% of WAP)
Number of activities
Countries 0 1 2 3 4 5 Average WAP
% of respondents in WAP No. No.
Cameroon M1 1 36 39 21 3 0 1.9 1129
M5 2 41 32 20 4 0 1.9 1003
Ecuador M3 0 22 40 29 8 1 2.3 1217
M5 0 21 43 28 7 1 2.2 1172
Ivory Coast M1 0 69 25 5 0 0 1.4 963
M3 0 52 33 14 1 0 1.6 1033
Kyrgyzstan M2* - - - - - - - 1108
M3 0 77 21 2 0 0 1.3 1161
Moldova M3 0 33 44 19 3 0 1.9 880
M5 0 31 40 24 5 0 2.0 925
Namibia M1 1 38 35 21 5 1 1.9 1144
M4 1 41 33 22 3 1 1.9 977
Peru M3 0 18 51 24 6 1 2.2 1107
M4 1 30 44 18 7 0 2.0 1105
Philippines M2* - - - - - - - 1233
M3 0 74 24 2 0 0 1.3 1329
Tunisia M2* - - - - - - - 1628
M3 0 75 23 2 0 0 1.3 1505
Vietnam M3 0 38 48 14 1 0 1.8 1171
M4 0 62 34 4 0 0 1.4 1249
* Question was not included in model 2
50. The results presented in Table 2 show that respondents on average reported more than 1 current
activity in every country and model; also, in some countries, the average number of activities is
even higher than 2 (see Figure 4). The distribution indicates that respondents tend to report 1 to 3
activities in most countries and models. In both models for Ecuador for instance, almost 30% of
respondents reported 3 activities with close to 10% reporting 4 or more. One conclusion to be drawn
from this is that it is common for respondents to report multiple activities at present. The most
notable exceptions to this were Kyrgyz Republic, Philippines and Tunisia where approximately
three quarters of the respondents to M3 indicated only 1 activity.
51. It is also fairly clear that while the results vary across countries they were relatively consistent
across models within each country with a low number of exceptions (see Figure 4). For example,
for Ecuador the distribution of respondents across the number of activities they reported was almost
identical between M3 and M5. The greatest difference in the average number of activities reported
between the two models was seen in Vietnam where an average of 1.8 was recorded for M3 versus
an average of 1.4 for M4 due to a much higher percentage of respondents reporting only 1 activity
in model 4. No immediate explanation is available for this difference, however, it does not change
the conclusion that the results within country across model were highly consistent.
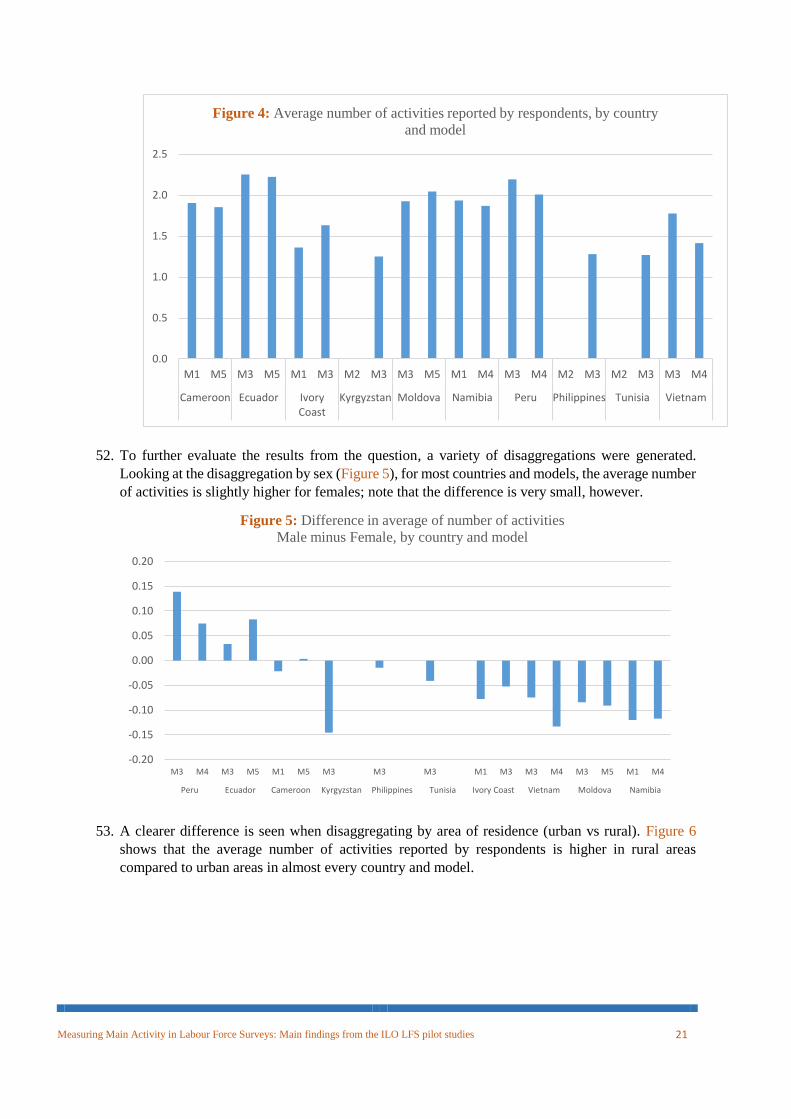
Measuring Main Activity in Labour Force Surveys: Main findings from the ILO LFS pilot studies 21
52. To further evaluate the results from the question, a variety of disaggregations were generated.
Looking at the disaggregation by sex (Figure 5), for most countries and models, the average number
of activities is slightly higher for females; note that the difference is very small, however.
53. A clearer difference is seen when disaggregating by area of residence (urban vs rural). Figure 6
shows that the average number of activities reported by respondents is higher in rural areas
compared to urban areas in almost every country and model.
0.0
0.5
1.0
1.5
2.0
2.5
M1 M5 M3 M5 M1 M3 M2 M3 M3 M5 M1 M4 M3 M4 M2 M3 M2 M3 M3 M4
Cameroon Ecuador IvoryCoast
Kyrgyzstan Moldova Namibia Peru Philippines Tunisia Vietnam
Figure 4: Average number of activities reported by respondents, by country
and model
-0.20
-0.15
-0.10
-0.05
0.00
0.05
0.10
0.15
0.20
M3 M4 M3 M5 M1 M5 M3 M3 M3 M1 M3 M3 M4 M3 M5 M1 M4
Peru Ecuador Cameroon Kyrgyzstan Philippines Tunisia Ivory Coast Vietnam Moldova Namibia
Figure 5: Difference in average of number of activities
Male minus Female, by country and model

Measuring Main Activity in Labour Force Surveys: Main findings from the ILO LFS pilot studies 22
54. For the LFS pilots the samples of proxy and self-reporting respondents were not random and the
level of proxy response across countries varied greatly. As such our ability to draw conclusions on
the impact of proxy response is very limited. While needing to be cautious in interpretation of the
results we can observe some difference between the reporting of activities for proxies in comparison
to self-respondents. This is highlighted by the fact that in all models and countries, with only one
exception, the average number of activities reported was higher for direct respondents, than for
those for whom information was provided by proxy and the gap was quite substantial in cases (see
Figure 7).
55. In Table 3 the distribution of respondents across different activities is presented. For instance, in
M1 for Cameroon, 18 percent of respondents’ reported that one of their activities was studying or
training, 45 percent reported they were working to generate an income. As respondents could report
more than one current activity the sum across the categories is greater than 100.
-0.70
-0.60
-0.50
-0.40
-0.30
-0.20
-0.10
0.00
0.10
0.20
M1 M5 M3 M4 M3 M5 M1 M4 M3 M5 M3 M3 M4 M3 M1 M3 M3
Cameroon Peru Ecuador Namibia Moldova Tunisia Vietnam Philippines Ivory Coast Kyrgyzstan
Figure 6: Difference in average of number of activities
Urban minus Rural, by country and model
-0.70
-0.60
-0.50
-0.40
-0.30
-0.20
-0.10
0.00
0.10
M3 M5 M3 M3 M5 M1 M4 M3 M4 M3 M1 M5 M3 M3 M4 M1 M3
Ecuador Tunisia Moldova Namibia Peru Philippines Cameroon Kyrgyzstan Vietnam Ivory Coast
Figure 7 : Difference in average of number of activities, proxy minus self-
reporting, by country and model

Measuring Main Activity in Labour Force Surveys: Main findings from the ILO LFS pilot studies 23
Table 3 : Activities reported by country and model (% of WAP)*
Studying Working
for income
Foodstuff
production
Seeking
work
Household
resp. Illness Retired Other WAP
% of respondents in WAP No.
Cameroon M1 18 45 48 18 49 7 2 1 1171
M5 19 42 45 18 39 5 3 2 1040
Ecuador M3 16 53 47 17 73 13 5 1 1217
M5 15 54 43 15 80 14 2 0 1172
Ivory Coast M1 12 59 28 9 21 2 1 2 989
M3 14 48 39 13 42 4 0 2 1060
Kyrgyzstan M2** - - - - - - - - -
M3 8 33 1 7 48 6 21 1 1161
Moldova M3 8 31 22 11 70 19 30 1 880
M5 8 32 25 11 72 26 28 1 925
Namibia M1 24 26 46 26 50 10 12 0 1152
M4 27 28 36 24 51 8 12 0 970
Peru M3 16 40 37 19 82 18 6 0 1121
M4 17 44 26 15 76 15 7 0 1105
Philippines M2** - - - - - - - - -
M3 12 51 17 6 35 2 3 1 1233
Tunisia M2** - - - - - - - - -
M3 9 29 9 23 39 8 9 1 1505
Vietnam M3 7 56 33 3 60 6 10 2 1178
M4 8 59 23 1 33 4 11 3 1243 * As respondents could report more than one activity the percentages across activities sum to more than 100
**Question was not included in model 2
56. Working to generate an income and engaged in household or family responsibilities were the
activities most commonly reported by respondents across countries and models. Farming or fishing
to produce foodstuff for the family was also commonly reported in many cases. Other categories
such as studying or training or retired were heavily related to the age profile of respondents in the
country in question. We can note a relatively high degree of consistency between models in almost
all countries. The detailed results of activities reported disaggregated by sex are contained in tables
A1 and A2 in section VI.
57. Based on the analysis completed the main conclusions which can be drawn about the question on
different activities undertaken by the respondent are:
a. Given the frequency of reporting multiple activities there can be some analytical value to
be gained from including a question of this type. This information would be lost if only a
single main activity question was asked. Countries considering collecting information on
main activity should consider if there is national interest in also collecting information on
multiple activities in the manner done through the pilot studies.
b. The relative consistency of reporting across models and feedback from the pilot countries
suggest the question operated well in the field. Country feedback suggests that it also
appeared to have assisted in easing the reporting of main activity which in turn should
reduce possible order effects arising from previous questions on employment and
unemployment. In addition, there was a very low level of missing data where zero activities

Measuring Main Activity in Labour Force Surveys: Main findings from the ILO LFS pilot studies 24
were reported (zero cases for most models and countries) suggesting reporting was not
found very problematic by respondents.
C. Main activity 58. The next question in Version B asked respondents to identify their main activity from among those
reported in the previous question. If the respondent only reported one activity then it was
automatically assumed to be the main activity. For Version A main activity was the initial question
in the individual questionnaire thus data from M2 is also included in this analysis albeit with some
incomparability in the response options (see paras 40 to 43 above).
59. In Table 4, the distribution of the main activities reported by respondents is presented for each
country and model. In this case the percentages in each row sum to 100 percent given that each
respondent can only report one main activity. For instance, in Cameroon M1, 17 percent of the
respondents in the working age population report that their main activity is studying or training
(relative to the 18 percent who reported it as one of their activities), 35 percent reported that their
main activity is working to generate an income (relative to 45 percent who reported it as one of
their activities) etc.
Table 4 : Main activity distribution by country and model (% of WAP)
Studying Working
for income*
Foodstuff
production*
Seeking
work
Household
resp. Illness Retired Other WAP
% of respondents in WAP No.
Cameroon M1 17 35 27 6 8 5 1 1 1171
M5 19 35 26 6 8 4 2 1 1040
Ecuador M3 13 41 11 4 26 4 2 1 1217
M5 13 45 12 3 22 3 1 0 1172
Ivory
Coast
M1 12 53 15 5 10 2 1 2 989
M3 14 35 24 7 15 3 0 2 1060
Kyrgyzstan M2 9 30 1 6 33 3 18 1 1108
M3 8 31 1 5 32 4 18 1 1161
Moldova M3 8 29 6 6 23 9 19 1 880
M5 7 29 6 6 25 12 15 1 925
Namibia M1 21 20 22 15 12 5 5 0 1152
M4 24 26 14 11 12 3 9 0 970
Peru M3 11 29 24 3 25 5 3 0 1121
M4 12 33 16 3 28 5 4 0 1105
Philippines M2 11 45 16 3 19 2 2 1 1329
M3 11 46 14 5 19 2 2 1 1233
Tunisia M2 13 26 8 19 20 6 8 1 1628
M3 9 26 7 18 25 7 7 1 1505
Vietnam M3 6 46 19 1 13 4 9 2 1178
M4 8 56 16 0 6 3 8 3 1243
* These categories differed between version A (model 2) and version B (all other models) – see paras 40 to 43 for more details
Measuring Main Activity in Labour Force Surveys: Main findings from the ILO LFS pilot studies 25
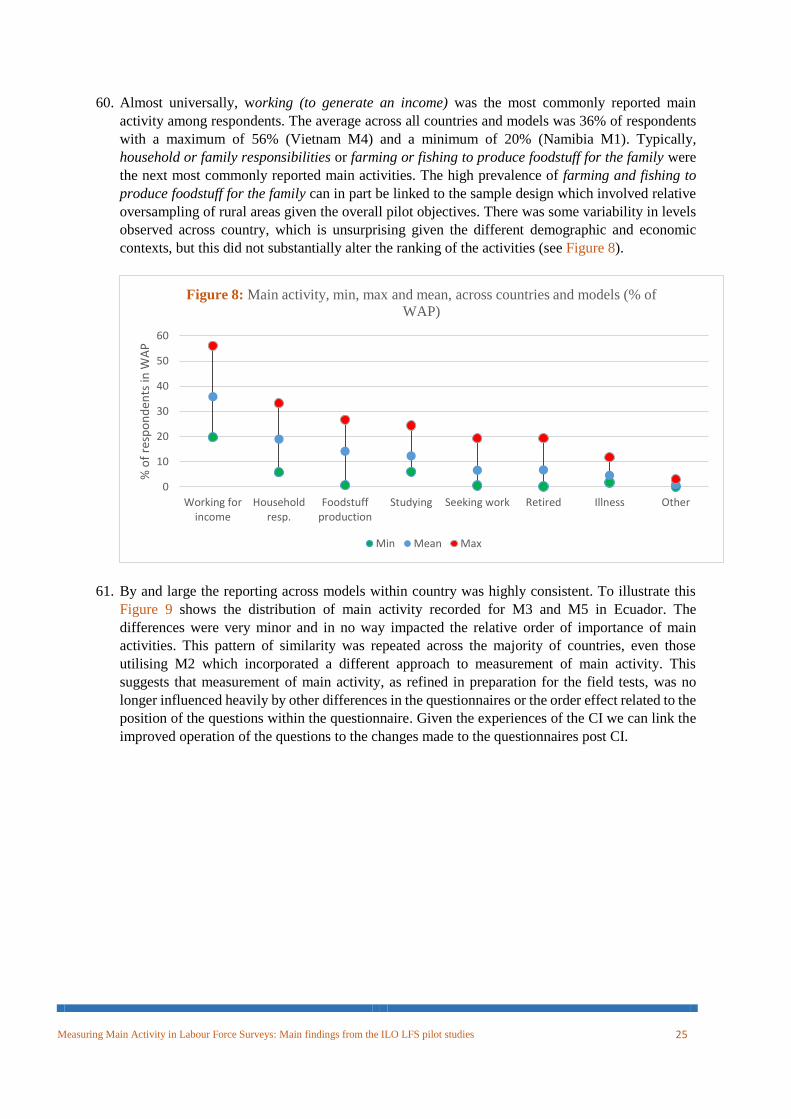
60. Almost universally, working (to generate an income) was the most commonly reported main
activity among respondents. The average across all countries and models was 36% of respondents
with a maximum of 56% (Vietnam M4) and a minimum of 20% (Namibia M1). Typically,
household or family responsibilities or farming or fishing to produce foodstuff for the family were
the next most commonly reported main activities. The high prevalence of farming and fishing to
produce foodstuff for the family can in part be linked to the sample design which involved relative
oversampling of rural areas given the overall pilot objectives. There was some variability in levels
observed across country, which is unsurprising given the different demographic and economic
contexts, but this did not substantially alter the ranking of the activities (see Figure 8).
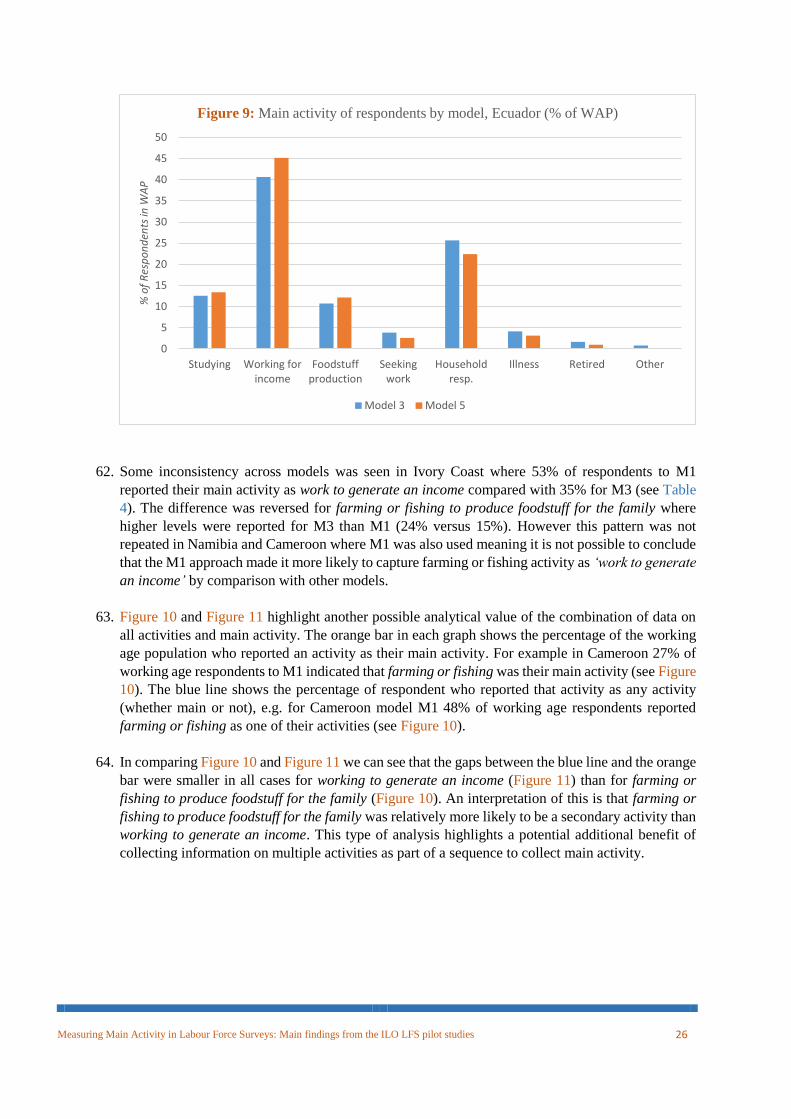
61. By and large the reporting across models within country was highly consistent. To illustrate this
Figure 9 shows the distribution of main activity recorded for M3 and M5 in Ecuador. The
differences were very minor and in no way impacted the relative order of importance of main
activities. This pattern of similarity was repeated across the majority of countries, even those
utilising M2 which incorporated a different approach to measurement of main activity. This
suggests that measurement of main activity, as refined in preparation for the field tests, was no
longer influenced heavily by other differences in the questionnaires or the order effect related to the
position of the questions within the questionnaire. Given the experiences of the CI we can link the
improved operation of the questions to the changes made to the questionnaires post CI.
0
10
20
30
40
50
60
Working forincome
Householdresp.
Foodstuffproduction
Studying Seeking work Retired Illness Other
% o
f re
spo
nd
ents
in W
AP
Figure 8: Main activity, min, max and mean, across countries and models (% of
WAP)
Min Mean Max
Measuring Main Activity in Labour Force Surveys: Main findings from the ILO LFS pilot studies 26
62. Some inconsistency across models was seen in Ivory Coast where 53% of respondents to M1
reported their main activity as work to generate an income compared with 35% for M3 (see Table
4). The difference was reversed for farming or fishing to produce foodstuff for the family where
higher levels were reported for M3 than M1 (24% versus 15%). However this pattern was not
repeated in Namibia and Cameroon where M1 was also used meaning it is not possible to conclude
that the M1 approach made it more likely to capture farming or fishing activity as ‘work to generate
an income’ by comparison with other models.
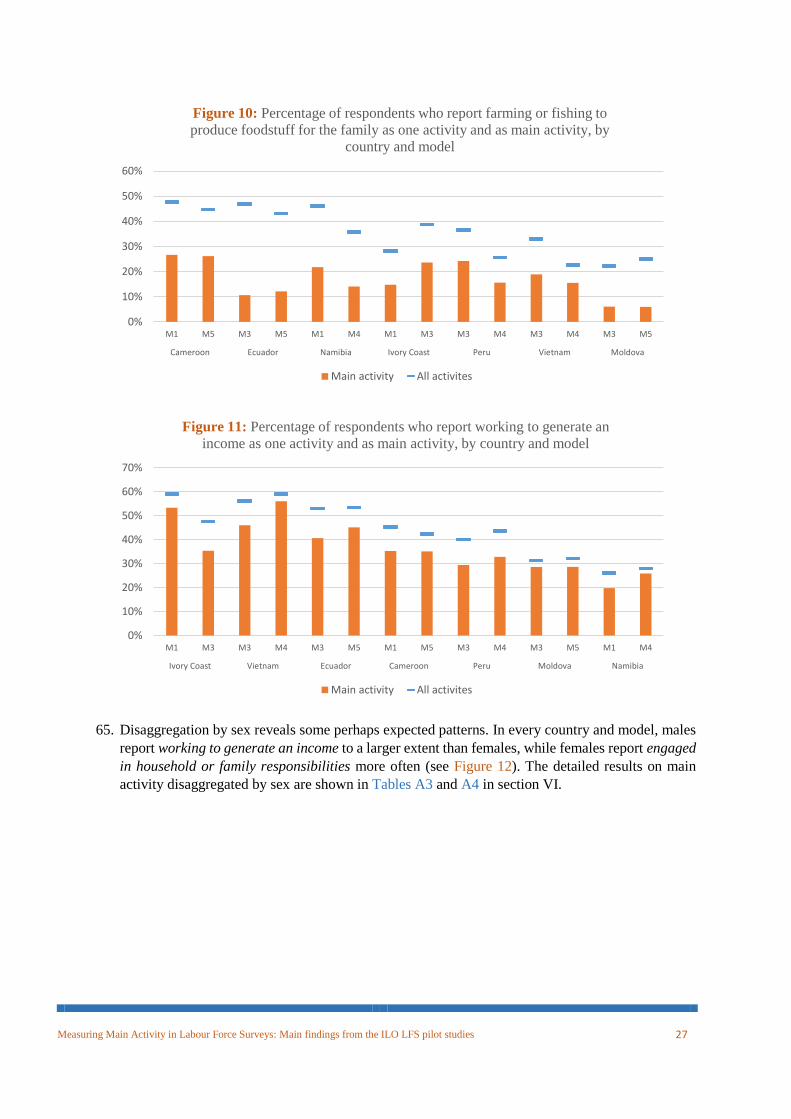
63. Figure 10 and Figure 11 highlight another possible analytical value of the combination of data on
all activities and main activity. The orange bar in each graph shows the percentage of the working
age population who reported an activity as their main activity. For example in Cameroon 27% of
working age respondents to M1 indicated that farming or fishing was their main activity (see Figure
10). The blue line shows the percentage of respondent who reported that activity as any activity
(whether main or not), e.g. for Cameroon model M1 48% of working age respondents reported
farming or fishing as one of their activities (see Figure 10).
64. In comparing Figure 10 and Figure 11 we can see that the gaps between the blue line and the orange
bar were smaller in all cases for working to generate an income (Figure 11) than for farming or
fishing to produce foodstuff for the family (Figure 10). An interpretation of this is that farming or
fishing to produce foodstuff for the family was relatively more likely to be a secondary activity than
working to generate an income. This type of analysis highlights a potential additional benefit of
collecting information on multiple activities as part of a sequence to collect main activity.
0
5
10
15
20
25
30
35
40
45
50
Studying Working forincome
Foodstuffproduction
Seekingwork
Householdresp.
Illness Retired Other
% o
f R
esp
on
den
ts in
WA
P
Figure 9: Main activity of respondents by model, Ecuador (% of WAP)
Model 3 Model 5
Measuring Main Activity in Labour Force Surveys: Main findings from the ILO LFS pilot studies 27
65. Disaggregation by sex reveals some perhaps expected patterns. In every country and model, males
report working to generate an income to a larger extent than females, while females report engaged
in household or family responsibilities more often (see Figure 12). The detailed results on main
activity disaggregated by sex are shown in Tables A3 and A4 in section VI.
0%
10%
20%
30%
40%
50%
60%
M1 M5 M3 M5 M1 M4 M1 M3 M3 M4 M3 M4 M3 M5
Cameroon Ecuador Namibia Ivory Coast Peru Vietnam Moldova
Figure 10: Percentage of respondents who report farming or fishing to
produce foodstuff for the family as one activity and as main activity, by
country and model
Main activity All activites
0%
10%
20%
30%
40%
50%
60%
70%
M1 M3 M3 M4 M3 M5 M1 M5 M3 M4 M3 M5 M1 M4
Ivory Coast Vietnam Ecuador Cameroon Peru Moldova Namibia
Figure 11: Percentage of respondents who report working to generate an
income as one activity and as main activity, by country and model
Main activity All activites

Measuring Main Activity in Labour Force Surveys: Main findings from the ILO LFS pilot studies 28
66. Also, the results show that there are important differences between respondents living in urban areas
compared to respondents in rural areas. Figure 13 shows that it is more common for respondents in
urban areas to report working to generate an income or looking for work as the main activity, while,
unsurprisingly, respondents in rural areas report farming or fishing to produce foodstuff for the
family more often.
-50
-40
-30
-20
-10
0
10
20
30
40
50
M3 M5 M2 M3 M2 M3 M3 M4 M1 M3 M2 M3 M1 M5 M3 M5 M3 M4 M1 M4
Ecuador Tunisia Kyrgyzstan Peru IvoryCoast
PhilippinesCameroon Moldova Vietnam Namibia
per
cen
tage
po
ints
Figure 12: Main activity, percentage point difference, Males minus Females, by
country and model
Working for income Household responsibilities

Measuring Main Activity in Labour Force Surveys: Main findings from the ILO LFS pilot studies 29
67. Figure 14 presents the distribution of the main activities for different age groups. In this case the
average across two models in each country has been presented to facilitate visualisation. The chart
does not reveal any unexpected results. For example looking for work and studying were most
common among 15-29 year olds while farming or fishing to produce foodstuff and working to
generate an income are more commonly reported as main activities among older age groups.
-50
-40
-30
-20
-10
0
10
20
30
40
M1 M5 M3 M5 M1 M3 M2 M3 M3 M5 M1 M4 M3 M4 M2 M3 M2 M3 M3 M4
Cameroon Ecuador IvoryCoast
Kyrgyzstan Moldova Namibia Peru Philippines Tunisia Vietnam
per
cen
tage
po
ints
Figure 13: Main activity distribuition, percentage point difference, Urban minus
Rural, by country and model
Working for income Foodstuff production Seeking work

Measuring Main Activity in Labour Force Surveys: Main findings from the ILO LFS pilot studies 30
68. The main conclusions which can be drawn from the question on main activity are:
a. As with the previous question on all activities the question on main activity seemed to
function well. This is concluded from the qualitative feedback received along with the
relatively high level of consistency across models as well as consistency with a-priori
expectations.
b. Strong analytical value can be added by including this question in surveys which capture
work and labour force status, either as part of the sequence of questions on employment
(Version A) or as a separate set of questions which can be cross-tabulated with labour force
status (Version B).
c. Additional analytical value can be added by also including the question capturing multiple
activities as well as main activity where there is interest in this type of information. For
example the prevalence of certain activities (e.g. household responsibilities) which can
otherwise be missed if main activity only is captured. Regarding this conclusion it can be
noted that other methods could be used to capture information on other activities such as
dedicated questions on own use provision of services, studying etc., but the approach
highlighted here is a possible low burden manner to capture some information which can
be used as a general social indicator not directly based on activities in a short reference
period as other indicators from the LFS tend to be.
D. Concordance between all activities and Labour Force Status
69. The model questionnaires were designed in such a way as to permit various types of checks on
internal consistency. One case where this can be useful is an evaluation of the consistency between
labour force status and the information captured through the main activity questions. These
consistency checks can work in multiple ways as described below with different interpretations
depending on the types of inconsistencies identified. For the purposes of this report the focus is on
the correspondence between employment and working to generate an income. Similar analysis
0%
10%
20%
30%
40%
50%
60%
70%
80%
90%
100%1
5-2
93
0-5
45
5+
15
-29
30
-54
55
+
15
-29
30
-54
55
+
15
-29
30
-54
55
+
15
-29
30
-54
55
+
15
-29
30
-54
55
+
15
-29
30
-54
55
+
15
-29
30
-54
55
+
15
-29
30
-54
55
+
15
-29
30
-54
55
+
Cameroon Ecuador Ivory Coast Kyrgyzstan Moldova Namibia Peru Philippines Tunisia Vietnam
Figure 14 : Main activity by country and age group
Study Working for Income Foodstuff production Seeking work Household Resp. Other
Measuring Main Activity in Labour Force Surveys: Main findings from the ILO LFS pilot studies 31
could be attempted with unemployment and looking for work but for the pilot studies that analysis
is limited due to the low number of unemployed respondents identified.
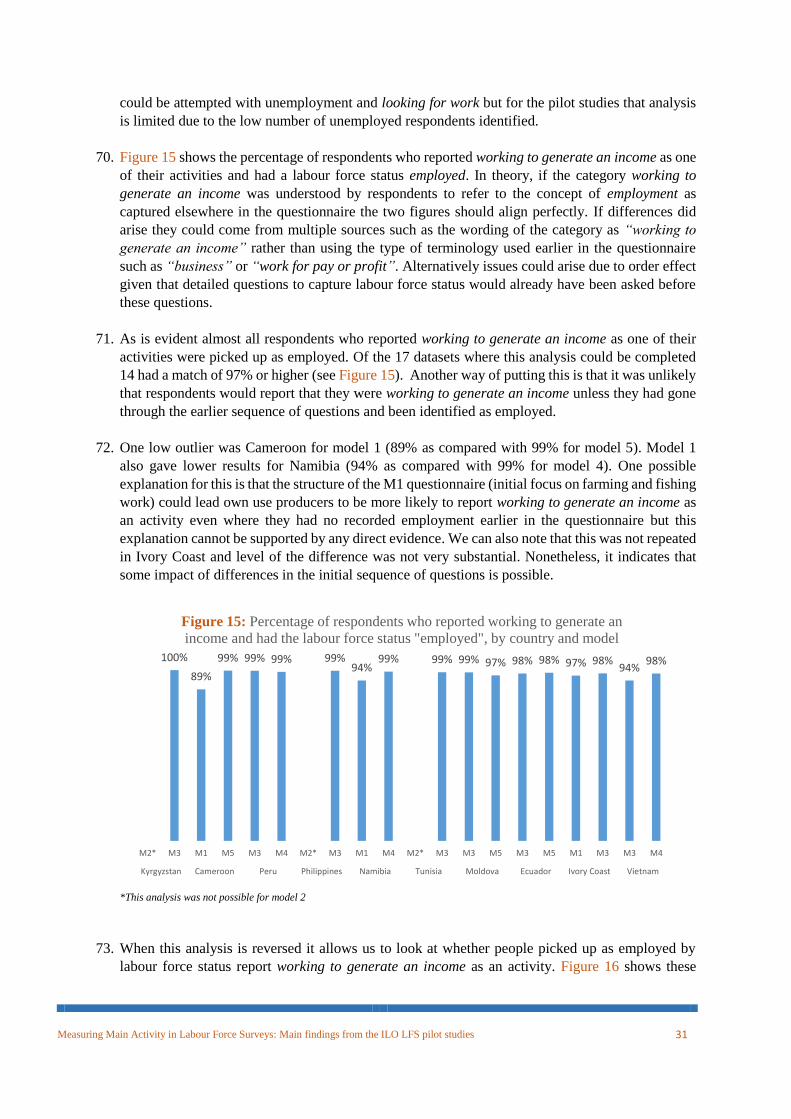
70. Figure 15 shows the percentage of respondents who reported working to generate an income as one
of their activities and had a labour force status employed. In theory, if the category working to
generate an income was understood by respondents to refer to the concept of employment as
captured elsewhere in the questionnaire the two figures should align perfectly. If differences did
arise they could come from multiple sources such as the wording of the category as “working to
generate an income” rather than using the type of terminology used earlier in the questionnaire
such as “business” or “work for pay or profit”. Alternatively issues could arise due to order effect
given that detailed questions to capture labour force status would already have been asked before
these questions.
71. As is evident almost all respondents who reported working to generate an income as one of their
activities were picked up as employed. Of the 17 datasets where this analysis could be completed
14 had a match of 97% or higher (see Figure 15). Another way of putting this is that it was unlikely
that respondents would report that they were working to generate an income unless they had gone
through the earlier sequence of questions and been identified as employed.
72. One low outlier was Cameroon for model 1 (89% as compared with 99% for model 5). Model 1
also gave lower results for Namibia (94% as compared with 99% for model 4). One possible
explanation for this is that the structure of the M1 questionnaire (initial focus on farming and fishing
work) could lead own use producers to be more likely to report working to generate an income as
an activity even where they had no recorded employment earlier in the questionnaire but this
explanation cannot be supported by any direct evidence. We can also note that this was not repeated
in Ivory Coast and level of the difference was not very substantial. Nonetheless, it indicates that
some impact of differences in the initial sequence of questions is possible.
*This analysis was not possible for model 2
73. When this analysis is reversed it allows us to look at whether people picked up as employed by
labour force status report working to generate an income as an activity. Figure 16 shows these
100%
89%
99% 99% 99% 99%94%
99% 99% 99% 97% 98% 98% 97% 98%94%
98%
M2* M3 M1 M5 M3 M4 M2* M3 M1 M4 M2* M3 M3 M5 M3 M5 M1 M3 M3 M4
Kyrgyzstan Cameroon Peru Philippines Namibia Tunisia Moldova Ecuador Ivory Coast Vietnam
Figure 15: Percentage of respondents who reported working to generate an
income and had the labour force status "employed", by country and model

Measuring Main Activity in Labour Force Surveys: Main findings from the ILO LFS pilot studies 32
findings, for example showing that 83% of respondents who were captured as employed in model
5 in Moldova also reported working to generate an income as one of their activities.
74. The results presented in Figure 16 show that an approach based on subjective reporting of current
activities (i.e. the any activity question from Version B) alone does not produce reliable estimates
for employment. Between 6% and 42% of respondents across models and countries were picked up
as having a labour force status of employed but did not subjectively report working to generate an
income as one of their activities, (whether their main activity or a secondary activity). This can be
explained in various ways, such as people engaged in casual employment activities not considering
their activity as work to generate an income etc.
* This analysis was not possible for model 2
75. Taken in combination the analysis of the data underlying Figures 15 and 16 can lead to multiple
conclusions about subjective questions on activities and how they may relate to the measurement
of employment
a. A short set of questions covering peoples’ self-reported activities, while analytically useful,
should not be considered as a replacement for a dedicated set of questions to identify labour
force status. This finding is reinforced by the findings presented in the separate report on
the measurement of employment, whereby it was demonstrated that a sequence starting
with questions on main activity required additional recovery questions to comprehensively
capture employment.
b. Order effects may arise in the sequence of questions but are not easy to identify clearly.
The pilot studies showed it was unlikely that the category working to generate an income
would be over-reported (i.e. someone who reported it not being in employment) but it
remained possible that it could be under-reported (i.e. someone in employment not
selecting this category). This is something which could warrant further studies to assess
order effects more directly.
58%
65%71%
67%71% 72%
77%
63%
81%
64%
78%82%
86%
79%
86% 85%
94%
M3 M4 M1 M5 M2* M3 M2* M3 M1 M3 M3 M5 M3 M4 M3 M5 M1 M4 M2* M3
Peru Cameroon Philippines Tunisia Ivory Coast Moldova Vietnam Ecuador Namibia Kyrgyzstan
Figure 16: Percentage of Employed respondents reporting "working to
generate income" as an activity, by country and model

Measuring Main Activity in Labour Force Surveys: Main findings from the ILO LFS pilot studies 33
E. Concordance between current main activity and main activity
in the last 12 months
76. The final set of findings cover the correspondence between reporting in response to the question on
main activity at present and the question on main activity in the last 12 months. This analysis can
highlight if sufficient difference was found in the reporting to warrant collection of information for
both reference periods. If not then a decision on which (if either) to include in a questionnaire would
have to made based on national interest.
77. As reported earlier, during the CI tests it was attempted to establish if there were varying degrees
of difficulty in understanding of the two different periods ‘at present’ and ‘in the last 12 months’.
Outcomes from the CI indicated a relatively greater degree of inconsistency and reporting difficulty
related to the reference period ‘last 12 months’. This is not surprising given the longer recall period
involved.
78. Analysis of the field test results could be done either at the aggregate or individual level. Figures
17 and 18 show the results of analysis at the individual level. This shows the percentage of
respondents who reported the same activity at present as over the last 12 months. For instance, 100
percent of the respondents to M1 in Cameroon reported the same activity presently as they had in
the last 12 months.
* This analysis was not possible for model 2
79. The results in Figure 17 indicate that respondents did report the same main activity in the two
reference periods to a large extent, but there are some exceptions to note. We find the lowest level
of correspondence for M1 in Namibia with 73 percent of respondents reporting the same current
main activity as main activity in the last 12 months. For the majority of countries and models
however the correspondence was above 80 percent and in several cases above 90 percent.
80. To highlight the difference found in Namibia Figure 18 shows how the level of correspondence
differed depending on the main activity in question. For example relatively higher levels of
correspondence were reported for people working to generate an income (89%) and studying (87%)
100% 97% 95% 92% 93%88%
92% 91%83%
88% 86% 84% 84%77%
73%
84% 84%
M1 M5 M2* M3 M1 M3 M3 M5 M2* M3 M3 M4 M3 M4 M3 M5 M1 M4 M2* M3
Cameroon Philippines Ivory Coast Ecuador Tunisia Vietnam Peru Moldova Namibia Kyrgyzstan
Figure 17: Correspondance between current main activity and main activity in
the last 12 months , by country and model
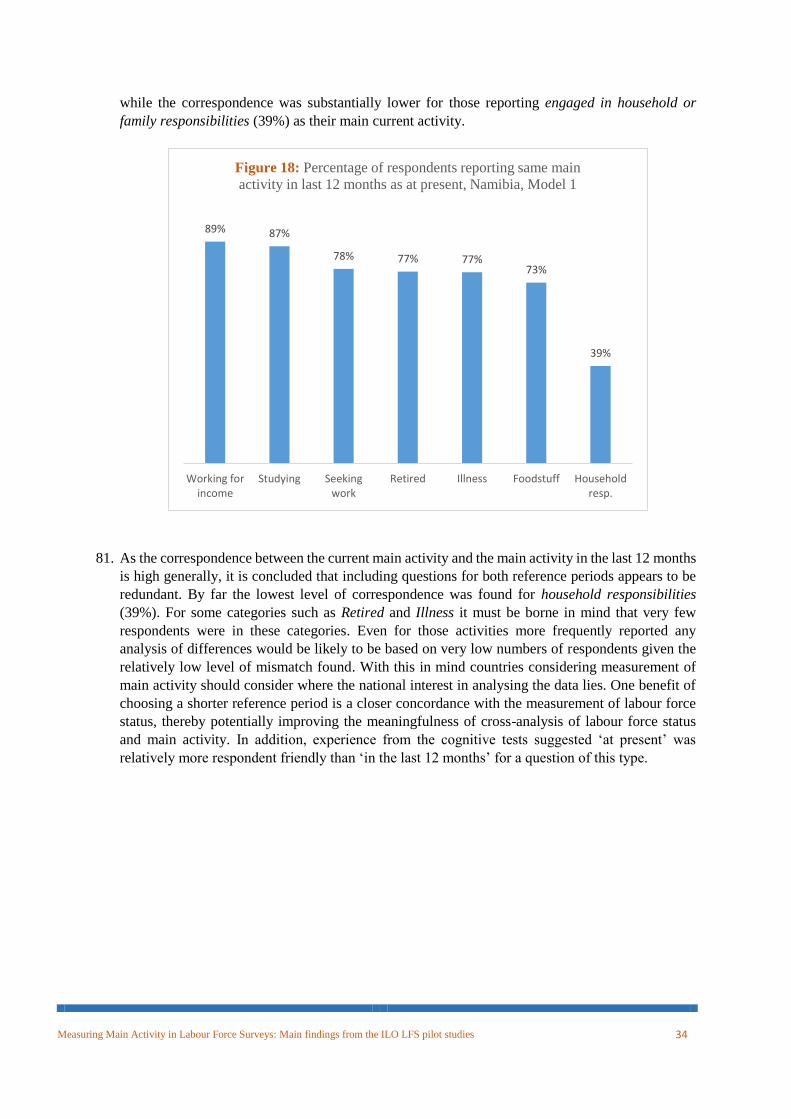
Measuring Main Activity in Labour Force Surveys: Main findings from the ILO LFS pilot studies 34
while the correspondence was substantially lower for those reporting engaged in household or
family responsibilities (39%) as their main current activity.
81. As the correspondence between the current main activity and the main activity in the last 12 months
is high generally, it is concluded that including questions for both reference periods appears to be
redundant. By far the lowest level of correspondence was found for household responsibilities
(39%). For some categories such as Retired and Illness it must be borne in mind that very few
respondents were in these categories. Even for those activities more frequently reported any
analysis of differences would be likely to be based on very low numbers of respondents given the
relatively low level of mismatch found. With this in mind countries considering measurement of
main activity should consider where the national interest in analysing the data lies. One benefit of
choosing a shorter reference period is a closer concordance with the measurement of labour force
status, thereby potentially improving the meaningfulness of cross-analysis of labour force status
and main activity. In addition, experience from the cognitive tests suggested ‘at present’ was
relatively more respondent friendly than ‘in the last 12 months’ for a question of this type.
89% 87%
78% 77% 77%73%
39%
Working forincome
Studying Seekingwork
Retired Illness Foodstuff Householdresp.
Figure 18: Percentage of respondents reporting same main
activity in last 12 months as at present, Namibia, Model 1

Measuring Main Activity in Labour Force Surveys: Main findings from the ILO LFS pilot studies 35
IV. IDENTIFIED CONCLUSIONS AND
RECOMMENDATIONS _______________
82. The pilot studies along with previous experience of collecting information on Main Activity
highlight its analytical value. Countries should consider including questions on the subject in
questionnaires. However, given observed mismatches between recording of employment and the
main activity working to generate an income these questions should not be regarded as a
replacement for questions on labour force status in isolation.
83. However, a question on main activity can be used as part of a sequence of questions to capture
employment, as long as sufficient recovery questions are included (as done in Version A) for people
who may have another main activity but also have some employment work. This finding is
explained further in another report in this series on the measurement of employment.
84. Experience from CI indicated that it is essential for response categories to be read out for any
question of this type. There was also evidence that referring to what people ‘mainly do’ rather than
‘activity’, ‘status’ or ‘situation’ can help to improve understanding of the question. Nonetheless
careful translation and pre-testing is needed to ensure the appropriate context is achieved in different
countries and languages.
85. The updated versions of the questions included in the field tests appeared to operate well. This is
based on qualitative feedback from the pilot countries and the quantitative analysis of the results
(for example high degrees of consistency between models in the same country, results matching a-
priori expectations). The degree of consistency observed suggests that the reporting of main activity
was not heavily influenced by other differences in the design of the model questionnaires.
86. Collecting information on ‘all activities’ before identifying the main activity can be useful both to
ease reporting and to offer useful information which is missed if only one question on main activity
is used. In most countries the large majority of respondents reported more than one current activity.
This approach can also potentially reduce any order effects arising from placing the questions after
detailed questions on employment and unemployment. Some evidence from the pilot studies could
infer some order effect did exist but further study could be warranted to assess this more directly.
87. The list of categories included in the pilot tests should be considered a good starting point but
countries should consider national adaptation if relevant. For example if other activities such as
volunteer work are common this could be considered for inclusion. However the number of
categories included needs to be relatively low given that they should be read to the respondent. A
good testing plan should include tests of these questions to ensure the categories are relevant in the
national context.
88. In the pilot countries the large majority of respondents reported the same main activity at present
as in the last 12 months. This suggests there is no major value to collecting information on both.
Given the short reference period adopted for measurement of labour force status it is recommended
to adopt the question covering ‘at present’. However, this can be considered further by countries
based on national user interest.

Measuring Main Activity in Labour Force Surveys: Main findings from the ILO LFS pilot studies 36
89. As with all subjects national adaptation and testing is critical to cover issues such as appropriate
question wording (allowing for national culture, translation etc) and appropriate response
categories.

Measuring Main Activity in Labour Force Surveys: Main findings from the ILO LFS pilot studies 37
V. REFERENCES ______________
ILO. (1982). Resolution concerning statistics of the economically active population, employment,
unemployment and underemployment. 13th International Conference of Labour Statisticians.
Geneva: ILO.
ILO. (2013). Resolution I concerning statistics of work, employment and labour underutilization. 19th
International Conference of Labour Statisticians . Geneva: ILO.

Measuring Main Activity in Labour Force Surveys: Main findings from the ILO LFS pilot studies 38
VI. SUPPLEMENTARY TABLES _______________
Table A1: Activities reported by country and model (% of WAP)* - Males
Studying Working for
income
Foodstuff
production
Seeking
work
Household
resp. Illness Retired Other WAP
% of respondents in WAP No.
Cameroon M1 18 54 45 21 39 6 2 0 556
M5 20 50 44 22 27 5 4 1 493
Ecuador M3 16 68 47 19 59 12 5 1 614
M5 17 66 40 19 69 12 2 0 591
Ivory Coast M1 12 72 27 7 9 2 1 1 483
M3 16 57 41 11 29 3 1 2 518
Kyrgyzstan M2**
M3 8 48 2 11 24 5 16 2 528
Moldova M3 8 35 25 15 65 16 24 0 418
M5 8 38 28 14 64 25 22 1 439
Namibia M1 28 27 42 27 43 10 10 0 483
M4 30 31 33 26 43 7 10 0 407
Peru M3 17 45 43 24 76 14 7 0 550
M4 19 48 31 17 67 13 8 1 543
Philippines M2**
M3 12 57 20 8 23 2 3 2 606
Tunisia M2**
M3 9 42 10 22 19 9 13 1 745
Vietnam M3 6 58 33 4 55 6 10 1 554
M4 10 63 21 1 23 4 12 1 589
* As respondents could report more than one activity the percentages across activities sum to more than 100
**Question was not included in model 2
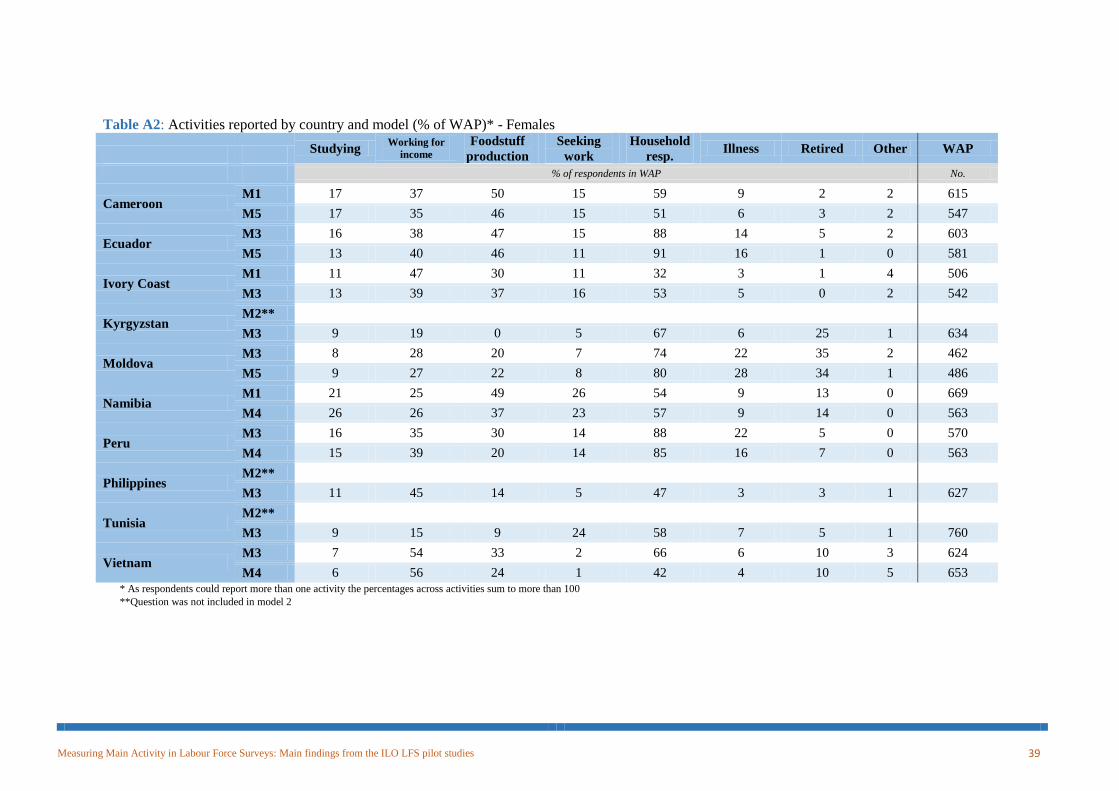
Measuring Main Activity in Labour Force Surveys: Main findings from the ILO LFS pilot studies 39
Table A2: Activities reported by country and model (% of WAP)* - Females
Studying Working for
income
Foodstuff
production
Seeking
work
Household
resp. Illness Retired Other WAP
% of respondents in WAP No.
Cameroon M1 17 37 50 15 59 9 2 2 615
M5 17 35 46 15 51 6 3 2 547
Ecuador M3 16 38 47 15 88 14 5 2 603
M5 13 40 46 11 91 16 1 0 581
Ivory Coast M1 11 47 30 11 32 3 1 4 506
M3 13 39 37 16 53 5 0 2 542
Kyrgyzstan M2**
M3 9 19 0 5 67 6 25 1 634
Moldova M3 8 28 20 7 74 22 35 2 462
M5 9 27 22 8 80 28 34 1 486
Namibia M1 21 25 49 26 54 9 13 0 669
M4 26 26 37 23 57 9 14 0 563
Peru M3 16 35 30 14 88 22 5 0 570
M4 15 39 20 14 85 16 7 0 563
Philippines M2**
M3 11 45 14 5 47 3 3 1 627
Tunisia M2**
M3 9 15 9 24 58 7 5 1 760
Vietnam M3 7 54 33 2 66 6 10 3 624
M4 6 56 24 1 42 4 10 5 653
* As respondents could report more than one activity the percentages across activities sum to more than 100
**Question was not included in model 2

Measuring Main Activity in Labour Force Surveys: Main findings from the ILO LFS pilot studies 40
Table A3: Main activity by country and model (% of WAP) - Males
Studying Working for
income*
Foodstuff
production* Seeking
work
Household
resp. Illness Retired Other WAP
% of respondents in WAP No.
Cameroon M1 19 43 23 6 2 5 2 1 556
M5 21 46 20 7 1 3 2 1 493
Ecuador M3 13 60 10 6 4 4 2 0 614
M5 15 61 11 3 5 2 2 0 591
Ivory Coast M1 12 68 11 3 2 2 1 1 483
M3 16 45 26 4 5 2 0 1 518
Kyrgyzstan M2 7 40 2 10 22 4 13 1 503
M3 8 47 1 8 15 5 13 2 528
Moldova M3 8 33 10 9 18 9 13 0 418
M5 7 33 9 8 18 12 11 1 439
Namibia M1 26 22 18 16 9 5 4 0 483
M4 28 29 12 14 7 3 7 0 407
Peru M3 11 36 35 4 7 3 4 0 550
M4 12 41 21 5 11 5 5 0 543
Philippines M2 13 53 22 4 4 2 1 1 654
M3 12 53 18 7 6 2 2 1 606
Tunisia M2 11 38 9 22 0 7 12 1 806
M3 9 41 8 19 3 8 11 1 745
Vietnam M3 5 50 19 2 10 4 9 1 554
M4 9 59 14 0 3 3 9 1 589
* These categories differed between version A (model 2) and version B (all other models) – see paras 40 to 43 of the report for more details

Measuring Main Activity in Labour Force Surveys: Main findings from the ILO LFS pilot studies 41
Table A4: Main activity by country and model (% of WAP) - Females
Studying Working for
income*
Foodstuff
production* Seeking
work
Household
resp. Illness Retired Other WAP
% of respondents in WAP No.
Cameroon M1 16 28 30 5 13 5 1 1 615
M5 17 26 32 5 14 4 2 1 547
Ecuador M3 12 21 11 2 47 4 2 1 603
M5 11 29 13 3 40 4 0 0 581
Ivory Coast M1 11 39 18 7 18 3 1 3 506
M3 12 27 21 10 23 4 0 2 542
Kyrgyzstan M2 10 22 0 2 43 2 22 1 604
M3 9 17 0 2 46 3 22 1 634
Moldova M3 8 25 3 3 26 9 25 2 462
M5 8 25 3 4 30 11 18 0 486
Namibia M1 18 18 24 14 14 4 6 0 669
M4 22 24 15 9 16 3 11 0 563
Peru M3 10 23 14 3 41 6 2 0 570
M4 11 25 11 1 45 5 3 0 563
Philippines M2 9 38 11 2 34 3 2 1 675
M3 11 39 10 3 32 2 2 1 627
Tunisia M2 15 15 7 16 39 5 3 0 822
M3 9 11 5 18 46 7 4 1 760
Vietnam M3 6 43 18 0 17 5 8 2 624
M4 6 53 17 1 8 4 7 4 653
* These categories differed between version A (model 2) and version B (all other models) – see paras 40 to 43 of the report for more details