Measuring Instructor Effectiveness in Higher Education
49
NBER WORKING PAPER SERIES MEASURING INSTRUCTOR EFFECTIVENESS IN HIGHER EDUCATION Pieter De Vlieger Brian Jacob Kevin Stange Working Paper 22998 http://www.nber.org/papers/w22998 NATIONAL BUREAU OF ECONOMIC RESEARCH 1050 Massachusetts Avenue Cambridge, MA 02138 December 2016 We are very grateful to Hinrich Eylers and Ashok Yadav at the University of Phoenix for many discussions and for providing access to the data. This paper was prepared for the NBER Conference “Productivity in Higher Education” held on June 1, 2016. We also are grateful for useful feedback from Caroline Hoxby and other participants at the conference and at the University of Michigan Causal Inference in Education Research Seminar. The views expressed herein are those of the authors and do not necessarily reflect the views of the National Bureau of Economic Research. NBER working papers are circulated for discussion and comment purposes. They have not been peer-reviewed or been subject to the review by the NBER Board of Directors that accompanies official NBER publications. © 2016 by Pieter De Vlieger, Brian Jacob, and Kevin Stange. All rights reserved. Short sections of text, not to exceed two paragraphs, may be quoted without explicit permission provided that full credit, including © notice, is given to the source.
Transcript of Measuring Instructor Effectiveness in Higher Education

NBER WORKING PAPER SERIES
MEASURING INSTRUCTOR EFFECTIVENESS IN HIGHER EDUCATION
Pieter De VliegerBrian Jacob
Kevin Stange
Working Paper 22998http://www.nber.org/papers/w22998
NATIONAL BUREAU OF ECONOMIC RESEARCH1050 Massachusetts Avenue
Cambridge, MA 02138December 2016
We are very grateful to Hinrich Eylers and Ashok Yadav at the University of Phoenix for many discussions and for providing access to the data. This paper was prepared for the NBER Conference “Productivity in Higher Education” held on June 1, 2016. We also are grateful for useful feedback from Caroline Hoxby and other participants at the conference and at the University of Michigan Causal Inference in Education Research Seminar. The views expressed herein are those of the authors and do not necessarily reflect the views of the National Bureau of Economic Research.
NBER working papers are circulated for discussion and comment purposes. They have not been peer-reviewed or been subject to the review by the NBER Board of Directors that accompanies official NBER publications.
© 2016 by Pieter De Vlieger, Brian Jacob, and Kevin Stange. All rights reserved. Short sections of text, not to exceed two paragraphs, may be quoted without explicit permission provided that full credit, including © notice, is given to the source.

Measuring Instructor Effectiveness in Higher EducationPieter De Vlieger, Brian Jacob, and Kevin StangeNBER Working Paper No. 22998December 2016JEL No. I23,J24,J44
ABSTRACT
Instructors are a chief input into the higher education production process, yet we know very little about their role in promoting student success. This is in contrast to elementary and secondary schooling, for which ample evidence suggests teacher quality is an important determinant of student achievement. Whether colleges could improve student and institutional performance by reallocating instructors or altering personnel policies hinges on the role of instructors in student success. In this paper we measure variation in postsecondary instructor effectiveness and estimate its relationship to overall and course-specific teaching experience. We explore this issue in the context of the University of Phoenix, a large for-profit university that offers both online and in-person courses in a wide array of fields and degree programs. We focus on instructors in the college algebra course that is required for all BA degree program students. We find substantial variation in student performance across instructors both in the current class and subsequent classes. Variation is larger for in-person classes, but is still substantial for online courses. Effectiveness grows modestly with course-specific teaching experience, but is unrelated to pay. Our results suggest that personnel policies for recruiting, developing, motivating, and retaining effective postsecondary instructors may be a key, yet underdeveloped, tool for improving institutional productivity.
Pieter De VliegerUniversity of Michigan735 South State StreetAnn Arbor, MI [email protected]
Brian JacobGerald R. Ford School of Public Policy University of Michigan735 South State StreetAnn Arbor, MI 48109and [email protected]
Kevin StangeGerald R. Ford School of Public PolicyUniversity of Michigan5236 Weill Hall735 South State StreetAnn Arbor, MI 48109and [email protected]

I. Introduction
Professors and instructors are a chief input into the higher education production process, yet we
know very little about their role in promoting student success. There is growing evidence that teacher
quality is an important determinant of student achievement in K12, with some school districts identifying
and rewarding teachers with high value-added. Yet relatively little is known about the importance of or
correlates of instructor effectiveness in postsecondary education. Such information may be particularly
important at the post-secondary level, in which administrators often have substantial discretion to
reallocate teaching assignments not only within a specific class of instructors (e.g., tenured faculty), but
across instructor types (e.g., adjuncts vs. tenured faculty).
There are a number of challenges to measuring effectiveness in the context of higher education.
Unlike the K12 context, there are rarely standardized test scores to use as an outcome. Furthermore, to the
extent that college courses and majors intend to teach a very wide variety of knowledge and skills, it is
harder to imagine an appropriate outcome as a conceptual matter. The issue of non-random student
sorting across instructors is arguably more serious in the context of higher education because students
have a great deal of flexibility in the choice classes and the timing of these classes. Finally, one might
have serious concerns about the attribution of a particular skill to a specific instructor given the degree to
which knowledge spills over across courses in college (e.g., the importance of calculus in intermediate
microeconomics or introductory physics, the value of English composition in a history classes where the
grade is based almost entirely on a term paper, etc.) For many reasons, the challenge of evaluating
college instructors is more akin to the problem of rating physicians.
This paper addresses two main questions. First, is there variation in instructor effectiveness in
higher education? We examine this in highly standardized setting where one would expect minimal
variation in what instructors actually do. Second, how does effectiveness correlate with teaching
experience and salary? This informs whether teaching assignment and personnel policies could be used to
increase effectiveness and institutional productivity. We examine these questions using detailed
administrative data from the University of Phoenix (UPX), the largest university in the world, which
offers both online and in-person courses in a wide array of fields and degree programs. We focus on
instructors in the college algebra course that is required for all students in BA degree programs and that
often is a roadblock to student attainment.
This context provides several advantages. Our sample includes more than two thousand
instructors over more than a decade in campuses all across the United States. This allows us to generate
extremely precise estimates, and to generalize to a much larger population than has been the case in
previous studies. Most students in these courses take a common, standardized assessment that provides an
objective outcome by which to measure instructor effectiveness. And, as we describe below, student
2

enrollment and course assignment is such that we believe the issue of sorting is either non-existent (in the
case of the online course) or extremely small (in the case of face-to-face or FTF courses).
The UPX is different than what some might think of as the “traditional” model of higher
education, in which tenured faculty at selective institutions teach courses they develop themselves. UPX
is a for-profit institution with contingent (i.e., non-tenured, mostly part-time) faculty, and the courses are
highly standardized, with centrally prepared curriculum materials and assessments (both online and face-
to-face sections). So, while our findings may not generalize to all sectors of higher education, we believe
it will be relevant for the growing for-profit sector and possibly less-selective 4-year and community
colleges that share many of these same traits. A limitation of prior research is that it focuses on largely
selective non-profit or public institutions, which are quite different from the non-selective or for-profit
sectors. It is in these settings with many contingent faculty and institutions whose primary purpose is
instruction (rather than, say, research) where productivity-driven personnel policies could theoretically be
adapted.
We find substantial variation in student performance across instructors. A 1 SD increase in
instructor quality is associated with 0.30 SD increase in grades in current course and a 0.20 SD increase in
grades in the subsequent course in the math sequence. Unlike some prior work (Carrell and West 2010),
we find a positive correlation between instructor effectiveness measured by current and subsequent course
performance overall and for face-to-face courses. The variation in instructor effectiveness is larger for in-
person courses, but still substantial for online courses. These broad patterns and magnitudes are robust to
extensive controls to address any possible non-random student sorting, using test scores that are less
likely to be under the control of instructors, and other specification checks. These magnitudes are
substantially larger than found in the K12 literature and in the Carrell and West (2010) study of the Air
Force Academy, but comparable to the recent estimates from DeVry University (Bettinger at al. 2015).
Furthermore, instructor effects on future course performance has little correlation with student end-of-
course evaluations, the primary metric through which instructor effectiveness is currently judged.
Salary is primarily determined by tenure (time since hire), but is mostly uncorrelated with
measured effectiveness or course-specific teaching experience, both in the cross-section and for
individual teachers over time. However, effectiveness grows modestly with course-specific teaching
experience but is otherwise unrelated to time since hire. Given the disconnect between pay and
effectiveness, the performance differences we uncover translate directly to differences in productivity
from the University’s perspective. These large productivity differences imply that personnel decisions and
policies that attract, develop, allocate, motivate, and retain faculty are a potentially important tool for
improving student success and productivity at the University of Phoenix. Our study institution – like
almost all others – measures faculty effectiveness through optional student end-of-course evaluations,
3

despite only minimal correlation between evaluation scores and our measures of effectiveness. Thus
current practices are not doing a great job of identifying or supporting effective instructors. Though
policy-makers and practitioners have recently paid a lot of attention to the importance of teachers in
elementary and secondary school, there is surprisingly little attention paid to the importance of instructors
or instructor-related policies and practices at the postsecondary level.
The remainder of this paper proceeds as follows. We discuss prior evidence on college instructor
effectiveness and our institutional context in Section II. Section III introduces our administrative data
sources and our analysis sample. Section IV presents our empirical approach and examines the validity of
our proposed method. Our main results quantifying instructor effectiveness are presented in Section V.
Section VI examines how instructor effectiveness correlates with experience. Section VII concludes by
discussing the implications of our work for institutional performance and productivity.
II. Prior Evidence and Institutional Context
A. Prior Evidence
There is substantial evidence that teacher quality is an important determinant of student achievement in
elementary and secondary education (Rockoff, 2004; Rivkin, Hanushek, and Kain, 2005; Rothstein, 2010;
Chetty, Friedman, Rockoff, 2014). Many states and school districts now incorporate measures of teacher
effectiveness into personnel policies in order to select and retain better teachers (Jackson, Rockoff,
Staiger, 2014). Yet little is known about instructor effectiveness in postsecondary education, in part due
to difficulties with outcome measurement and self-selection. Standardized assessments are rare and
grading subjectivity across professors makes outcome measurement difficult. In addition, students often
choose professors and courses, so it is difficult to separate instructors’ contribution to student outcomes
from student sorting. As a consequence of these two challenges, only a handful of existing studies
examine differences in professor effectiveness.
Several prior studies have found that the variance of college instructor effectiveness is small
compared to what has been estimated for elementary teachers. Focusing on large, introductory courses at
a Canadian research university, Hoffmann and Oreopoulos (2009a) find the standard deviation of
professor effectiveness in terms of course grades is no larger than 0.08. Carrell and West (2010) examine
students at the U.S. Air Force Academy, where grading is standardized and students have no choice over
coursework or instructors. They find sizeable differences in student achievement across professors
teaching the same courses, roughly 0.05 SD, which is about half as large as in the K12 sector.
Interestingly, instructors that were better at improving contemporary performance received higher teacher
evaluations but were less successful at promoting “deep-learning”, as indicated by student performance in
subsequent courses. Braga, Paccagnella, Pellizzari (2016) estimate teacher effects on both student
4

academic achievement and labor market outcomes at Bocconi University. They also find significant
variation in teacher effectiveness, roughly 0.05 SD both for academic and labor market outcomes. They
find only a modest correlation of instructor effectiveness in academic and labor market outcomes.
Two recent studies have concluded that instructors play a larger role in student success. Bettinger,
Fox, Loeb, and Taylor (2015) examine instructor effectiveness using data from DeVry University, a large
for-profit institution in which the average student takes two-thirds of her courses online. They find a
variance of instructor effectiveness that is substantially larger than prior studies in higher education.
Specifically, they find that being taught by an instructor that is 1 SD more effective improves student
course grades by about 0.18 to 0.24 SD. The estimated variation is 15% lower when courses are online,
even among instructors that teach in both formats. Among instructors of economics, statistics, and
computer science at an elite French public university, Brodaty and Gurgand (2016) find that a 1 SD
increase in teacher quality is associated with a 0.14 or 0.25 SD increase in student test scores, depending
on the subject.
A few studies have also examined whether specific professor characteristics correlate with
student success, though the results are quite mixed.1 Using institutional-level data from a sample of U.S.
universities, Ehrenberg and Zhang (2005) examine the effects of adjuncts (part-time faculty) on student
dropout rates. They find a negative relationship between the use of adjuncts and student persistence,
though they acknowledge that this result could stem, in part, from non-random sorting of students across
schools. Hoffmann and Oreopoulos (2009a) find no relationship between faculty rank (including adjuncts
and tenure-track faculty) and subsequent course enrollment. Two other studies find positive effects of
adjuncts. Studying course-taking among students in public four-year institutions in Ohio, Bettinger and
Long (2010) find adjuncts are more likely to induce students to take further courses in the same subject.
Using a sample of large, introductory courses taken by first-term students at Northwestern University,
Figlio, Schapiro, and Soter (2013) find that adjuncts are positively associated with subsequent course-
taking in the subject as well as performance in these subsequent courses. In their study of the U.S. Air
Force Academy, Carrell and West (2010) find that academic rank, teaching experience, and terminal
degree are positively correlated with follow-on course performance, though negatively related to
contemporary student performance.
There is also evidence that gender and racial match between students and instructors influences
students’ interest and performance (Bettinger and Long, 2005; Hoffmann and Oreopoulos, 2009b; Fairlie,
Hoffmann, Oreopoulos, 2014). Finally, Hoffmann and Oreopoulos (2009a) find that students’ subjective
evaluations of professors are a much better predictor of student academic performance than objective
professor characteristics such as rank. This echoes the finding of Jacob and Lefgren (2008) that
1 Much of this evidence is reviewed in Ehrenberg (2012).
5

elementary school principals can identify effective teachers, but that observed teacher characteristics tend
to explain little of teacher effectiveness.
A limitation of this prior research is that it focuses largely on selective non-profit or public
institutions, which are quite different from the non-selective or for-profit sectors that constitute a large
and growing share of the postsecondary sector. It is in these settings with many contingent faculty and
institutions whose primary purpose is instruction (rather than, say, research) where productivity-driven
personnel policies could theoretically be adapted. Students at these types of institutions also have lower
rates of degree completion, so facilitating these students’ success is thus particularly important policy
goal. The one prior study examining a setting similar to ours (Bettinger et al’s 2015 study of Devry
University) focuses on differences in student performance between online and in-person formats, with
very little attention paid to instructors. The simultaneous consideration of multiple outcomes and how the
exploration of how effectiveness varies with salary and teaching experience is also novel in the
postsecondary literature.
B. Context: College Algebra at The University of Phoenix
We study teacher effectiveness in the context of the University of Phoenix, a large for-profit university
that offers both online and face-to-face (FTF) courses. UPX offers a range of programs, including AA,
BA and graduate degrees, while also offering à-la carte courses. We focus on core mathematics courses,
MTH/208 and MTH/209 (College Mathematics I and II), which are a requirement for most BA programs.
Below we describe these courses, the process through which instructors are hired and evaluated, and the
mechanism through which students are allocated to instructors.2
MTH208 and MTH209
BA-level courses at UPX are typically five weeks in duration and students take one course at a time
(sequentially), in contrast to the typical structure at most universities. The MTH/208 curriculum focuses
on setting up algebraic equations and solving single and two-variable linear equations and inequalities.
Additionally, the coursework focuses on relating equations to real-world applications, generating graphs,
and the use of exponents. MTH/209 is considered a logical follow-up course, focusing on more
complicated, non-linear equations and functions. Students in our sample take MTH208 after completing
about eight other courses, so enrollment in the math course sequence does signify a higher level of
commitment to the degree program than students in the most entry-level courses. However, many students
struggle in these introductory math courses and they are regarded by UPX staff as an important obstacle
to obtaining a BA for many students.
2 This description draws on numerous conversations between the research team and individuals at the University of Phoenix.
6

Students can take these courses online or in-person. In the face-to-face sections, students attend
four hours of standard in-class lecture per week, typically held on a single day in the evening. In addition,
students are required to work with peers roughly four hours per week on what is known as “learning
team” modules. Students are then expected to spend 16 additional hours outside of class reading material,
working on assignments and studying for exams.3
Online courses are asynchronous, which means that a set of course materials is provided through
the online learning platform, and instructors provide guidance and feedback through online discussion
forums and redirect students to relevant materials when necessary. There is no synchronous or face to
face interaction with faculty in the traditional sense, but students are required to actively participate in
online discussions by substantively posting six to eight times per week over three to four days. One
instructor defined a substantive post as having substantial math content:
Substantial math content means you are discussing math concepts and problems. A substantive
math post will have at least one math problem in it. Simply talking "around" the topic (such as, "I
have trouble with the negative signs" or "I need to remember to switch the signs when I divide by
a negative coefficient") will not be considered substantive. (Morris, 2016).
Online participation is the equivalent of the four hours of classes for the FTF sections.4
There are substantial differences between the two course modes in terms of curriculum and
grading flexibility. Both courses have standardized course curricula, assignments, and tests that are made
available to the instructors. Grading for these components is performed automatically through the course
software. However, FTF instructors sometimes provide students with their own learning tools, administer
extra exams and homework, or add other components that are not part of the standard curriculum. In
contrast, online instructors mainly take the course materials and software as given, and interaction with
students for these teachers is mainly limited to the online discussion forum. In both online and FTF
courses, teachers are able to choose the weights they assign to specific course components for the final
grade. As discussed below, for this reason we also use student performance on the final exam as an
outcome measure.
Hiring and allocation of instructors
The hiring and onboarding process of teachers is managed and controlled by a central hiring committee
that is hosted at the Phoenix campus, though much input comes from local staff at ground campuses.
3 There have been recent reductions in the use of learning team interactions in the past two years, but these changes occurred after our analysis sample. 4 The posting requirements actually changed over time - for the majority of the time of the study, the requirement was four days a week, two substantive posts per day (i.e., eight posts). In the past several years, it went to six times per week, on at last three days (effectively, allowing for two single post days).
7

First, this committee checks whether a new candidate has the appropriate degree.5 Second, qualified
candidates then go through a five-week standardized training course they need to pass. This includes a
mock lecture for FTF instructors and a mock online session for online instructors. Third, and finally, an
evaluator sits in on the first class or follows the online course to ensure the instructor performs according
to university standards. Salaries are relatively fixed, but do vary somewhat with respect to degree and
tenure.6 We should note that the actual hiring process for instructors may deviate from this description for
certain campuses or in time periods when positions are particularly difficult to fill.
The allocation of instructors to classes is essentially random for online classes. About 60
MTH/208 sections are started weekly and the roster is only made available to students two or three days
before the course starts, at which point students are typically enrolled. The only way to sidestep these
teacher assignments is by dropping the course altogether and enrolling in a subsequent week.
For FTF sections, the assignment works differently, since most campuses are too small to have
different sections concurrently and students may need to wait for a few months if they decide to take the
next MTH/208 section at that campus. While this limits the ability of students to shop around for a better
teacher, the assignment of students to these sections is likely to be less random than for online sections.
For this reason, we rely on value-added models that control for a host of student-specific characteristics
that may correlate with both instructor and student course performance.
Evaluation and retention of instructors
UPX has in place three main evaluation tools to keep track of the performance of instructors.
First, instructors need to take a yearly refresher course on teaching methods, and an evaluator will
typically sit in or follow an online section every year to ensure the quality of the instructor still meets the
university’s requirements. Second, there is an in-house data analytics team that tracks key performance
parameters. These include average response time to questions asked through the online platform, or
indicators that students in sections are systematically getting too high (or too low) overall grades. For
instance, if instructors consistently give every student in a section full or very high marks, this will raise a
flag, and the validity of these grades will be verified. Finally, additional evaluations can be triggered if
students file complaints about instructor performance. If these evaluation channels show the instructor has
not met the standards of the university, the instructor receives a warning. Instructors that have received a
warning are followed up more closely in subsequent courses. If the instructor performance does not
improve, the university will not hire the person back.
5 For MTH/208 sections, for instance, a minimum requirement might be having a master’s degree in mathematics, or a master’s degree in biology, engineering or similar coursework, along with a minimum number of credits in advanced mathematics courses and teaching experience in mathematics. 6 For instance, all else equal, instructors with a Ph.D. can expect a higher salary than instructors with a master’s degree. Additionally, tenure in this context refers to the date of first hire at the University of Phoenix. Salary differences are larger among new instructors, and tend to diminish at higher levels of experience.
8

III. Data
We investigate variation in instructor effectiveness using data drawn from administrative UPX
records. This section describes these records, the sample selection, and descriptive statistics. While the
data we analyze has very rich information about the experiences of students and instructors while at the
University of Phoenix, information on outside activities is limited.
A. Data Sources
We analyze university administrative records covering all students and teachers who have taken or taught
MTH/208 at least once between July 2000 and July 2014. The raw data contains information on 2,343
instructors that taught 34,725 sections of MTH/208 with a total of 396,038 student-section observations.
For all of these instructors and students, we obtain the full teaching and course-taking history back to
2000.7 Our analysis spans 84 campuses (plus the online campus). There is typically one campus per city,
but some larger metropolitan areas have multiple physical locations (branches) at which courses are
offered. 8
Instructors
We draw on three information sources for instructor level characteristics. A first dataset provides
the full teaching history of instructors that have ever taught MTH/208, covering 190,066 class sections.
Information includes the campus and location of instruction, subject, the number of credits, and start date
and end date of the section.
For each instructor x section observation, we calculate the instructor’s teaching load for the
current year, as well as the number of sections he or she had taught in the past separately for MTH/208
and other courses. This allows us to construct a variety of different experience measures, which we use in
the analysis below. As the teaching history is censored before the year 2000, we only calculate the
cumulative experience profile for instructors hired in the year 2000 or later.
The second dataset contains self-reported information on ethnicity and gender of the instructor,
along with complete information on the date of first hire, the type of employment (full-time or part-time)
and the zip code of residence.9 A unique instructor identifier allows us to merge this information onto the
7 The administrative records are not available before 2000 because of information infrastructure differences, leading to incomplete teaching and course-taking spells for professors and students respectively. 8 There are more than 200 physical locations corresponding to these 84 campuses because some have multiple physical locations (branches). 9 This instructor dataset also contains information on birth year and military affiliation. These variables, however, have high non-response rates and are therefore not used for the analysis.
9

MTH/208 sections.10 A third dataset contains the salary information for the instructor of each section,
which can be merged onto the MTH/208 sections using the unique section identifier.
Students
Student level information combines four data sources: demographics, transcript, assessment, and
student end-of-course evaluations. The demographics dataset provides information on the zip code of
residence, gender, age of the student, program the student is enrolled in, program start, and program end
date. 11 A unique student identifier number allows us to merge this information onto the course-taking
history of the student.
Transcript data contains complete course-taking history including the start and end date of the
section, campus of instruction, grade, and number of credits. Every section has a unique section identifier
that allows for matching students to instructors. Additionally, student level information includes course
completion, course grade, earned credits, along with a unique student identifier that allows for merging on
the student demographics.
Moreover, for sections from July 2010 to March 2014, or roughly 30 percent of the full sample,
we have detailed information on student performance separately by course assignment or assessment,
which includes everything from individual homework assignments to group exercises to exams. We use
this data to obtain a final exam score for each student when available. Because the data does not have a
single, clear code for final exam component across all sections, and instructors have discretion to add
additional final exam components, we use a decision rule to identify the “best” exam score for each
student based on the text description of the assessment object. Approximately 11% of observations have
a single score clearly tied to the common computer-administered final assessment, 77% have a single
assessment for a final exam (but we cannot be certain it is from the standardized online system), and the
remainder have final exam assessments that are a little more ambiguous. Discussions with UPX personnel
indicated that the vast majority of instructors use the online standardized assessment tool with no
customization, but unfortunately this is not recorded in the administrative data. Nonetheless, results
excluding this latter group are quite similar to analysis with the full sample. Our approach is outlined in
Appendix B.
While the analysis focuses on course grades and final test scores, it also considers future
performance measures, such as grades and cumulative grade point average earned in the 180 or 365 days
10 The instructor identifier is, in principle, unique. It is possible, however, that an instructor shows up under two different identifiers if the instructor leaves the university and then returns after a long time. While this is a possibility, UPX administrators considered this unlikely to be a pervasive issue in their records. 11 Similar to the instructor dataset, demographic data are self-reported. While information on gender and age is missing for less than 1% of the sample, information on ethnicity, veteran status, and transfer credits exhibit much larger non-response rates and are therefore not used for the analysis.
10

following the MTH/208 section of interest. Given the linear, one-by-one nature of the coursework, these
measures capture the effect instructors have on moving students towards obtaining a final degree.
Finally, for sections taught between March 2010 and July 2014, we obtained student end-of-
course evaluations. Students are asked whether they would recommend the instructor on a ten point scale.
Recommendation scores of 8 or above are considered “good” and are the primary form that the
evaluations are used by the University of Phoenix administration. We follow this practice and use a
binary indicator for whether the recommendation score is at least 8 as our primary evaluation measure.
End of course evaluations are optional for students so have a relatively low response rate. Only 37% of
students provide a course evaluation score for Math 208, which is less than half of the students that have a
final exam test score for Math 208. While non-random missing evaluations could create bias in our
estimates of teacher effectiveness, this bias is also present in the evaluations as used by the institution.
Our goal is to see how evaluations as currently used in practice correlate with more objective measures of
teacher effectiveness.
Census data
In addition to the UPX administrative school records, we use several census data resources to get
additional variables capturing the characteristics of students’ residential neighborhoods. In particular, we
obtain the unemployment rate, median family income, the percentage of family below the poverty line,
and the percentage with a bachelor degree or higher of students’ home zip code, from the 2004-2007 five-
year ACS files.
B. Sample Selection
Starting from the raw data, we apply several restrictions on the data to obtain the primary analysis
sample. We restrict our analysis to the 33,200 Math 208 sections that started between January 2001 and
July 2014. We then drop all students with missing data for final grade or unusual grades (0.1% of
students) as well as students who do not show up in the student demographics file (0.3% of remaining
students).12 We then drop all cancelled sections (0.02 percent of the sections), sections with fewer than 5
enrolled students who had non-missing final grade and did not withdraw from the course (11.4 percent of
the remaining sections) and sections for which the instructor is paid less than $300 (5.2 percent of
remaining sections). We believe the final two restrictions exclude sections that were not actual courses,
but rather independent studies of some sort. We also drop sections for which the instructor does not show
up in the teacher demographics file, which is 3.5 percent of the remaining sections.
12 We keep students with grades A-F, I/A-I/F (incomplete A-F) or W (withdraw). Roughly 0.1% of scores are missing or not A-F or I/A-I/F (incomplete), and we drop these. These grades include AU (audit), I (incomplete), IP, IX, OC, ON, P, QC and missing values.
11

To calculate instructor experience, we use an instructor-section panel that drops observations
where there is no salary information (about 3% of sections), the section was cancelled (0.04%), and with
less than 5 students (21.7% of the remaining sections) or for which instructor is paid less than $300 (8.6%
of the remaining sections). As above, these final two restrictions are meant to exclude independent study
type courses or other unusual courses that may enter differently into the teacher human capital function.13
We then calculate several experience measures based on this sample. We calculate measures of
experience such as number of courses taught in the previous calendar year and total cumulative
experience in MTH208 specifically and in other categories of classes. The complete cumulative
experience measures are only fully available for instructors that were hired after 2000, since the teaching
history is not available in prior years.
Finally, we drop data from nine campuses because none of the instructors we observe in these
campuses ever taught in another physical campus or online. As discussed in the section below, in order to
separately identify campus and instructor fixed effects, each campus must have at least one instructor that
has taught in a different location. Fortunately, these nine campuses represent only 2 percent of the
remaining sections and 4 percent of remaining instructors.
The final analysis sample consists of 339,844 students in 26,384 sections, taught by 2,243 unique
instructors. The sub-sample for which final exam data is available includes 94,745 students in 7,232 Math
208 sections taught by 1,198 unique instructors. We calculate various student characteristics from the
transcript data, including cumulative grade point average and cumulative credits earned prior to enrolling
in MTH208, as well as future performance measures. In the rare case of missing student demographics,
we set missing to zero and include an indicator variable for missing.
C. Descriptive statistics
We report key descriptive statistics for the final analysis sample, spanning January 2001 to July
2014, in Table 1. We report these statistics for all sections, and for FTF and online sections separately.
Table 1a reports section and instructor characteristics for the 26,384 Math 208 sections, while Table 1b
reports student background characteristics and student performance measures. About half of all sections
are taught online, and instructors are paid about $950 for teaching a course, regardless of the instruction
mode.14 Instructors are majority white and male and have been at the university just under five years.
They typically have taught more than 40 total course sections since joining the faculty, of which 15 were
13 There are three instructors that are first employed part-time and then employed full-time. As the part-time spells are longer than the full-time spells, we use the part-time demographics only. This restriction only impacts the employment type and date of first hire, as the other demographics are the same for the two employment spells for all three instructors. 14 The earnings measures are deflated using the national CPI. For each year, the CPI in April was used, with April 2001 as the base.
12

Math 208 and 10 were Math 209. Instructors teaching online sections tend to specialize more in teaching
Math 208 compared to their counterparts teaching FTF sections. Class size is about 13 students and is
slightly larger for FTF than online sections. Tables A1a and A1b in the appendix report descriptive
statistics for the sample for which test scores are available (July 2010 – March 2014). The test score
sample is quite similar to the full sample, though the instructors are typically more experienced.
Table 1b provides an overview of student characteristics and performance. The students enrolled
in these sections tend to be female, around 35 years old, and typically have taken 23 credits worth of
classes at UPX, earning a GPA of 3.35, when beginning MTH208. Students in online sections tend to
have earned somewhat fewer credits than their counterparts in FTF sections, and are more likely to have
taken Math 208 before. Most students, both in FTF and online sections, are enrolled in a business or
general studies program.
Students across both modes of instruction are equally likely to earn a grade of A (about 32%) or
B (about 27%) and have similar final exam scores (70%) when available. Consistent with prior work,
online students are more likely to withdraw from and less likely to pass MTH208 than students in FTF
sections. In terms of student performance after taking Math 208, we find that FTF students are more
likely to go on and take Math 209.15 Students earn about 10.5 credits in the six months following the
Math 208 section, with a two-credit gap between FTF and online students. Participation in end-of-course
evaluations is similar across formats, though FTF students generally report a greater level of instructor
satisfaction.
IV. Empirical Approach
Our main aim is to characterize the variation in student performance across instructors teaching the
same courses. Consider the standard “value-added” model of student achievement given in equation (1):
𝑌𝑌𝑖𝑖𝑖𝑖𝑖𝑖𝑖𝑖 = 𝛽𝛽1𝑋𝑋𝑖𝑖 + 𝛽𝛽2𝑍𝑍𝑖𝑖𝑖𝑖𝑖𝑖 + ∅𝑖𝑖 + 𝜃𝜃𝑖𝑖 + 𝑒𝑒𝑖𝑖𝑖𝑖𝑖𝑖𝑖𝑖 (1)
where 𝑌𝑌𝑖𝑖𝑖𝑖𝑖𝑖𝑖𝑖 is the outcome of student i in section j taught by instructor k during term t. The set of
parameters 𝜃𝜃𝑖𝑖 quantify the contribution of instructor k to the performance of their students, above and
beyond what could be predicted by observed characteristics of the student (𝑋𝑋𝑖𝑖), course section (𝑍𝑍𝑖𝑖𝑖𝑖𝑖𝑖), or
time period. The variance of 𝜃𝜃𝑖𝑖 across instructors measures the dispersion of instructor quality and is our
primary parameter of interest. We are particularly interested in how the distribution of 𝜃𝜃𝑖𝑖 varies across
outcomes and formats, and how effectiveness covaries across outcomes.
15 Conditional on taking Math 209, both online and FTF students typically take this class about a week after the Math 208 section.
13

Estimation of the standard value-added model in (1) must confront three key issues. First, non-
random assignment of students to instructors or instructors to course sections could bias value-added
models. In the presence of non-random sorting, differences in performance across sections could be
driven by differences in student characteristics rather than differences in instructor effectiveness per se.
Second, outcomes should reflect student learning rather than grading leniency or “teaching to the test” of
instructors. Furthermore, missing outcomes may bias instructor effects if follow-up information
availability is not random. Third, our ability to make performance comparisons between instructors across
campuses while also controlling for cross-campus differences in unobserved student factors relies on the
presence of instructors that teach at multiple campuses. We address each of these in turn below.
A. Course and Instructor Assignment
In many education settings, we worry about non-random assignment of instructors to sections
(and students) creating bias in VA measures (Rothstein, 2009; Chetty, Friedman, Rockoff, 2014). In
general, we believe that there is relatively little scope for sorting in our setting. Students do not know
much about the instructor when they enroll, and instructors are only assigned to specific sections about
two days before the start of the course for online sections. Students who have a strong preference with
regard to instructor can choose to drop the course once they learn the instructor’s identity, but this would
mean that they would likely have to wait until the start of the next session to take the course, at which
point they would be randomly assigned to a section again. According to UPX administrators, there is no
sorting at all in online courses, which is plausible given the very limited interaction students with have
with instructors in the initial meetings of the course. UPX admits the possibility of some sorting in FTF
courses, but believe this is likely minimal.
To explore the extent of sorting, we conduct two types of tests. First, we test whether observable
instructor characteristics correlate with the observable characteristics of students in a section. To do so,
we regress mean student characteristics on instructor characteristics, where each observation is a course
section.16 Table 2 reports the estimates from three regression models which differ in terms of the type of
fixed effects that are included. Once we include campus fixed effects, there are very few systematic
correlations between student and instructor characteristics and any significant relationships are
economically insignificant. To take one example, consider incoming student GPA, which is the single
biggest predictor of student success in MTH208. Whether the instructor was hired in the last year is
statistically significantly related to incoming student GPA once campus fixed effects are included, yet this
difference is only 0.012 grade points, or 0.3% of the sample mean. Similar patterns are seen for all other
16 An alternate approach would be to regress each student characteristic on a full set of course section dummies along with campus (or campus-year) fixed effects, and test whether the dummies are jointly equal to zero. This is equivalent to jointly testing the equality of the means of the characteristics across class sections.
14

observable student and instructor characteristics we examine. In results not reported here, but available
upon request, we continue to find no significant relationship between instructor and student characteristics
for subsamples limited to only online sections and to sections with final exam scores.
In addition, we follow the procedure utilized by Carrell and West (2010) to test whether the
distribution of student characteristics across sections are similar to what you would get from random
assignment within campus and time. ). In a first step, we take the pool of students in a campus-year cell,
randomly draw sections of different sizes (based on the actual distribution), and compute the statistic of
interest for these random sections. Similar to test 1, the statistics of interest are average age, fraction male,
average prior credits, and average prior GPA. By construction, the resulting distribution of these section-
level characteristics is obtained under random assignment of students to sections. In a second step, we
take each actual section and compare the actual student average of each baseline characteristic to the
counterfactual distribution for the relevant campus-year combination by calculating the p-value. For
instance, we take a section, compute the average age, and compute the fraction of counterfactual sections
with values smaller than the actual value. For each campus-year combination, we therefore obtain a
number of p-values equal to the number of sections held at that campus-year combination. In a final step,
we test for random assignment by testing the null hypothesis that these p-values are uniformly distributed.
Intuitively, we are equally likely to draw any percentile under random assignment, which should result in
these p-values having a uniform distribution. If, for instance, we have systematic sorting of student
according to age, we would find we are more likely to find low and high percentiles, and the p-values
would not exhibit a uniform distribution
Similar to Carrell and West (2010), we test the uniformity of these p-values using the Chi-square
goodness-of-fit test, and a Kolmogorov-Smirnov test with a 5% significance level. We draw
counterfactual distributions at the campus-year level, leading to 763 tests of the null hypothesis of
uniformity of the p-values. We find that the null hypothesis is rejected in 56 cases using the Chi-square
goodness-of-fit test, and in 51 cases using the Kolmogorov-Smirnov test, which is about 6-7%. Given that
the significance level of these tests was 5%, we conclude that these tests do not reject the null hypothesis
of random assignment of students to sections for these specific observables.
B. Outcomes
Unlike the elementary and secondary setting in which teacher effectiveness has been studied
extensively using standardized test scores, appropriate outcomes are more difficult to identify in the
higher education context. Following prior studies in the literature, we examine not only contemporaneous
course performance as measured by students’ course grades, but also enrollment and performance
(measured by grades) in subsequent courses in the same subject.
15

An important limitation of grades as a measure of course performance is that they reflect, at least
in part, different grading practices. This may be particularly worrisome in the context of FTF courses at
UPX because many students have the same instructor for Math 208 and 209. Thus lenient or subjective
grading practices in 208 may be correlated with the same practices in 209, meaning that the Math 209
grade is not an objective measure of long-run learning from Math 208. For a subset of our sample, we are
able to examine student performance on the final examination for Math 208 and/or Math 209. It also is
informative to compare test-based measures to grade-based measures simply because the grade-based
measures are easier for the universities to implement. It is informative to know how far from the more
“objective” measures using course grades deviates. In order to maximize sample coverage we first look at
course grades and credits earned, but then also look at final exam scores (for a smaller sample).
A practical challenge with both grade and test score outcomes is that they may not be observed
for students that do not persist to the final exam in MTH208 or who do not enroll in MTH209. Our main
analysis imputes values for these outcomes where missing, though we also assess the consequences of
this imputation. Our preferred method assumes that students who chose not to enroll in MTH209 would
have received a failing grade and those without test scores would have received a score at the tenth
percentile of the test score distribution from their MTH208 class. Generally results are not sensitive to
imputation method used. We also look directly at the likelihood of enrolling in MTH209 or of having
non-missing final exam scores as outcomes.
Persistence is less susceptible to these concerns. Given that roughly one-quarter of the sample
either withdraw or fail Math 208, and an equal fraction fail to take Math 209 at any point, it is interesting
to look at whether students eventually take Math 209 as an outcome. The number of credits accumulated
in the six months following Math 208 is another outcome we examine that is also less susceptible to
instructor leniency and missing value concerns.
C. Cross-campus comparisons
A third challenge in estimating instructor effectiveness is that unobservable differences between students
across campuses may confound instructor differences. This is the rationale for controlling for campus
fixed effects in equation (1). But separately identifying campus and instructor effects requires that a set
of instructors teach in multiple campuses.17 For example, if an instructor’s students do particularly well, it
is impossible to say whether this reflects the contribution of the instructor herself or unobserved campus
phenomenon, such as the campus-specific facilities or student peers. Observing instructors across multiple
17 Including fixed effects for each of the 200 physical locations requires instructors that teach at multiple locations within each campus. Within-campus switching is more common than cross-campus switching, and thus location fixed effects are only slightly more problematic than campus fixed effects.
16

campuses permits the separation of these two phenomenon and permit instructors across campuses to be
ranked on a common scale. This is analogous to the concern in studies that attempt to simultaneously
estimate firm and worker effects as well as the literature that measures teacher value-added at the K12
level. Most prior work on postsecondary instructors has focused on single campus locations and thus not
confronted the cross-campus comparison problem.
The existence of the online courses, and the fact that a sizeable fraction of instructors teach both
online and at a physical campus, provides the “connectedness” that allows us to separately identify
campus and instructor effects. Appendix Table A2 reports the degree of “switching” that exists across
campuses in our data. About 8 percent of the exclusively FTF instructors teach in more than one campus,
and about 21 percent of the online instructors also teach at a FTF.
D. Implementation
We implement our analysis with a two-step procedure. In the first step, we first estimate the standard
value-added model in (1) with OLS including a host of student characteristics, campus fixed effects, and
instructor FEs (𝜃𝜃𝑖𝑖). Including 𝜃𝜃𝑖𝑖’s as fixed effects permits correlation between 𝜃𝜃𝑖𝑖s and X characteristics
(including campus FEs), generating estimates of 𝛽𝛽1, 𝛽𝛽2, ∅𝑖𝑖, and 𝛿𝛿𝑐𝑐 that are purged of any non-random
sorting by instructors (Chetty, Friedman, and Rockoff, 2014a). However, the estimated 𝜃𝜃𝑖𝑖’s are noisy, so
their variance would be an inaccurate estimate of the true variance of the instructor effects. We then
construct mean section-level residuals for each outcome
𝑌𝑌�𝑖𝑖𝑖𝑖𝑖𝑖 = ∑ (𝑌𝑌𝑖𝑖𝑖𝑖𝑖𝑖𝑖𝑖 − 𝛽𝛽1�𝑋𝑋𝑖𝑖 − 𝛽𝛽2�𝑍𝑍𝑖𝑖𝑖𝑖𝑖𝑖 − ∅𝑖𝑖� − 𝛿𝛿𝑐𝑐)�𝑖𝑖∈𝑖𝑖 (2)
The section-level residuals 𝑌𝑌�𝑖𝑖𝑖𝑖𝑖𝑖 combine the instructor effects (𝜃𝜃𝑖𝑖) with any non-mean-zero unobserved
determinants of student performance at the student- or section-level. Our fully-controlled first-stage
model includes student characteristics (male, age, incoming GPA, incoming credits, indicator for repeat
MTH208, number of times taking MTH208, 12 program dummies, years since started program), section
averages of these individual characteristics, student zip code characteristics (unemployment rate, median
family income, percent of families below poverty line, percent of adults with BA degree in ZIP code, plus
missing ZIP) and total section enrollment. We control for aggregate temporal changes in unobserved
student characteristics or grading standards by including calendar year and month fixed effects. Campus
fixed effects control for any unobserved differences in student characteristics across campuses. Since the
campus includes several physical locations for very large metro areas, as a robustness we replace campus
fixed effects with effects for the specific physical location at which the class is taught. Finally, we also
examine models with various subsets of these control variables and large sets of interactions between
them.
17

In the second step, we use the mean residuals to estimate the variance of the instructor effects
𝜃𝜃𝑖𝑖as random effects with maximum likelihood.18 For a single outcome, not distinguishing by mode, the
model is simply 𝑌𝑌�𝑖𝑖𝑖𝑖𝑖𝑖 = 𝜃𝜃𝑖𝑖 + �̃�𝑒𝑖𝑖𝑖𝑖𝑖𝑖. The error term �̃�𝑒𝑖𝑖𝑖𝑖𝑖𝑖includes any section-specific shocks and also any
non-mean-zero student-level unobserved characteristics, both of which are assumed to be independent
across instructors and time. Our preferred approach stacks outcomes and lets effectiveness vary by
outcome with an unrestricted covariance matrix. For instance, for two outcomes (o = grade in MTH208,
grade in MTH209) we estimate
𝑌𝑌�𝑖𝑖𝑖𝑖𝑖𝑖𝑜𝑜 = 𝜃𝜃𝑖𝑖𝑀𝑀208�𝑀𝑀208𝑜𝑜𝑖𝑖𝑖𝑖𝑖𝑖�+ 𝜃𝜃𝑖𝑖𝑀𝑀209�𝑀𝑀209𝑜𝑜𝑖𝑖𝑖𝑖𝑖𝑖�+ �̃�𝑒𝑜𝑜𝑖𝑖𝑖𝑖𝑖𝑖 (3)
where 𝑀𝑀208𝑜𝑜𝑖𝑖𝑖𝑖𝑖𝑖 and 𝑀𝑀209𝑜𝑜𝑖𝑖𝑖𝑖𝑖𝑖 are indicators for MTH208 and MTH209 outcomes, respectively.19 The
key parameters of interest are SD(𝜃𝜃𝑖𝑖𝑀𝑀208), SD(𝜃𝜃𝑖𝑖𝑀𝑀209), and Corr(𝜃𝜃𝑖𝑖𝑀𝑀208, 𝜃𝜃𝑖𝑖𝑀𝑀209). The benefit of stacking
outcomes and estimating multiple outcomes simultaneously is that the correlation across outcomes is
estimated directly. As noted by Carrell and West (2010), the estimate of Corr(𝜃𝜃𝑖𝑖𝑀𝑀208, 𝜃𝜃𝑖𝑖𝑀𝑀209) from (3)
will be biased in the presence of shocks common to all students in a given MTH208 section if those
shocks have a positive correlation across outcomes. For instance, groups of students that are high
performing in MTH208 (relative to that predicted by covariates) are also likely to do well in MTH209,
independent of the MTH208 instructors’ ability to influence MTH209 performance. For this reason, our
preferred specification also includes section-specific shocks (random effects 𝜇𝜇𝑖𝑖𝑖𝑖𝑖𝑖𝑀𝑀208 and 𝜇𝜇𝑖𝑖𝑖𝑖𝑖𝑖𝑀𝑀209) with an
unrestricted covariance matrix:
𝑌𝑌�𝑖𝑖𝑖𝑖𝑖𝑖 = 𝜃𝜃𝑖𝑖𝑀𝑀208�𝑀𝑀208𝑜𝑜𝑖𝑖𝑖𝑖𝑖𝑖� + 𝜃𝜃𝑖𝑖𝑀𝑀209�𝑀𝑀209𝑜𝑜𝑖𝑖𝑖𝑖𝑖𝑖� + 𝜇𝜇𝑖𝑖𝑖𝑖𝑖𝑖𝑀𝑀208�𝑀𝑀208𝑜𝑜𝑖𝑖𝑖𝑖𝑖𝑖� + 𝜇𝜇𝑖𝑖𝑖𝑖𝑖𝑖𝑀𝑀209�𝑀𝑀209𝑜𝑜𝑖𝑖𝑖𝑖𝑖𝑖� + �̃�𝑒𝑖𝑖𝑖𝑖𝑖𝑖 (4)
The Corr(𝜇𝜇𝑖𝑖𝑖𝑖𝑖𝑖𝑀𝑀208, 𝜇𝜇𝑖𝑖𝑖𝑖𝑖𝑖𝑀𝑀209) captures any common shocks in MTH 208 that carry over into MTH 209
performance (regardless of instructor), such as unobserved student characteristics or similarities of
environment between the classes (such as the same peers). The distribution of 𝜃𝜃𝑖𝑖𝑀𝑀208 and 𝜃𝜃𝑖𝑖𝑀𝑀209 is still
estimated by systematic differences in student performance across sections taught by the same instructor,
but now the correlation between these two effects nets out what would be expected simply due to the fact
that individual students’ performance in the two courses are likely to be correlated. Note that since the
instructor and section effects are random effects (rather than fixed), their distributions are separately
identified. Including section-specific random effects has no bearing on the instructor effects, but does
18 Second stage models are estimated with maximum likelihood using Stata’s “mixed” command. To ensure that estimated variances are positive, this routine estimates the log of the standard deviation of random effects as the unknown parameter during maximization. Standard errors of this transformed parameter are computed using the inverse of the numerical Hessian, then converted back to standard deviation units. 19 All models also include a constant and an indicator for one of the outcomes to adjust for mean differences in residuals across outcomes, which is most relevant when we estimate the model separately by mode of instruction.
18

impact the estimated correlation between contemporary and follow-up course effectiveness. Analogous
models are estimated separately by mode of instruction.
V. Results on Instructor Effectiveness
A. Main Results for Course Grades and Final Exam Scores
Table 3 reports our main estimates of the variances and correlations of MTH208 instructor effects for
both grade and test score outcomes, overall and separately by mode of instruction. This base model
includes our full set of student and section controls in the first stage, in addition to campus fixed effects.
The first, fourth, and seventh columns report results without correlated section effects.
For the full sample, a one-standard deviation increase in MTH208 instructor quality is associated
with a 0.30 and 0.20 standard deviation increase in student course grades in MTH208 and MTH209,
respectively. In course grade points, this is a little larger than one grade step (going from a “B” to “B+”).
Thus MTH208 instructors substantially affect student achievement in both the introductory and follow-on
math courses. These estimates are statistically significant and quite a bit larger than effects found in prior
research in postsecondary (e.g. Carrell and West, 2010) and elementary schools (Kane et al. 2008).
We also find that instructor effects in MTH208 and MTH209 are highly positively correlated
(correlation coefficient = 0.70). Including section-specific shocks that correlate across outcomes reduces
(to 0.60) but does not eliminate this positive correlation. This tells us that MTH208 instructors that
successfully raise student performance in MTH208 also raise performance in follow-on courses. Thus we
do not observe the same negative tradeoff between contemporaneous student performance and “deep
learning” highlighted by Carrell and West (2010).
Columns (5) and (8) split the full sample by whether the MTH208 section was held at a ground
campus (face-to-face) or the online campus. Though slightly more than half of sections are held at ground
campuses, they make up three-quarters of the instructors in the full sample. Instructor quality is slightly
more variable at ground campuses than online (0.31 SD vs. 0.24 SD for MTH208), but with a much larger
difference by format when measuring follow-on course performance (0.24 SD vs. 0.04 SD). There are a
number of reasons that online instructors may have less variation in quality than face-to-face instructors.
First, ground instructors have more discretion over course delivery and are more likely to modify the
curriculum. Ground instructors also have more direct interaction with students. Both of these factors may
magnify differences in their effectiveness in a ground setting. Second, personnel management is
centralized for online sections, while many aspects of hiring, evaluation, and instructor training are done
by individual campuses for ground sections. Finally, since faculty are not randomly assigned to section
formats (FTF vs. online), variance differences across formats could reflect differences in instructor
characteristics. For instance, if teaching experience relates to effectiveness and ground campuses have a
greater variance of instructor experience, then this will be reflected in the variance of instructor quality.
19

Furthermore, if there is less non-random sorting of students to instructors (conditional on our extensive
control variables) in online sections than in ground sections, this will inflate the estimated variance of
instructors at ground campuses. Interestingly, instructor quality in contemporaneous and follow-on course
performance are more positively correlated for face-to-face sections than for online sections, though
estimates for the latter are quite imprecise and not terribly robust across specifications.
Course grades are problematic as a measure of student achievement to the extent that systematic
differences across instructors reflect different grading policies or standards rather than student learning.
We address this by examining student performance on normalized final course exams.20 Columns (3), (6),
and (9) and Panel B of Table 3 restrict analysis to sections that start between June 2010 and March 2014,
for which we have such exam scores. For FTF sections, the variance of instructor effects is actually larger
when using final exam score rather than course grades: 0.49 compared with 0.30. This is consistent with
less effective teachers grading more easily than more effective teachers. In contrast, in online sections, the
variance of instructor effects is smaller when using final exam score, consistent with less effective
teachers grading more harshly. Effectiveness is also highly positively correlated (correlation = 0.61)
between contemporaneous and follow-on course performance. The weak correlation between
contemporaneous and follow-on course performance for online MTH208 sections is also observed with
final exam scores (in fact the point estimate of the correlation is negative), though it is imprecisely
estimated and generally not robust (in magnitude or sign) across alternative specifications.
One way to interpret the magnitudes is to compare them to outcome differences by student
characteristics. On the standardized final exam score, for instance, students that are ten years older score
0.15 SD lower and a one grade-point difference in GPA coming into the class is associated with a 0.46
SD difference in exam scores. So having an instructor that is 1 SD more effective produces a test score
change that is larger than the gap between 25 and 35 year-olds and comparable to the performance gap
between students entering the class with a 3.0 vs. a 2.0 GPA. So at least compared to these other factors
which we know are important – age and prior academic success – instructors seem to be a quite important
factor in student success.
One candidate explanation for the high positive correlation between instructor effects in
contemporaneous and follow-on courses in the FTF setting is that many students have the same
instructors for MTH208 and MTH209 at ground campuses. Fully 81% of students in ground sections have
the same instructor for MTH208 and MTH209, while fewer than 1% of students taking MTH208 online
do. This difference in the likelihood of having repeat instructors could also possibly explain differences
20 Since exams differ in maximum point values across sections and for MTH208 and MTH209, the outcome is the fraction of points earned (out of the maximum). This fraction is then standardized to mean zero and standard deviation one for the individuals with scores across the entire sample.
20

between online and face-to-face formats. Having the same instructor for both courses could generate a
positive correlation through several different channels. First, instructor-specific grading practices or
tendency to “teach-to-the-test” that are similar in MTH208 and 209 will generate correlated performance
across classes that does not reflect true learning gains. Alternatively, instructors teaching both courses
may do a better job of preparing students for the follow-on course.
To examine this issue, Table 4 repeats our analysis on the subset of MTH208 face-to-face
sections where students have little chance of having the same instructor for MTH209. We focus on
situations where the instructor was not teaching any classes or MTH208 again in the next three months
and where few (< 25%) or no students take MTH209 from the same instructor. While instructor quality
may influence some students’ choice of MTH209 instructor, it is unlikely to trump other considerations
(such as schedule and timing) for all students. Thus we view these subsamples as identifying situations
where students had little ability to have a repeat instructor for other reasons. Though the number of
sections is reduced considerably and the included instructors are disproportionately low-tenure, the
estimated instructor effects exhibit a similar variation as the full sample, both for course grades and exam
scores. The correlation between MTH208 and 209 instructor effects is reduced substantially for grades
and modestly for test scores, but remains positive and significant for both, even with the most restricted
sample.21
B. Robustness of Grade and Test Score Outcomes
Table 5 examines the robustness of our test score results to different first stage models. Our preferred
first-stage model includes numerous student characteristics, section averages of these individual
characteristics, total section enrollment, campus fixed effects, instructor fixed effects, calendar year fixed
effects, and month fixed effects. Even models with only time controls (columns 1) exhibit patterns that
are qualitatively similar to our base model, with substantial instructor quality variation, particularly for
face-to-face sections. In fact, the extensive controls have little impact on estimates of instructor quality,
suggesting minimal systematic non-random sorting of students to instructors based on observed
characteristics (and possibly unobserved characteristics too). Even including incredibly flexible student-
level controls (5) or fixed effects for each physical location of the class (6) has minimal impact on our
estimates.22 The only consequential controls we include are campus fixed effects when combined with
instructor fixed effects, which increase the estimated variance of instructor effects on MTH208 and
MTH209 exam scores and reduce their correlation. For online sections, estimates of instructor effects do
21 These specifications all include correlated section shocks across outcomes, though they are not reported in the table. Excluding section shocks makes the instructor effects more positively correlated across outcomes. 22 There are approximately 200 physical locations included in the sample, in contrast to the 75 campuses.
21

not change at all across first stage specifications, but the estimated correlation across current and future
course outcomes is not robust and very imprecisely estimated.
Table 6 addresses sample selection by assessing the robustness of our estimates to different ways
of imputing missing outcomes, overall and separately by instructional mode. For grade outcomes,
estimated instructor effects are quite similar regardless of whether MTH209 grades are imputed if a
student does not take MTH209. Our preferred method for test scores assumes that students without test
scores would have received a score at the tenth percentile of the test score distribution from their
MTH208 class. The results are generally quite similar, qualitatively and quantitatively, across imputation
methods (including no imputation by only using test scores for the select sample of students with test
scores). These results suggest that the substantial differences across instructor s and the positive (overall
and for FTF sections) correlation across contemporary and follow-up course outcomes is not driven by
non-random selection of students into test score and follow-up course outcomes.
C. Student Evaluations and Other Outcomes
Course grades and final exam performance are two objective measures of student learning that
can be used to assess instructor quality, end-of-course student evaluations are the primary mechanism for
assessing instructor quality at the University of Phoenix and most other institutions. At UPX, end-of-
course evaluations are optional; fewer than 50% of students that have a MTH208 final exam score (our
proxy for being engaged in the course at the end of the class) also have a completed evaluation. Students
are asked how much they would recommend the instructor to another student, on a 1 to 10 scale. Scores
equal to 8 or above are considered “good” by the University and we adopt this convention as well,
constructing an indicator for whether the student rated the instructor at least an 8 on the 10 point scale.
Table 7 presents estimates of model (4) with this evaluation score included pair-wise along with four
different learning outcomes. We also include section-specific shocks that are permitted to correlate
between learning and evaluation outcomes. The variance of these section shocks captures section-to-
section variability that is not explained by instructors. We do not impute evaluation scores when missing,
as our goal is to assess how well the course evaluation system – as it is currently used – captures our more
objective measures of instructor effectiveness.23
As with learning outcomes, there is substantial variability across instructors: a one-standard-
deviation increase in instructor quality is associated with a 0.219 percentage point increase in the fraction
of student evaluations that are positive. This variability is smaller, though still large, among online
instructors and is also comparable to the section-to-section variability (0.233). Interestingly, evaluation
23 There is the additional complication that it is not entirely clear how missing evaluations should be imputed. In contrast, we are comfortable assuming that students with missing final exam scores (because they dropped out) are likely to have received low exam scores had they taken the exam.
22

scores are most positively correlated with grades in the current course, suggesting that instructors are
rewarded (through higher evaluations) for high course grades or that students experiencing temporary
positive grade shocks attribute this to their instructor. Correlations with subsequent course performance
and test scores is much weaker (and even negative for MTH 209 test scores). Collectively this suggests
that end-of-course evaluations by students are unlikely to capture much of the variation in instructor
quality, especially for more distant or objective outcomes.
Table 8 presents estimates of instructor effects for several different outcomes, both for the full
sample and the restricted sample for which test scores are available. There is substantial instructor
variability in students’ likelihood of taking MTH209 and in the number of credits earned in the six
months following MTH208. Both of these are important indicators of students’ longer-term success at
UPX. A one-standard-deviation increase in MTH208 instructor quality is associated with a five
percentage point increase in the likelihood a student enrolls in MTH209 (on a base of 76%), with the
variability twice as large for face-to-face MTH208 sections as it is for online ones. A similar increase in
instructor quality is associated with a 0.13 SD increase in the number of credits earned in the six months
following MTH208, again with face-to-face instructors demonstrating more than twice as much
variability as online sections. Total credits earned after MTH208 is an important outcome for students and
the university which is unlikely to be manipulated by individual instructors. In Appendix Table A3 we
report correlations between predicted instructor effects measured with these different outcomes for the
test score sample, overall and separately by format.24 Most of the outcomes are positively correlated
overall and for face-to-face sections. Interestingly, value-added measured by likelihood of taking
MTH209 after MTH208 is only weakly correlated with value-added measured by final exam scores. Thus
instructors that excel in improving student test scores are unlikely to excel at getting their students to
enroll in the follow-up course.
VI. Does Effectiveness Correlate with Experience and Pay?
Having demonstrated substantial variation in instructor effectiveness along several dimensions of student
success, particularly for face-to-face sections, we now consider how teaching experience and pay
correlates with effectiveness. Are more experienced instructors more effective? Are more effective
instructors paid more highly? While we do not attempt an exhaustive analysis of these questions, the
answers have implications for whether instructional resources are used productively and how overall
24 These correlation matrices are formed by predicting the BLUP instructor effects for different outcomes one at a time and correlating these using section-level data. It would be more efficient to estimate all the effects and the correlations simultaneously as we did for pairs of outcomes (e.g. grades in MTH208 and MTH209 in Table 3), but these models did not converge. Consequently, these models do not include section-specific shocks that correlate across outcomes. Thus the correlations reported in Table A3 differ from those in Table 3. Correlations are quite similar for the full sample.
23

effectiveness could be improved. Teaching experience – both course-specific and general – may be an
important factor in instructor performance given results found in other contexts (e.g., Ost, 2014; Cook &
Mansfield, 2015; Papay and Kraft, 2015).
For this analysis, we focus on instructors hired since 2002 so that we can construct a full history
of courses taught across all courses and in MTH208 specifically, not censored by data availability. This
results in 18,409 sections (5,970 in the test score sample). Our main approach is to regress section-level
residuals 𝑌𝑌�𝑖𝑖𝑖𝑖𝑖𝑖 on observed instructor experience at the time the section was taught:
𝑌𝑌�𝑖𝑖𝑖𝑖𝑖𝑖 = 𝑓𝑓�𝐸𝐸𝐸𝐸𝑝𝑝𝑀𝑀𝑀𝑀𝑀𝑀208,𝑖𝑖� + 𝜃𝜃𝑖𝑖 + 𝑒𝑒𝑖𝑖𝑖𝑖𝑖𝑖 (5)
Where f(.) is a flexible function of experience teaching MTH208. Our preferred model includes instructor
fixed effects, 𝜃𝜃𝑖𝑖, isolating changes in effectiveness as individual instructors gain experience. This model
controls for selection into experience levels based on fixed instructor characteristics, but does not control
for time-varying factors related to experience and effectiveness. For instance, if instructors tend to
accumulate teaching experience when other work commitments are slack, the experience effect may be
confounded with any effects of these other work commitments. We also include other dimensions of
experience, such as number of sections taught of MTH209 and other courses. Papay and Kraft (2015)
discuss the challenges in estimating (5) in the traditional K12 setting, given the near collinearity between
experience and calendar year for almost all teachers. Many of these issues are not present in our setting,
since the timing of when courses are taught and experience is accumulated differs dramatically across
instructors. The non-standard calendar of UPX thus facilitates the separation of experience from time
effects.
Figures 1 and 2 present estimates of (5) for a non-parametric version of f(.), regressing section
mean residuals on a full set of MTH208 experience dummies (capped at 20) along with year, month, and
(when noted) instructor fixed effects.25 Figure 1 depicts results for course grade outcomes. Effectiveness
increases very modestly the first few times instructors teach MTH208, as measured by MTH208 and
MTH209 course grades. Interestingly, including instructor fixed effects stabilizes the effectiveness-
experience profile, suggesting that less effective instructors are more likely to select into having more
MTH208 teaching experience. Figure 2 repeats this analysis but for final exam test scores on the
restricted test score sample. Estimates are quite imprecise, but do suggest modest growth in MTH208
exam scores as instructors gain experience. Improvement with experience is not as clear-cut for MTH209
test score performance.
To gain precision, Table 9 presents estimates from parametric specifications for f(.), while also
including teaching experience in other courses and time since hire (in Panel C) . We find that teaching
25 Approximately one quarter of the sections are taught by instructors that have taught MTH208 more than 20 times previously. Nine percent have not previously taught MTH208.
24

MTH208 at least one time previously is associated with a 0.03 to 0.04 SD increase in effectiveness
(measured by MTH208 grade), but that additional experience improves this outcome very little. This
holds even after controlling for additional experience in other subjects. Instructors’ experience impact on
follow-on course grades is more modest and gradual. Test score results are much less precise, but do
suggest that instructor effectiveness increases with experience for final exams in contemporaneous
courses and (very modestly) in follow-on courses. We find that general experience in other subjects has
little association with effectiveness in MTH208 (not shown). Finally, we find no systematic relationship
between teaching experience and instructors’ impact on the number of credits their students earn
subsequent to MTH208. Whether the instructor was hired in the past year and the number of years since
first hire date has no association with most measures of instructor effectiveness (after controlling for
MTH208 experience), but is associated with MTH208 test scores.
If pay was commensurate with effectiveness, then the substantial variation in measured
effectiveness across instructors would not necessarily translate to productivity or efficiency differences (at
least from the institution’s perspective). Our discussions with leaders at University of Phoenix suggest
that pay is not linked to classroom performance in any direct way, but was rather tied primarily to tenure
and experience. We directly examine correlates of instructor salary quantitatively in Table 10. Consistent
with this practice, effectiveness (as measured by section-level mean residuals in MTH209 grades) is
uncorrelated with pay, both in the cross-section and within instructors over time.26 However, years since
first hire is the one consistent predictor of the salary instructors are paid for MTH208 courses. Instructors
receive approximately $44 more per course for each year of tenure (approximately 4% higher pay) after
fixed instructor differences are accounted for. Overall and course-specific teaching experience have no
association with instructor salary.
VII. Conclusion and Discussion
In this study, we document substantial differences in effectiveness across instructors of required college
algebra at the University of Phoenix. A one-standard-deviation in instructor quality is associated with a
0.20 SD increase in course grades and a 0.41 SD increase in final exam scores in the follow-on course, as
well as a 0.13 SD increase in the number of credits earned within six months. Variation is much smaller
for online sections, yet still measurable and larger than that found in other contexts. Putting these
magnitudes in context, having an instructor that is 1 SD more effective produces a test score change that
is larger than the gap between 25 and 35 year-olds and comparable to the performance gap between
26 It is possible that noise in our estimates of section-specific effectiveness attenuates our estimate of the relationship between effectiveness and pay. We are currently examining this issue, though we note that a finding of no relationship is consistent with the institution’s stated pay policy.
25

students entering the class with a 3.0 vs. a 2.0 GPA. Instructors are clearly an quite important factor in
student success.
It is worth considering what institutional factors may contribute to such large differences across
instructors, particularly in contrast to other settings. Prior work in postsecondary has focused on selective
and research-oriented public and non-profit universities, courses taught by permanent or tenure-track
faculty, institutions operating in a single geographic location, and serving “traditional” students. It is
possible that instructors are a more important factor in the success of “non-traditional” students or that
there is more variation in instructor quality among contingent and adjunct faculty than among permanent
or tenure-track faculty. The one prior study that finds instructor variation comparable to ours (Bettinger,
Fox, Loeb, and Taylor, 2015) shares all of these traits with our study institution. Having a better
understanding of the importance of faculty at less selective institutions and in settings where most faculty
are contingent is important, as these institutions serve a very large (and growing) share of postsecondary
students in the U.S.. Finally, it is possible that the fast course pace – five weeks – could magnify the
consequences of behavioral differences across instructors. A delay in providing student feedback – even
just a few days – could be devastating to students in a five-week course.
This substantial variation across instructors suggests potential to improve student and institutional
performance via changes in how faculty are hired, developed, motivated, and retained. Institutions like
UPX reflect the sector-wide trend towards contingent faculty (e.g. adjuncts and lecturers), which aimed to
save costs and create flexibility (Ehrenberg, 2012). Debate about whether adjuncts are better or worse for
instruction than permanent faculty obfuscates the feature that contingent arrangements create
opportunities for improving student performance via personnel policies that are not available when
faculty are permanent. However, instructor evaluation and compensation systems have not kept up with
these changes; our study institution has an evaluation system (student course evaluations) that is similar to
that at elite research universities and a salary schedule that varies only with tenure and credentials. Of
course the potential for improvement through changes in personnel policies – and how these policies
should be designed – depends critically on the supply of instructors available (e.g. Rothstein, 2015).
Online and ground campuses likely face quite different labor markets for instructors, the former drawing
on instructors across the country, suggesting that personnel policies should differ between them. Better
understanding the labor market for postsecondary faculty – particularly at less selective institutions – is an
important area for future attention.
Finally, we have focused on the role of individual faculty in promoting the success of students.
In fact, differences in instructor effectiveness is one potential explanation for cross-institution differences
in institutional performance and productivity that has yet to be explored. Our study suggests it should.
26

References
Bettinger, E., Fox, L., Loeb, S., & Taylor, E. (2014). Changing distributions: How online college classes alter student and professor performance. Working Paper, Stanford University.
Bettinger, E. P., & Long, B. T. (2005). Do faculty serve as role models? The impact of instructor gender on female students. The American Economic Review, 95(2), 152-157.
Bettinger, E. P., & Long, B. T. (2010). Does cheaper mean better? The impact of using adjunct instructors on student outcomes. The Review of Economics and Statistics, 92(3), 598-613.
Braga, M., Paccagnella, M., & Pellizzari, M. (2014). The academic and labor market returns of university professors. IZA Discussion Papers.
Carrell, S. E., & West, J. E. (2010). Does Professor Quality Matter? Evidence from Random Assignment of Students to Professors. Journal of Political Economy, 118(3), 409-432.
Chetty, R., Friedman, J. N., & Rockoff, J. E. (2014). Measuring the Impacts of Teachers I: Evaluating Bias in Teacher Value-Added Estimates. The American Economic Review, 104(9), 2593-2632.
Cook, J. B., & Mansfield, R. K. (2014). Task-Specific Experience and Task-Specific Talent: Decomposing the Productivity of High School Teachers. Working Paper
Ehrenberg, R.G. (2012). American Higher Education in Transition. Journal of Economic Perspectives, 26(1): 193-216.
Ehrenberg, R. G., & Zhang, L. (2005). Do tenured and tenure-track faculty matter? Journal of Human Resources, 40(3), 647-659.
Fairlie, R. W., Hoffmann, F., & Oreopoulos, P. (2014). A Community College Instructor Like Me: Race and Ethnicity Interactions in the Classroom. The American Economic Review, 104(8), 2567-2591.
Figlio, D. N., Schapiro, M. O., & Soter, K. B. (2015). Are tenure track professors better teachers? Review of Economics and Statistics, 97(4), 715-724.
Brodaty, T. and M. Gurgand. (2016). “Good peers or good teachers? Evidence from a French University.” Economics of Education Review, 54(2016): 62-78.
Hoffmann, F., & Oreopoulos, P. (2009a). Professor qualities and student achievement. The Review of Economics and Statistics, 91(1), 83-92.
Hoffmann, F., & Oreopoulos, P. (2009b). A professor like me the influence of instructor gender on college achievement. Journal of Human Resources, 44(2), 479-494.
Jackson, C. K., Rockoff, J. E., & Staiger, D. O. (2014). Teacher Effects and Teacher-Related Policies. Annual Review of Economics, 6, 801-25.
Jacob, B. A., & Lefgren, L. (2008). Can principals identify effective teachers? Evidence on subjective performance evaluation in education. Journal of labor Economics, 26(1), 101-136.
27

Kane, T. J., Rockoff, J. E., & Staiger, D. O. (2008). What does certification tell us about teacher effectiveness? Evidence from New York City. Economics of Education review, 27(6), 615-631.
Morris, Jolene, 2016. “University of Phoenix, Online Campus Course Syllabus – Math 208 r3” retrieved at http://www.jolenemorris.com/mathematics/Math208/CM/Week0/math_208_syllabus.htm on October 26, 2016.
Ost, B. (2014). How Do Teachers Improve? The Relative Importance of Specific and General Human Capital. American Economic Journal: Applied Economics, 6(2), 127-51.
Papay, John P. and Matthew A. Kraft, (2015). “Productivity returns to experience in the teacher labor market: Methodological challenges and new evidence on long-term career improvement.” Journal of Public Economics, 130: 105-119.
Rivkin, S. G., Hanushek, E. A., & Kain, J. F. (2005). Teachers, schools, and academic achievement. Econometrica, 73(2), 417-458.
Rothstein, J. (2009). ““Student Sorting and Bias in Value Added Estimation: Selection on Observables and Unobservables.” Education Finance and Policy 4(4), Fall 2009: 537-571
Rothstein, J. (2010). ““Teacher Quality in Educational Production: Tracking, Decay, and Student Achievement.” Quarterly Journal of Economics 125(1), February 2010: 175-214.
Rothstein, J. (2015). “Teacher Quality Policy When Supply Matters.” American Economic Review 105(1), January 2015: 100-130.
Rockoff, J. E. (2004). The impact of individual teachers on student achievement: Evidence from panel data. The American Economic Review, 94(2), 247-252.
28
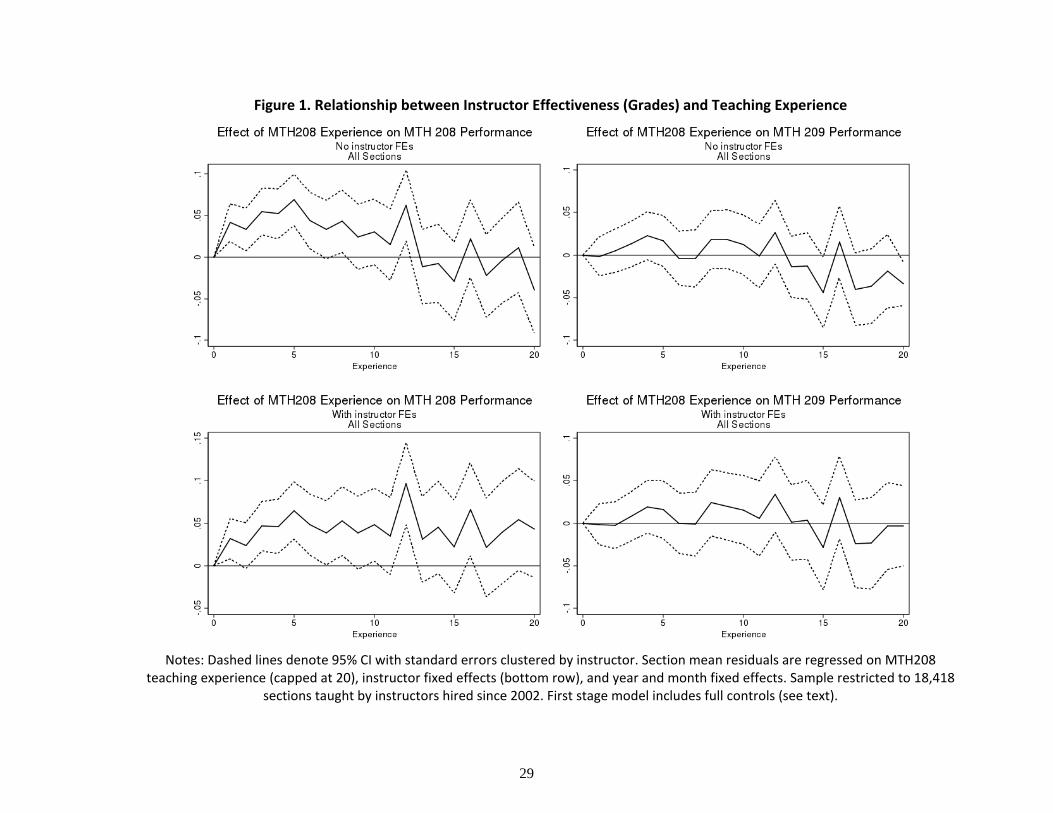
Figure 1. Relationship between Instructor Effectiveness (Grades) and Teaching Experience
Notes: Dashed lines denote 95% CI with standard errors clustered by instructor. Section mean residuals are regressed on MTH208
teaching experience (capped at 20), instructor fixed effects (bottom row), and year and month fixed effects. Sample restricted to 18,418 sections taught by instructors hired since 2002. First stage model includes full controls (see text).
29
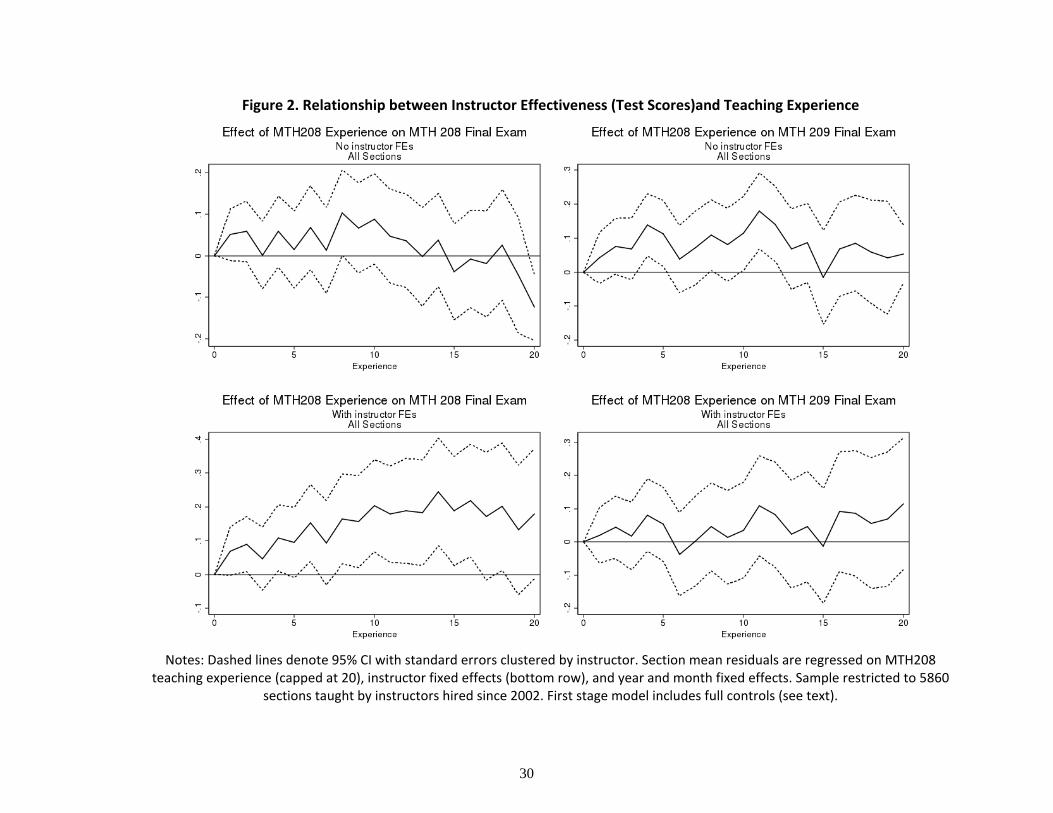
Figure 2. Relationship between Instructor Effectiveness (Test Scores)and Teaching Experience
Notes: Dashed lines denote 95% CI with standard errors clustered by instructor. Section mean residuals are regressed on MTH208
teaching experience (capped at 20), instructor fixed effects (bottom row), and year and month fixed effects. Sample restricted to 5860 sections taught by instructors hired since 2002. First stage model includes full controls (see text).
30

Table 1a. Descriptive Statistics for Sections and Instructors (Full Sample)
Mean Std. Dev. Mean Std. Dev. Mean Std. Dev.
Online section 0.477 0.499 0.000 0.000 1.000 0.000
Male 0.735 0.441 0.755 0.430 0.714 0.452
White 0.649 0.477 0.633 0.482 0.664 0.472
Instructor Compensation per Section ($) 955.14 181.61 949.39 211.45 961.45 141.86
Section‐average student age 34.89 3.25 34.33 3.38 35.50 3.00
Section‐average share male 0.36 0.17 0.37 0.17 0.35 0.17
Section‐average incoming GPA 3.35 0.23 3.34 0.24 3.36 0.21
Section‐average incoming credits 22.87 8.39 25.56 8.82 19.93 6.77
Section‐average repeat 208 0.11 0.11 0.08 0.10 0.14 0.11
Section‐average number times taken 208 1.11 0.13 1.09 0.11 1.14 0.14
Section‐average time since program start (years) 1.15 0.50 1.20 0.52 1.09 0.47
Section enrollment 12.88 4.40 13.98 5.38 11.68 2.48
Years since first hire 4.783 4.281 5.005 4.811 4.539 3.597
Years since first hire > 1 0.830 0.376 0.804 0.397 0.858 0.349
Total math 208 sections taught prior to this section 15.310 16.792 11.038 13.132 19.988 18.975
Ever taught MTH208 prior to this section 0.920 0.272 0.888 0.316 0.955 0.208
Total sections instructor taught prior to this section 43.213 51.854 46.501 61.163 39.611 38.886
Total MTH209 sections taught prior to this section 9.871 12.915 10.690 13.170 8.975 12.569
Ever taught MTH209 prior to this section 0.776 0.417 0.873 0.333 0.670 0.470
All sections
(n = 26,384)
Face‐to‐Face sections
(n = 13,791)
Online sections
(n = 12,593)
31

Table 1b. Descriptive Statistics for Students (Full Sample)
Mean Std. Dev. Mean Std. Dev. Mean Std. Dev.
Male 0.359 0.480 0.373 0.484 0.341 0.474
Age 34.816 9.097 34.264 9.127 35.538 9.008
Baseline GPA (0‐4) 3.348 0.538 3.348 0.518 3.347 0.563
Credits earned prior to start of Math 208 23.386 18.363 25.714 18.451 20.337 17.791
Took Math 208 before 0.104 0.306 0.077 0.267 0.140 0.347
Number of times MTH 208 taken 1.109 0.385 1.084 0.325 1.142 0.448
BS (general studies) 0.211 0.408 0.208 0.406 0.214 0.410
BS in Nursing 0.050 0.217 0.026 0.159 0.081 0.272
BS in Accounting 0.003 0.057 0.002 0.045 0.005 0.069
BS in Business 0.503 0.500 0.587 0.492 0.393 0.488
BS in Criminal Justice Administration 0.035 0.183 0.047 0.213 0.018 0.133
BS in Education 0.022 0.145 0.013 0.112 0.033 0.179
BS in Health Administration 0.034 0.182 0.034 0.181 0.034 0.182
BS in Human Services 0.033 0.179 0.023 0.150 0.046 0.210
BS in Information Technology 0.028 0.166 0.027 0.162 0.030 0.172
BS in Management 0.041 0.199 0.022 0.148 0.066 0.248
Non‐degree program 0.014 0.117 0.002 0.042 0.030 0.169
BS in other Program 0.015 0.122 0.009 0.092 0.024 0.152
Time since program start date (years) 1.160 1.399 1.203 1.334 1.105 1.478
Grade in Math 208 2.457 1.395 2.534 1.333 2.355 1.467
A / A‐ 0.319 0.466 0.323 0.468 0.314 0.464
B+ / B / B‐ 0.268 0.443 0.275 0.446 0.258 0.438
C+ / C / C‐ 0.174 0.379 0.192 0.394 0.151 0.358
D+ / D / D‐ 0.073 0.260 0.077 0.267 0.066 0.249
F 0.045 0.207 0.038 0.191 0.054 0.226
Withdrawn 0.122 0.327 0.095 0.293 0.156 0.363
Passed Math 208 0.834 0.372 0.867 0.340 0.790 0.407
Math 208 Final exam score available 0.243 0.429 0.282 0.450 0.191 0.393
Math 208 final exam % correct (if available) 0.708 0.241 0.697 0.246 0.729 0.230
Took Math 209 0.755 0.430 0.824 0.380 0.664 0.472
Grade in Math 209 (if took it) 2.620 1.246 2.714 1.160 2.464 1.363
A / A‐ 0.318 0.466 0.328 0.470 0.300 0.458
B+ / B / B‐ 0.294 0.456 0.304 0.460 0.279 0.449
C+ / C / C‐ 0.201 0.401 0.217 0.412 0.174 0.379
D+ / D / D‐ 0.074 0.261 0.074 0.262 0.073 0.260
F 0.032 0.176 0.021 0.145 0.049 0.215
Withdrawn 0.068 0.251 0.046 0.209 0.104 0.305
Math 209 Final exam score available 0.200 0.400 0.249 0.433 0.136 0.342
Math 209 final exam % correct (if available) 0.691 0.246 0.690 0.245 0.693 0.250
Credits earned in following 6 months 10.461 5.315 11.401 5.053 9.230 5.397
Have course evaluation 0.117 0.321 0.118 0.323 0.115 0.320Course evaluation: Recommend instructor (if available) 0.658 0.474 0.693 0.461 0.610 0.488
All sections
(n = 339,844)
Face‐to‐Face sections
(n = 192,747)
Online sections
(n = 147,097)
32

Table 2. Randomization Check
(1) (2) (3) (4) (5) (6) (7) (8) (9)
Years since first hire ‐0.0147 0.00863 0.00207 0.0012 ‐0.00122** ‐0.000613 ‐0.000429 0.000159 0.000305
(0.012) (0.010) (0.009) (0.001) (0.001) (0.000) (0.000) (0.000) (0.000)
Years since first hire > 1 0.253*** 0.0808 0.091 ‐0.00205 0.00750* 0.00713* 0.0108*** 0.00337 ‐0.00137
(0.080) (0.073) (0.074) (0.005) (0.004) (0.004) (0.003) (0.002) (0.002)
Total MTH 208 sections taught prior to this section 0.0166*** 0.00430** ‐0.00161 ‐0.000769*** ‐0.000395*** ‐5.06E‐05 0.000793*** 0.0000 ‐0.0001
(0.002) (0.002) (0.002) (0.000) (0.000) (0.000) (0.000) (0.000) (0.000)
Ever taught MTH208 prior to this section 0.155* ‐0.0759 ‐0.0333 0.00276 0.00587 0.00269 0.0254*** 0.00483* 0.00752***
(0.084) (0.080) (0.078) (0.005) (0.005) (0.005) (0.003) (0.003) (0.003)
Total sections instructor taught prior to this section ‐0.00139 ‐0.000813 ‐0.000186 9.60e‐05* 7.69e‐05** 3.34E‐05 ‐7.39e‐05*** ‐0.00002 ‐0.00002
(0.001) (0.001) (0.001) (0.000) (0.000) (0.000) (0.000) (0.000) (0.000)
Total MTH209 sections taught prior to this section ‐0.00546 ‐0.0012 0.000613 0.000152 0.000189 0.000209* ‐0.0001 0.0000 0.000109
(0.004) (0.002) (0.002) (0.000) (0.000) (0.000) (0.000) (0.000) (0.000)
Ever taught MTH209 prior to this section ‐0.361*** 0.0281 0.0141 ‐0.00352 ‐0.0121*** ‐0.0135*** ‐0.0206*** 0.00304 ‐0.000631
(0.073) (0.064) (0.061) (0.004) (0.004) (0.004) (0.002) (0.002) (0.002)
R‐squared 0.047 0.121 0.176 0.034 0.105 0.167 0.054 0.13 0.167
Years since first hire 0.00167** ‐0.000143 ‐0.000227 0.0871** 0.029 ‐0.00684 0.0651** 0.0215 0.00634
(0.001) (0.001) (0.000) (0.042) (0.026) (0.015) (0.025) (0.015) (0.012)
Years since first hire > 1 ‐0.0168*** ‐0.0124*** ‐0.00124 0.174 0.593*** 0.192 ‐0.278** 0.0592 0.0321
(0.005) (0.004) (0.004) (0.234) (0.192) (0.143) (0.135) (0.105) (0.087)
Total MTH 208 sections taught prior to this section 0.0000 0.0001 0.0000 ‐0.0455*** 0.0235*** 0.00052 ‐0.0119*** 0.0186*** 0.00512***
(0.000) (0.000) (0.000) (0.007) (0.004) (0.003) (0.004) (0.003) (0.002)
Ever taught MTH208 prior to this section 0.00183 0.000257 ‐0.00197 ‐1.551*** 0.174 0.326** ‐0.535*** 0.00424 0.269***
(0.005) (0.005) (0.005) (0.200) (0.193) (0.165) (0.119) (0.112) (0.096)
Total sections instructor taught prior to this section 0.00004 0.00003 0.00001 0.00625* ‐0.00370* ‐0.000968 0.00562** ‐0.00113 ‐0.000246
(0.000) (0.000) (0.000) (0.003) (0.002) (0.001) (0.002) (0.001) (0.001)
Total MTH209 sections taught prior to this section 0.00024 0.00009 0.00002 0.0132 0.0025 0.00531 0.0234*** 0.0158*** 0.0114***
(0.000) (0.000) (0.000) (0.011) (0.007) (0.004) (0.007) (0.004) (0.003)
Ever taught MTH209 prior to this section 0.000383 ‐0.00203 0.00303 1.890*** ‐0.0926 ‐0.0449 0.709*** ‐0.143 ‐0.0672
(0.004) (0.004) (0.004) (0.191) (0.165) (0.112) (0.117) (0.104) (0.063)
R‐squared 0.338 0.397 0.44 0.13 0.283 0.429 0.07 0.236 0.359
Observations 23298 23298 23298 23298 23298 23298 23298 23298 23298
FE None campus campus‐year None campus campus‐year None campus campus‐year
Notes: Each panel‐column is a separate regression of section‐level student average characteristics (or total section enrollment) on instructor characteristics. All specifications also include year and
month fixed effects. Robust standard errors clustered by instructor in parenthesis.
Panel A. Outcome = Average Age
(mean = 34.89)
Panel B. Outcome = Fraction Male
(mean = 0.36)
Panel C. Outcome =Fraction Repeating
(mean = 0.11)
Panel D. Outcome =Incoming GPA
(mean = 3.35)
Panel E. Outcome =Incoming credits
(mean = 22.87)
Panel F. Outcome = Section
Enrollment (mean = 12.88)
33

Table 3. Main Course Grade and Test Score OutcomesAll models include full controls in first stage, impute zero MTH209 grade if missing, impute 10th ptile of test scores if missing
(1) (2) (3) (4) (5) (6) (7) (8) (9)
Panel A. Outcome = Standardized Course Grade
Full sample
(no section
shocks)
Full sample
(section
shocks)
Test sample
(section
shocks)
Full sample
(no section
shocks)
Full sample
(section
shocks)
Test sample
(section
shocks)
Full sample
(no section
shocks)
Full sample
(section
shocks)
Test sample
(section
shocks)
Instructor Effect
SD(MTH208 effect) 0.305 0.300 0.286 0.316 0.315 0.298 0.246 0.245 0.225
(.006) (.006) (.008) (.007) (.007) (.009) (.008) (.008) (.012)
SD(MTH209 effect) 0.201 0.195 0.205 0.250 0.243 0.239 0.041 0.039 0.028
(.005) (.005) (.007) (.006) (.006) (.008) (.005) (.005) (.013)
Corr (MTH208, MTH209) 0.695 0.596 0.550 0.763 0.657 0.597 0.374 0.168 0.365
(.017) (.02) (.03) (.017) (.02) (.032) (.087) (.095) (.234)
Section Effect
SD(MTH208 effect) 0.287 0.269 0.280 0.277 0.296 0.254
(1.102) (.208) (.206) (.004) (.15) (.336)
SD(MTH209 effect) 0.299 0.277 0.300 0.290 0.298 0.253
(1.058) (.202) (.192) (.004) (.149) (.338)
Corr (MTH208, MTH209) 0.425 0.454 0.478 0.513 0.364 0.323
(3.132) (.681) (.659) (.015) (.367) (.859)
Observations (sections) 26,384 26,384 7,232 13,791 13,791 4,707 12,593 12,593 2,560
Number of Instructors 2,243 2,243 1,198 1,710 1,710 938 676 676 292Panel B. Outcome = Standardized Test Score
Test sample
(no section
shocks)
Test sample
(section
shocks)
Test sample
(no section
shocks)
Test sample
(section
shocks)
Test sample
(no section
shocks)
Test sample
(section
shocks)Instructor Effect
SD(MTH208 effect) 0.436 0.444 0.482 0.486 0.110 0.135(.012) (.012) (.014) (.014) (.014) (.012)
SD(MTH209 effect) 0.425 0.408 0.490 0.481 0.100 0.047(.012) (.012) (.015) (.015) (.017) (.032)
Corr (MTH208, MTH209) 0.680 0.609 0.680 0.597 0.248 ‐0.066(.025) (.027) (.026) (.029) (.204) (.358)
Section EffectSD(MTH208 effect) 0.380 0.384 0.384
(.605) (.828) (.007)SD(MTH209 effect) 0.478 0.439 0.547
(.481) (.724) (.009)Corr (MTH208, MTH209) 0.294 0.391 0.158
(.763) (1.489) (.023)
Observations (sections) 7,232 7,232 4,707 4,707 2,560 2,560Number of Instructors 1,198 1,198 938 938 292 292
FTF and Online Combined FTF only Online only
Notes: Random effects models are estimated on section‐level residuals. First stage models include instructor, campus, year, and month fixed effects in addition to individual
controls, section average controls, and ZIP code controls. Residuals are taken with respect to all these variables other than instructor fixed effects. Individual controls include
male, age, incoming GPA, incoming credits, indicator for repeat MTH208, number of times taking MTH208, 12 program dummies, years since started program. Section average
controls include section averages of these same characteristics plust total enrollment in section. ZIP controls include the unemployment rate, median family income, percent of
families below poverty line, percent of adults with BA degree in ZIP code from 2004‐2007 ACS (plus missing ZIP). Students who did not enroll in MTH209 were assigned a zero
(failing) and students that did not possess a test score for 208 or 209 were assigned the 10th percentile of the test score from their 208 section. Robust standard errors
clustered by instructor in parentheses.
34

Table 4. Robustness to Having Same Instructor for MTH208 and MTH209, FTF SectionsAll models include full controls in first stage, correlated section effects, impute zero MTH209 grade if missing, impute 10th ptile of test score if missing MTH209 test score
Full sample
Test score
sample Full sample
Test score
sample Full sample
Test score
sample Full sample
Test score
sample Full sample
Test score
sample(1) (2) (3) (4) (5) (6) (7) (8) (9) (10)
Panel A. Outcome = Standardized Course GradeInstructor Effect
SD(MTH208 effect) 0.315 0.298 0.333 0.285 0.318 0.294 0.326 0.312 0.313 0.302
(.007) (.009) (.021) (.036) (.007) (.01) (.015) (.023) (.016) (.026)SD(MTH209 effect) 0.243 0.239 0.219 0.152 0.239 0.237 0.159 0.206 0.161 0.177
(.006) (.008) (.039) (.083) (.007) (.01) (.022) (.037) (.024) (.048)Corr (MTH208, MTH209) 0.657 0.597 0.333 ‐0.116 0.669 0.580 0.205 0.018 0.140 ‐0.067
(.02) (.032) (.137) (.441) (.023) (.038) (.107) (.166) (.118) (.243)
Panel B. Outcome = Standardized Test Score
Instructor EffectSD(MTH208 effect) 0.486 0.466 0.474 0.464 0.436
(.014) (.069) (.015) (.035) (.039)
SD(MTH209 effect) 0.481 0.296 0.467 0.526 0.486
(.015) (.093) (.016) (.036) (.042)
Corr (MTH208, MTH209) 0.597 1.000 0.597 0.523 0.546
(.029) (a) (.033) (.085) (.11)
Observations (sections) 13,791 4,707 856 314 7,224 2,645 1,587 573 1,402 513Number of Instructors 1,710 938 618 255 1,695 933 805 371 763 351
All FTF sections
FTF Sections with < 25% same
instructor
FTF sections with 0% same
instructor
Notes: Random effects models are estimated on section‐level residuals. First stage models include instructor, campus, year, and month fixed effects in addition to individual controls, section average
controls, and ZIP code controls. Residuals are taken with respect to all these variables other than instructor fixed effects. Individual controls include male, age, incoming GPA, incoming credits, indicator
for repeat MTH208, number of times taking MTH208, 12 program dummies, years since started program. Section average controls include section averages of these same characteristics plust total
enrollment in section. ZIP controls include the unemployment rate, median family income, percent of families below poverty line, percent of adults with BA degree in ZIP code from 2004‐2007 ACS (plus
missing ZIP). Students who did not enroll in MTH209 were assigned a zero (failing) and students that did not possess a test score for 208 or 209 were assigned the 10th percentile of the test score from
their 208 section. Robust standard errors clustered by instructor in parentheses. (a) indicates that convergence not achieved.
Not teaching 208 next 3
monthsNot teaching next 3 months
35
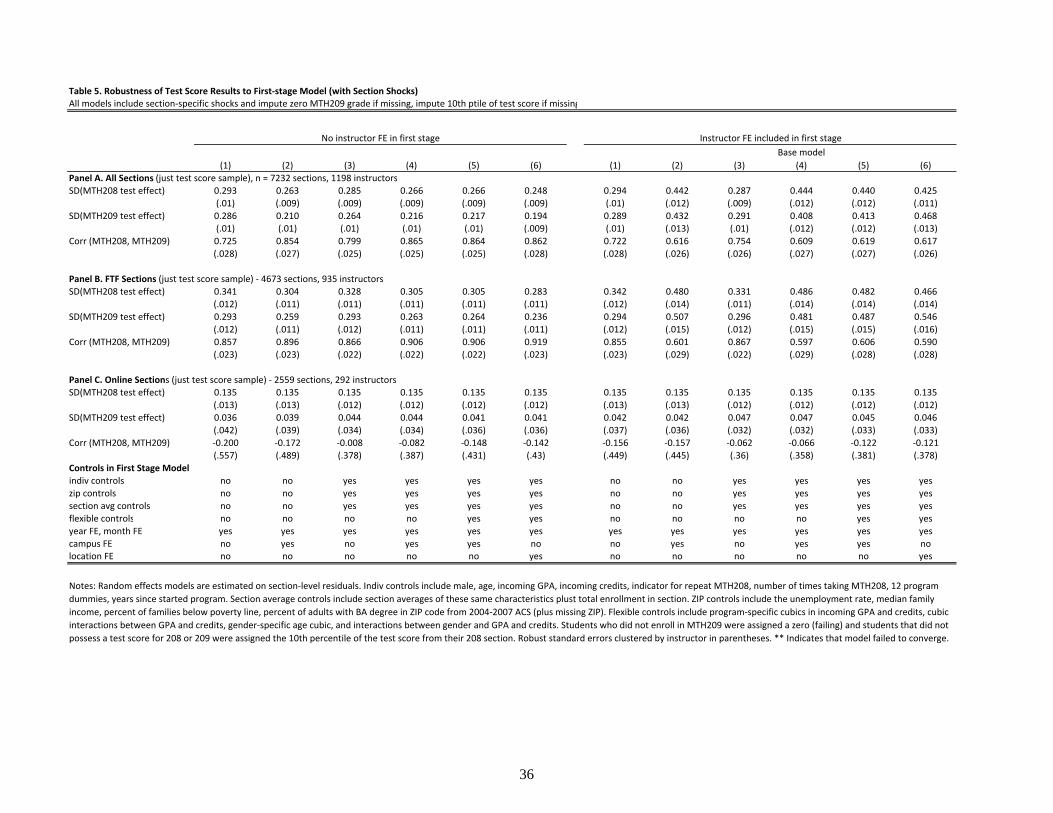
Table 5. Robustness of Test Score Results to First‐stage Model (with Section Shocks)All models include section‐specific shocks and impute zero MTH209 grade if missing, impute 10th ptile of test score if missing
nofe0 nofe1 nofe4 nofe6 nofe7 nofe8 fe0 fe1 fe4 fe6 fe7 fe8
(1) (2) (3) (4) (5) (6) (1) (2) (3)
Base model
(4) (5) (6)
Panel A. All Sections (just test score sample), n = 7232 sections, 1198 instructors
SD(MTH208 test effect) 0.293 0.263 0.285 0.266 0.266 0.248 0.294 0.442 0.287 0.444 0.440 0.425
(.01) (.009) (.009) (.009) (.009) (.009) (.01) (.012) (.009) (.012) (.012) (.011)
SD(MTH209 test effect) 0.286 0.210 0.264 0.216 0.217 0.194 0.289 0.432 0.291 0.408 0.413 0.468
(.01) (.01) (.01) (.01) (.01) (.009) (.01) (.013) (.01) (.012) (.012) (.013)
Corr (MTH208, MTH209) 0.725 0.854 0.799 0.865 0.864 0.862 0.722 0.616 0.754 0.609 0.619 0.617
(.028) (.027) (.025) (.025) (.025) (.028) (.028) (.026) (.026) (.027) (.027) (.026)
Panel B. FTF Sections (just test score sample) ‐ 4673 sections, 935 instructors
SD(MTH208 test effect) 0.341 0.304 0.328 0.305 0.305 0.283 0.342 0.480 0.331 0.486 0.482 0.466
(.012) (.011) (.011) (.011) (.011) (.011) (.012) (.014) (.011) (.014) (.014) (.014)
SD(MTH209 test effect) 0.293 0.259 0.293 0.263 0.264 0.236 0.294 0.507 0.296 0.481 0.487 0.546
(.012) (.011) (.012) (.011) (.011) (.011) (.012) (.015) (.012) (.015) (.015) (.016)
Corr (MTH208, MTH209) 0.857 0.896 0.866 0.906 0.906 0.919 0.855 0.601 0.867 0.597 0.606 0.590
(.023) (.023) (.022) (.022) (.022) (.023) (.023) (.029) (.022) (.029) (.028) (.028)
Panel C. Online Sections (just test score sample) ‐ 2559 sections, 292 instructors
SD(MTH208 test effect) 0.135 0.135 0.135 0.135 0.135 0.135 0.135 0.135 0.135 0.135 0.135 0.135
(.013) (.013) (.012) (.012) (.012) (.012) (.013) (.013) (.012) (.012) (.012) (.012)
SD(MTH209 test effect) 0.036 0.039 0.044 0.044 0.041 0.041 0.042 0.042 0.047 0.047 0.045 0.046
(.042) (.039) (.034) (.034) (.036) (.036) (.037) (.036) (.032) (.032) (.033) (.033)
Corr (MTH208, MTH209) ‐0.200 ‐0.172 ‐0.008 ‐0.082 ‐0.148 ‐0.142 ‐0.156 ‐0.157 ‐0.062 ‐0.066 ‐0.122 ‐0.121
(.557) (.489) (.378) (.387) (.431) (.43) (.449) (.445) (.36) (.358) (.381) (.378)
Controls in First Stage Model
indiv controls no no yes yes yes yes no no yes yes yes yes
zip controls no no yes yes yes yes no no yes yes yes yes
section avg controls no no yes yes yes yes no no yes yes yes yes
flexible controls no no no no yes yes no no no no yes yes
year FE, month FE yes yes yes yes yes yes yes yes yes yes yes yes
campus FE no yes no yes yes no no yes no yes yes nolocation FE no no no no no yes no no no no no yes
No instructor FE in first stage Instructor FE included in first stage
Notes: Random effects models are estimated on section‐level residuals. Indiv controls include male, age, incoming GPA, incoming credits, indicator for repeat MTH208, number of times taking MTH208, 12 program
dummies, years since started program. Section average controls include section averages of these same characteristics plust total enrollment in section. ZIP controls include the unemployment rate, median family
income, percent of families below poverty line, percent of adults with BA degree in ZIP code from 2004‐2007 ACS (plus missing ZIP). Flexible controls include program‐specific cubics in incoming GPA and credits, cubic
interactions between GPA and credits, gender‐specific age cubic, and interactions between gender and GPA and credits. Students who did not enroll in MTH209 were assigned a zero (failing) and students that did not
possess a test score for 208 or 209 were assigned the 10th percentile of the test score from their 208 section. Robust standard errors clustered by instructor in parentheses. ** Indicates that model failed to converge.
36

Table 6. Robustness to Imputation MethodAll models include full controls in first stage and include section‐specific shocks
No
imputation
Base model:
set equal to
0 (failing) No imputation
p10 for
campus‐year
of MTH208
section
Base model:
p10 of
students from
MTH208
section
mean of
students from
MTH208
section
minimum of
students from
MTH 208
section
mean for
students who
received same
grade in
MTH208
section
Panel A. All Sections (1) (2) (3) (4) (5) (6) (7) (8)
Instructor Effect
SD(MTH208 effect) 0.286 0.286 0.416 0.395 0.444 0.469 0.406 0.402
(.008) (.008) (.011) (.01) (.012) (.012) (.011) (.01)
SD(MTH209 effect) 0.244 0.205 0.394 0.343 0.408 0.495 0.379 0.374
(.008) (.007) (.011) (.01) (.012) (.014) (.012) (.011)
Corr (MTH208, MTH209) 0.477 0.550 0.544 0.614 0.609 0.531 0.623 0.556
(.034) (.03) (.028) (.025) (.027) (.028) (.027) (.027)
Panel B. FTF Only
Instructor Effect
SD(MTH208 effect) 0.298 0.298 0.445 0.430 0.486 0.503 0.445 0.436
(.009) (.009) (.013) (.013) (.014) (.015) (.013) (.013)SD(MTH209 effect) 0.288 0.239 0.457 0.392 0.481 0.572 0.447 0.430
(.01) (.008) (.014) (.012) (.015) (.017) (.014) (.013)Corr (MTH208, MTH209) 0.593 0.597 0.549 0.629 0.597 0.550 0.614 0.595
(.033) (.032) (.031) (.028) (.029) (.031) (.029) (.029)Panel C. Online OnlyInstructor Effect
SD(MTH208 effect) 0.227 0.225 0.115 0.107 0.135 0.141 0.123 0.118(a) (.012) (.009) (.009) (.012) (.01) (.012) (.009)
SD(MTH209 effect) 0.047 0.028 0.034 0.010 0.047 0.054 0.048 0.023(a) (.013) (.024) (.007) (.032) (.022) (.029) (.029)
Corr (MTH208, MTH209) ‐1.000 0.365 ‐0.296 1.000 ‐0.066 0.172 ‐0.276 0.359(a) (.234) (.403) (a) (.358) (.235) (.382) (.526)
Notes: Random effects models are estimated on section‐level residuals. First stage models include instructor, campus, year, and month fixed effects in addition to
individual controls, section average controls, and ZIP code controls. Residuals are taken with respect to all these variables other than instructor fixed effects.
Individual controls include male, age, incoming GPA, incoming credits, indicator for repeat MTH208, number of times taking MTH208, 12 program dummies, years
since started program. Section average controls include section averages of these same characteristics plust total enrollment in section. ZIP controls include the
unemployment rate, median family income, percent of families below poverty line, percent of adults with BA degree in ZIP code from 2004‐2007 ACS (plus missing
ZIP). Robust standard errors clustered by instructor in parentheses.
(a) indicates that convergence not achieved.
Test score outcomes
Missing test scores for MTH 208 and MTH209 replaced with…
Grade outcomes
Missing grades for MTH209
replaced with…
37

Table 7. Relationship between Course Grade or Test Effect and Teaching EvaluationAll models include full controls in first stage, impute zero MTH209 grade if missing, impute 10th ptile of test score if missing
MTH208
grade
MTH209
grade
MTH208
test
MTH209
test
MTH208
grade
MTH209
grade
MTH208
test
MTH209
test
MTH208
grade
MTH209
grade
MTH208
test
MTH209
test(1) (2) (3) (4) (5) (6) (7) (8) (9) (10) (11) (12)
Instructor EffectSD(learning effect) 0.286 0.205 0.444 0.410 0.299 0.240 0.487 0.484 0.227 0.028 0.137 0.048
(.008) (.007) (.012) (.012) (.009) (.008) (.014) (.015) (.012) (.013) (.012) (.032)SD(eval effect) 0.219 0.219 0.219 0.219 0.240 0.239 0.240 0.240 0.140 0.141 0.141 0.141
(.006) (.006) (.006) (.006) (.008) (.008) (.008) (.008) (.008) (.009) (.008) (.009)Corr (learning, eval) 0.439 0.237 0.084 ‐0.084 0.390 0.223 0.059 ‐0.074 0.751 0.597 0.520 ‐0.605
(.033) (.042) (.039) (.041) (.039) (.047) (.044) (.045) (.041) (.293) (.084) (.435)Section Effect
SD(learning effect) 0.271 0.279 0.399 0.490 0.278 0.291 0.400 0.450 0.257 0.262 0.399 0.555(.003) (.148) (.352) (.396) (.624) (.004) (.266) (.224) (.255) (.004) (.006) (.275)
SD(eval effect) 0.233 0.233 0.219 0.213 0.246 0.246 0.232 0.228 0.210 0.217 0.200 0.191(.003) (.178) (.641) (.913) (.706) (.003) (.457) (.442) (.313) (.004) (.004) (.797)
Corr (learning, eval) 0.174 0.040 0.119 0.001 0.156 0.041 0.102 0.001 0.214 0.041 0.153 0.001(.015) (.054) (.452) (.017) (.799) (.019) (.27) (.021) (.534) (.023) (.024) (.026)
Observations (sections) 7,267 7,267 7,267 7,267 4,707 4,707 4,707 4,707 2,560 2,560 2,560 2,560Number of Instructors 1,201 1,201 1,201 1,201 938 938 938 938 292 292 292 292
Notes: Random effects models are estimated on section‐level residuals. First stage models include instructor, campus, year, and month fixed effects in addition to individual controls, section
average controls, and ZIP code controls. Residuals are taken with respect to all these variables other than instructor fixed effects. Individual controls include male, age, incoming GPA, incoming
credits, indicator for repeat MTH208, number of times taking MTH208, 12 program dummies, years since started program. Section average controls include section averages of these same
characteristics plust total enrollment in section. ZIP controls include the unemployment rate, median family income, percent of families below poverty line, percent of adults with BA degree in
ZIP code from 2004‐2007 ACS (plus missing ZIP). Students who did not enroll in MTH209 were assigned a zero (failing) and students that did not possess a test score for 208 or 209 were
assigned the 10th percentile of the test score from their 208 section. Robust standard errors clustered by instructor in parentheses.
FTF and Online Combined FTF only Online only
Measure of student learning: Measure of student learning: Measure of student learning:
38

Table 8. Instructor Effects for Alternative OutcomesFirst stage model with full controls
Pass MTH208 Take MTH209
Credits earned
6mo
Panel A. Full Sample
SD (instructor effect) ‐ overall 0.073 0.051 0.126
(n = 26,384) (.002) (.002) (.004)
SD instructor effect ‐ FTF 0.080 0.062 0.154
(n = 13,791) (.002) (.002) (.005)
SD instructor effect ‐ online 0.059 0.031 0.059
(n = 12,593) (.002) (.002) (.004)
Panel B. Test Score Sample
SD (instructor effect) ‐ overall 0.072 0.059 0.130
(n = 7,267) (.002) (.003) (.006)
SD instructor effect ‐ FTF 0.077 0.069 0.150
(n = 4,707) (.003) (.003) (.007)
SD instructor effect ‐ online 0.056 0.032 0.040
( n = 2,560) (.004) (.004) (.011)
Outcome
Notes: Random effects models are estimated on section‐level residuals. First stage
models include instructor, campus, year, and month fixed effects in addition to
individual controls, section average controls, and ZIP code controls. Residuals are
taken with respect to all these variables other than instructor fixed effects. Individual
controls include male, age, incoming GPA, incoming credits, indicator for repeat
MTH208, number of times taking MTH208, 12 program dummies, years since started
program. Section average controls include section averages of these same
characteristics plust total enrollment in section. ZIP controls include the
unemployment rate, median family income, percent of families below poverty line,
percent of adults with BA degree in ZIP code from 2004‐2007 ACS (plus missing ZIP).
Robust standard errors clustered by instructor in parentheses.
39

Table 9. Correlates of Instructor EffectivenessFirst stage model with full controlsAll sections, faculty hired since 2002
MTH208
grade
MTH209
grade MTH208 test MTH209 test
Credits earned 6
months(1) (2) (3) (4) (5)
A. Linear, Only MTH208 Experience, Instructor FEsTaught MTH208 previously 0.0384*** 0.00635 0.0690** 0.0192 ‐0.0162
(0.0108) (0.0107) (0.0340) (0.0382) (0.0104)Times taught MTH208 0.00004 0.000127 ‐0.00333 ‐0.0034 0.00054
(0.0008) (0.0006) (0.0045) (0.0044) (0.0006)
B. Piecewise, Only MTH208 Experience, Instructor FEsTimes taught MTH208 = 1 0.0313*** ‐0.00153 0.0669* 0.0198 0.00050
(0.0121) (0.0123) (0.0363) (0.0424) (0.0121)Times taught MTH208 = 2 to 5 0.0409*** 0.00804 0.0777* 0.045 ‐0.0195*
(0.0121) (0.0121) (0.0398) (0.0440) (0.0114)Times taught MTH208 = 6 to 10 0.0403*** 0.00798 0.137** ‐0.000604 ‐0.005
(0.0156) (0.0145) (0.0541) (0.0563) (0.0140)Times taught MTH208 = 11 to 15 0.0412** 0.00129 0.169** 0.0432 ‐0.00106
(0.0200) (0.0176) (0.0656) (0.0682) (0.0170)Times taught MTH208 = 16 to 20 0.0397* ‐0.0087 0.159** 0.0765 0.0171
(0.0235) (0.0195) (0.0792) (0.0810) (0.0191)Times taught MTH208 > 20 0.0348 ‐0.00467 0.131 0.113 0.0428*
(0.0278) (0.0231) (0.0893) (0.0964) (0.0225)
C. Linear, Control for MTH209 experience, other math, non‐math experience linearly, time since hire, Instructor FEsTaught MTH208 previously 0.0277** ‐0.00529 0.0588 ‐0.0449 ‐0.0248**
(0.0135) (0.0127) (0.0484) (0.0547) (0.0118)Times taught MTH208 0.000248 0.00004 ‐0.00819 ‐0.00256 0.00084
(0.0009) (0.0006) (0.0051) (0.0048) (0.0006)Taught MTH209 previously 0.0146 0.0144 ‐0.0135 0.0809* 0.0154
(0.0154) (0.0130) (0.0536) (0.0487) (0.0117)Times taught MTH209 0.0015 0.000885 0.00104 0.00904** ‐0.00003
(0.0010) (0.0008) (0.0047) (0.0044) (0.0008)Years since first hire date 0.0023 ‐0.00468 0.0192 0.0382 0.0227
(0.0158) (0.0160) (0.0475) (0.0564) (0.0161)First hire more than one year ago 0.0167 0.0167 0.0844*** ‐0.0012 0.0014
(0.0121) (0.0115) (0.0320) (0.0329) (0.0107)
Notes: Section mean residuals are regressed on teaching experience, instructor fixed effects, and year and month fixed
effects. Sample restricted to 18,409 sections (5970 for test scores) taught by instructors hired since 2002. First stage
model include instructor, campus, year, and month fixed effects in addition to individual controls, section average
controls, and ZIP code controls. Residuals are taken with respect to all these variables other than instructor fixed effects.
Individual controls include male, age, incoming GPA, incoming credits, indicator for repeat MTH208, number of times
taking MTH208, 12 program dummies, years since started program. Section average controls include section averages of
these same characteristics plust total enrollment in section. ZIP controls include the unemployment rate, median family
income, percent of families below poverty line, percent of adults with BA degree in ZIP code from 2004‐2007 ACS (plus
missing ZIP). Students who did not enroll in MTH209 were assigned a zero (failing) and students that did not possess a test
score for 208 or 209 were assigned the 10th percentile of the test score from their 208 section. Robust standard errors
clustered by instructor in parentheses.
Outcome: Section‐level mean residual for
40

Table 10. Correlates of Instructor SalaryAll sections, faculty hired since 2002
(1) (2) (3) (4) (5)Section‐level mean residual for MTH209 grade ‐0.00521 0.00331 0.00642 0.00654 0.00648
(0.00567) (0.00475) (0.00460) (0.00437) (0.00437)Years since first hire date 0.02950*** 0.02737*** 0.04439*** 0.04592***
(0.00139) (0.00137) (0.00432) (0.00442)First hire more than one year ago 0.01049*** 0.00768** 0.00599 0.00537
(0.00368) (0.00352) (0.00368) (0.00379)Total sections taught previously 0.00051*** 0.00047*** 0.00006
(0.00012) (0.00011) (0.00015)Taught MTH208 previously 0.00221
(0.00353)Times taught MTH208 ‐0.00056**
(0.00026)Times taught MTH209 0.00014
(0.00028)Times taught other math courses ‐0.00014
(0.00030)Times taught nonmath courses 0.00015
(0.00020)Constant 1.03775 0.91904 0.90719 0.95343 0.95072
(0.00351) (0.00734) (0.00719) (0.01255) (0.01273)R‐squared 0.26521 0.53594 0.56478 0.71340 0.71372
Fixed effects None None Campus Instructor Instructor
Total Salary Paid for MTH208 Section ($1,000) (mean = 1.077)
Notes: Sample restricted to 18,080 sections taught by instructors hired since 2002.All specifications also include year and month fixed effects.
Section‐level residuals include the full set of individual and section controls and campus fixed effects, imputing zero MTH209 grades for
students that did not enroll. Robust standard errors clustered by instructor in parentheses.
41

Appendix A – Additional Tables and Figures
42

Table A1a. Descriptive Statistics for Sections and Instructors (Test Score Sample)
Mean Std. Dev. Mean Std. Dev. Mean Std. Dev.
Online section 0.352 0.478 0.000 0.000 1.000 0.000
Male 0.683 0.465 0.699 0.459 0.656 0.475
White 0.641 0.480 0.633 0.482 0.652 0.476
Section‐average student age 34.37 3.35 33.70 3.48 35.60 2.72
Section‐average share male 0.38 0.18 0.41 0.19 0.32 0.14
Section‐average incoming GPA 3.20 0.21 3.18 0.22 3.23 0.17
Section‐average incoming credits 24.53 7.15 25.20 7.77 23.30 5.65
Section‐average repeat 208 0.11 0.11 0.09 0.10 0.15 0.10
Section‐average number times taken 1.12 0.13 1.10 0.12 1.16 0.13
Section‐average time since program start (years) 1.23 0.52 1.20 0.51 1.30 0.53
Section enrollment 13.04 4.28 12.70 5.16 13.66 1.60
Years since first hire 6.271 5.008 5.908 5.450 6.939 3.987
Years since first hire > 1 0.832 0.374 0.802 0.399 0.887 0.317
Total math 208 sections taught prior to this section 19.661 20.900 13.704 15.689 30.615 24.542
Ever taught MTH208 prior to this section 0.937 0.244 0.911 0.285 0.984 0.126
Total sections instructor taught prior to this section 59.854 66.590 58.833 75.495 61.733 45.869
Total MTH209 sections taught prior to this section 14.014 16.765 13.139 15.680 15.621 18.490
Ever taught MTH209 prior to this section 0.805 0.396 0.896 0.306 0.639 0.480
All sectios
(n = 7,267)
Face‐to‐Face sections
(n = 4,707)
Online sections
(n = 2,560)
43

Table A1b. Descriptive Statistics for Students (Test Score Sample)
Mean Std. Dev. Mean Std. Dev. Mean Std. Dev.
Male 0.384 0.486 0.419 0.493 0.323 0.468
Age 34.319 9.411 33.570 9.300 35.601 9.460
Baseline GPA (0‐4) 3.206 0.576 3.195 0.565 3.227 0.594
Credits earned prior to start of Math 208 24.533 17.534 25.256 16.690 23.296 18.827
Took Math 208 before 0.112 0.316 0.089 0.285 0.152 0.359
Number of times MTH 208 taken 1.124 0.407 1.103 0.360 1.160 0.475
BS (general studies) 0.164 0.371 0.159 0.366 0.173 0.378
BS in Nursing 0.044 0.206 0.017 0.131 0.090 0.287
BS in Accounting 0.009 0.094 0.005 0.071 0.015 0.123
BS in Business 0.382 0.486 0.467 0.499 0.236 0.425
BS in Criminal Justice Administration 0.100 0.300 0.124 0.330 0.058 0.234
BS in Education 0.028 0.166 0.013 0.115 0.054 0.226
BS in Health Administration 0.091 0.288 0.092 0.288 0.090 0.287
BS in Human Services 0.044 0.204 0.036 0.186 0.057 0.232
BS in Information Technology 0.043 0.203 0.046 0.210 0.038 0.191
BS in Management 0.055 0.228 0.027 0.162 0.103 0.304
Non‐degree program 0.013 0.114 0.003 0.056 0.031 0.172
BS in other Program 0.025 0.155 0.009 0.095 0.051 0.221
Time since program start date (years) 1.234 1.596 1.197 1.425 1.297 1.850
Grade in Math 208 2.385 1.361 2.405 1.324 2.352 1.422
A / A‐ 0.283 0.451 0.275 0.447 0.296 0.457
B+ / B / B‐ 0.277 0.448 0.283 0.451 0.267 0.442
C+ / C / C‐ 0.189 0.392 0.203 0.402 0.167 0.373
D+ / D / D‐ 0.092 0.289 0.099 0.299 0.080 0.272
F 0.052 0.221 0.050 0.217 0.055 0.227
Withdrawn 0.106 0.308 0.090 0.286 0.135 0.342
Passed Math 208 0.842 0.365 0.861 0.346 0.810 0.392
Math 208 Final exam score available 0.854 0.354 0.894 0.308 0.785 0.411
Math 208 final exam % correct (if available) 0.707 0.241 0.696 0.246 0.728 0.230
Took Math 209 0.779 0.415 0.833 0.373 0.686 0.464
Grade in Math 209 (if took it) 2.467 1.249 2.524 1.187 2.347 1.361
A / A‐ 0.265 0.442 0.265 0.442 0.265 0.441
B+ / B / B‐ 0.296 0.457 0.307 0.461 0.273 0.445
C+ / C / C‐ 0.220 0.414 0.233 0.423 0.192 0.394
D+ / D / D‐ 0.102 0.302 0.107 0.309 0.091 0.288
F 0.040 0.195 0.031 0.174 0.057 0.232
Withdrawn 0.067 0.250 0.049 0.215 0.105 0.306
Math 209 Final exam score available 0.670 0.470 0.758 0.428 0.518 0.500
Math 209 final exam % correct (if available) 0.690 0.245 0.691 0.243 0.688 0.251
Credits earned in following year 10.947 5.348 11.561 5.078 9.897 5.628
Have course evaluation 0.369 0.483 0.342 0.474 0.416 0.493Course evaluation: Recommend instructor 0.661 0.473 0.694 0.461 0.614 0.487
All sections
(n = 94,745)
Face‐to‐Face sections
(n = 59,787)
Online sections
(n = 34,958)
44

Table A2. How much switching is there between online and FTF campuses?
Number of MTH208 faculty by online and FTF participation
0 1 2 3 4 Total
Never online 0 1,498 110 10 1 1,619
Taught online 534 126 14 3 0 677
Total 534 1,624 124 13 1 2,296
Total FTF campuses taught at
45

Table A3. Correlation across Outcomes (Restricted to Test Sample)All models include full controls in first stage, impute zero MTH209 grade if missing, impute 10th ptile of test score if missing.
All sections, restricted to test and evaluations sample (N = 7,135 sections)Test
MTH208
Test
MTH209
Grade
MTH208
Grade
MTH209
Credits
earned 6mo
Pass
MTH208
Take
MTH209
Good eval
MTH208
Test MTH208 1.00
Test MTH209 0.57 1.00
Grade MTH208 0.53 0.27 1.00
Grade MTH209 0.30 0.30 0.51 1.00
Credits earned 6mo 0.23 0.08 0.40 0.47 1.00
Pass MTH208 0.39 0.13 0.83 0.43 0.54 1.00
Take MTH209 0.13 0.01 0.38 0.63 0.52 0.51 1.00
Good evaluation in MTH208 0.11 ‐0.04 0.38 0.21 0.17 0.35 0.14 1.00
FTF sections, restricted to test and evaluations sample (N = 4,581 sections)Test
MTH208
Test
MTH209
Grade
MTH208
Grade
MTH209
Credits
earned 6mo
Pass
MTH208
Take
MTH209
Good eval
MTH208Test MTH208 1.00Test MTH209 0.61 1.00Grade MTH208 0.54 0.35 1.00Grade MTH209 0.34 0.31 0.60 1.00
Credits earned 6mo 0.35 0.12 0.46 0.47 1.00Pass MTH208 0.39 0.19 0.79 0.50 0.60 1.00Take MTH209 0.10 0.03 0.34 0.64 0.51 0.49 1.00
Good evaluation in MTH208 0.07 ‐0.03 0.31 0.21 0.14 0.27 0.06 1.00
Online sections, restricted to test and evaluations sample (N = 2,554 sections)Test
MTH208
Test
MTH209
Grade
MTH208
Grade
MTH209
Credits
earned 6mo
Pass
MTH208
Take
MTH209
Good eval
MTH208Test MTH208 1.00Test MTH209 0.06 1.00Grade MTH208 0.43 ‐0.30 1.00Grade MTH209 0.23 0.30 0.18 1.00
Credits earned 6mo 0.23 ‐0.06 0.54 0.56 1.00Pass MTH208 0.39 ‐0.32 0.91 0.20 0.62 1.00Take MTH209 0.28 ‐0.12 0.53 0.71 0.66 0.59 1.00
Good evaluation in MTH208 0.37 ‐0.15 0.66 0.19 0.35 0.63 0.42 1.00
Notes: Random effects models are estimated on section‐level residuals one outcome at a time. Tables show pair‐wise correlations between
predicted BLUPs for random instructor effects for each pair of outcomes. First stage models include instructor, campus, year, and month fixed
effects in addition to individual controls, section average controls, and ZIP code controls. Residuals are taken with respect to all these variables other
than instructor fixed effects. Individual controls include male, age, incoming GPA, incoming credits, indicator for repeat MTH208, number of times
taking MTH208, 12 program dummies, years since started program. Section average controls include section averages of these same characteristics
plust total enrollment in section. ZIP controls include the unemployment rate, median family income, percent of families below poverty line, percent
of adults with BA degree in ZIP code from 2004‐2007 ACS (plus missing ZIP). Students who did not enroll in MTH209 were assigned a zero (failing)
and students that did not possess a test score for 208 or 209 were assigned the 10th percentile of the test score from their 208 section. Robust
standard errors clustered by instructor in parentheses.
46

Appendix B – Final Exam Score Determination
For sections from July 2010 to March 2014, we have detailed information on student performance
separately by course assignment or assessment, which includes everything from individual homework
assignments to group exercises to exams. We use this data to obtain a final exam score for each student
when available. Because the data does not have a single, clear code for final exam component across all
sections, and instructors have discretion to add additional final exam components, we use a decision rule
to identify the “best” exam score for each student based on the text description of the assessment object.
Ideally, this measure would capture computer-administered tests, since instructors do not have
discretion over these. We therefore define a quality measure, ranging from 1 (best) to 4 (worst), that
indicates how clean we believe the identification of these test scores to be. Once a student in a certain
section gets assigned a test score, it is marked and not considered in later steps, so students get assigned a
single quality measure and the assigned test score is of the highest quality available
Group 1 consists of the computer-administered common assessments available to all UPX
instructors. To identify these assessments, we flag strings that contain words or phrases associated with
the computer testing regime (e.g., “Aleks”, “MyMathLab” or “MML”) as well as words or phrases
indicating a final exam (e.g., “final exam,” “final examination,” “final test”). If a student has an
assessment that meets these criteria, we use the score from this assessment as the student’s final exam
score.1 Specifically, we use the fraction of test items answered correctly as our measure of student
performance. Roughly 11% of student-sections in our test score subsample have a final exam score with
this highest level of quality, both for Math 208 and Math 209 test scores.
Some students have a single assessment with a word or phrase indicating a final exam (e.g., “final
exam,” “final examination,” “final test”), but no explicit indication that the exam was from the
standardized online system. If the assessment does not contain any additional words or phrases indicating
that the test was developed by the instructor (e.g., “in class”, “instructor generated,” etc.), we are
reasonably confident that it refers to the standardized online system. Hence, we use this assessment score
as the student’s final exam, but we consider these assessments as Group 2 for the purpose of exam
quality. Another 77 percent of student-sections fall into this category for the Math 208 and Math 209
sections.
The third group looks at strings such as “test”, “quiz”, and “course exam”. While quizzes and
tests may sometimes refer to weekly refresher assessments, these strings identify final test scores
1 In extremely rare cases (less than 4 percent of the sample), students will have more than one assessment that meets these criteria, in which case we sum the attained and maximal score for these components, and calculate the percentage score. This is, in part, because for many cases, there was no grade component that could be clearly identified as the test score (e.g. a student may have “Aleks final exam: part 1” and “Aleks final exam: part 2”). About 3.75% of these cases have two assessments that meet the criteria. The maximum number of components for a student is five.
47

reasonably well after having considered decision rules 1 and 2. About 9% of the student-sections fall into
this category for both section types. The fourth and final group selects a grade component as a final test
score if the title includes both “class” and “final”. Another 2 percent of the sample gets assigned a test
score of this quality for both the Math 208 and Math 209 sections.
48