Measuring innovation in education with a special focus on ...
22
1 Gábor Halász ELTE University, Budapest [email protected] Measuring innovation in education with a special focus on the impact of organisational characteristics 1 (DRAFT) Introduction _______________________________________________________________ 1 Measuring educational innovation in Hungary____________________________________ 2 The theoretical framework of the Innova research project _______________________________ 3 The Innova education sector innovation survey ________________________________________ 3 The indicators of individual innovation activity and behaviour _______________________ 4 The innovation behaviour index ____________________________________________________ 5 The innovation activity index ______________________________________________________ 5 Innovation behaviour and innovation activity _________________________________________ 7 Individual behaviour and organisational characteristics ____________________________ 9 Individual and organisational innovation activity_______________________________________ 9 Individual innovation behaviour/activity and the dynamic capacities of organisations ________ 10 Individual innovation behaviour/activity and the general profile of the organisation __________ 15 Multivariable analysis ___________________________________________________________ 17 Conclusion ________________________________________________________________ 20 References ________________________________________________________________ 20 Introduction Innovations created by teachers, teacher communities and schools in their daily practice play a crucial role in improving the quality and effectiveness of education. The invention of new, original solutions – simpler or more complex – are necessary to respond the many of the challenges teachers encounter in their everyday work. Protocols, central regulations, ready- made teaching materials do not provide solutions to all the problems that emerge in daily practice. Similarly to other knowledge intensive professions creativity and innovativeness are necessary skills for teachers and teacher communities to work effectively. And similarly to other knowledge intensive organisations, schools have to support innovative work behaviour and they have to manage change and innovation processes. Recent research on innovation and innovation processes is devoting growing attention to what is called employee-driven, practice-based or workplace innovation. “Achieving innovations 1 This paper has been produced as part of the ‘Innova’ research project funded by t he Hungarian National Research, Development and Innovation Office (project number: 115857) for the 2018 ECER conference (Bolzano).
Transcript of Measuring innovation in education with a special focus on ...

1
Gábor Halász
ELTE University, Budapest
Measuring innovation in education with a special focus on the impact of
organisational characteristics1
(DRAFT)
Introduction _______________________________________________________________ 1
Measuring educational innovation in Hungary ____________________________________ 2 The theoretical framework of the Innova research project _______________________________ 3 The Innova education sector innovation survey ________________________________________ 3
The indicators of individual innovation activity and behaviour _______________________ 4 The innovation behaviour index ____________________________________________________ 5 The innovation activity index ______________________________________________________ 5 Innovation behaviour and innovation activity _________________________________________ 7
Individual behaviour and organisational characteristics ____________________________ 9 Individual and organisational innovation activity _______________________________________ 9 Individual innovation behaviour/activity and the dynamic capacities of organisations ________ 10 Individual innovation behaviour/activity and the general profile of the organisation __________ 15 Multivariable analysis ___________________________________________________________ 17
Conclusion ________________________________________________________________ 20
References ________________________________________________________________ 20
Introduction
Innovations created by teachers, teacher communities and schools in their daily practice play a
crucial role in improving the quality and effectiveness of education. The invention of new,
original solutions – simpler or more complex – are necessary to respond the many of the
challenges teachers encounter in their everyday work. Protocols, central regulations, ready-
made teaching materials do not provide solutions to all the problems that emerge in daily
practice. Similarly to other knowledge intensive professions creativity and innovativeness are
necessary skills for teachers and teacher communities to work effectively. And similarly to
other knowledge intensive organisations, schools have to support innovative work behaviour
and they have to manage change and innovation processes.
Recent research on innovation and innovation processes is devoting growing attention to what
is called employee-driven, practice-based or workplace innovation. “Achieving innovations
1 This paper has been produced as part of the ‘Innova’ research project funded by the Hungarian National Research,
Development and Innovation Office (project number: 115857) for the 2018 ECER conference (Bolzano).

2
was earlier seen mostly as linear processes leading from scientific work to practical innovative
applications. Nowadays, innovation is most often considered to be a result of co-operation in
normal social and economic activities” – as written by two innovation researchers in their book
on practice-based Innovation (Melkas– Harmaakorpi, 2012; 2). Two other innovation
researchers have defined this form of innovation as “employees’ or management’s renewal of
their own operations in some respect, for example, by developing and implementing new
working methods, routines, products or services, where this renewal is based on informal
learning through work processes within the operations concerned” (Nilsen – Ellström, 2012;
156). Employee-driven, practice-based or workplace innovation has also been described as
“current, emergent, spontaneous, informal and unplanned” which „may not be part of the
explicit agenda of the organization” but might lead to the „‘remaking everyday work practice”
(Høyrup, 2012). This kind of innovation is also called “hidden-innovation” (NESTA, 2007)
because of the difficulty to grasp and measure it and because, in spite of its importance, it is
typically neglected in national or sectoral innovations surveys.
Employee-driven, practice-based or workplace innovation in the education sector is often
described as teacher-led innovation. An Australian report, analysing relevant policies and
practices in four systems (Canada, England, Scotland and Germany) has provided a good
summary of evidences on how advanced education systems move toward improvement models
based on teacher-led innovation. As the author noted: “the challenge is to engage teachers in
solving the problems faced by schools, learn from the new practice and innovations developed
and then share the professional knowledge laterally so that all can benefit” (Fraser, 2005).
Encouraging teachers and teacher communities to invent new, original solutions in their daily
practice has become one of the core elements of the education policies of the high performing
South-East Asian systems: one typical solution has been the adaptation of the Japanese model
of lesson study (see, for example, Cheng, - Lo, 2013; Goodwin, 2014). This is a well-established
form of using the creativity and initiatives of employees to improve continuously organisational
performance, which is a typical practice in Japanese companies
The growing importance of the innovation behaviour and innovation activity of employees in
improving the quality and effectiveness of systems and organisation is generating a need to
measure this behaviour and activity. Measuring innovation and innovation processes in the
education sector has become an important priority in several systems and this has been
increasingly promoted also by major international agencies (OECD, 2014, 2017; Dunne et al.,
2014). A proposal to launch of a new education sector innovation survey in the member states
has recently been proposed by the OECD, and this idea has received strong support from the
European Commission.2
In this paper we present some of the outcomes of an education sector innovation survey
conducted in Hungary. The first outcomes, based on a first data collection round at education
unit level, were presented internationally at the 2017 ECER conference in Copenhagen (see
Halasz, 2018a). This paper is based on the results of a second data collection round at both
educational unit and individual level.
Measuring educational innovation in Hungary
Similarly to many countries supporting innovation processes in the education sector has been a
policy priority in Hungary for many years. Since the accession of the country to the European
2 Direct information acquired by the author as them member of the OECD CERI governing board.

3
Union and the opening of structural funds for educational development in 2004 this support has
been substantially strengthened. Thousands of educational unites and teachers have been
involved in development interventions often explicitly requesting them to generate school or
classroom level innovations (Fazekas, 2018; Halász, 2018b). The support for educational
innovation has been oriented, among others, by education sector innovation strategy documents
(NIERD, 2011; Balázs et al.., 2015).3 An important element proposed by these strategies has
been the development of instruments to measure innovation processes in the education sector.
One of the aims of the Innova research project, launched in 2016, has been to create such
instruments and, using data collected with these instruments, to analyse the dynamics of
education innovation processes.
The theoretical framework of the Innova research project
The key elements of the theoretical framework of the Innova project has been presented
elsewhere (see, for example, Halasz, 2018a). To summarize: innovations or innovation
processes have been approached in the Innova research project simultaneously from four
different perspectives: (1) innovation seen as a product; (2) the emergence of innovations; (3)
the agents involved in creating/adopting innovations; and (4) the dissemination or diffusion of
innovations. These four perspectives have been complemented by the temporal and spatial
dimensions.
The Innova research project is focussing on innovations invented and applied by schools,
teachers or teacher teams, that is, on bottom-up innovations. It uses a simple and pragmatic
definition of innovation conceiving it as deviating from routine practice to produce better
results. A key notion is what we call the “innovation triangle”, inspired by Engeström’s activity
theory (Engeström, 1999a; 1999b). The innovation triangle has three components: (1) the
specificities of the problems or the problem situation emerging in daily professional practice,
(2) the cognitive processes used in the problem-solving process, and (3) the interactions of those
involved in the problem-solving process.
A basic assumption of the Innova research project is that innovation is a natural part of the work
of everyone who is facing challenging and complex tasks, and teachers certainly do so. This is
why research on employee-driven, practice-based or workplace innovation seems to be
particularly relevant in this context. Another basic assumption is that the innovation behaviour
and innovation activity of people is strongly conditioned by the organisation in which they
work. In fact, the aim of this paper is to explore, on the basis of Innova data, the complex
relationship between the innovation behaviour and activity of individuals, on the one hand, and
the organisational characteristics of their workplace, on the other.
The Innova education sector innovation survey
A major challenge encountered by those designing the Innova survey instruments has been their
intention to create one single instrument for the whole education sector, that is, questionnaires
that can be used at all level from kindergartens, through primary and secondary schools to
university departments and doctoral schools, including also private training providers in the
vocationally oriented adult education sector. Two types of questionnaires have been developed:
one for the leaders of education units (organisational questionnaire) and one for the teachers
employed by these units (individual questionnaire).
3 For a concise presentation of the Hungarian National Education Sector Innovation Strategy see OECD (2016).

4
A first data collection has been conducted with the first version of the organisational
questionnaire in the autumn of 2016, and a second round with the second version of the
organisational and the individual (employee) questionnaire in the spring of 2018. In both cases
emails were sent to the heads of all educational units in Hungary. The heads were invited to
answer the organisational questionnaires and to forward the invitation to answer the individual
questionnaire to the members of their staff. The data collections resulted in three separate
databases. These have been merged in two complex datasets presented in Table 1.
Table 1
The Innova datasets
Organisational dataset
Individual dataset
2016 data 2018 data Individual
data (aggregated
for each
organisation)
Individual
data
2016
organisation
data (linked to
each
individual)
2018
organisation
data (linked to
each
individual)
These complex databases allow various analyses, including those focusing simultaneously on
two levels (hierarchical analyses). In this paper we use only the individual database, focusing
on the innovation activity of individual teachers. Organisational data – provided by the heads
of the organisations where the individuals work – are used here as context variables linked to
individual data, in addition to the context variables data provided by the individual respondents.
Using these data describing the workplace context in which teachers innovate allows the
examination of the possible impact of workplace characteristics on the innovation behaviour
and activity of teachers.
Our teacher respondents have been invited to respond two groups of questions related with their
innovation practice. The questions belonging to the first group are general: they are not
connected with any concrete, specific piece of innovation (e.g. “I participated in a programme
in which I had to create new curricula, teaching tools and pedagogical methods myself”). The
questions belonging to the second group relate to one specific, concrete innovation created by
the respondent and chosen by him/her for more detailed exploration. In this paper we analyse
the relationship between the innovation behaviour/activity of individuals and the organisational
context in which they work using only the data of those respondents who were willing to choose
and to present one of their specific, concrete innovations.
The indicators of individual innovation activity and behaviour
In this study we use two individual innovation indexes calculated from the individual
questionnaire of the Innova survey. One refers to what we call innovation behaviour, the other
to what we call innovation activity. We make a distinction between these categories. Innovation
behaviour is a set of attitudes, predispositions and related forms of actions. Innovation activity
designates the intensity or frequency of people creating innovative solutions in their work. The
indicators of innovation behaviour allow the establishment of typologies classifying individuals
according to their attitudes, predispositions related with innovation. People belonging to these
categories might show various levels of actual innovation activity.

5
The innovation behaviour index
For the measurement of innovation behaviour we have been using a simplified version of an
instrument originally developed by de Jong and Den Hartog (2008), and later adapted to
educational institutions by Messmann - Mulder, 2012). This simplified instrument, originally
called Innovation Work Behaviour (IWB) scale, consists of 12 statements on various activities
related with innovation. Respondents were invited to indicate the frequency of these activities
in their professional practice on a 1-7 Likert scale. Our exploratory factor analyses revealed two
independent IWB factors: one related with creativity and idea generation, and the other related
with the implementation or realisation of ideas. For this study a principal component analysis
was used with the specification of 2 factors. These two (independent) factors explain 67% of
variation. Table 2 shows the correlation of the two factors with the test items.
Table 2
The innovative work behaviour of respondents (factor correlation matrix)
Factor
1
Factor
2
Obtaining approval to realise new ideas ,833 ,201
Searching for supporters to realize new ideas ,808 ,217
Encouraging staff members who are important in the
institution to adopt new ideas
,787 ,219
Taking risks to make promising solutions ,734 ,334
Systematically introducing new solutions at work ,718 ,420
Converting new ideas into a practical solution ,703 ,445
Evaluating the usefulness of emerging new ideas ,664 ,452
Following up on developments in institutions like us ,635 ,373
Finding new working methods, techniques, tools ,260 ,832
Finding new ideas in difficult areas ,293 ,790
Creating original solutions for specific problem
situations
,348 ,755
Follow up on new developments in my field ,235 ,684
We call Factor 1 “Implementation behaviour” and Factor 2. “Creative behaviour”. Factor
scores have been converted into a 1-100 scale for easier comparability. Both new variables
present a normal distribution.
The innovation activity index
The individual Innova questionnaire has contained a number of questions aimed at exploring
the intensity of the innovation activity of respondents. The latter have been asked to indicate
the frequency of certain forms of actions in their own practice of the last ten years. The
frequency has been used as a scale where the answer “this hasn’t ever happened” got the value
of 1 and the answer “this happened many times” got the value of 4. The answers to these
questions have been used to calculate a composite innovation activity indicator (CII). In this
case we have developed the indicator on the bases of theoretical considerations. Only a few
questionnaire items were used to calculate the value of the composite index and the value of
the index was based on simple average calculations and some theory based weighting.
The primary value of the indicator has been calculated as the simple average value of the
following four items:

6
“I discovered and started to use solutions that were significantly different from my
previous practice”
“I started to use solutions that were significantly differed from my previous practice,
which I learnt from others”
“Some of the new solutions I invented significantly improved the efficiency of my
work”
“I experimented with new solutions and methods that helped my own work”
The primary value of the CII has been increased (weighted) in function of the occurrence of
the following specific features.
1. A particularly high level frequency of the third item above considered as the most
important from the perspective of what we consider innovation activity
2. High level frequency of innovations in a number of specific domains, listed below:
Methods and tools for planning and implementing lessons
The evaluation or measurement of students’ achievements
Activities outside the classroom or lessons
Technical and IT solutions in in teaching
The internal organisation of the workplace
Technical and IT solutions affecting the leadership and the management or the
organisation
External relations with partners/users
The development of competences and abilities of students
New solutions for nurturing talent
The education disadvantaged students and/or students with special education
needs
3. High level frequency of certain innovation transmission activities, such as the
replication of solutions created by the respondent by colleagues within her/his
institution or from other institutions
4. The detailed presentation of one specific concrete innovation (which was optional in
the questionnaire)
Although the Innova research project did not aim at evaluating the general level of innovation
activity of Hungarian teachers (our sample does not represent the totality of the national teacher
labour force), the relatively high number of responses from the various subsectors of the
education system allows the formation an approximate picture about the intensity of individual
level innovation activity in the Hungarian education system. As Figure 1 shows the distribution
of individuals with lower and higher level innovation activity – as measured by our CII index
– is close to normal (similarly to what we see in the case of the two innovation behaviour
variables.
Figure 1.
The individual composite innovation activity index

7
Note: The values if the CII innovation activity index is between 0 and 100 (Mean = 29,1; SD=16,7)
As mentioned, respondents in the Innova survey have been invited to choose one concrete,
specific innovation they created and answer a number of specific questions related with this
concrete innovation. From the more than 4000 respondents more than 1300 have accepted to
present one concrete innovations created by them (34%). Unsurprisingly, the CII of these
respondents is significantly higher that the index of those who could not or did not want to
present a concrete innovation of their own. As mentioned earlier, in this study we shall analyse
the relationship between contextual factors and individual innovation practice on this limited
sample. Before doing this, it is interesting to make a short detour to see the relationship between
Innovation behaviour and innovation activity. In the following short section we still use the
whole individual database, including those who did not present a concrete innovation.
Innovation behaviour and innovation activity
It is not surprising that innovation activity and innovation behaviour are not independent from
each other. Those who show higher level value in the two IWB indicators also show higher CII
scores, identically in both IWB (implementation and creativity) domains, and this is similar
among those who presented and those who did not present concrete innovations. In Figure 2
we compare the CII scores of people belonging the lower and the higher 50% in both IWB
categories (the difference between them is always statistically significant). The figure also
shows that the relationship between innovation activity and innovation behaviour is similar in
the implementation and the creativity groups in spite of the fact that there is zero correlation
between the two IWB indicators.
Figure 2.
The innovation activity (CII score) of individuals belonging to the lower and the higher 50%
of the innovation behaviour groups among those who presented and those who did not present
concrete innovations

8
Notes: Data from the Innova2 individual database. The scale indicates the value of individual CII (1-100 scale).
The numbers above the bars show the number of cases. All differences between the pairs of bars are statistically
significant.
The existence of two IWB indicators allows the establishment of typologies. We call
"Routineman" those who do not show either creativity or implementation behaviour. Those
who show both are called here "Innovators”. Those who show creativity without
implementation behaviour are the “Dreamers” and those who show the opposite combination
are called here the “Managers”. Figure 3 shows the CII score of people belonging to these four
types, separately for those who presented and those who did not present a concrete innovation
of their own. The differences of the CII score of “Dreamers” and “Managers” are statistically
not significant but all the other differences are.
Figure 3.
The innovation activity (CII score) of individuals belonging to the four IWB types among
those who presented and those who did not present concrete innovations
Notes: Data from the Innova2 individual database. The scale indicates the value of individual CII (1-100 scale).
The numbers above the bars show the number of cases. All differences, except for the two bars in the middle are
statistically significant.
1382
1111
521
793
1340
1153
561
753
10,0
15,0
20,0
25,0
30,0
35,0
40,0
45,0
50,0
Lower 50% within thebehaviour category
Higher 50% within thebehaviour category
Lower 50% within thebehaviour category
Higher 50% within thebehaviour category
Those who DID NOT present a concrete innovation Those who presented a concrete innovation
Implementation behaviour Creativity behaviour
772
568 610
543243
318 278
475
10,0
15,0
20,0
25,0
30,0
35,0
40,0
45,0
50,0
"RO
UTI
NEM
AN
" ("
No
cre
ativ
ity,
no
imp
lem
enta
tio
n)
"MA
NA
GER
" (g
oo
dim
ple
men
ter
wit
ho
ut
cre
ativ
ity)
"DR
EAM
ER"
(hig
hcr
eat
ivit
y w
ith
ou
tim
ple
men
tati
on
)
"IN
NO
VA
TOR
" (b
oth
cre
ativ
ity
and
imp
lem
enta
tio
n)
"RO
UTI
NEM
AN
" ("
No
cre
ativ
ity,
no
imp
lem
enta
tio
n)
"MA
NA
GER
" (g
oo
dim
ple
men
ter
wit
ho
ut
cre
ativ
ity)
"DR
EAM
ER"
(hig
hcr
eat
ivit
y w
ith
ou
tim
ple
men
tati
on
)
"IN
NO
VA
TOR
" (b
oth
cre
ativ
ity
and
imp
lem
enta
tio
n)
Those who DID NOT present a concrete innovation Those who presented a concrete innovation

9
Figure 2 and Figure 3 also show the difference of CII scores between those who presented and
those who did not present concrete innovations. In the following we proceed our analyses only
within the former group, that is, those who were willing to select one of their own innovations
and were willing to provide data on this specific innovation. The number of cases in this group
is 1353: 79% of them are from the K-12 sector, 16% form higher education and 4,3% from
other sectors.
Individual behaviour and organisational characteristics
In this section we analyse the relationship between the two categories of individual innovation
indicators (CII and the two IWBs) and some organisational characteristics. The questionnaires
of the Innova surveys contain several sets of questions related with organisational
characteristics. This study does not allow the exploration of relationships through all relevant
sets of questions. We have selected thee areas for analysis: (1) the innovation activity of the
organisation (the generation of organisational level innovations); (2) the dynamic capacities of
organisations (workplaces operating as learning organisations); and (3) the general
organisational profile of organisations.
In the first area we use questions developed within the Innova research projects, in the two other
areas we use the adapted and simplified version well-known organisational research
instruments. I all cases we use data provided by the heads of those education units (pre-schools,
schools, university departments) where the examined individuals (teacher, trainers) work.
Individual and organisational innovation activity
The Innova database contains data not only about the innovation activity of individuals but also
about that of their workplaces. The organisational innovation activity score (characterizing the
workplace) has been calculated similarly to the way individual CIIs have been calculated. This
is based on similar questions but in this case the questions are related not with the individual
but with the organisation and the answers came from the heads of these organisations. Those
teachers who work in an organisation of higher level innovation activity show significantly
higher level CII scores. While the average CII of those teachers who work in organisations
belonging to the lowest one third of organisational innovation activity is 36,1 (N=199) those
working in the highest one third have a score of 41,9 (N=235).
The level of organisational innovation activity might have an impact not only on the innovation
activity of individual teachers but also on their innovation behaviour (IWB), although this
influence seems to be lower. In fact we did not find statistically significant difference between
the IWB score of teachers working in organisation showing lower and higher innovation
activity.
Data on the innovative work behaviour of individuals and the level of organisational innovation
activity allows again the creation of four specific groups which reflect four particular workplace
constellations. The first is described with the metaphor of "Empty iron box": this is the case
when an individual of low level average innovation behaviour score finds himself/herself in an
institution showing low level innovation activity. We call "Perl in iron box" the case when the
individual has high average IWB scores but works in an organisation with low level innovation
activity. When an individual with low average IWB score works in an organisation of high level
innovation activity we use the metaphor “Empty shell”. And when both the individual’s average
IWB score and the innovation activity level of her/his workplace are high this constellation is

10
called “Perl in shell". Figure 4 shows the CII scores of individuals belonging to these four
groups.
Figure 4.
The innovation activity (CII score) of individuals belonging to the four combinations of IWB
and organisational innovation activity
Notes: Data from the Innova2 individual and organisational database. The scale indicates the value of individual
CII (1-100 scale). The numbers above the bars show the number of cases. All differences, except for the
difference between the “Empty iron box” and the “Empty shell” people are statistically significant.
Unsurprisingly the “Perl in shell" situation seems to be the most favourable for the emergence of high level
individual innovation activity.
It is important to stress that in this analysis organisational data are used to characterize
individuals, assuming that the workplace environment in which individuals work can be
interpreted as one of their personal attributes. The unit of analysis is the individual, but the data
describing the individual characteristics has been provided by the head of the workplace of the
individual and comes from an organisational database.
Individual innovation behaviour/activity and the dynamic capacities of organisations
We use the term “dynamic capacities” to describe the capacity of organisations to behave as
intelligent learning organisations. The dynamic capacities of organisations have been measured
in our 2016 data collection round with a test adopted from the simplified version of the
“Dimensions of Learning Organization Questionnaire” (DLOQ) originally developed by
Watkins and Marsick (Marsick – Watkins, 2003; Yang et al., 2004; Bess et al., 2010; Song et
al., 2013; Horváth, 2017; Horváth – Halász, 2017). Respondents (leaders of educational units)
were requested to express their agreement with 14 statements about their organisation.
A principal component factor analysis (with varimax rotation) executed on the organisational
database4 resulted in 3 factors with eigenvalues higher than 1, explaining 60% of variation (see
Table 3). Factor 1 has been interpreted as people “working in organisations of high internal
coherence being open to their external environment” (labelled “Coherence/openness”); factor
2 has been interpreted as people “working in organisations providing support for the learning
and the work of their employees” (labelled “Support for learning and work”); and factor 3 as
4 For this analysis only the organisations of those individuals were included who presented one of their specific
concrete innovations. The number of organisations included in the factor analysis was 436.
161
143
161
178
20,0
25,0
30,0
35,0
40,0
45,0
50,0
55,0
"EMPTY IRON BOX" (lowIWB - low organisational
innovation activity)
"PERL IN IRON BOX" highIWB - low organisational
innovation activity)
"EMPTY SHELL" (low IWB -high organisationalinnovation activity)
"PERL IN SHELL"(high IWB -high organisationalinnovation activity)

11
people “working in organisations with a culture favourable for learning” (labelled “Learning
culture”).
Table 3
The dynamic capacities of respondents’ organisations (factor correlation matrix)
Factor 1
(“Coherence/
openness”)
Factor 2
(“Support for
learning and
work”)
Factor 3
(“Learning
Culture”)
The organisation/institution encourages
employees to seek solutions to problems even
beyond the institution
,741 ,112
In our organisation/institution there is a great
consideration of how decisions impact the
employees’ morale
,729 ,108 ,168
In this organisation/institution there is an
aspiration of unifying ideas regarding the
organisation’s vision for the future
,653 ,335 ,261
The organisation/institution supports that
employees think in a community perspective ,619 ,320 ,313
The organisation/institution recognises staff
initiatives ,546 ,531 ,190
The organisation/institution works with
external partners to achieve common goals ,507 ,386 ,180
The organisation/institution provides adequate
resources to the employees in order to
successfully complete their tasks
,795 ,126
The organisation/institution generally
supports the need for learning and training
opportunities
,147 ,791
In the organisation/institution, the number of
those that learn new skills is growing ,173 ,645 ,300
The organisation/institution provides a quick
and easy access to necessary information to
the employees
,443 ,573 ,130
The organisation/institution recognises the
learning activities of employees ,461 ,528 ,347
The employees are open to provide and
receive honest feedback from and to each
other
,167 ,163 ,905
The employees openly discuss mistakes in
order to learn from them ,222 ,109 ,871
The employees approach problems in their
work as opportunities to learn and develop ,294 ,239 ,744
The factor scores (converted into a 1-100 scale for easier comparability) have been used as new
variables interpreted as learning organisation dimensions. These variables are used here as
indicators of the environment in which our respondents do their daily work. This makes it
possible to compare individuals operating in different working environments which might have
an influence on their innovation activity and behaviour. This is again a case of using

12
organisational data to characterize individuals, assuming that the workplace environment in
which individuals work can be interpreted as one of their attributes.
Data show that those individuals who work in organisations with higher level dynamic
capacities (their workplace is closer to what we call a learning organisation) show slightly
higher level innovation activity. Those who are working in organisations belonging to the upper
one third of the combined index (mean of the three factor scores mentioned in the previous
paragraph) are significantly more active in creating innovations in their daily work than those
who work in organisations belonging to the lower one third (see Figure 5).
Figure 5.
The level of innovation activity of individuals working in different organisational
environments
Notes: Data from the Innova2 individual and from the Innova1 organisational database. The scale
indicates the value of individual CII (1-100 scale). The numbers above the bars show the number of
cases. The differences between the lower and the upper one is statistically significant.
However, when decomposing the combined indicators into its specific components we see a
more differentiated picture. It seems, there is only one dimension of learning organisation which
has a clearly positive linear relationship with the level of innovation activity of individuals:
those who are working in organisations which – according to their leaders – show higher level
support for the learning and the work of their employees are significantly more active in creating
innovations than those who work in organisations where leaders think this kind of support is
low. Interestingly, there is a slight (statistically not significant) negative correlation between
the innovation activity of individuals and the factor interpreted as internal coherence combined
with openness to the outside world. Individuals working in organisations described by their
leaders as showing high level internal coherence accompanied with high level outward
openness seem to be less active in creating innovations than those who work in other, less
coherent and more inward looking organisations. A similar pattern can be seen in connection
with what we described as learning culture. Those who work in organisations which, according
to their leaders, show particularly high level of culture seen typically as favourable for learning
seem to be less active in creating innovations than those who are working in an organisation
with a medium level of such learning culture (see Figure 6).
220
221
224
35,0
36,0
37,0
38,0
39,0
40,0
41,0
42,0
43,0
Combined dynamic capacitiesindicator lower one third
Combined dynamic capacitiesindicator midlle one third
Combined dynamic capacitiesindicator upper one third

13
Figure 6.
The level of innovation activity of individuals (CII scores) working in different organisational
environments
Notes: Data from the Innova2 individual and from the Innova1 organisational database. The scale indicates the
value of individual CII (1-100 scale). The numbers above the bars show the number of cases. Differences in
function of "Coherence/openness" are statistically not significant. Differences between the lover and higher one
thirds in "Support for learning and work" are statistically significant as well as the differences between the lover
and medium high one thirds of "Learning culture".
It is important to stress that Figure 6 shows the innovation activity of individuals. If we look at
the innovation activity of organisations (education units) we see a different picture. The
innovation activity of organisations shows a positive correlation with all the three indicators of
organisational dynamism. The question of why people working in organisations showing the
highest value in “Learning culture” show lower level innovation activity than those working in
organisations belonging to the medium one third (see the right part of Figure 6) is not easy to
answer. As Table 3 shows these are people whose leaders think their employees are particularly
“open to provide and receive honest feedback from and to each other”, they are particularly
ready to “openly discuss mistakes in order to learn from them” and “approaching problems in
their work as opportunities to learn and develop”.
As for the relationship between the innovative work behaviour (IWB) of individuals and the
dynamic organisational capacities of their workplace we see stronger connections, although
these are slightly different in the case of the two IWB types. As Figure 7 shows individuals
demonstrate higher level “creative behaviour” in those organisations which have higher level
dynamic capacities. Similarly to what we have seen in the case of CII the connection with the
factor internal coherence and outward openness is week (statistically not significant) and the
connection is the stronger with the factor of supporting the initiatives and the learning of
employees.
Figure 7.
The creative behaviour scores of individuals working in different organisational
environments
224
221
220
220
221
224
221
221
223
34,0
35,0
36,0
37,0
38,0
39,0
40,0
41,0
42,0
43,0
Factor 1 (“Coherence/openness”) Factor 2 (“Support for learning and work”)
Factor 3 (“Learning Culture”)
Lower one third Medium one third Higher one third

14
Notes: Data from the Innova2 individual and from the Innova1 organisational database. The scale indicates the
value of the creative behaviour scores of individual (1-100 scale). The numbers above the bars show the number
of cases. Differences between the lover and medium one thirds in "Support for learning and work" and
differences between the lover and higher one thirds in "Learning culture" are statistically significant.
As for “implementation behaviour”, this also has higher values in case of individuals working
in organisations with higher dynamic capacities. Interestingly, the level of this kind of
innovation behaviour is at the same in the case of people working in organisations belonging to
the medium and high one third of the value of the factors “support for learning and work” and
“learning culture” (see Figure 8).
Figure 8.
The implementation behaviour scores of individuals working in different organisational
environments
Notes: Data from the Innova2 individual and from the Innova1 organisational database. The scale indicates the
value of the implementation behaviour scores of individual (1-100 scale). The numbers above the bars show the
number of cases. Differences between the lover and medium one thirds in "Support for learning and work" and
"Learning culture" are statistically significant.
To summarize: the innovation behaviour and activity of individuals (teachers, trainers) is not
independent of the dynamic capacities of their workplaces (schools, university departments),
but the connections are not very strong. From the three dynamic capacity factors of workplaces
only two (support for work/learning and level of learning culture) show significant correlation
216
218
220
215
219
220
218
218218
49,0
50,0
51,0
52,0
53,0
54,0
55,0
56,0
57,0
Factor 1 (“Coherence/openness”) Factor 2 (“Support for learning and work”)
Factor 3 (“Learning Culture”)
Lower one third Medium one third Higher one third
216
218 220
215
219 220
218
218 218
50,0
51,0
52,0
53,0
54,0
55,0
56,0
57,0
58,0
Factor 1 (“Coherence/openness”) Factor 2 (“Support for learning and work”)
Factor 3 (“Learning Culture”)
Lower one third Medium one third Higher one third

15
with the innovative behavioural characteristics of individuals. One factor (internal coherence
and outward openness) seems not to have significant correlation with individual innovative
behavioural characteristics. Organisations (workplaces) demonstrating higher value in this
factor combine the stress of common internal values (coherence) positive attitudes towards
cooperating with their environment (openness). While they show higher level organisational
level innovation activity they seem not to give particular support for their employees to innovate
as individuals.
Individual innovation behaviour/activity and the general profile of the organisation
The general organisational profile of the educational units examined has been determined using
a simplified and adapted version of the Organizational Culture Assessment Instrument (OCAI)
developed Cameron and Quinn (Cameron - Quinn, 2006). Our instrument contains only 16
items. A principal component factor analysis (warimax rotation) executed on the organisational
database5 resulted in 2 factors with eigenvalues higher than 1, explaining 61% of variation (see
Table 4). Factor 1 has been interpreted as people “working in effective, democratic and stable
organisations” (labelled “Effectiveness”); factor 2 has been interpreted as people “working in
dynamic, innovative, performance oriented organisations” (labelled “Dynamism”).
Table 4
The organisational profile (OP) of education units (factor correlation matrix)
Effectiveness Dynamism
The members of the organisation are involved in the
decision-making process in a wide and proper manner ,756 ,208
The goals of the organisation are clear and understandable
for most employees ,750 ,224
Work is supported by the organisation's rules and the formal
methods and procedures applied ,719 ,203
Decisions in the organisation typically come about by
common agreement ,708 ,194
Workflows in the organisation are planned and controlled ,658 ,230
The organisation usually works intensely ,555 ,419
Working conditions are stable, predictable and well-designed ,509 ,247
The relationship between the workplace and the staff is
positive ,458 ,416
The organisation is seen by external viewers as a
dynamically developing system ,191 ,783
Outside viewers see the organisation as a dynamic, full of
potential ,197 ,751
The organisation encourages creative insights and innovative
ideas ,282 ,650
The organisation places great emphasis on innovation, trying
out new things and discovering new opportunities ,160 ,629
In the organisation, there is a constant pursuit of achieving
better and greater performance ,310 ,623
In the organisation, individual goals are guided by
organizational goals ,371 ,605
Employees of the organisation feel that they are important to
the organisation ,478 ,569
5 For this analysis only the organisations of those individuals were included who presented one of their specific
concrete innovations. The number of organisations included in the factor analysis was 389.

16
Quantification and measurement are a key feature of the
work culture ,138 ,479
The factor scores – similarly to the dynamic capacity variables – have been converted into a 1-
100 scale for easier comparability and they have been used as indicators of the profile of the
organisational environment in which our individual respondents work. Here again we have been
using organisational data to characterize individuals.
The two independent organisational profile (OP) variables allow the identification of four
different types of workplaces that can be described again with four different metaphors (see
Figure 9). Interestingly, the innovation activity of people working in “Rocket” organisations
(characterized by both high level effectiveness and high level dynamism, including
innovativeness) demonstrate slightly lower level innovation activity (statistically the difference
is not significant) than those who work in “Glider” organisations (characterized by high
dynamism and innovativeness but lower level of effectiveness and stability).
Figure 9.
The level of innovation activity of individuals (CII scores) working in different organisational
environments
Notes: Data from the Innova2 individual and organisational databases. The scale indicates the value
of the CII score (1-100 scale). The numbers above the bars show the number of cases. Differences
between, except between two highest values are statistically significant.
People with different innovation work behaviour (IWB) patterns are represented differently in
the four groups of organisations with different organisational profiles (OP). In the less effective
and less dynamic organisations (“Horse carts”) there is a much higher proportion of people
without both creativity and implementation capacity (“Routine men”) than in the three other
kinds of organisation (especially in “Rockets”). And inversely: the proportion of “Innovators”
is much higher in organisations labelled “Rockets” and “Gliders” than in those labelled “Horse
carts” or in “Trucks” (see Figure 10).
Figure 10.
The distribution of individuals belonging to different IWB categories within the four groups of
organisations with different organisational profiles (OP)
203
124
126 200
20,0
25,0
30,0
35,0
40,0
45,0
50,0
"HORSE CART" (Loweffectineness, low
dynamism organisations)
"TRUCK" (Higheffectineness, low
dynamism organisations)
"GLIDER" Loweffectineness, high
dynamism organisations
"ROCKET" (Higheffectineness, high
dynamism organisations)

17
Notes: Data from the Innova2 individual and organisational databases.
We assume that the positive relationship between the innovative work behaviour (IWB) and the
organisational profile (OP) patterns reflect the outcome complex evolution processes. “Horse
cart” type of institutions provide less favourable environment to “Innovators” than “Rocket”
organisations: “Innovators” probably try to leave these organisations and try to find a workplace
which is closer to the “Rocket” pattern. And, inversely, if “Innovators” leave the “Horse cart”
organisations the chances of the latter to develop into something that is closer to the other
extremity diminishes. This might generate self-amplification processes making the low lower
and the high higher. Let us illustrate this just by one figure: while more than 70% of individuals
working in “Rocket” type organisations chose the answer “frequently” or “very frequently”
when asked about how often they participated in the past ten years in further training where
they “learnt new ways to improve their performance” this proportion was less than 58% among
those who work in “Horse cart” type or organisations.
Multivariable analysis
In the previous sections we have demonstrated positive relationships between the innovation
activity and behaviour of teachers and trainers, on the one hand, and the characteristics of their
workplaces (pre-schools, schools, university departments), on the other. In most of the figures
presented so far we combined two or three variables and we compared specific groups. In this
section we present the outcomes of a multivariable analysis including all organisational
variables and all individual innovation behaviour/activity variables used in the sections above.
Since one of the goals of the Innova research project – as we could already see – is to identify
specific types of educational organisations in function of their possible impact on the innovation
behaviour/activity of teachers we use cluster analysis as a relatively simple statistical procedure
supporting classification.
A two-step cluster analysis with a preliminary specification of the number of clusters (N=4) has
been used in this analysis. The six organisational variables used as input variables in the cluster
analysis are the same as those used in the sections above:
(1) Organisational level innovation activity
(2) Organisational dynamism (learning organisation)
2a: Coherence/openness
2b: Support for learning and work
2c: Learning culture
28,6% 23,6% 21,1% 13,8%
26,5%26,8%
22,0%16,9%
18,9%19,5%
14,6%22,1%
26,0% 30,1%42,3% 47,2%
0%10%20%30%40%50%60%70%80%90%
100%
"HORSE CART" (Loweffectineness, low
dynamism organisations)
"TRUCK" (Higheffectineness, low
dynamism organisations)
"GLIDER" Loweffectineness, high
dynamism organisations
"ROCKET" (Higheffectineness, high
dynamism organisations)
ROUTINEMAN (No creativity, no implementation) MANAGER (Good implementer without creativity)
DREAMER (High creativity without implementation) INNOVATOR (Both creativity and implementation)
18
(3) Organisational profile
3a: Effectiveness
3b: Dynamism
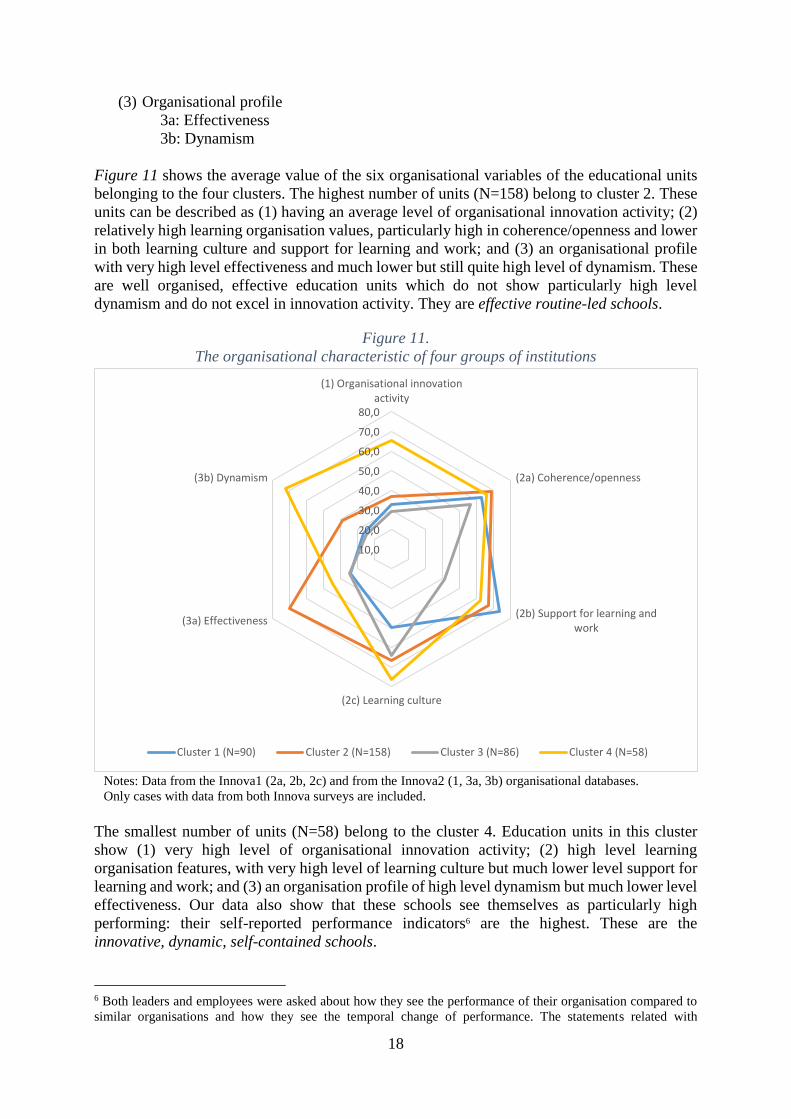
Figure 11 shows the average value of the six organisational variables of the educational units
belonging to the four clusters. The highest number of units (N=158) belong to cluster 2. These
units can be described as (1) having an average level of organisational innovation activity; (2)
relatively high learning organisation values, particularly high in coherence/openness and lower
in both learning culture and support for learning and work; and (3) an organisational profile
with very high level effectiveness and much lower but still quite high level of dynamism. These
are well organised, effective education units which do not show particularly high level
dynamism and do not excel in innovation activity. They are effective routine-led schools.
Figure 11.
The organisational characteristic of four groups of institutions
Notes: Data from the Innova1 (2a, 2b, 2c) and from the Innova2 (1, 3a, 3b) organisational databases.
Only cases with data from both Innova surveys are included.
The smallest number of units (N=58) belong to the cluster 4. Education units in this cluster
show (1) very high level of organisational innovation activity; (2) high level learning
organisation features, with very high level of learning culture but much lower level support for
learning and work; and (3) an organisation profile of high level dynamism but much lower level
effectiveness. Our data also show that these schools see themselves as particularly high
performing: their self-reported performance indicators6 are the highest. These are the
innovative, dynamic, self-contained schools.
6 Both leaders and employees were asked about how they see the performance of their organisation compared to
similar organisations and how they see the temporal change of performance. The statements related with
10,0
20,0
30,0
40,0
50,0
60,0
70,0
80,0
(1) Organisational innovationactivity
(2a) Coherence/openness
(2b) Support for learning andwork
(2c) Learning culture
(3a) Effectiveness
(3b) Dynamism
Cluster 1 (N=90) Cluster 2 (N=158) Cluster 3 (N=86) Cluster 4 (N=58)

19
The number of education units belonging to cluster 1 (N=90) and cluster 3 (N=86) is similar
and these units are also similar in their innovation activity level and organisational profile. They
show (1) low level organisational innovation activity; and (3) an organisational profile with low
level of both effectiveness and dynamism. However, they show (2) very different learning
organisation characteristics. Cluster 1 schools offer very high (the highest) level of support for
learning and work for their employees but their learning culture values are the lowest. In
contrast, cluster 3 schools provide very low support for the learning and work of their
employees, but the level of their learning culture is relatively high. Our data related with self-
reported performance show low level performance in both clusters but cluster 3 showing the
lowest. Units in cluster 1 could perhaps be described as effort-making laggards, while units in
cluster 3 as self-contained laggards.
Individual innovation behaviour and activity shows different patterns in the four groups. As
Figure 12 shows the innovative work behaviour (IWB) scores of individuals are the highest in
the group we described as effective routine-led schools but the scores of individual innovation
activity (CII) are the highest in the group described as innovative, dynamic, self-contained
schools. All individual innovation activity/behaviour scores are the lowest in the group of
organisations described as self-contained laggards.
Figure 12.
Average individual innovation behaviour and activity scores in four clusters of education
units
Notes: Data from the Innova2 individual and the Innova1 and Innova2 organisational databases.
The characteristics of the four clusters are presented in Figure 11. The differences between the
IWB scores of cluster 1 and 2 are statistically significant but those between cluster 1 and 3 are not.
In the case of CII only differences between cluster 3 and cluster 4 are statistically significant.
The identification of specific clusters might help the planning of improvement interventions,
including the exploration of existing innovation capacities of both organisations and people
working in these organisations. This might also support the self-evaluation of educational
organisations, including the identification of their strength and weaknesses. Higher level
organisational capacities in general predict higher level individual innovation capacities but, as
performance in the text are based on the analysis of composite performance indicators based on the questionnaire
items mentioned.
36,0
37,0
38,0
39,0
40,0
41,0
42,0
43,0
45,0
47,0
49,0
51,0
53,0
55,0
57,0
59,0
Cluster 1 ("Laggardsmaking efforts"- N=89)
Cluster 2 ("Effectiveroutine-led schools" -
N=155)
Cluster 3 ("Self-contained laggards" -
N=86)
Cluster 4 ("innovative,dynamic, self-contained
schools" - N=58)
IWB1 IWB2 CII

20
confirmed by multivariable analyses, some organisational features might be more supportive
than others.
Conclusion
Innovation generated by employees in their daily practice has an important role in improving
the quality of services. Those who are continuously inventing new solutions when encountering
challenges in daily work perform better than those who are led simply by routines and standard
protocols. In this respect the education sector is certainly not different from other public sectors.
Individual employees (teacher and trainers) differ in their capability and willingness to
innovate. Some of them show significantly higher level innovation activity and show more traits
of innovative work behaviour than others.
Similarly to other public service sectors innovation activity and behaviour can be measured in
the education sector through innovation surveys. Innovation surveys, when collecting data at
both individual and organisational level make it possible to explore how different workplace
environments influence the innovation activity and behaviour of individual employees. The
education sector innovation survey realised in the framework of the Hungarian Innova research
project has generated both individual and organisational data. A key assumption of the Innova
project has been that innovation activity and behaviour can be captured using the same
instruments in all subsystems of the education system, from pre-school to post-graduate tertiary
education. In this paper individual and organisational data have been used to explore the
differences between the innovation activity and behaviour of teachers and trainers working in
different workplace environments. The analysis in this paper has covered only those individuals
who, when invited to answer the Innova questionnaire, accepted to present in detail one of their
own specific innovations.
The analysis has demonstrated significant differences between the innovation activity and
behaviour of teachers and trainers employed by educational institutions/organisations showing
different organisational characteristics. Those working in institutions/organisations (1) showing
higher level innovation activity, (2) being closer to what we call a learning organisation and (3)
being more effective and dynamic tend to be more innovative. On the basis of these
organisational features education it is possible to identify specific clusters of education units.
People working in organisations belonging to these clusters show different levels of innovation
activity and behaviour. Data presented in this paper can be used by the designers of education
development interventions: these interventions can be made more effective if the specific
innovation capacities of target units are taken into account.
References
Balázs Éva - Fazekas Ágnes - Fischer Márta - Győri János - Halász Gábor - Kovács István
Vilmos - Molnár Lajos - Szőllősi Tímea - Vámos Ágnes - Wolfné Borsi Julianna (2015):
„Smart public education”. A recommendation to complement the National Education Sector
Innovation Strategy [„Okos köznevelés”. Javaslat a Nemzeti Oktatási Innovációs Rendszer
stratégiájának kiegészítésére.]
Bess, K. D., Perkins, D. D. & McCown, D. L. (2010). Testing a Measure of Organizational
Learning Capacity and Readiness for Transformational Change in Human Services. Journal
of Prevention & Intervention in the Community, 1, 35–49.

21
Cameron, Kim S. - Quinn, R. E. (2006): Diagnosing and changing organizational culture: Based
on the competing values framework. Jossey-Bass - Wiley
Cheng, E. C. and M. L. Lo (2013), “Learning Study: Its Origins, Operationalisation, and
Implications”, OECD. Education Working Papers, No. 94, OECD Publishing
De Jong, J. P., & Den Hartog, D. N. (2008). Innovative work behavior: Measurement and
validation. EIM Business and Policy Research, 1-27.
Dunne, Allison, Patel, Rakhee and Souto Otero, Manuel (2014) Study on policies promoting
innovative pedagogies that are effective in tackling low achievement in basic skills. European
Commission. Publications Office of the European Union
Engeström, Y. (1999a). Activity theory and individual and social transformation. In:
Engeström, Y., Miettinen, R. and Punamaki, R.- L. (Eds.). Perspectives on activity theory.
Cambridge University Press. pp. 19-38
Engeström, Y. (1999b). Innovative learning in work teams: analysing cycles of knowledge
creation in practice, in: In: Engeström, Y., Miettinen, R. and Punamaki, R. L. (Eds.).
Perspectives on activity theory. Cambridge University Press. pp. 377-406.
Fazekas Ágnes (2018): The impact of EU-funded development interventions on teaching
practices in Hungarian schools. Forthcoming
Fraser Andrew James (2005): Teacher-led innovation and development to improve professional
practice. The Winston Churchill Memorial Trust of Australia
Goodwin, A. Lin (2014): Perspectives on High Performing Education Systems in Finland, Hong
Kong, China, South Korea and Singapore: What Lessons for the U.S.? in: Lee, S. K., Lee, W.
O., & Low, E. L. (Eds.). (2013). Educational policy innovations: Levelling up and sustaining
educational achievement. Springer Science+Business Media Singapore. pp. 185-200
Halász Gábor (2018a): Measuring innovation in education: The outcomes of a national
education sector innovation survey. Forthcoming
Halász Gábor (2018b): Teacher Learning and Innovation: the Case of Hungary. A paper
prepared in the framework of the „Belt and Road Education Research Project” initiated in
2017 by the Chinese National Institute of Educational Sciences Forthcoming
Horváth László (2017): Organisational learning and innovation in the subsystems of the
Hungarian education system [A szervezeti tanulás és az innováció összefüggései a magyar
oktatási rendszer alrendszereiben]. Neveléstudomány: Oktatás Kutatás Innováció. (4). pp. 44-
66.
Horváth László – Halász Gábor (2017): Innovation in the Hungarian educational sector. In:
Petar Vrgović, Amila Pilav-Velić, Carsten Dreher (szerk.) DSCIM - 2017 1st Doctoral
Students Conference on Innovation Management: Proceedings
Høyrup, Steen (2012): Employee-Driven Innovation: A New Phenomenon, Concept and Mode
of Innovation. in: Hřyrup, Steen, Bonnafous-Boucher, M., Hasse, C, Lotz, M., Møller, K.
(eds): Employee-Driven Innovation. A New Approach. Palgrave Macmillan
NIERD (2011): Strategy proposal for the development of the Hungarian national education
sector innovation system. National Institute for Educational Research and Development
(online: http://ofi.hu/sites/default/files/ofipast/2011/05/8.1.-Vezetoi_osszefoglalo-EN.pdf.
Marsick, V. J., & Watkins, K. E. (2003): Demonstrating the value of an organization's learning
culture: the dimensions of the learning organization questionnaire. Advances in developing
human resources. 5(2). pp. 132-151.
Melkas, Helina – Harmaakorpi, Vesa (2012): Introduction. in: Melkas, Helina – Harmaakorpi,
Vesa (eds.): Practice-Based Innovation: Insights, Applications and Policy Implications.
Springer. pp. 1-17
Messmann, G., & Mulder, R. H. (2012). Development of a measurement instrument for
innovative work behaviour as a dynamic and context-bound construct. Human Resource
Development International, 15(1), 43-59.

22
NESTA (2007): Hidden Innovation How innovation happens in six ‘low innovation’ sectors
Nilsen, Per and Ellström, Per-Erik (2012): Fostering Practice-Based Innovation Through
Reflection at Work. in: Melkas, Helina – Harmaakorpi, Vesa (eds.): Practice-Based
Innovation: Insights, Applications and Policy Implications. Springer. pp. 155-172
OECD (2014): Measuring Innovation in Education: A New Perspective, Educational Research
and Innovation, OECD Publishing. Paris
OECD (2016): Innovating education and educating for innovation. The power of digital
technologies and skills. Paris: OECD Publishing
OECD (2017): Measuring Innovation in Education. A journey to the future. OECD Publishing.
Paris
Song, J. H., Chermack, T. J., & Kim, W. (2013): An analysis and synthesis of DLOQ-based
learning organization research. Advances in Developing Human Resources, 15(2), 222-239.
Yang, B., Watkins, K. E., & Marsick, V. J. (2004): The construct of the learning organization:
Dimensions, measurement, and validation. Human resource development quarterly, 15(1), 31-
55.