Measuring Innovation Around the World Revised · Measuring Innovation Around the World Ping-Sheng...
49
Measuring Innovation Around the World Ping-Sheng Koh Hong Kong University of Science and Technology David M. Reeb National University of Singapore, Senior Fellow: ABFER Elvira Sojli Rotterdam School of Management, Erasmus University Wing Wah Tham Erasmus University, Tinbergen Institute June 10, 2016 Abstract Research on corporate innovation often focuses on firms with positive US patent activity and reported R&D, thereby excluding over 90% of the firms in Compustat. By exploiting data from 30 global patent offices, we investigate the nature of missing innovation data in the US and around the world. We find systematic and predictable patterns across firms and countries for missing patents and R&D. We then compare the empirical efficacy of excluding firms without US patents or without reported R&D to simple replacement methods, and to various econometric solutions for missing patent and R&D data. We show how excluding or deleting firms without US patents or reported R&D, even in studies of just US firms, provides biased coefficient estimates and standard errors. We also demonstrate how the biases from simply excluding the missing observations lead to specific distortions in tests related to corporate growth and country level innovation capacity. We then discuss best practices or guidelines in handling missing R&D and patent data for studies in the US and elsewhere. Keywords: Disclosure, R&D Efficiency, R&D Bias, Patent Bias, Innovation, Missing Data, Measuring Innovation
Transcript of Measuring Innovation Around the World Revised · Measuring Innovation Around the World Ping-Sheng...

Measuring Innovation Around the World
Ping-Sheng Koh Hong Kong University of Science and Technology
David M. Reeb
National University of Singapore, Senior Fellow: ABFER
Elvira Sojli Rotterdam School of Management, Erasmus University
Wing Wah Tham
Erasmus University, Tinbergen Institute
June 10, 2016 Abstract
Research on corporate innovation often focuses on firms with positive US patent activity and reported R&D, thereby excluding over 90% of the firms in Compustat. By exploiting data from 30 global patent offices, we investigate the nature of missing innovation data in the US and around the world. We find systematic and predictable patterns across firms and countries for missing patents and R&D. We then compare the empirical efficacy of excluding firms without US patents or without reported R&D to simple replacement methods, and to various econometric solutions for missing patent and R&D data. We show how excluding or deleting firms without US patents or reported R&D, even in studies of just US firms, provides biased coefficient estimates and standard errors. We also demonstrate how the biases from simply excluding the missing observations lead to specific distortions in tests related to corporate growth and country level innovation capacity. We then discuss best practices or guidelines in handling missing R&D and patent data for studies in the US and elsewhere. Keywords: Disclosure, R&D Efficiency, R&D Bias, Patent Bias, Innovation, Missing Data, Measuring Innovation
1
1. Introduction
Investors, policy makers, and academics exhibit keen interest in evaluating corporate
innovation, a major engine of technological progress and productivity (Hsu et al., 2014; Bernstein,
2015). In empirical studies, researchers often use patent activity or R&D expenditures as proxy
measures of innovation (Bloom and Van Reenen, 2002). However, measuring corporate efforts to
create new knowledge remains difficult (Hall et al., 2014; Kogan et al., 2016). Scholars in economics
and business routinely report a substantial number of firms without any patent activity or reported
R&D; which leads them to exclude these firms or to treat them as engaging in zero (or near zero)
innovation (Lychagin et al., 2010). Unreported innovation data could arise because of no innovation,
unsuccessful R&D, as a disclosure choice (e.g., trade secrets), or because firms file patents in
alternative patent offices.
Empirical work on innovation recognizes that firms often lack patent or R&D expenditure
data. Yet, little is known about the size or magnitude of this missing innovation data problem.
Exploiting data from 30 global patent offices, we explore the nature of missing patents and R&D
data in firms in the US and around the world. Our central research question is how studies of
innovation, or those that rely on measures of innovation as a control variable, should assess firms
without reported R&D or patent activity. While deleting firms without United States Patent and
Trademark Office (USPTO) patents or reported R&D provides a quick solution to the missing data
problem for studies of US firms, the efficacy of this approach depends on the nature of the missing
data. Different treatments for missing data depend on the properties of the missing innovation data.
To determine the appropriate methods for handling unreported innovation data, we start
with a simple preliminary question: do missing patents or R&D indicate the same level of innovation
inactivity in different countries? Our formal analysis then begins with cross-country tests on the
predictability of missing patents and R&D. Next, we evaluate the empirical efficacy of excluding
firms without observable patents or reported R&D, comparing the practice to simple replacement
methods, and to various alternative solutions to handle missing innovation data. We also
demonstrate how different approaches to handling missing innovation data markedly affect tests

2
related to innovation capacity and firm growth. Finally, we provide specific recommendations and
guidelines for empirical research that seeks to capture corporate innovation.
Our primary analysis relies on data from the 29 countries with at least 100 equity-market
listed firms. We use the EPO (European Patent Office) Worldwide Patent Statistical Database
(PATSTAT) for data on patents and obtain financial statement information from the Compustat
Global database. The sample encompasses 37,272 unique firms from the period 1999–2012,
comprising 85% of the universe of unique firms in Compustat. Over 83% of the observations in our
sample fail to seek patent protection. Roughly two-thirds of the observations in our sample do not
provide R&D expenditure data. Of those that report positive R&D, 69.7% do not file for patents,
while 30% of firms with patents do not report R&D. Although, we use international data to
illustrate the nature and severity of the problem, this missing innovation problem is also a significant
issue for studies that only rely on US firms.
The chart below shows the relative distribution of firms without reported R&D or patents in
both the US and global data sets. For instance, studies that exclude firms without reported R&D and
patents (Q1) essentially discard 90% (82%) of the Global (North American) Compustat sample.
Similarly, studies that focus on measures of R&D efficiency (usually patents divided by R&D)
effectively count 25% of Global Compustat firms as innovation failures (Q2), and 4% of them as
almost infinite successes (Q3).
Chart 1: Distribution of Missing Innovation
Q1: Report R&D and Positive Patents
(10%) Global Compustat/Patents (18%) North America Compustat/Patents
Q2: Report R&D and No Patents
(25%) Global Compustat/Patents (28%) North America Compustat/Patents
Q3: Don’t Report R&D and Positive Patents
(4%) Global Compustat/Patents (5%) North America Compustat/Patents
Q4: Don’t Report R&D and No Patents
(61%) Global Compustat/Patents (49%) North America Compustat/Patents
In addition, studies that focus only on firms with reported R&D and patents (Q1) exclude
almost five times as many Q2 firms as Q3 firms, both of which contain firms with positive
3
information about corporate innovation activity. We also observe that non-reported patent data (Q2
+ Q4) is substantially more prevalent than non-reported R&D data (Q3 + Q4). In this context,
patent data arguably suffers from a more severe missing data problem than R&D. Missing patents
potentially arise from the decision to keep trade secrets or from the decision to patent in alternative
markets. Empirically, to evaluate “missing patents”, we focus on two potential measures. Our
primary analysis centers on firms that do not obtain patents with the USPTO but instead seek
patents in one of the other 29 patent offices in our sample. Alternatively, we define missing patents
as firms that do not obtain patents with their domestic patent office but instead seek patens in one
of the other 29 patent offices. As we obtain qualitatively similar conclusions with either approach,
our discussions center on first measure, namely patents outside of the USPTO office.
Among US firms, 69% of positive R&D firms never file for patents using the USPTO data,
while only 43% never file patent applications using the 30 global patent offices. Thus, without even
considering the role of trade secrets in protecting innovation (Png, 2016), this 26% wedge provides
clear evidence of missing patents in US firms for the econometrician relying only on USPTO data. In
this context, our measurement of missing patents provides only a conservative estimate of the
magnitude of the problem, because we do not capture trade secrets. The percentage of firms with
missing patent activity varies substantially across the 29 countries in our sample. In Korea, Taiwan,
and China, for instance, only 2%-3% of the firms file US patents without ever seeking domestic
patents, while around 32% of firms in Italy seek US patents and forego domestic patents. Similarly,
using any single domestic patent database to capture either domestic or foreign firms in any market
creates missing data problems. These results imply that patents are not missing completely at random.1
Consequently, missing patents, which stem from corporate patenting choices, do not appear to be
independent and identically distributed, implying substantial problems in simply truncating or
deleting firms without positive patent activity in USPTO.
1 Terminology in statistics, while awkward, differentiates between three types of missing data. Missing Completely at Random occurs when neither observables nor unobservables can predict missing observations. Missing at Random occurs when observables can predict missing observations, while Missing Not at Random occurs when missing observations are related to values of unobserved data. More generally, the appropriate techniques for the econometrician in dealing with missing innovation data depend on the type of missing data.
4
To gauge “missing R&D” around the world, we concentrate on non-reporting R&D firms
that actively seek patents (Koh and Reeb, 2015). In our sample, these missing R&D firms average
23.69 patents per year. Firms with positive R&D expenditures average 25.73 patents per year, and
firms that report zero R&D average less than one patent per year (0.10). Our cross-country
comparison indicates that the proportion of missing to positive R&D observations varies
significantly around the world, ranging from a high of 88% in Brazil to a low of 0% in Hong Kong.
In several countries, such as Italy and Korea, missing R&D firms average more patents per firm than
their positive reporting R&D counterparts. In short, missing R&D does not appear to equate to zero
R&D in most countries; in fact, missing R&D varies substantially across countries and does not
represent the same level of innovation inactivity across different countries, thus, providing evidence
to suggest that R&D expenditures are not missing completely at random.
To formally test the notion that missing innovation data randomly occurs across countries,
we explore the predictability of missing patents and R&D. Specifically, we investigate multivariate
correlations among country characteristics in studies of innovation, missing R&D and missing
patents across the 29 countries. We choose variables based on the literature on innovation but do
not make or infer any causal relations. Instead, our question centers on the potential for predicting
missing R&D using country-level institutional factors in order to determine whether they are missing
completely at random. Our multivariate results indicate that missing R&D is related to several measures
of government subsidies, labor regulations, and skilled labor. In contrast, missing patents occur
more readily in non-commonwealth countries and in those with high levels of manufacturing
intensity. These correlation results are inconsistent with the notion that R&D and patents are missing
completely at random. Instead, both missing R&D and missing patents are systematically related to
several proxies of market development, suggesting that there are selection biases in firms that report
R&D or file for patents across countries.2
2We repeat the analyses on missing patents and R&D in two specific industries with substantive innovation, namely Industrial and Commercial Machinery (SIC 35) and Chemical and Allied Products (SIC 28) reaching similar conclusions. Additional tests on just the US show that industry differences also predict missing R&D and patents.

5
Potential solutions for missing data involve excluding all firms with missing innovation data,
substitution approaches that replace the missing values with zero or industry averages, and methods
that attempt to adjust for the missing observations. We analytically show that excluding firms
without observable R&D or patents can heighten the potential bias with data missing at random (see
Appendix 1). The empirical implications of this analysis are that excluding US firms without USPTO
patents or reported R&D in studies that focus on innovation or use innovation as a control variable
yield biased coefficient estimates and standard errors. These implications hold for single-country and
cross-country studies. In short, studies using either a single country, like the US, or multiple
countries suffer severe distortions from naively truncating the missing observations or using simple
substitution methods for either missing R&D or missing patents. The resulting effects are likely to
be non-trivial as such truncations exclude substantially more firms from the analysis than are
included (e.g., Q1 vs. Q2+Q3 in Chart 1). While deleting observations without reported R&D or
patents seems intuitively appealing, this approach essentially assumes that the missing data
represents white noise, which it does not.
To evaluate the different approaches available to the econometrician in handling missing
innovation data, we simulate missing patents and R&D. One advantage of this approach is that we
can compare and contrast alternative solutions to dealing with missing innovation data across
different origins or kinds of missingness. In our simulation analysis, we find that the direction of the
bias for both patents and R&D could go either way depending on the context of the investigation.
Moreover, our simulations suggest that simple substitution models (e.g., replace missing R&D with
zero) fare poorly relative to methods that model the selection process or the missing innovation
variables. Allowing for the greater proportion of “missingness” in patent data relative to R&D data,
our simulation also indicates a larger bias in studies using patents to measure innovation relative to
those measuring innovation with R&D. One caveat is that our simulated measures of missing R&D
and patents understate the true level of missingness, because we cannot capture trade-secret related
non-disclosures. As such, our analysis arguably provides a lower bound for the potential problem of
missing innovation data.

6
To illustrate the selection issues related to different treatments of missing patents and R&D,
we compare firm characteristics of our complete sample to samples that only include observations
with either positive R&D or patents (partial deletion) and to those that only include firms with both
positive R&D and patents (full deletion). The full sample contains 333,920 firm-year observations.
In contrast, the partial deletion sample contains 122,546 firm-year observations, while the full
deletion approach contains only 26,273 observations. Studies that use partial deletion approaches
typically exclude firms missing the variable of interest (for example R&D) and set the other variable
to zero if it is missing (e.g., firms without USPTO patents are set to zero). It is noteworthy that
observable characteristics, such as profits, leverage, and capital intensity, vary substantially between
the three samples. For instance, profits among the full deletion sample firms are 400% lower than in
the full sample. Our perusal of the literature on the economics of innovation suggests that most
studies use either partial or full deletion to handle the problem of missing innovation data.
To illustrate the inference problems with deleting firms with missing patents and/or R&D,
we examine empirical investigations of innovation at the country and firm level. At the country, we
level consider simple rankings of country-level innovation capacity using both the partial and full
deletion approaches. The partial and full deletion approaches provide substantially different results
regarding country innovation capacity. The size of the discrepancy between the partial and full
deletion samples varies substantively across countries. Countries such as Taiwan, Austria, and Korea
are substantially under-ranked when using the full deletion sample (relative to the partial deletion
sample results). In contrast, countries such as Canada, Australia, and Denmark are substantially
over-ranked in their innovation capacity when using the full deletion sample.
At the firm level, we conduct regressions of firm growth on innovation. We consider several
methods for handling missing innovation data, including deletion, substitution methods, inverse
probability weighting, Heckman, and multiple imputation. The most important take away from these
specific findings is arguably that each of the different approaches yields a vastly different result. The
coefficient estimates and standard errors have different magnitudes and signs. We interpret this
evidence as suggesting that studies of innovation should rarely, if ever, naively exclude or delete
7
firms without attempting to deal with the non-random nature of unreported R&D or patents. The
common approach of simply deleting firms without reported R&D or patents generates biased
estimates.
Although, we demonstrate these issues with missing innovation data using our global
sample, similar problems arise in studies that only rely on US firms and data. Moreover, using R&D
efficiency to measure innovation provides an even more problematic approach to capturing
innovation. Tests that depend on on measuring R&D efficiency effectively either delete the missing
observations or classify them as zero innovators, creating biased coefficient estimates and standard
errors. Studies on innovation should consider using several different approaches to model corporate
R&D and patents in order to handle the missing data problem. In this context, we recommend that
researchers should always provide some basis statistics for the degree or magnitude of the missing
innovation data in their samples. Instead of naively excluding the firms with missing patents and
R&D, we should attempt to adjust for the non-randomness in the missing innovation data. Studies
that use R&D as a control variable, also suffer from this missing data bias.
Best practices for dealing with missing R&D and patent depend the source or type of
missingness. If the R&D data or patent information is missing due to simple data vendor errors,
then the likely best approach centers on deleting the missing observations and using multiple
imputation. Implicitly this assessment assumes that the vendor errors arise completely at random
across observations. Alternatively, if country, industry, or firm characteristics determine the
missingness of the R&D or patent data (MAR), then our analysis suggests that using multiple
imputation and inverse probably weighting provide the most reasonable solutions. Finally, if both
observable and unobservable firm characteristics, such as managerial skill or risk tolerance,
determine the missing R&D or patents (MNAR + MAR), then the Heckman procedure likely
provides the best approach to handling the missing data problem (coupled with multiple imputation
for benchmarking). In sum, studies of innovation should seek to adjust the sample of firms with
observable innovation, taking into account the characteristics of the full sample of firms (Chart 2 on
page 24 summarizes).

8
In sum, we document how the failure to disclose R&D or file patent applications implies
different things across firms, countries, and time. While the missing innovation data problem in
studies of innovation is well recognized, most common treatments implicitly assume that the data is
missing completely at random. The vast majority of studies in economics and finance either delete the
firms with missing observations or replace the missing data with zeros and a dummy variable. These
approaches assume that missing innovation data arises as white noise. Our analysis indicates that
undisclosed innovation systematically varies across firms and around the world. Rather than solving
the problem, simply deleting or excluding these firms/observations can magnify the potential bias.3
Similarly, replacing the missing with zero’s and including a dummy variable also provides biased
results. Our analysis suggests the specific use of methods that seek to adjust for the non-random
nature of the missing innovation data, such as multiple imputation, inverse probability weighting and
Heckman models, provides a more conservative approach to handling missing R&D and patent
data. Given the substantive differences in sample statistics between the full sample and subsamples
obtained after deleting missing observations, approaches that just delete the missing firms seem
especially problematic.
2. Data and Sample
The sample of patents is derived from the EPO-OECD-PATSTAT database. This database,
also known as the EPO Worldwide Patent Statistical Database, contains a snapshot of the European
Patent Office (EPO) master documentation database with worldwide coverage. It has more than 20
tables with bibliographic data, citations, and family links for about 70 million applications from more
than 90 countries, including the EPO and the USPTO.
Our sample selection begins with the October 2013 version of the PATSTAT data. It
contains 44,730,405 observations, including patentees who are individuals, governmental
institution/universities, and companies for the sample period of 1999–2012. We focus on the patent
3This bias might intuitively explain why the effect of patent applications on firm value becomes subsumed by the R&D variable in standard empirical tests. Specifically, if the missing bias in R&D expenditures is lower than that in patents, then R&D expenditures should have greater explanatory power in these tests.

9
applications of companies, which comprise 5,268,091 patentees. Our analysis relies on the registered
names on the original patent applications to better capture the entities that performed the
innovation activities.4 We merge the patent data with all publicly-listed firms in the Compustat
Global database for 32 countries (39,801 unique firms). Our matching algorithm consists of two
main steps. First, we standardize patent assignee names and firm names, focusing on unifying
suffixes and dampening the non-informative parts of firm names. Second, we apply multiple fuzzy
string matching techniques to identify the firm, if any, to which each patent belongs.
To facilitate cross country comparisons, we focus on countries with at least 100 publicly-
listed firms (excluding Hungary, Iceland, and Ireland). 5 However, including or excluding these
countries leads to similar inferences in our analysis. Thus, our primary sample contains 29 countries
over the sample period of 1999–2012. The countries in our sample are: Australia, Austria, Belgium,
Brazil, Canada, China, Denmark, Finland, France, Germany, Greece, Hong Kong, India, Israel, Italy,
Japan, Korea, Malaysia, the Netherlands, New Zealand, Norway, Singapore, South Africa, Spain,
Sweden, Switzerland, Taiwan, the UK, and the US. There are 30 patent offices in the sample because
the EPO is a separate entity from each European country’s patent office; European firms sometimes
patent in their home patent office and other times with the EPO. Our baseline sample includes
333,920 firm-year observations and 37,272 unique firms, of which 5,374 are cross-listed firms. All
accounting variables are from Compustat and are defined in Panel A of Table 1.
3. Univariate Analysis
3.1 Descriptive Statistics
Panel B in Table 1 reports the basic descriptive statistics of our sample firms. Only 35% of
the observations in our sample report any information on R&D. Of those reporting R&D
expenditures (118,264), 93% report positive R&D with an average R&D expenditure of 8% of their
4 We do not use patent ownership to identify the entities because patent ownership can be obtained without the owners performing any of the underlying innovation activities, such as via merger and acquisitions, acquisition of patent portfolios from other firms, etc. 5 Relaxing this 100-firm constraint or using a 1,000-firm constraint leads to similar inferences (see appendix).

10
total assets. The 75th percentile of R&D expenditures captures firms where R&D equates to roughly
6% of total assets. In addition, the sample firms invested an average of 6% of total assets in capital
expenditure. Firms have an average of 9 patent applications, 4 patents granted, and 23 citations over
the sample period. On average, firms are profitable with an average ROA (return on assets) of 1%
(median of 5%) and are highly levered with a median leverage of 52%. In our analysis, we focus on
patent applications but find similar results using patents granted.
3.2 Cross-Country Missing R&D Expenses and Patents
In this section, we examine the firms’ R&D reporting characteristics across the 29 countries
in our sample. Table 2 provides information on reporting and patent applications at the firm-year
level for each country. Overall, we find that more than 60% of firms do not report R&D. There is a
large variation in cross-country R&D reporting behavior, with over 83% of Australian firms and
only around 25% of Taiwanese firms not reporting R&D. Interestingly, only Canadian and US firms
report zero R&D. Using firm-level observations, Figure 1 documents similarly broad cross-country
variations in missing R&D.
Table 2, Column (4), reports the number of observations with “Missing R&D.” “Missing
R&D” is defined as firms that do not report R&D but have patenting activity. A large number of
firms in Germany, Korea, and the US do not report R&D but have patenting activity. Italy and
Austria seem to suffer more severely from the missing R&D problem, while China and South Africa
have very few firms with missing R&D. Figure 2 presents the proportion of missing R&D firms to
(1) positive R&D firms and (2) positive R&D firms with patents across the 29 countries in our
sample. We can clearly observe that both metrics vary significantly across countries. Missing R&D
observations (non-reporting but positive patents) as a percentage of positive R&D observations
range from near 0% in Hong Kong to 88% and 86% in Brazil and Italy, respectively. This variation
is also observed among the traditionally research-intensive countries: Germany (39%), Japan (3%),
and the US (13%). On average, missing R&D observations represent 25% of positive R&D
observations in a country. Missing R&D observations relative to patent-positive R&D firms,
11
arguably the correct comparison group, exhibit substantial cross-country variation and an average of
39%.
Turning to missing patents, in Table 2 Column (5), we classify an observation as “Missing
Patent” when the firm files for patents with non-USPTO patent offices but not with USPTO in that
year.6 This is equivalent to the number of observations where patent activity actually exists but is
considered as non-existent in cross-country studies that rely solely on the USPTO database. As a
consequence, these cases are likely to be discarded. In particular, relying on the USPTO database to
identify corporate innovation activity in a cross-country study results in discarding 11,094 firm-year
observations with positive patent activity. As studies that strictly focus on positive R&D and patents
would only contain 33,454 firm-year observations in our sample, this is a substantive deletion issue.
Turning these numbers into percentages indicates that these erroneous deletions represent between
6% and 58% of observations depending on the specific country of interest. For instance, 39% of
French and 29% of Japanese firms are erroneously classified as non-patenting firms when relying
strictly on USPTO data. Similarly broad cross-country variations in missing patents are observed
using firm-level observations (see Figure 1).
Figure 3 reports the proportion of Missing Patent firms (i.e., firms in a country that never
file for a USPTO patent but file for non-USPTO patents) relative to both firms that report positive
R&D and file for patents and firms that only report positive R&D. There is substantial variation in
the proportion of firms that do not patent in the US. China and Brazil exhibit the highest ratio
(above 200%) of non-USPTO filers to positive R&D and patenting firms. More than double the
firms in most countries do not file for USPTO patents as a proportion of positive R&D and
patenting firms.
In Table 2, Columns (6-9), we report the proportion of observations in each quadrant in
Chart 1 to total observations in a country. Note that firms in Q1-Q3 provide observable displays of
innovation activity either via reported R&D and/or patent applications. Using only reported R&D to
6 US firms are classified as “Missing Patents” if they file for patents with a foreign patent office but not with the USPTO in that particular year.

12
capture innovative firms net between 53% (Brazil) and 99% (Hong Kong and Malaysia) of the firms
with observable innovation, with a country-average of 83%. In contrast, relying strictly on patent
data to capture innovative firms only nets between 1% (Hong Kong and Malaysia) and 62% (Italy)
of the firms with observable innovation (country-average of 36%). In addition to demonstrating
substantive cross-country variation in missing innovation data, this evidence suggests that missing
patents are likely to be more problematic than missing R&D to the econometrician studying
corporate innovation.
Our evidence thus far points to firms exercising discretion in deciding whether to report
R&D expenditure in their financial statements as well as whether to patent their innovations. More
importantly, these decisions and the levels of innovation vary significantly between countries. We
observe similar patterns using firm-level data instead of firm-year data, and most importantly, there
are no obvious patterns between the metrics. One potential implication is that different processes
drive the R&D disclosure decision and the choice to patent corporate innovations.
3.3 Patenting with Domestic and Foreign Offices
Figure 4 depicts the total number of patent applications submitted by firms in the 29
countries of our sample. Firms from four countries—the US, Japan, Germany, and Korea—
dominate in terms of patent applications filed around the world. Each of these countries submitted
more than 150,000 applications during the sample period. This is followed by a cluster of two
countries, France and Taiwan, with between 125,000 and 150,000 patent applications each. Given
this background, we turn our attention to examining the cross-country differences in firms choosing
to file patents domestically or with foreign patent offices.
Table 3 reports the country level patent applications in USPTO and non-USPTO patent
offices. Columns (1) and (2) show the country-level number of patent applications filed in USPTO
and non-USPTO patent offices. Column (3) reports the ratio of non-USPTO to USPTO patent
filings. One obvious pattern that emerges is that the USPTO dominates patent applications, with
37% of all applications being filed in the US. Unsurprisingly, a large proportion of the USPTO
13
filings (53%) come from US firms, which mainly file patents domestically. For example, for every
one patent filed at a foreign office, 1.24 patents were filed domestically by US firms. Singapore is the
only other country that files more USPTO than non-USPTO patents.
Among the top patent application countries (from Figure 4), Korean and German firms file
significantly more patents in non-USPTO offices than with USPTO offices. Specifically, among
Korean firms, for every one patent filed with the USPTO, an average of 8 patents are filed with
non-USPTO offices. Examining the other countries more broadly, we observe significant variation
in the proportion of USPTO to non-USPTO patent office filings from 1.2 in Israel to 13 in Spain.
Columns (4) and (5) show the average number of patent applications and the number granted per
firm per country. The average number of yearly patent applications per firm also varies substantially
between countries. Germany has the highest number of applications at 33.71, while Hong Kong has
the lowest at 0.01. Interestingly, other research-intensive countries such as Japan and the US only
ranked fifth and seventh respectively based on yearly patent applications per firm.
In general, we observe significant cross-country variation in firm’s choice to patent with the
USPTO or non-USPTO offices. Given the scarcity of foreign company patents in the USPTO
filings and the great variation between countries, relying on patents filed with the USPTO to
examine innovation around the world appears potentially problematic. In a later section, we
explicitly examine the potential consequences of relying solely on the USPTO patent data.
3.4 Cross-Country Variation in Missing R&D and Patents: White Noise or Systematic Variation?
In this section, we investigate whether our observed variation represents random noise or is
systematically related to country-level institutional factors. Note that these tests do not seek to
establish causality, but rather to emphasize association and rule out random noise as an explanation
for the observed cross-country variation. The country-level institutional factors we examine include
economic openness, manufacturing intensity, government subsidies, labor regulations, intellectual
property rights, university ties, skilled labor, honesty, regulatory efficacy, and commonwealth
countries. The data was obtained from the World Competitiveness Yearbook compiled by IMD (the

14
International Institute for Management Development). Table A1 in Appendix 3 provides the
definitions for all these variables. Some survey-based variables are not available for all the countries
in the sample.
In Table 4, we report the multivariate correlation between these country-level factors and the
ratio of (1) missing R&D firms to positive R&D firms per year (Columns 1 and 2) and (2) missing
patent firms to positive R&D firms per year (Columns 3 and 4). To provide a cleaner test setting, we
exclude cross-listed firms from our main analysis here given that cross-listed firms are likely to be
subjected to institutional factors from multiple countries.7 We find that the ratio of missing R&D to
positive R&D firms is significantly related to most of the examined institutional factors, except for
economic openness, intellectual property rights, and regulatory efficacy (Columns 1 and 2).
Decisions not to disclose R&D expenditures (i.e., missing R&D) are positively associated with the
level of intensity in various manufacturing industries, government subsidies, having a more skilled
labor force, and being a less corrupt country (p-values < 0.00). In contrast, firms are more likely to
report their R&D expenditure when labor regulations are conducive to business activities, when
there are more ties between universities and firms to facilitate knowledge transfer, or in
commonwealth countries (p-values < 0.00). Interestingly, institutional factors that have been
generally perceived as desirable, such as having a skilled labor force and less corruption, are
associated with firms choosing to hide their R&D expenditure information. Overall, our evidence
thus far suggests that cross-country decisions not to disclose information pertaining to R&D
expenditures are systematically associated with many institutional factors and are unlikely to be
missing completely at random.
Regarding patenting decisions, we find that the ratio of missing patents to positive R&D
firms is significantly associated only with manufacturing intensity and commonwealth countries
(Columns 3 and 4). Missing patents occur more often if there are more manufacturing-intensive
7 Table IA1 in the Internet Appendix presents the results of our additional analysis using samples that include cross-listed firms. Panel A reports the univariate correlation results, while Panel B reports on the multivariate correlation analysis. Both sets of results yield conclusions that are qualitatively similar to our main findings in Table 4. Furthermore, including a time trend variable in our multivariate correlation tests does not alter our conclusions.

15
industries and less often in firms located in commonwealth countries (p-values < 0.00). Once again,
some institutional factors that are generally perceived as desirable are associated with missing
patents.
We conduct a similar analysis of missing R&D and missing patents at the firm-year level. We
estimate a probit model with year, industry, and country fixed effects. Panel B of Table 4 shows the
effects of firm-specific fundamentals on the reporting of R&D and on patenting. Missing R&D and
patents increase at the firm level with total assets and property, plant and equipment (PPE, p-values
= 0.00 and 0.06 respectively), while they decrease with sales growth (p-values < 0.03). Missing
patents also decrease with ROA (p-values < 0.00). Collectively, our evidence indicates a significant
correlation between the missing patents and several institutional and firm-specific factors. Thus, the
variation we observed in our earlier analysis appears to be inconsistent with R&D and patent activity
missing completely at random.
4. Empirical Implications for Studies on Innovation
Next, we evaluate the implications of the above findings for the common treatments of
innovation input (R&D expenditure) and output (patenting) measures in studies of innovation.
Perhaps the most common treatment in economics for missing R&D data or unobservable patent
data is to delete the missing or blank observations (listwise deletion). In Appendix 1, we analytically
show that excluding firms without patents or R&D provides unbiased estimates if and only if the
missing data represents white noise (iid, independent and identically distributed). However, our
empirical evidence thus far is inconsistent with missing innovation representing white noise.
4.1 Approaches to Handling Missing Innovation Data
Missing data can be classified into three categories: missing completely at random, missing at
random, or missing not at random (Rubin 1976, 1987). Common techniques for dealing with missing
data include deletion, zero or mean substitution, regression substitution, and multiple imputation.
Their appropriateness depends on the nature of the missing data problem. The mean substitution

16
and single imputation approaches are common avenues for dealing with missing observations (e.g.,
the industry average plus the indicator variable or Heckman approach); however, these approaches
have two key limitations. The first approach biases the missing variable toward the mean and
distorts the variance covariance matrix, while the second approach depends on the quality of the
instrument used by the econometrician. In addition, both approaches treat imputed values as though
they were observed (i.e., estimated without uncertainty), which is not the case; imputations are only
estimates. As a result, analyses of a single imputation can overstate confidence in the parameter
estimates, meaning that the standard errors are biased downward.
Multiple imputation addresses this bias problem by introducing an additional form of error
based on variation in the parameter estimates across the imputations. The advantages of multiple
imputation are its generalizability and replicability—it explicitly models missingness and gives
confidence intervals for estimates rather than trusting a single imputation. Of course, all of these
approaches rely on the model specified by the econometrician to predict the missing variables.
4.2. Comparison Analysis
To gauge the efficacy of different methods for handling missing innovation data, we describe
the results of a simple simulation that compares five different approaches to handling the missing
data problem, namely, multiple imputation, Heckman, mean substitution, deletion, and replacement
with zero. Appendix 2 details the simulation process. Our basic analysis centers on estimating and
in the regression:
.
We generate five variables , 1, 2, 3, 4 and two instruments 5, 6 drawn from a
multivariate normal distribution with mean 0 and variance 1. We generate 5,000 data sets randomly
with 2,000 observations each. We consider two data-generating processes with missing data, missing
at random, MAR, and missing not at random MNAR, as well as the case with a complete data set (i.e., the
benchmark for our evaluation). Intuitively, the first case corresponds to systematically missing data,
while the second corresponds to data that is missing due to unobserved processes.

17
We deliberately choose a rather simple structure and data generating process (DGP) in our
simulation. We use a multivariate normal distribution with two variables with missing observations
that represent missing R&D and missing patents. This allows us to minimize the number of moving
parts and illustrate the results from different methods. We also implemented other simulations
including other DGPs and more realistic (real sample based) sample characteristics and we find that
the ranking of methods does not change across different setups.
We evaluate the performance for various missing data strategies using the coefficient bias for
and . Figure 5 presents the bias for coefficients and for all scenarios. As expected the
coefficient estimates are heavily biased both under MAR and MNAR. This suggests that none of the
techniques, except multiple imputation, completely eliminates the bias associated with missing data.
Multiple imputation provides regression estimates closest to the benchmark case, i.e., the true
parameters, in both scenarios.8
5. Empirical Analysis of Full Deletion Bias
Conceptually, it is straightforward to consider the effects of full deletion on innovation
studies. We empirically evaluate the effects of deleting innovation input and output measures by
comparing two approaches. The deletion of R&D expenditure arises by dropping observations
without R&D expenditure. Implementing the deletion of patent data while still maintaining a viable
counterfactual for empirical evaluation, requires the utilization of patents filed with various patent
offices around the world. Specifically, given that the USPTO makes up 37% of total patent
applications in our sample, we implement patent deletion by dropping observations without USPTO
patent applications. This leaves us with a viable counterfactual of patent applications filed with the
remaining 29 patent offices or 63% of the total number of patent applications.9 Thus, our “full
8 The standard Heckman approach typically focuses on missing observations in a dependent variable rather than considering missing data in the independent variable, which is often the case in studies of innovation. In addition, Heckman models often center on problems with a single proxy for the variable of interest, while studies in innovation often incorporate two measures of innovation (R&D and patents), both with missing observations. At a minimum it can prove challenging to implement a Heckman model for two different proxies of innovation in the same analysis. 9 Note that this is equivalent to studies of international firms using only the USPTO to identify firms with patents.

18
deletion” group comprises only observations that have both positive R&D expenditure and USPTO
patent information. Our counterfactual group comprises observations that have either reported
positive R&D expenditure or patent applications with any of the 30 patent offices. We describe the
latter group as having “partial deletion,” because we utilize all innovation input and output measures
observable to researchers; however, other observations with unreported R&D and patenting are
deleted.10
5.1 Illustration Using Country Innovation Capacity
Our first set of tests examines the effects of using the full deletion approach versus the
partial deletion approach on a country’s innovation capacity. We measure the innovation capacity for
each country as the ratio of firm-year observations where there is innovation to the total number of
observations for a particular country. Under the full deletion approach, we only consider a firm-year
to have engaged in innovation activity if it has both positive R&D expenditure and patent
applications with the USPTO. In contrast, for partial deletion, a firm-year is considered to have
engaged in innovation activity if it either reports positive R&D expenditure or files patents with any
of the 30 patent offices. We then introduce a “discrepancy” measure, which is the difference in the
country innovation capacity between the full and partial deletion measures. We also rank the
countries based on both measures of country innovation capacity and compute the difference in
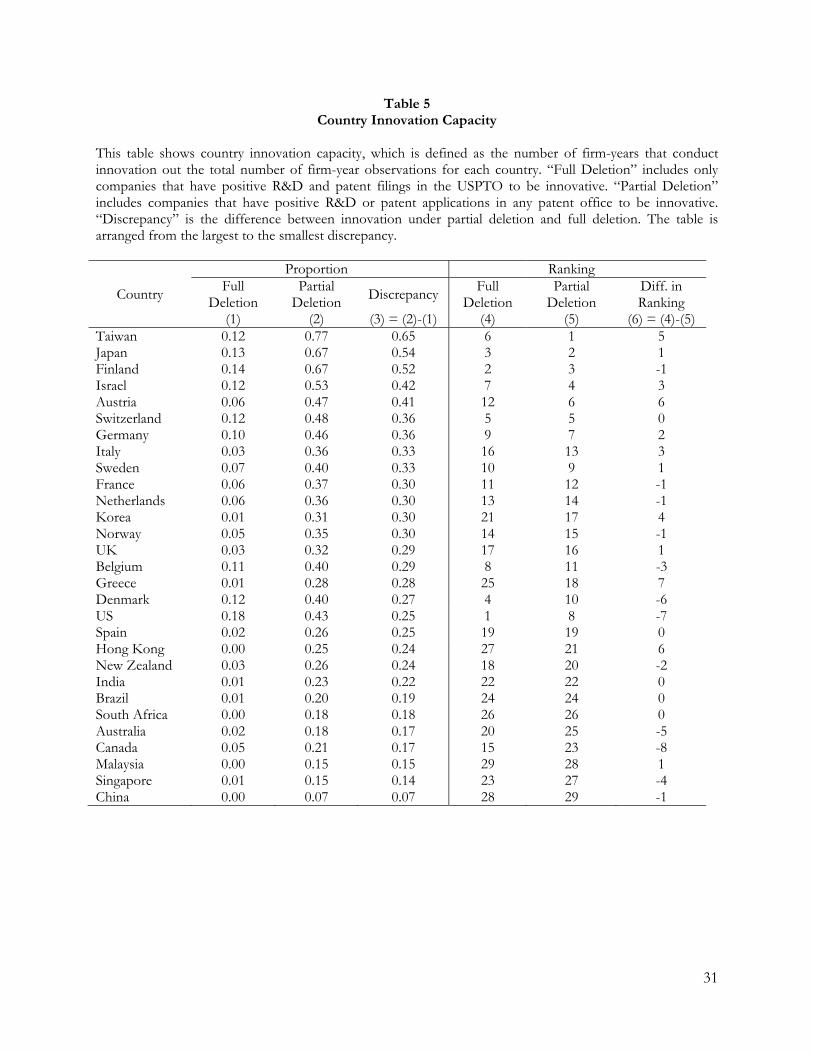
ranking between the two measures. Table 5 reports the findings.
Several key observations can be drawn from the results. First, and not surprisingly, the full
deletion approach consistently underestimates the innovation capacity of all countries in our sample
(Column 3). Second, we observe that the wedge between the two approaches varies significantly
across countries, ranging from a high of 0.65 for Taiwan to a low of 0.07 for China. Third, the
country ranking results suggest that full deletion does not alter country ranking uniformly across all
countries. For example, countries such as Switzerland, Spain, and India are unaffected, while the
10 By definition, the partial deletion approach includes missing R&D firms that have patent activity but no reported R&D expenditure and missing patents firms that have non-USPTO patent applications.

19
country rankings for the US and Canada are severely overstated under the full deletion approach in
comparison with the partial deletion approach—dropping from first place to eighth and from
fifteenth place to twenty-third, respectively. The ranking for Taiwan, on the other hand, is severely
understated under the full deletion approach (sixth) relative to the partial deletion approach (first).
Several implications follow. The above observations imply that the full deletion approach is
likely to induce selection bias to the innovation measures (e.g., R&D efficiency) for both single-
country and cross-country studies on innovation. For single-country studies, the bias is potentially
higher for countries that have a high discrepancy measure, such as Taiwan and Japan, which are
among the five most active innovative countries in terms of total patent applications. One stylized
example of full deletion in single-country studies would be those studies that measure innovation by
using patent data while excluding observations without R&D expenditure. Inappropriate inferences
may be reached for cross-country studies, given that relative country rankings are altered by full
deletion. For example, in unreported results, we also find that the discrepancy measure is
systematically associated with several country-level institutional factors. Thus, innovation
measurements based on full deletion may simply reflect the influence of these institutional factors
rather than a country’s genuine innovation achievement. Examples of stylized full deletion
approaches in cross-country studies include: (1) measuring innovation using patent data from all
patent offices around the world while excluding observations without R&D expenditure and (2)
measuring innovation using patent data from a single patent office (e.g., the USPTO) while
excluding observations without R&D expenditure.
5.2. Illustration Using Firm Growth
In the following set of tests, we compare different methods of dealing with missing data.
Our empirical evaluation utilizes two methods: (1) a univariate comparison of the variables of
interest under the full sample (i.e., no deletion based on either reported R&D or patent application),
the partially deleted sample with positive R&D, or patent applications, and full deletion; and (2)
regressions of sales growth on innovation under different approaches of dealing with missing data
20
comprises full deletion, partial deletion, and multiple imputation (note that univariate tests do not
rely on any imputation). The univariate analysis provides insights into whether deletions lead to
different sample firm characteristics, thus addressing whether any bias is introduced by deleting the
data, while the regressions allow us to examine any differential effects of innovation measures
derived from different approaches to handling missing data.
Table 6 reports the univariate characteristics of the full and partial deletion subsets, and a
univariate comparison of missing and non-missing R&D and patents. Panel A shows that deleting
missing innovation data substantially reduces the number of observations and paints a very different
picture in comparison to the full sample. The partial deletion sample has 122,546 observations; the
total assets are larger than those in the full sample, while the rest of the variables are smaller
(Column 4). The full deletion sample only consists of 26,273 observations. Total assets, Tobin’s Q,
and sales growth are larger than those in the full sample, while the rest of the variables are smaller
(Column 5). It is worth pointing out that ROA decreases by 400% from the full sample to the full
deletion sample. Comparing the full deletion sample to the partial deletion sample, we observe that
the partial deletion sample is closer to the full sample by 8%–300% depending on the variable
considered.
Panels B and C of Table 6 show the difference in characteristics between observations with
and without R&D and patents. Missing R&D observations have lower Tobin’s Q and sales growth,
as well as higher total assets, PPE, ROA, patent applications, and patents granted than non-missing
R&D observations. Notably, this evidence suggests that deleting missing R&D firms excludes firms
that are genuinely and actively engaging in innovation activity. Missing patent observations have
lower PPE, leverage, capital expenditure, and sales growth than non-missing patent observations.
Total assets are higher for missing patent observations than for non-missing patent observations.
Taken together, these results show that R&D and patenting are at least not missing completely at random
and depend on observables.
Next, we compare regression results for different approaches to missing data. Table 7
reports the regression results for innovation on future sales growth (three years ahead). We present

21
the results for full and partial deletion, single imputation (with zero or the industry mean), Heckman
and multiple imputation approaches. Full deletion (Column 1) includes only observations that have
both R&D and USPTO patent applications, Partial deletion (Column 2) includes only observations
that have either R&D or patent applications, Zero (Column 3) replaces non-reporting observations
with zero, Mean (Column 4) replaces non-reporting observations with the industry mean, Heckman
use lagged variables as instruments for non-reporting observations (Column 5), and Multiple
Imputation (Column 6) imputes the non-reporting observations using multiple imputations where
we create 100 imputed data sets using an imputation model that comprises ROA, total assets, PPE,
and leverage. Panel A presents the results using only firm characteristics as control variables together
with year, industry and country fixed effects, while Panel B additionally controls for country
characteristics in the regression. We use three-year ahead sales growth to account for the varying
time lag between R&D activities and future sales growth. Table IA3 in Internet Appendix presents
the results for two industries: Industrial and Commercial Machinery (SIC 35) and Chemical and
Allied Products (SIC 28).11
Focusing on the results in Panel A, the estimated coefficients for R&D are positive and
significant for all the approaches except for the multiple imputation approach in the three-year
future sales growth regression (Columns 1 to 5; p-values < 0.01). On the other hand, patent
applications have positively significant effects under the partial deletion, zero and mean replacement
approaches in the three-year future sales growth regression (Columns 2 to 4; p-values < 0.01). Both
R&D and patent applications have an insignificant effect on sales growth under the multiple
imputation approach (Column 6). It is noteworthy that the estimated coefficients for R&D for the
full deletion and Heckman samples are several times greater than those for the partial deletion, zero
and mean replacement samples, suggesting that these two methods are likely to severely
overestimate the economic effects of R&D on three-year ahead sales growth. We also observe that
the coefficients of the other variables in the regression vary in magnitude and sign depending on the
11 We estimate the same regressions with firm fixed effects and separately for the US and China and find qualitatively similar results. Neither of the tables provides evidence using inverse probability weighting, as the results do not converge in these specifications.
22
sample used. For instance, the coefficient estimate of capital expenditure changes from negatively
insignificant to positively significant across the specifications (Columns 1, 5 and 6 vs. Columns 2, 3,
and 4). The coefficient of profitability in the full deletion sample is roughly 35% larger than that of
the Heckman sample.12 Panel B reports the results after controlling for country specific institutional
characteristics. Controlling for these characteristics does not alter our findings on the effects of
R&D and patent applications on 3-year ahead sales growth. In untabulated results we repeat the
analysis using R&D efficiency measures with similar inferences.
Overall, the findings in this section demonstrate that different treatments of missing
innovation data can lead to vastly different sample firm characteristics and varying regression results
with potentially very large differences in the estimated economic effects of corporate innovation.
This suggests that multiple approaches should be adopted to avoid potentially misleading inferences
being made.
6. General Guidelines for Dealing with Missing Innovation Data
In this section, we provide some general guidelines and recommendations for economics
and finance scholars confronted with missing innovation data.
1. In studies of innovation, missing R&D and patents can arise from: i) random collection
error from data providers, ii) managers not reporting R&D expenses due to zero (near
zero) innovation, iii) strategic disclosure choices in reporting R&D expenses and
patenting, iv) unsuccessful R&D, or v) firms filing for patents in alternative patent
offices. Consequently, researchers should report both full and partial sample
characteristics of the variables of interest.
12 In untabulated results, we repeat these tests using five-year sales growth, market-share and Tobin’s Q as the dependent variables. On the five-year ahead sales growth, we find a positively significant R&D effects on future sales growth only among the full deletion, Heckman and multiple imputation samples (p-values < 0.05). In the market-share regressions, we observe the same effects; the full deletion sample leads to substantially higher coefficient estimates of R&D and patenting than in other specifications. In the Tobin’s Q regressions, we find that the full deletion results are substantially lower than in the other estimates. Taken together, these empirical findings suggest that the direction of the bias depends on the nature of the investigation.
23
2. Researchers with missing innovation data should test if the missing data is randomly
distributed. Little (1988) provides a test to determine if the data is missing completely at
random. For Stata users the mcartest command implements this test.
3. If the missing data is randomly distributed (maybe because the missing data stems from
random collection errors by the data provider), then researchers could potentially delete
or exclude the observations with missing data.
4. If the missing data is not randomly distributed, then researchers should attempt to
predict missing innovation data using economically motivated observable variables. The
predictive variables should be included as covariates in the regression and selection
model. The researcher should use both inverse probability weighting and multiple
imputation (for Stata users the MI command) to handle the missing observations.
5. If the missing data is not randomly distributed and there are both observable and
unobservable characteristics that lead to missing innovation data, then the researcher
should use a Heckman-Type selection model with the observable characteristics included
in the predictive model. MAR approaches like IPW and multiple imputation rely on the
“Selection on observables” assumption. Such an approach can be a reasonable method
because Schafer and Graham (2002) show that multiple imputation can often be
unbiased for MNAR + MAR data even though the researcher assumes the data to be
MAR. Thus, researcher should use both Heckman and multiple imputation.
6. Ad-hoc methods to dealing with missing innovation data, which are quite common in
research, give unpredictable and biased results. In particular, a) imputing based on trend
data, or b) replacing the missing observations with zero or the industry average lead to
incorrect inferences.
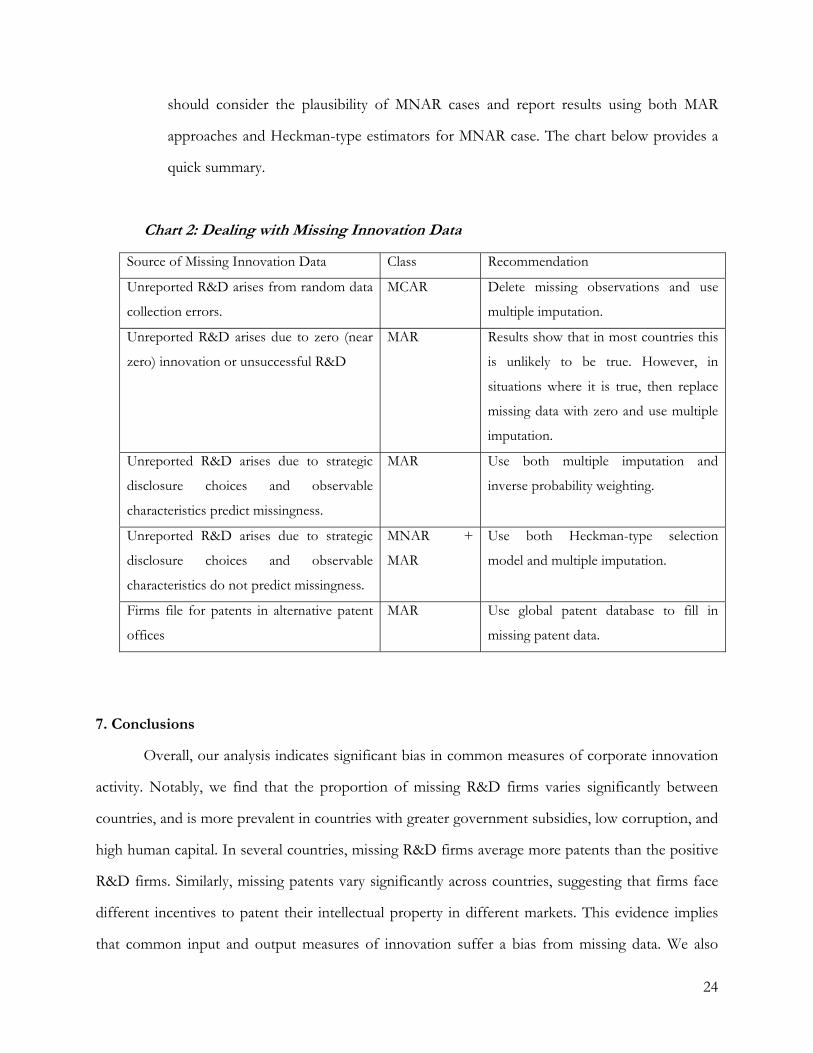
7. In summary, the proportion and distribution of missing innovation data in the sample
should be reported. Researchers should conduct an analysis on the randomness and
predictability of the missing innovation data in their sample. If predictable, these
predictive variables should be included in the selection or imputation model. Researchers
24
should consider the plausibility of MNAR cases and report results using both MAR
approaches and Heckman-type estimators for MNAR case. The chart below provides a
quick summary.
Chart 2: Dealing with Missing Innovation Data
Source of Missing Innovation Data Class Recommendation
Unreported R&D arises from random data
collection errors.
MCAR Delete missing observations and use
multiple imputation.
Unreported R&D arises due to zero (near
zero) innovation or unsuccessful R&D
MAR Results show that in most countries this
is unlikely to be true. However, in
situations where it is true, then replace
missing data with zero and use multiple
imputation.
Unreported R&D arises due to strategic
disclosure choices and observable
characteristics predict missingness.
MAR Use both multiple imputation and
inverse probability weighting.
Unreported R&D arises due to strategic
disclosure choices and observable
characteristics do not predict missingness.
MNAR +
MAR
Use both Heckman-type selection
model and multiple imputation.
Firms file for patents in alternative patent
offices
MAR Use global patent database to fill in
missing patent data.
7. Conclusions
Overall, our analysis indicates significant bias in common measures of corporate innovation
activity. Notably, we find that the proportion of missing R&D firms varies significantly between
countries, and is more prevalent in countries with greater government subsidies, low corruption, and
high human capital. In several countries, missing R&D firms average more patents than the positive
R&D firms. Similarly, missing patents vary significantly across countries, suggesting that firms face
different incentives to patent their intellectual property in different markets. This evidence implies
that common input and output measures of innovation suffer a bias from missing data. We also

25
document how relying on the USPTO data to capture innovation activity, even amongst just US
firms, introduces additional bias into patent-based measurements of innovation. Relying strictly on
USPTO data creates a bias by misclassifying firms that patent abroad but do not seek US patents.
Thus, these results imply that R&D and patents are not missing completely at random.
One common approach for dealing with firms without any reported R&D or patents is to
exclude or delete them from the study. Our analysis shows that this approach often magnifies the
bias from missing observations rather than solving it. Moreover, our analysis speaks to the common
approach of measuring innovation activity using R&D efficiency (patents/R&D). Predicated on our
findings that innovation disclosure bias occurs across firms, time, and countries, using R&D efficiency
heightens the disclosure bias. Naively excluding firms without positive patent activity or reported
R&D provides biased results.

26
References
Admati, A. R. and P. Pfleiderer, 2000. Forcing firms to talk: Financial disclosure regulation and externalities, Review of Financial Studies 13(3), 479–519.
Bernstein, S., 2015. Does going public affect innovation?, Journal of Finance 70(4), 1365-1403.
Bloom, N. and J. Van Reenen, 2002. Patents, real options and firm performance. The Economic Journal 112, C97-C116.
Dye, R., 1986. Proprietary and nonproprietary disclosures, Journal of Business 59, 331–366.
Hall, B., C. Helmers, M. Rogers, and V. Sena, 2014. The choice between formal and informal intellectual property: A review, Journal of Economic Literature 52(2), 375–423.
Hsu, P., X. Tian, and Y. Xu, 2014. Financial development and innovation: Cross-country evidence, Journal of Financial Economics 112(1), 116-135.
Kogan, L., D. Papanikolaou, A. Seru, N. Stoffman, 2012. Technological innovation, resource allocation, and growth, Quarterly Journal of Economics, forthcoming.
Koh, P.-S. and D. Reeb, 2015. Missing R&D, Journal of Accounting and Economics 60(1), 73-94.
Koh, P.-S., D. Reeb, and J. Wald, 2015. Innovation opacity: The strategic choice to not report R&D spending, Working Paper, HKUST.
Lacko, P. and J. Pappalardo, 2010. The failure and promise of mandated consumer mortgage disclosures: Evidence from qualitative interviews and a controlled experiment with mortgage borrowers, American Economic Review 100(2), 516–521.
Little, R., A test of missing completely at random for multivariate data with missing values. Journal of the American Statistical Associatie 83 (404): 1198-1202.
Lychagin, S., J. Pinkse, M. E. Slade, and J. van Reenen, 2010. Spillovers in space: Does geography matter? CEP Discussion Paper No. 991.
Png, I., 2016. Law and innovation: Evidence from state trade secrets laws, Review of Economics and Statistics, forthcoming.
Rogerson, W., 2008. Intertemporal cost allocation and investment decisions, Journal of Political Economy 116(5), 931–950.
Rubin, D. 1976. Inference and missing data, Biometrika 63(3), 581–592.
Rubin, D. 1987. Multiple imputation for nonresponse in surveys. New York, NY: John Wiley.
Schafer, J. 1997. Analysis of incomplete multivariate data. New York, NY: Chapman and Hall.
Schafer, J. and J. Graham, 2002. Missing data: Our view of the state of the art. Psychological Methods, 7: 147-177.
Simon, C., 1989. The effect of the 1933 Securities Act on investor information and the performance of new issues, American Economic Review 79(3), 295–318.
Tanner, M. A. and W. H. Wong, 1987. The calculation of posterior distributions by data augmentation, Journal of the American Statistical Association 82(398), 528–550.

27
Table 1 Variable Definitions and Descriptive Statistics
This table shows the variable definitions and the descriptive statistics. Panel A shows the variable definitions. Pane B presents the sample characteristics. The sample period is 1999–2012.
Panel A. Variable Definitions Variable Names Variable Definitions Code R&D Expenditure R&D expenditure divided by total assets XRD/AT Report R&D Indicator variable: 1 if a firm reported zero
or positive R&D expenditure; 0 otherwise
PPE Net property, plant, and equipment divided by total assets
PPENT/AT
Tobin’s Q Tobin’s Q, measured as market value of equity divided by total assets
MKTVAL/AT
Leverage Total liabilities divided by total assets LT/AT Log(Total Assets) Log of total assets Log(AT) Capital Expenditure Capital expenditure divided by total assets CAPX/AT ROA EBIT divided by total assets EBIT/AT Sales Growth Annual sales growth (Salet-Salet-1)/ Salet-1
HH Index Herfindal industry concentration index No. of Patent Applications Total number of patent applications No. of Patents Granted Total number of patents granted Citations Total number of citations per patent
Panel B. Overall Sample Variables N Mean Median Std. Dev. 25th 75th (1) (2) (3) (4) (5) (6) R&D Expenditure 118,264 0.08 0.02 0.60 0.00 0.06 Report R&D 333,920 0.35 0.00 0.48 0.00 1.00 Log(Total Assets) 330,790 6.74 6.64 2.96 4.75 8.61 PPE 328,021 0.28 0.23 0.23 0.01 0.43 Tobin’s Q 225,349 1.67 0.64 19.97 0.31 1.30 Leverage 330,580 0.95 0.52 63.21 0.32 0.69 Capital Expenditure 311,017 0.06 0.03 0.78 0.01 0.07 ROA 328,801 0.01 0.05 0.22 0.01 0.10 Sales Growth 302,442 0.26 0.07 1.05 -0.04 0.25 No. of Patent Applications 333,920 9.36 0.00 140.78 0.00 0.00 No. of Patents Granted 333,920 4.50 0.00 69.54 0.00 0.00 Citations 333,920 23.43 0.00 442.67 0.00 0.00

28
Table 2: Country Characteristics This table shows the country characteristics for firm innovation. “Firm Years” represents the total number of observations per country in the sample, “Non-Reporting R&D” is the number of observations that fail to report R&D, “Zero R&D’ is the number of observations that report zero R&D spending, “Missing R&D” is the number of observations without reported R&D and positive patent applications, and “Missing Patent” is the number of observations that file for a non-USPTO but no USPTO patent in the same year. Q1 is the proportion of observations that reports R&D and has positive patent activity in the PATSTAT database (in %), Q2 is the proportion of observations that reports R&D and has no patent activity (in %), Q3 is the proportion of observations that does not report R&D but has patenting activity (Missing R&D) (in %), and Q4 is the proportion of observations that does not report R&D and does not have patent activity (in %).
Country Firm Years
Non-Reporting R&D
Zero R&D
MissingR&D
Missing Patent
Report R&D with Patents (Q1)
Report R&D and no Patents (Q2)
Non-report R&D with Patents (Q3)
Non-report R&D and no Patents (Q4)
Australia 19,072 15,856 - 298 277 2.77 14.09 1.56 81.58Austria 1,047 694 - 140 116 9.93 23.78 13.37 52.91Belgium 1,455 965 - 86 89 14.30 19.38 5.91 60.41Brazil 3,970 3,557 - 362 236 1.21 9.19 9.12 80.48Canada 5,840 4,584 260 249 159 6.42 15.09 4.26 74.23China 26,562 24,954 - 284 185 0.15 5.90 1.07 92.88Denmark 1,746 1,191 - 137 89 14.09 17.70 7.85 60.37Finland 1,677 687 - 131 275 26.89 32.14 7.81 33.15France 8,850 6,636 - 1,041 731 9.57 15.45 11.76 63.22Germany 9,338 6,273 - 1,185 964 13.93 18.89 12.69 54.49Greece 2,450 1,792 - 32 25 0.90 25.96 1.31 71.84Hong Kong 11,836 8,935 - 8 6 0.17 24.34 0.07 75.42India 31,428 24,493 - 296 303 1.54 20.52 0.94 76.99Israel 2,937 1,460 - 86 99 14.10 36.19 2.93 46.78Italy 3,198 2,575 - 538 280 5.85 13.63 16.82 63.70Japan 40,608 14,371 - 911 2,358 17.88 46.73 2.24 33.15Korea 8,856 7,191 - 1,098 792 3.73 15.07 12.40 68.80Malaysia 11,438 9,770 - 10 10 0.11 14.47 0.09 85.33Netherlands 1,958 1,355 - 97 63 7.51 23.29 4.95 64.25New Zealand 1,551 1,173 - 28 33 4.13 20.25 1.81 73.82Norway 2,290 1,742 - 243 150 7.42 16.51 10.61 65.46Singapore 7,668 6,636 - 129 70 0.95 12.51 1.68 84.86South Africa 3,478 2,889 - 41 26 0.43 16.50 1.18 81.89Spain 1,640 1,396 - 190 128 3.90 10.98 11.59 73.54Sweden 5,204 3,537 - 399 336 10.55 21.48 7.67 60.30Switzerland 2,803 1,613 - 148 155 15.38 27.08 5.28 52.27Taiwan 15,800 3,966 - 301 1,363 19.42 55.47 1.91 23.20UK 21,197 14,942 - 604 716 5.41 24.10 2.85 67.64US 78,023 40,423 8,352 3,741 1,060 19.02 29.17 4.79 47.01Total 333,920 215,656 8,612 12,813 11,094 10.02 25.40 3.84 60.75

29
Table 3 Differences in Patent Applications across Patent Offices
This table shows the total number of USPTO and non-USPTO patent applications across countries during the sample period. USPTO represents the number of patent applications with USPTO, non-USPTO represents the number of patent applications in any other patent office, Ratio is the ratio of non-USPTO to USPTO patents (3)=(2)/(1). Columns (4) and (5) show the average number of patent applications and patents granted per firm in each country.
Average No. of Patent Country USPTO Non-USPTO Ratio Applications Granted (1) (2) (3)=(2)/(1) (4) (5) Australia 1,402 3,768 2.69 0.27 0.09Austria 359 2,873 8.00 3.09 1.61Belgium 1,982 9,573 4.83 7.94 4.34Brazil 292 2,410 8.25 0.68 0.10Canada 2,015 4,630 2.30 1.14 0.36China 2,051 22,908 11.17 0.94 0.17Denmark 4,634 19,890 4.29 14.05 6.08Finland 11,940 42,446 3.55 32.43 12.76France 19,870 107,173 5.39 14.36 8.01Germany 47,266 267,491 5.66 33.71 14.13Greece 23 80 3.48 0.04 0.02Hong Kong 47 62 1.32 0.01 0.00India 2,208 9,960 4.51 0.39 0.07Israel 2,167 2,601 1.20 1.62 0.52Italy 1,256 6,720 5.35 2.49 1.33Japan 328,509 527,311 1.61 21.08 11.14Korea 26,051 214,569 8.24 27.17 6.50Malaysia 12 51 4.25 0.01 0.00Netherlands 2,942 24,393 8.29 13.96 7.14New Zealand 326 967 2.97 0.83 0.43Norway 707 5,020 7.10 2.50 1.44Singapore 1,794 1,590 0.89 0.44 0.19South Africa 16 134 8.38 0.04 0.02Spain 190 2,488 13.09 1.63 0.49Sweden 4,328 18,142 4.19 4.32 2.85Switzerland 6,406 62,237 9.72 24.49 10.49Taiwan 55,424 92,401 1.67 9.36 5.48UK 8,603 34,577 4.02 2.04 0.91US 611,790 494,423 0.81 14.18 7.23Total 1,144,610 1,980,888 1.73

30
Table 4 Multivariate Correlations – Institutional Factors
This table shows the multivariate panel regressions of missingness at the country and firm level. Panel A shows the regression of the ratio of missing R&D firms to positive R&D firms and institutional factors as well as the ratio to positive R&D firms without patents and institutional factors. Standard errors are double clustered by year and country. Cross-listed firms are excluded from the sample. Panel B shows the coefficient, marginal effects, and p-value of the probit regression of missing R&D and missing patents on firm characteristics. Firms with positive patent activity that do not report R&D are classified as “Missing R&D”, firms with non-USPTO but no USPTO patents are classified as “Missing Patents”. The sample period is 1999–2012. Panel A. Country Regressions Dependent Variables: Missing R&D /
Positive R&D Missing Patent /
Positive R&D Variables Coeff. p-val. Coeff. p-val. (1) (2) (3) (4) Intercept 0.4823 0.01 1.8134 0.05 Economic openness -0.0006 0.14 -0.0023 0.15 Manufacturing intensity 0.0125 0.00 0.0705 0.07 Government subsidies 0.0306 0.04 -0.3289 0.16 Labor regulations -0.0518 0.00 -0.2403 0.14 Intellectual property rights -0.0241 0.45 -0.5157 0.26 University ties -0.1423 0.00 0.1059 0.69 Skilled labor 0.0596 0.00 0.0803 0.41 Honesty 0.0629 0.00 0.0991 0.35 Regulatory efficacy -0.0128 0.55 0.1816 0.14 Commonwealth -0.1916 0.00 -0.6668 0.00 Mean Dep. Var. 0.26 0.51 R2 0.37 0.06 Obs. (Country-year) 334 360 Panel B. Individual Firm Regressions Dependent Variables: Missing R&D Missing Patents
Coeff. Marginal Effects
p-val. Coeff. Marginal Effects
p-val.
(1) (2) (3) (4) (5) (6) Log(Total Assets) 0.098 0.0073 0.00 0.199 0.0036 0.00 PPE 0.112 0.0084 0.00 0.345 0.0097 0.06 Leverage 0.000 0.0000 0.75 0.000 -0.0009 0.21 Capital Expenditure -0.010 -0.0008 0.80 -0.011 0.0025 0.68 ROA -0.031 -0.0023 0.31 0.012 -0.0141 0.00 Sales Growth -0.013 -0.0009 0.01 -0.027 -0.0016 0.03 Year/Industry/Country FE YES YES R2 0.13 0.08 Obs. 282,798 105,880
31
Table 5 Country Innovation Capacity
This table shows country innovation capacity, which is defined as the number of firm-years that conduct innovation out the total number of firm-year observations for each country. “Full Deletion” includes only companies that have positive R&D and patent filings in the USPTO to be innovative. “Partial Deletion” includes companies that have positive R&D or patent applications in any patent office to be innovative. “Discrepancy” is the difference between innovation under partial deletion and full deletion. The table is arranged from the largest to the smallest discrepancy.
Proportion Ranking
Country Full
Deletion Partial
Deletion Discrepancy
Full Deletion
Partial Deletion
Diff. in Ranking
(1) (2) (3) = (2)-(1) (4) (5) (6) = (4)-(5) Taiwan 0.12 0.77 0.65 6 1 5 Japan 0.13 0.67 0.54 3 2 1 Finland 0.14 0.67 0.52 2 3 -1 Israel 0.12 0.53 0.42 7 4 3 Austria 0.06 0.47 0.41 12 6 6 Switzerland 0.12 0.48 0.36 5 5 0 Germany 0.10 0.46 0.36 9 7 2 Italy 0.03 0.36 0.33 16 13 3 Sweden 0.07 0.40 0.33 10 9 1 France 0.06 0.37 0.30 11 12 -1 Netherlands 0.06 0.36 0.30 13 14 -1 Korea 0.01 0.31 0.30 21 17 4 Norway 0.05 0.35 0.30 14 15 -1 UK 0.03 0.32 0.29 17 16 1 Belgium 0.11 0.40 0.29 8 11 -3 Greece 0.01 0.28 0.28 25 18 7 Denmark 0.12 0.40 0.27 4 10 -6 US 0.18 0.43 0.25 1 8 -7 Spain 0.02 0.26 0.25 19 19 0 Hong Kong 0.00 0.25 0.24 27 21 6 New Zealand 0.03 0.26 0.24 18 20 -2 India 0.01 0.23 0.22 22 22 0 Brazil 0.01 0.20 0.19 24 24 0 South Africa 0.00 0.18 0.18 26 26 0 Australia 0.02 0.18 0.17 20 25 -5 Canada 0.05 0.21 0.17 15 23 -8 Malaysia 0.00 0.15 0.15 29 28 1 Singapore 0.01 0.15 0.14 23 27 -4 China 0.00 0.07 0.07 28 29 -1

32
Table 6 Selection Bias
This table shows the selection bias across several variables. Panel A presents the sample characteristics for the full sample and the full and partial deletion sample. “Full Sample” uses all available observation without deletion based on either reported R&D or patent application information. “Partial Deletion” includes only observations that have positive R&D or patent applications in any patent office. “Full Deletion” includes only observations that have positive R&D and patent filings in the USPTO. Firm-years represent the maximum number of observations available for each subsample. Panels B and C show the comparison of the samples with missing and non-missing R&D (patent). Firms with positive patent activity that do not report R&D are classified as “Missing R&D”, firms with non-USPTO by no USPTO patents in a year are classified as “Missing Patent”. Variable definitions are presented in Table 1. *, **, and *** represent significance at the 10%, 5%, and 1% levels, respectively. Panel A. Univariate Comparison of Samples
Full Partial Full Differences Sample
(1) Deletion
(2) Deletion
(3) (4)
=((1)-(2))/(1) (5)
=((1)-(3))/(1) (6)
=((3)-(2))/(1) Log(Total Assets) 6.74 7.34 7.40 -9%*** -10%*** 1%***
PPE 0.28 0.24 0.20 14%*** 29%*** -14%***
Tobin’s Q 1.67 1.56 1.86 7%*** -11%* 18%***
Leverage 0.95 0.56 0.48 41%*** 49%*** -8%***
Capital Expenditure 0.06 0.05 0.05 17%*** 17%*** 0%***
ROA 0.01 0.00 -0.03 100%*** 400%*** -300%***
Sales Growth 0.26 0.23 0.31 12%*** -19%*** 31%***
N (Firm-years) 330,790 122,546 26,273 Panel B. Univariate Comparison of Missing R&D
Missing R&D Non-Missing R&D Diff. (N=12,813) (N=321,107) Variables Mean SD Mean SD (1) (2) (3) (4) (1)-(3) Log(Total Assets) 7.48 3.39 6.71 2.94 0.77*** PPE 0.29 0.22 0.28 0.24 0.01*** Tobin’s Q 1.32 8.94 1.68 20.3 -0.36*** Leverage 0.82 15.32 0.96 64.39 -0.14 Capital Expenditure 0.06 0.06 0.06 0.79 0.00 ROA 0.03 0.2 0.01 0.22 0.02*** Sales Growth 0.22 0.93 0.26 1.06 -0.04*** No. of Patent Applications 23.69 318.18 8.79 128.70 14.90*** No. of Patents Granted 7.45 107.38 4.39 67.59 3.07*** Citations 27.05 297.17 23.28 447.5 3.77
Panel C. Univariate Comparison of Missing Patents
Missing Patents Non-Missing Patents Diff. (N= 11,094) (N= 322,826) Variables Mean SD Mean SD (1) (2) (3) (4) (1)-(3) R&D Expenditure 0.09 0.85 0.08 0.58 0.01 Log(Total Assets) 7.77 3.44 6.71 2.93 1.06*** PPE 0.27 0.19 0.28 0.24 -0.01*** Tobin’s Q 1.87 26.70 1.66 19.65 0.21 Leverage 0.56 2.61 0.97 64.29 -0.41*** Capital Expenditure 0.05 0.06 0.06 0.79 -0.01*** ROA 0.01 0.23 0.01 0.22 0.00 Sales Growth 0.20 0.93 0.26 1.06 -0.06***

33
Table 7 Alternative Treatments of Missing Innovation Measures
This table presents firm growth panel regressions for the period of 1999–2012. The dependent variable is three years’ ahead sales growth. “Full Deletion” includes only observations where R&D is not missing and there are USPTO patents filed. “Partial Deletion” includes observations where either R&D is not missing or there are USPTO patents filed. “Zero” replaces all missing R&D and patents with zero. “Mean” replaces all missing R&D and patents with the country industry mean. “Heckman” uses a two-stage estimation procedure, where the lags of the other variables are used as instruments. “Multiple Imputation” is constructed by imputing all missing values using MCMC 100 times; using log(Total Assets), ROA, PPE, and leverage as conditioning variables; and then averaging across the 100 imputations (Schafer (1997)). Panel A presents the results with only firm characteristics as explanatory variables, Panel B presents the results with firm and country characteristics as explanatory variables. *, **, and *** represent significance at the 10%, 5%, and 1% levels, respectively. The regressions include year, industry, and country fixed effects. Column 6 differs in observations from columns 3 and 4 due to the imputation 83 independent variable observations.
Panel A. Firm Characteristics DV = Sales Growth (t+3)
Full Deletion
Partial Deletion
Zero Mean Heckman Multiple
Imputation (1) (2) (3) (4) (5) (6) Firm controls: Log(Total Assets) -1.28*** -2.32*** -3.34*** -3.34*** -1.43*** -2.82*** ROA -40.91*** -38.53*** -36.40*** -36.38*** -30.35*** -36.57*** Capital Expenditure -0.60 3.66** 1.21* 1.21* -0.57 -1.29 Leverage -3.80*** -0.20 -0.01 -0.01 -5.17*** 0.01 HH Index -3.82 -1.16 0.73 0.72 -7.39** 0.78 R&D Dummy 0.18 1.14*** 0.97*** 0.43 Patent Dummy -2.13*** -3.26*** -3.31*** -2.59*** R&D 13.39*** 4.14*** 3.68*** 3.86*** 18.44*** 1.40 Patent App. 0.00 0.00*** 0.00*** 0.00*** 0.00 0.00 Year FE YES YES YES YES YES YES Industry FE YES YES YES YES YES YES Country FE YES YES YES YES YES YES R2 0.08 0.05 0.05 0.05 0.07 Obs. 21,338 96,973 248,984 248,984 19,432 249,067

34
Table 7 (cont’d) Panel B. Firm and Country Characteristics DV = Sales Growth (t+3)
Full Deletion
Partial Deletion
Zero Mean Heckman Multiple
Imputation (1) (2) (3) (4) (5) (6)Firm controls: Log(Total Assets) -1.26*** -2.29*** -3.23*** -3.22*** -1.36*** -2.29*** ROA -43.30*** -40.22*** -36.31*** -36.28*** -33.12*** -40.22*** Capital Expenditure -0.84 2.09 0.86 0.86 -0.64 2.09 Leverage -3.97*** -0.13 -0.01 -0.01 -5.37*** -0.13 HH Index -3.63 -1.55 -0.10 -0.10 -6.47* -1.55 Country controls: Economic openness -0.21 0.03 0.09*** 0.09*** -0.39 0.03 Manufacturing intensity 0.42 -0.16 -0.46*** -0.46*** 0.84 -0.16 Government subsidies -2.62 -0.22 -0.43 -0.44 -2.29 -0.22 Labor regulations -2.44** -2.21*** -2.29*** -2.29*** -2.50** -2.21*** Intellectual property rights 5.25** 0.19 0.76 0.76 4.55* 0.19 University ties -3.32 0.51 2.18*** 2.18*** -2.84 0.51*** Skilled labor -0.02 0.13 -2.09*** -2.08*** 0.23 0.13*** Honesty 2.80** 3.50*** 2.53*** 2.53*** 2.29* 3.50*** Regulatory efficacy 1.62 -1.17* -0.50 -0.51 1.99 -1.17 R&D Dummy -0.29 1.13*** 0.97** -0.29 Patent Dummy -2.17*** -3.32*** -3.37*** -2.17*** R&D 13.92*** 3.54*** 3.32*** 3.47*** 18.97*** 3.54 Patent App. 0.00 0.00** 0.00*** 0.00*** 0.00 0.00 Year FE YES YES YES YES YES YES Industry FE YES YES YES YES YES YES Country FE YES YES YES YES YES YES R2 0.08 0.06 0.05 0.05 0.10 Obs. 19,472 89,140 208,419 208,419 18,485 215,172

35
Figure 1: Firms by Country This figure shows the number of firms in each country, the number of firms with non-reporting R&D, and the number of firms with missing patents. Unique Firms is the total number of firms per country in the sample, Non-Reporting R&D is the number of firms that have at least one missing R&D, Missing Patent (right axis) is the number of firms that never file for patents with USPTO.
Figure 2: Missing R&D This figure shows the proportion of (1) missing R&D to positive R&D with patent firms (left axis) and (2) missing to positive R&D firms (right axis) by country. Positive R&D with Patent is the number of firms that reports at least one positive R&D and has a patent application in that year. Firms with positive patent activity that do not report R&D are classified as “Missing R&D” firms.
0
50
100
150
200
250
300
350
400
0
1,500
3,000
4,500
6,000
7,500
9,000
10,500
Australia
Austria
Belgium
Brazil
Canada
China
Denmark
Finland
France
Germany
Greece
HongKong
India
Israel
Italy
Japan
Korea
Malaysia
Netherlands
New
Zealand
Norway
Singapore
SouthAfrica
Spain
Sweden
Switzerland
Taiwan UK US
Missin
gPaten
ts
UniqueFirms Non‐ReportingR&D MissingPatents
0
0.1
0.2
0.3
0.4
0.5
0.6
0.7
0.8
0.9
0
1
2
3
4
5
6
7
8
Italy
Brazil
Spain
Austria
France
Germany
Norw
ay
Finland
Swed
en
Den
mark
Canada
China
Belgium
Korea
Netherlands
Switzerland
UK
US
Australia
New
Zealand
Singapore
Israel
Japan
South Africa
India
Greece
Taiwan
Malaysia
Hong Kong
Missing R&D/R&D>0
Missing R&D/(R&D>0
and Patent)
Missing R&D/R&D>0 Missing R&D/(R&D>0 and Patent)
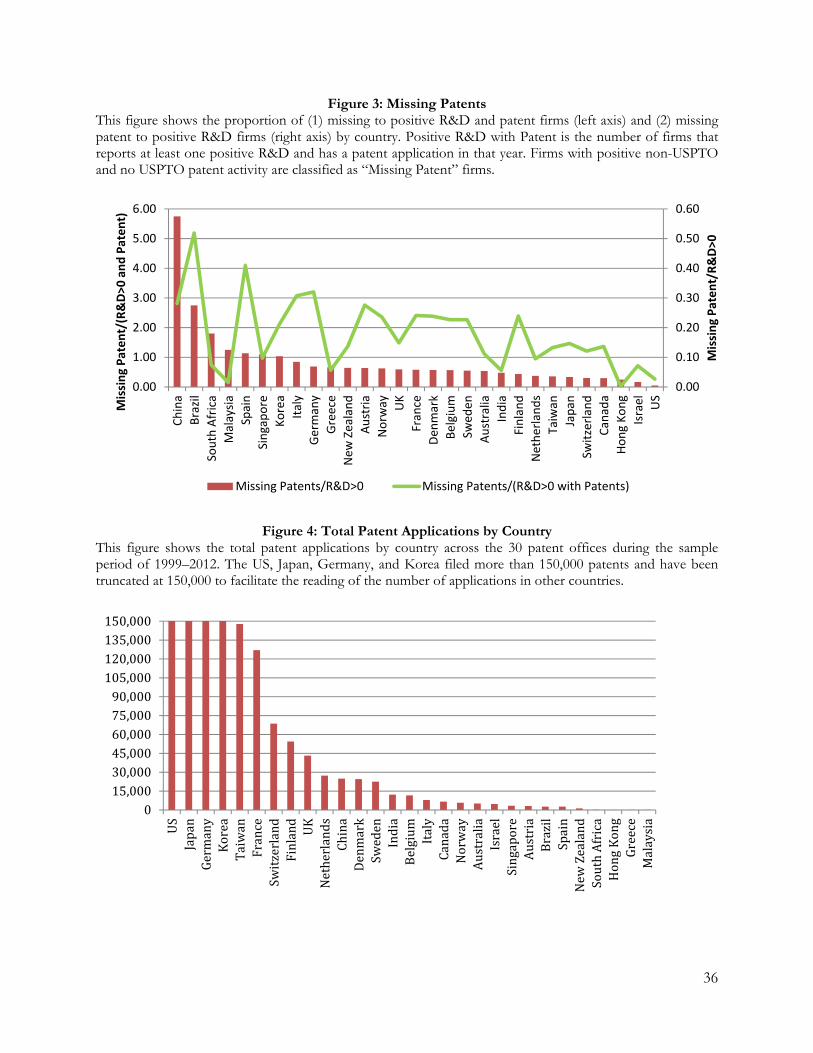
36
Figure 3: Missing Patents This figure shows the proportion of (1) missing to positive R&D and patent firms (left axis) and (2) missing patent to positive R&D firms (right axis) by country. Positive R&D with Patent is the number of firms that reports at least one positive R&D and has a patent application in that year. Firms with positive non-USPTO and no USPTO patent activity are classified as “Missing Patent” firms.
Figure 4: Total Patent Applications by Country This figure shows the total patent applications by country across the 30 patent offices during the sample period of 1999–2012. The US, Japan, Germany, and Korea filed more than 150,000 patents and have been truncated at 150,000 to facilitate the reading of the number of applications in other countries.
0.00
0.10
0.20
0.30
0.40
0.50
0.60
0.00
1.00
2.00
3.00
4.00
5.00
6.00
China
Brazil
South Africa
Malaysia
Spain
Singapore
Korea
Italy
Germany
Greece
New
Zealand
Austria
Norw
ay UK
France
Den
mark
Belgium
Swed
en
Australia
India
Finland
Netherlands
Taiwan
Japan
Switzerland
Canada
Hong Kong
Israel US
Missing Patent/R&D>0
Missing Patent/(R&D>0
and Patent)
Missing Patents/R&D>0 Missing Patents/(R&D>0 with Patents)
015,00030,00045,00060,00075,00090,000105,000120,000135,000150,000
US
Japan
Germany
Korea
Taiwan
France
Switzerland
Finland
UK
Netherlands
China
Denmark
Sweden
India
Belgium Italy
Canada
Norway
Australia
Israel
Singapore
Austria
Brazil
Spain
New
Zealand
SouthAfrica
HongKong
Greece
Malaysia

37
Figure 5 Monte Carlo Simulation Bias
This figure shows the bias of the coefficients for X1 and X2 under different approaches to dealing with missing data, as a percentage of the true sample parameters. LISTWISE deletes all rows with missing observations, ZERO replaces missing observations with zero, MEAN replaces missing observations with the sample mean, IMPUTE replaces missing observations with MCMC-imputed observations based on 100 imputations and Heckman estimates the coefficients using two instruments. Panel A presents the results for observations Missing at Random (MAR) and Panel B for observations Missing not at Random (MNAR). This simulation is described in Appendix 2.
Panel A. MAR
Panel B. MNAR
‐100.00%
‐80.00%
‐60.00%
‐40.00%
‐20.00%
0.00%
LISTWISE ZERO MEAN IMPUTE
β1 β2
‐120.00%
‐100.00%
‐80.00%
‐60.00%
‐40.00%
‐20.00%
0.00%
LISTWISE ZERO MEAN IMPUTE Heckman
β1 β2

38
Appendix 1. Missing Innovation and Deletion
To evaluate the issue of data deletion with missing R&D or incomplete patent applications, we consider a simple linear regression model with one explanatory variable. Let the relation of the observed response yi, for example firm value, of individual firm i, and the explanatory variable xi, R&D expenditure or patent application, be described by:
yi = α + βxi + εi . (1) However, instead of using all the available observations, N, in a sample, a researcher only uses a subsample of observations, deleting observations or firms without R&D expenditure data or patent applications.13 Let si be a selection indicator where si = 1 when R&D (patenting) is not missing and firm i is included in the regression. If R&D (patenting) is missing, i.e., si = 0, then firm i is dropped from the data. The simple deletion problem (listwise deletion) that we analyze captures missing inputs (R&D) or incomplete outputs (patents) of corporate innovation activity. A scholar studying innovation could perform a regression using the subsample of the data observations with reported R&D expenditures or patent application data (si = 1), which we represent as follows:
si yi = αsi + βsi xi + si εi. (2) sixi is the explanatory variable and ui = si εi is now the error term. The OLS (ordinary least squares) estimator is unbiased if E(si xi,si εi | xi,si) = E(si xi εi |xi,si) = 0.
1 Effects of Single Dimension Deletion 1.1. Case 1: Sample selection is random
For the OLS estimator to be unbiased, where E(ui|xi,si)= 0, the sample selection has to be random. In other words, missing R&D or incomplete patents randomly occur across countries and firms. This is analogous to data missing completely at random where:
E(εi|xi,si) = E(εi|xi) = 0, (3) if the Gauss-Markov assumptions hold.
1.2. Case 2: Sample selection is correlated with ui
Given that the reporting of R&D depends on the manager of firm i and not the econometrician, the sample selection indicator si will be correlated with ui. For example, if firms choose to not provide information on R&D expenditures or seek patents for their innovations (i.e., maintain them as trade secrets), missing observations related to knowledge capital or si will be correlated with ui. This is widely known as incidental deletion or sample selection bias. Our empirical results in Tables 1–6 suggest that the magnitude of this bias varies across countries and firms, and such variation is inconsistent with data missing completely at random. Therefore, studies that use either R&D expenditures or patent data and truncate them due to missing or incomplete data introduce selection bias into the analysis.
13 We consider the univariate setup for simplicity. There might be other covariates of interest that drive the outcome variable, but including them in the regression does not change the problem of deletion.
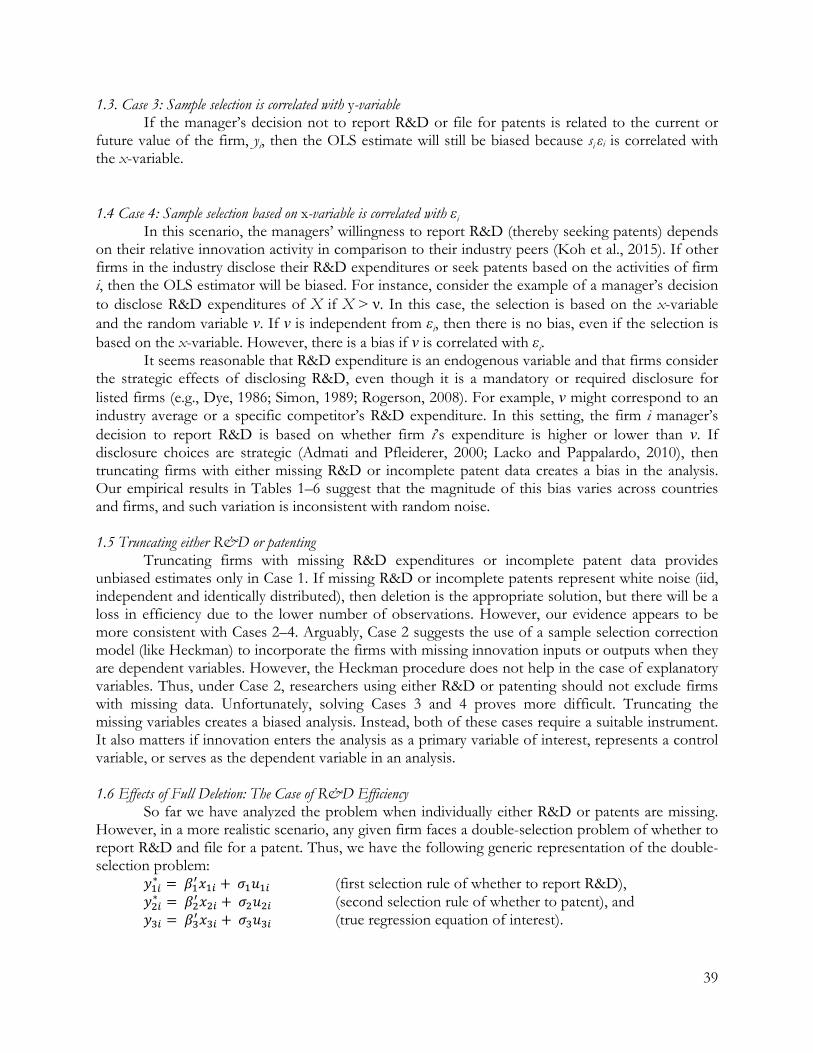
39
1.3. Case 3: Sample selection is correlated with y-variable If the manager’s decision not to report R&D or file for patents is related to the current or
future value of the firm, yi, then the OLS estimate will still be biased because si εi is correlated with the x-variable.
1.4 Case 4: Sample selection based on x-variable is correlated with εi In this scenario, the managers’ willingness to report R&D (thereby seeking patents) depends
on their relative innovation activity in comparison to their industry peers (Koh et al., 2015). If other firms in the industry disclose their R&D expenditures or seek patents based on the activities of firm i, then the OLS estimator will be biased. For instance, consider the example of a manager’s decision to disclose R&D expenditures of X if X > ν. In this case, the selection is based on the x-variable and the random variable ν. If ν is independent from εi, then there is no bias, even if the selection is based on the x-variable. However, there is a bias if ν is correlated with εi.
It seems reasonable that R&D expenditure is an endogenous variable and that firms consider the strategic effects of disclosing R&D, even though it is a mandatory or required disclosure for listed firms (e.g., Dye, 1986; Simon, 1989; Rogerson, 2008). For example, ν might correspond to an industry average or a specific competitor’s R&D expenditure. In this setting, the firm i manager’s decision to report R&D is based on whether firm i’s expenditure is higher or lower than ν. If disclosure choices are strategic (Admati and Pfleiderer, 2000; Lacko and Pappalardo, 2010), then truncating firms with either missing R&D or incomplete patent data creates a bias in the analysis. Our empirical results in Tables 1–6 suggest that the magnitude of this bias varies across countries and firms, and such variation is inconsistent with random noise. 1.5 Truncating either R&D or patenting
Truncating firms with missing R&D expenditures or incomplete patent data provides unbiased estimates only in Case 1. If missing R&D or incomplete patents represent white noise (iid, independent and identically distributed), then deletion is the appropriate solution, but there will be a loss in efficiency due to the lower number of observations. However, our evidence appears to be more consistent with Cases 2–4. Arguably, Case 2 suggests the use of a sample selection correction model (like Heckman) to incorporate the firms with missing innovation inputs or outputs when they are dependent variables. However, the Heckman procedure does not help in the case of explanatory variables. Thus, under Case 2, researchers using either R&D or patenting should not exclude firms with missing data. Unfortunately, solving Cases 3 and 4 proves more difficult. Truncating the missing variables creates a biased analysis. Instead, both of these cases require a suitable instrument. It also matters if innovation enters the analysis as a primary variable of interest, represents a control variable, or serves as the dependent variable in an analysis.
1.6 Effects of Full Deletion: The Case of R&D Efficiency
So far we have analyzed the problem when individually either R&D or patents are missing. However, in a more realistic scenario, any given firm faces a double-selection problem of whether to report R&D and file for a patent. Thus, we have the following generic representation of the double-selection problem:
∗ (first selection rule of whether to report R&D), ∗ (second selection rule of whether to patent), and
(true regression equation of interest).

40
For k = 1, 2, 3 and individual firm i, Xki are vectors of explanatory variables and βk are the corresponding coefficients of interest. σk are the unknown scale parameters and uki represent white noise. Thus,
| , , , , | , , , , . As before, selection bias exists if | , , , , ≠ 0. To be consistent with the
earlier representation of the selection dummy, we can indicate the outcome of the selection as follows:
1 ∗ 0;0 ∗ 0.
1 ∗ 0;0 ∗ 0.
Because of the selection problem, the selection dummies determine the subsample. 14 Intuitively, selection bias should be smaller when our subsample is only based on s1 or alternatively, on s2. In contrast, we exacerbate the bias by selecting our sample based on the availability of both R&D expenses and patent data. Thus, using the popular measure of R&D efficiency, typically defined as the ratio of a patent variable to R&D expenses, intensifies the bias. Consider the following:
| , , , 1, 1 | , , , 1, 1 . In order to correct for the selection bias, | , , , 1, 1 , one has to estimate β1, β2, and the covariance matrix of the error terms in the spirit of a Heckman two-stage procedure when innovation is the dependent variable or carry out multiple imputation when innovation is the explanatory variable (Rubin, 1987).
14 The selection described here is based on the dependent variable y; however, the same issues arise when selection is based on the independent variables x.

41
Appendix 2. Monte Carlo Simulation
In this appendix, we investigate the properties of OLS estimators for various approaches of handling missing data, namely, listwise deletion, mean substitution, zero substitution, Heckman and multiple imputation, and the case of having the true complete data set based on simulated data. As noted earlier in the paper, we are interested in estimating and in the regression:
. We follow and are consistent with studies in missing data statistics literature in our simulation. We randomly generate 5,000 data sets with 2,000 observations from each of the data-generating processes. We generate five variables , , , , drawn from a multivariate normal distribution with mean 0 and variance 1. We add two instruments , to this data that are correlated only with and . The correlation matrix for the simulated data is:
1 0.12 0.1 0.5 0.1000.12 1 0.1 0.6 0.1000.1 0.1 1 0.5 0.1010.5 0.6 0.5 1 0.1000.1 0.1 0.1 0.1 100.4
We consider two data-generating processes with missing data and the case with a complete data set. Of the processes with missing data, there is one case of missing at random, MAR, and one of missing not at random MNAR. MAR: is MCAR; are MAR with missingness determined by , which is completely observed. If (different uniform random number from above) is smaller than 0.1, then is missing for row for data set , where 1,… , 2000 and 1,… , 5000. is missing if 0 and 0.65 and is missing if 0 and 0.45 (with a separate value of ). 40% of the observations are missing. MNAR: is MCAR; are MNAR with missingness determined by and . If
0.95 the it is missing for row for data set , where � 1,… , 4000 and 1,… , 5000. is missing if 0.52 and is missing if 0.48.About 40% of the observations are missing.15
For each of the 5,000 data sets and two data-generating processes, we estimate the regression coefficients, and , with missing data methodologies based on listwise deletion (LISTWISE), substitution of missing variables with the mean of the variables and with missing observation dummies in the regression (MEAN), substitution with zero and missing observation dummies in the regression (ZERO), multiple imputation based on MCMC (IMPUTE), and Heckman procedure for the missing not at random case (Heckman). The instruments for the Heckman model are X5 and X6.
16 We evaluate the performance for various missing data strategies using the coefficient bias for
and . Figure 5 shows the bias for the regression coefficients and for the MAR (Panel A) and MNAR (Panel B).
15 We have tried different parameters and have generated different densities reaching very similar conclusion. For brevity, we do not report these results. They are available upon request. 16 See Schafer (1997) for the MCMC multiple imputation procedure, which utilizes the data augmentation algorithm developed by Tanner & Wong (1987).

42
Appendix 3
Table A1 WDI (World Development Indicators) Variables
Variables on the institutional factors come from the World Competitiveness Yearbook (WCY) compiled by IMD Business School. Index Description Start End Skilled labor Brain drain (well-educated and skilled people) does not
hinder competitiveness in your economy (IMD WCY executive survey based on an index from 0 to 10)
1995 2014
Honesty Bribing and corruption do not exist (IMD WCY executive survey based on an index from 0 to 10)
1995 2014
Regulator efficacy Bureaucracy does not hinder business activity 1995 2014Government subsidies (%) To private and public companies as a percentage of GDP 1995 2013Intellectual property rights Intellectual property rights are adequately enforced (IMD
WCY executive survey based on an index from 0 to 10) 1995 2014
University ties Knowledge transfer is highly developed between companies and universities (IMD WCY executive survey based on an index from 0 to 10)
1995 2014
Labor regulations Labor regulations (hiring/firing practices, minimum wages, etc.) do not hinder business activities (IMD WCY executive survey based on an index from 0 to 10)
1995 2014
Manufacturing intensity Breakdown as a percentage of GDP 1995 2013Economic openness (Exports + Imports) / (2 * GDP) 1995 2013

43
For Online Publication
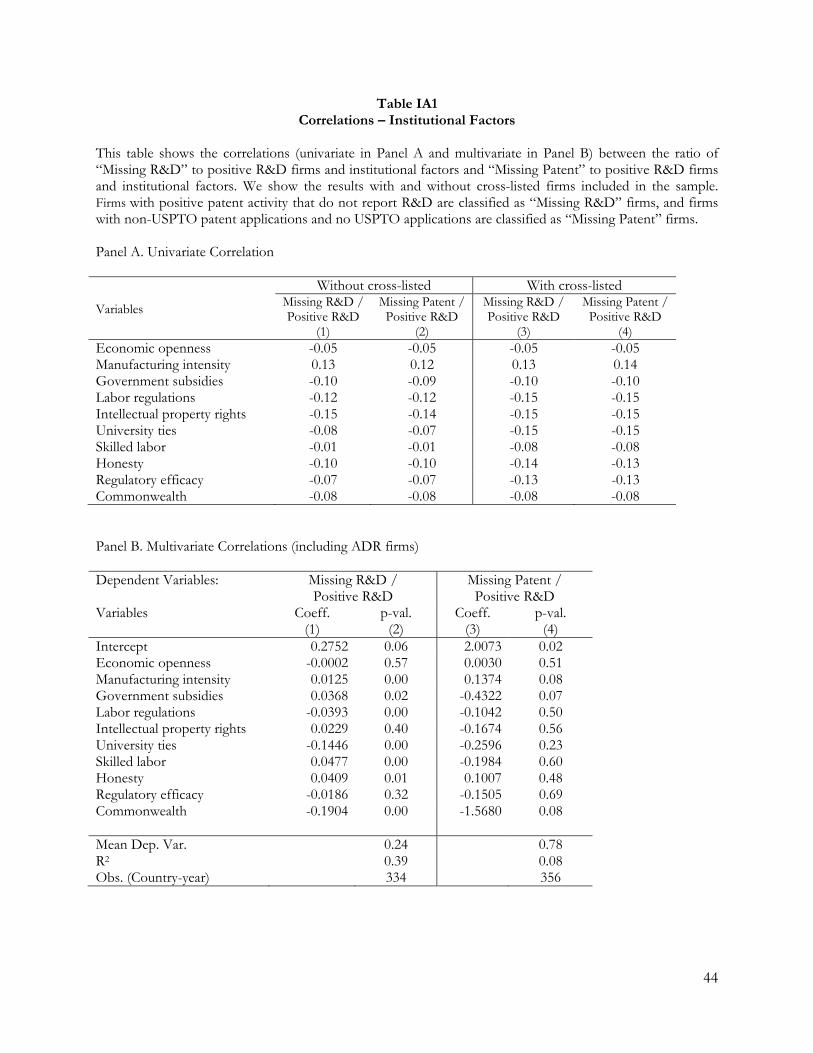
44
Table IA1 Correlations – Institutional Factors
This table shows the correlations (univariate in Panel A and multivariate in Panel B) between the ratio of “Missing R&D” to positive R&D firms and institutional factors and “Missing Patent” to positive R&D firms and institutional factors. We show the results with and without cross-listed firms included in the sample. Firms with positive patent activity that do not report R&D are classified as “Missing R&D” firms, and firms with non-USPTO patent applications and no USPTO applications are classified as “Missing Patent” firms. Panel A. Univariate Correlation Without cross-listed With cross-listed
Variables Missing R&D / Positive R&D
Missing Patent / Positive R&D
Missing R&D / Positive R&D
Missing Patent / Positive R&D
(1) (2) (3) (4) Economic openness -0.05 -0.05 -0.05 -0.05 Manufacturing intensity 0.13 0.12 0.13 0.14 Government subsidies -0.10 -0.09 -0.10 -0.10 Labor regulations -0.12 -0.12 -0.15 -0.15 Intellectual property rights -0.15 -0.14 -0.15 -0.15 University ties -0.08 -0.07 -0.15 -0.15 Skilled labor -0.01 -0.01 -0.08 -0.08 Honesty -0.10 -0.10 -0.14 -0.13 Regulatory efficacy -0.07 -0.07 -0.13 -0.13 Commonwealth -0.08 -0.08 -0.08 -0.08 Panel B. Multivariate Correlations (including ADR firms) Dependent Variables: Missing R&D /
Positive R&D Missing Patent /
Positive R&D Variables Coeff. p-val. Coeff. p-val. (1) (2) (3) (4) Intercept 0.2752 0.06 2.0073 0.02 Economic openness -0.0002 0.57 0.0030 0.51 Manufacturing intensity 0.0125 0.00 0.1374 0.08 Government subsidies 0.0368 0.02 -0.4322 0.07 Labor regulations -0.0393 0.00 -0.1042 0.50 Intellectual property rights 0.0229 0.40 -0.1674 0.56 University ties -0.1446 0.00 -0.2596 0.23 Skilled labor 0.0477 0.00 -0.1984 0.60 Honesty 0.0409 0.01 0.1007 0.48 Regulatory efficacy -0.0186 0.32 -0.1505 0.69 Commonwealth -0.1904 0.00 -1.5680 0.08 Mean Dep. Var. 0.24 0.78 R2 0.39 0.08 Obs. (Country-year) 334 356

45
Table IA2 Relaxing Firm Constraints
This table replicates the results of Table 6 Panel A on the difference between the univariate comparisons of the sample data with the full and partial deletion sample. Panel A only includes countries with more than 1,000 listed firms in the sample, Panel B only firms from Industrial and Commercial Machinery (SIC 35) and Chemical and Allied Products (SIC 28) industries, and Panel C excludes small firms, i.e., firms that have total assets smaller than the 10th percentile of the total assets in the country sample. Panel A. Countries with more than 1,000 listed firms Full
Sample Partial
Deletion Full
Deletion Differences
(1) (2) (3)
(4) = ((1)-(2))/(1)
(5) = ((1)-(3))/(1)
(6) = ((3)-(2))/(1)
Log(Total Assets) 6.92 7.54 7.46 -9%*** -8%*** -1%***
PPE 0.29 0.25 0.20 14%*** 31%*** -17%***
Tobin's Q 1.29 1.37 1.88 -6%*** -46%*** 40%***
Leverage 0.80 0.56 0.48 30%*** 40%*** -10%***
Capital Expenditure 0.06 0.05 0.05 17%*** 17%*** 0%ROA 0.01 0.00 -0.03 100%*** 400%*** -300%***
Sales Growth 0.26 0.23 0.30 12%*** -15%*** 27%***
Panel B. SIC 25 and 38 Industries Full
Sample Partial
Deletion Full
Deletion Differences
(1) (2) (3)
(4) = ((1)-(2))/(1)
(5) = ((1)-(3))/(1)
(6) = ((3)-(2))/(1)
Log(Total Assets) 5.76 5.92 6.17 -3%*** -7%*** 4%***
PPE 0.19 0.17 0.16 11%*** 16%*** -5%***
Tobin's Q 1.69 1.76 2.01 -4%** -19%*** 15%***
Leverage 0.56 0.53 0.40 5% 29%*** -23%**
Capital Expenditure 0.05 0.04 0.04 20%*** 20% 0%ROA -0.02 -0.03 -0.02 -50%*** 0% -50%**
Sales Growth 0.26 0.25 0.25 4% 4% 0% Panel C. Excluding small firms Full
Sample Partial
Deletion Full
Deletion Differences
(1) (2) (3)
(4) = ((1)-(2))/(1)
(5) = ((1)-(3))/(1)
(6) = ((3)-(2))/(1)
Log(Total Assets) 7.08 7.71 7.75 -9%*** -9%*** 1%**
PPE 0.29 0.25 0.21 14%*** 28%*** -14%***
Tobin's Q 1.57 1.47 1.78 6% -13%*** 20%***
Leverage 0.53 0.50 0.45 6%*** 15%*** -9%***
Capital Expenditure 0.06 0.05 0.05 17%*** 17%*** 0%ROA 0.03 0.03 0.01 0% 67%*** -67%***
Sales Growth 0.26 0.23 0.30 12%*** -15%*** 27%***

46
Table IA3 Alternative Treatments of Missing Innovation Measures – Industries
This table presents firm growth panel regressions for the period of 1999–2012 for industries 28 and 35. The dependent variable is three years’ ahead sales growth. “Full Deletion” includes only observations where R&D is not missing and there are USPTO patents filed. “Partial Deletion” includes observations where either R&D is not missing or there are USPTO patents filed. “Zero” replaces all missing R&D and patents with zero. “Mean” replaces all missing R&D and patents with the country industry mean. “Heckman” uses a two-stage estimation procedure, where the lags of the other variables are used as instruments. “Multiple Imputation” is constructed by imputing all missing values using MCMC 100 times; using log(Total Assets), ROA, PPE, and leverage as conditioning variables; and then averaging across the 100 imputations (Schafer (1997)). ” Panel A presents the results with only firm characteristics as explanatory variables, Panel B presents the results with firm and country characteristics as explanatory variables. *, **, and *** represent significance at the 10%, 5%, and 1% levels, respectively. The regressions include year, industry, and country fixed effects.
Panel A. Firm Characteristics
DV = Sales Growth (t+3)
Full Deletion
Partial Deletion
Zero Mean Heckman Multiple Imputation
(1) (2) (3) (4) (5) (6)
Firm controls: Log(Total Assets) -1.59** -2.60*** -3.12*** -3.11*** -1.43*** -2.98*** ROA -45.38*** -45.17*** -44.39*** -44.46*** -30.35*** -45.10*** Capital Expenditure -34.52 -4.36 -0.40 -0.46 -0.57 1.91 Leverage -7.52*** -0.12 -0.07 -0.07 -5.17*** 2.16*** HH Index -4.06 -5.84 -6.07* -6.07* -7.39** -5.77 R&D Dummy -1.32 0.87 0.57 0.65 Patent Dummy -4.28*** -4.19*** -4.30*** -4.45*** R&D 21.91*** 3.85*** 3.65*** 3.64*** 18.44*** -6.12*** Patent App. 0.00 0.00 0.00 0.00 0.00 0.00 Year FE YES YES YES YES YES YES Industry FE YES YES YES YES YES YES Country FE YES YES YES YES YES YES R2 0.07 0.06 0.05 0.05 0.09 Obs. 7,510 24,443 37,716 37,716 19,432 38,278
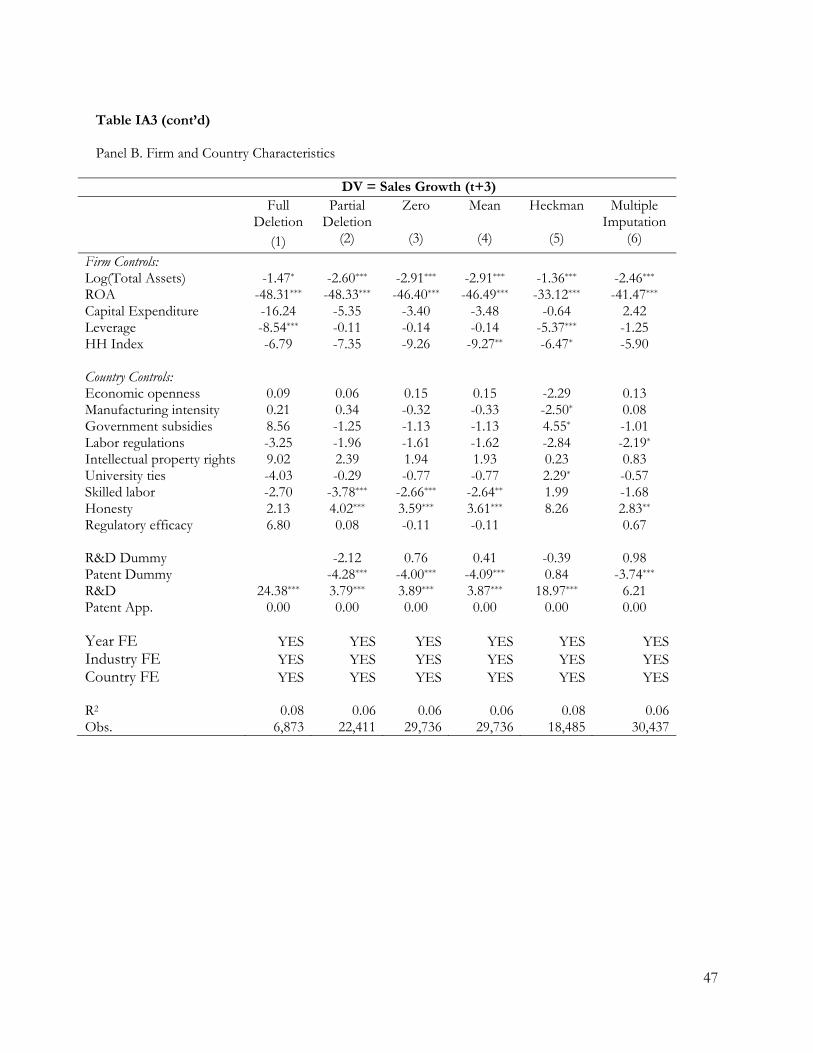
47
Table IA3 (cont’d) Panel B. Firm and Country Characteristics
DV = Sales Growth (t+3) Full
Deletion Partial
Deletion Zero Mean Heckman Multiple
Imputation
(1) (2) (3) (4) (5) (6)
Firm Controls: Log(Total Assets) -1.47* -2.60*** -2.91*** -2.91*** -1.36*** -2.46*** ROA -48.31*** -48.33*** -46.40*** -46.49*** -33.12*** -41.47*** Capital Expenditure -16.24 -5.35 -3.40 -3.48 -0.64 2.42 Leverage -8.54*** -0.11 -0.14 -0.14 -5.37*** -1.25 HH Index -6.79 -7.35 -9.26 -9.27** -6.47* -5.90 Country Controls: Economic openness 0.09 0.06 0.15 0.15 -2.29 0.13 Manufacturing intensity 0.21 0.34 -0.32 -0.33 -2.50* 0.08 Government subsidies 8.56 -1.25 -1.13 -1.13 4.55* -1.01 Labor regulations -3.25 -1.96 -1.61 -1.62 -2.84 -2.19* Intellectual property rights 9.02 2.39 1.94 1.93 0.23 0.83 University ties -4.03 -0.29 -0.77 -0.77 2.29* -0.57 Skilled labor -2.70 -3.78*** -2.66*** -2.64** 1.99 -1.68 Honesty 2.13 4.02*** 3.59*** 3.61*** 8.26 2.83** Regulatory efficacy 6.80 0.08 -0.11 -0.11 0.67 R&D Dummy -2.12 0.76 0.41 -0.39 0.98 Patent Dummy -4.28*** -4.00*** -4.09*** 0.84 -3.74*** R&D 24.38*** 3.79*** 3.89*** 3.87*** 18.97*** 6.21 Patent App. 0.00 0.00 0.00 0.00 0.00 0.00 Year FE YES YES YES YES YES YESIndustry FE YES YES YES YES YES YESCountry FE YES YES YES YES YES YES R2 0.08 0.06 0.06 0.06 0.08 0.06Obs. 6,873 22,411 29,736 29,736 18,485 30,437

48
Figure A1 Monte Carlo t-stat
This figure shows the t-statistics of the coefficients for the constant, X1, and X2 under different approaches to dealing with missing data. LISTWISE deletes all rows with missing observations, ZERO replaces missing observations with zero, MEAN replaces missing observations with the sample mean, IMPUTE replaces missing observations with MCMC-imputed observations based on 100 imputations, and Heckman estimates the coefficients using two instruments. Complete comprises the simulated true non-missing observations, the benchmark case. Panel A presents the results for observations Missing at Random (MAR) and Panel B for observations Missing not at Random (MNAR). This simulation is described in Appendix 2.
Panel A. MAR
Panel B. MNAR
‐6
‐4
‐2
0
2
4
6
8
LISTWISE ZERO MEAN IMPUTE Complete
Constant β1 β2
‐4
‐2
0
2
4
6
8
10
12
LISTWISE ZERO MEAN IMPUTE Heckman Complete
Constant β1 β2