Measuring Inflation Expectations
32
Measuring Inflation Expectations Olivier Armantier, 1 Wändi Bruine de Bruin, 2,3 Simon Potter, 1 Giorgio Topa, 1 Wilbert van der Klaauw, 1 and Basit Zafar 1 1 Federal Reserve Bank of New York, New York, NY 10045; email: [email protected] 2 Centre for Decision Research, Leeds University Business School, Leeds LS2 9JT, United Kingdom 3 Department of Engineering and Public Policy, Carnegie Mellon University, Pittsburgh, Pennsylvania 15213 Annu. Rev. Econ. 2013. 5:273–301 The Annual Review of Economics is online at economics.annualreviews.org This article’s doi: 10.1146/annurev-economics-081512-141510 Copyright © 2013 by Annual Reviews. All rights reserved JEL codes: C81, D84, E31, E37, E64 Keywords surveys, information, updating, behavior, monetary policy, experiments Abstract To conduct monetary policy, central banks around the world increas- ingly rely on measures of public inflation expectations. In this article, we review findings from an ongoing initiative at the Federal Reserve Bank of New York aimed at improving the measurement and our un- derstanding of household inflation expectations through surveys. We discuss the importance of question wording and the usefulness of new questions to elicit an individual’s distribution of inflation beliefs. We present evidence suggesting that consumers update their inflation expectations in response to new information and that information dissemination may lead to more informed and reliable reporting of inflation expectations. Finally, we report on a financially incentivized experiment suggesting that expectations surveys are informative and that respondents generally act on their stated beliefs in a way consis- tent with expected utility theory. 273 Annu. Rev. Econ. 2013.5:273-301. Downloaded from www.annualreviews.org by Universitat Zurich- Hauptbibliothek Irchel on 07/01/14. For personal use only.
Transcript of Measuring Inflation Expectations

Measuring InflationExpectationsOlivier Armantier,1 Wändi Bruine de Bruin,2,3
Simon Potter,1 Giorgio Topa,1
Wilbert van der Klaauw,1 and Basit Zafar1
1Federal Reserve Bank of New York, New York, NY 10045; email:[email protected] for Decision Research, Leeds University Business School, Leeds LS2 9JT,United Kingdom3Department of Engineering and Public Policy, Carnegie Mellon University, Pittsburgh,Pennsylvania 15213
Annu. Rev. Econ. 2013. 5:273–301
The Annual Review of Economics is online ateconomics.annualreviews.org
This article’s doi:10.1146/annurev-economics-081512-141510
Copyright © 2013 by Annual Reviews.All rights reserved
JEL codes: C81, D84, E31, E37, E64
Keywords
surveys, information, updating, behavior, monetary policy,experiments
Abstract
To conduct monetary policy, central banks around the world increas-ingly rely on measures of public inflation expectations. In this article,we review findings from an ongoing initiative at the Federal ReserveBank of New York aimed at improving the measurement and our un-derstanding of household inflation expectations through surveys. Wediscuss the importance of question wording and the usefulness of newquestions to elicit an individual’s distribution of inflation beliefs. Wepresent evidence suggesting that consumers update their inflationexpectations in response to new information and that informationdissemination may lead to more informed and reliable reporting ofinflation expectations. Finally, we report on a financially incentivizedexperiment suggesting that expectations surveys are informative andthat respondents generally act on their stated beliefs in a way consis-tent with expected utility theory.
273
Ann
u. R
ev. E
con.
201
3.5:
273-
301.
Dow
nloa
ded
from
ww
w.a
nnua
lrev
iew
s.or
gby
Uni
vers
itat Z
uric
h- H
aupt
bibl
ioth
ek I
rche
l on
07/0
1/14
. For
per
sona
l use
onl
y.

1. INTRODUCTION
Expectations, and in particular inflation expectations, play a key role in the conduct of modernmonetary policy (Gali 2008, Sims 2009). Expectations drive people’s behavior, by influencinga wide range of economic decisions, such as saving, investment, purchases of durable goods, andwage negotiations. These decisions in turn affect real economic activity and actual inflation.Therefore, it is crucial for a central bank to monitor inflation expectations, making sure that theyremain well anchored and consistent with policy objectives. Because the economy is constantlybuffeted by unanticipated shocks, short-term inflation expectations should reflect the effects ofthese shocks. For example, if energy prices increase suddenly because of a supply disruption, short-term inflation expectations should move up. At the same time, longer-term inflation expecta-tions—that is, expectations of inflation after the end of the supply disruption—should not move.This stability of longer-term inflation expectations in the face of movements in short-terminflation expectations is the hallmark of sound, effective, and credible monetary policy.
In standard macroeconomic models, it is trivial to measure inflation expectations: Under therational expectations assumption, any economic agent in the model could produce a unique in-flation expectation for any horizon. In the real world, however, central banksmust rely on variousindirect approaches to measure inflation expectations: market-based measures, surveys of pro-fessionals such as economists and market participants, and surveys of firms and households. Allthree types of measures have advantages and drawbacks. It is therefore important for a centralbank to use a variety of measures that complement one another. Before turning to the focus of thisreview—the measurement of household inflation expectations through surveys—we providea quick summary of market-based measures, as well as professional and business surveys.
The difference in yields between nominal and real government debt provides a naturalmeasure ofmarket inflation expectations for the price index used to protect the holders of real government debtfrom inflation. In the United States, that price index is the Consumer Price Index (CPI). Thus if thenominal 10-year yield is 3.5% and the real 10-year yield is 1%, one crude measure of average CPIinflation over the next 10 years would be 2.5%. Furthermore, if the nominal 5-year yield is 3% andthe real 5-year yield is 0.2%, then a crude measure of the average CPI inflation over the next 5 yearswouldbe2.8%,andaroughestimateof the5–10-year forward averageCPI inflationwould be 2.2%.
This is a rough estimate because such calculations ignore any difference in liquidity betweenandwithin the two types of debt, any compensation investors require for the uncertainty of the realvalue of nominal coupons, and a variety of other issues, including that Treasury Inflation-Protected Securities are indexed to the CPI with a time-varying lag.
There are numerousways to account for liquidity differences, risk compensation, and the otherfactors. For example, Figure 1 shows estimates of the 5–10-year forward inflation compensationconstructed by Barclays, the Board of Governors of the Federal Reserve, the New York FedMarkets Group, and inflation swaps. The differences result from differing assumptions on theliquidity of various securities and the use of an estimated yield curve to produce the Boardestimates. Because no attempt is made to remove the compensation for inflation risk in thesemeasures, these are estimates of compensation for expected and unexpected inflation. There areclearly different short-term fluctuations in the various estimates, but they show a similar pattern—with the exception of the height of the financial crisis, they are contained within a range of justbelow 2.5% to just above 3%.Yield curvemodel–based estimates can provide a decomposition ofthe whole forward structure of inflation expectations. As shown in Figure 2 for the Board ofGovernors measure of inflation compensation, the recent decrease in market inflation compen-sation is centered on short-term inflation expectations with little to no movement in longer-terminflation expectations from 2013 onward.
274 Armantier et al.
Ann
u. R
ev. E
con.
201
3.5:
273-
301.
Dow
nloa
ded
from
ww
w.a
nnua
lrev
iew
s.or
gby
Uni
vers
itat Z
uric
h- H
aupt
bibl
ioth
ek I
rche
l on
07/0
1/14
. For
per
sona
l use
onl
y.

There are numerous surveys of economists and market participants that give additional in-formation on inflation expectations. As with the market-based measures, the surveys produceresponses for a specific price index, usually the CPI and the CPI excluding food and energy (oftenreferred to as core inflation).
The Survey of Professional Forecasters (SPF) also asks numerous questions about the deflatorfor Personal Consumption Expenditures (PCE), the price index for which the Federal OpenMarket Committee recently chose to adopt a 2% inflation objective over the longer run, asconsistent with its statutory mandate. Compared with market-based measures, these measureshave the advantages of being unaffected by varying market liquidity and not requiring any ad-justment for inflation risk compensation. Furthermore, the SPF asks a number of questions aboutshort-run inflation uncertainty. These direct measures, however, may also have weaknesses. Inparticular, the SPF is based on small samples and may be biased by strategic misreporting.1 Moregenerally, because of the absence of direct financial consequences, inflation surveys do not provideincentives for thoughtful and truthful responses and may therefore suffer from a cheap-talk
0.0
0.5
1.0
1.5
2.0
2.5
3.0Pe
rcen
tPe
rcen
t
Jackson Hole
75th percentile
25th percentile
1.5
2.0
2.5
3.0
3.5
4.0
Jackson Hole
May 31:
2.50
Bloomberg: 5-year/5-year zero coupon inflation swap
1.5
2.0
2.5
3.0
3.5
4.0
2006 2007 2008 2009 2010 2011 2012
Jackson Hole
FRBNY: 5-year/5-year breakeven forward
1.5
2.0
2.5
3.0
3.5
4.0
2006 2007 2008 2009 2010 2011 2012
Jackson Hole
Barclays capital: 5-year/5-year breakeven forward
a b
c d
FRB: 5-year/5-year breakeven forward
75th percentile
25th percentile
May 31:
2.42
75th percentile
25th percentile
May 31:
2.70
75th percentile
25th percentile
May 31:
2.81
Figure 1
Measures of forward inflation compensation. Data from (a) Barclays, (b) the Federal Reserve Board of Governors, (c) Federal ReserveBank of New York, and (d) Bloomberg.
1The SPF currently consists of 45 respondents on average. Moreover, because of strategic and reputational considerations, ithas been argued that professional forecasters may have incentives to misreport their beliefs (Ehrbeck & Waldmann 1996,Laster et al. 1999, Ottaviani & Sørensen 2006).
275www.annualreviews.org � Measuring Inflation Expectations
Ann
u. R
ev. E
con.
201
3.5:
273-
301.
Dow
nloa
ded
from
ww
w.a
nnua
lrev
iew
s.or
gby
Uni
vers
itat Z
uric
h- H
aupt
bibl
ioth
ek I
rche
l on
07/0
1/14
. For
per
sona
l use
onl
y.

problem (see, e.g., Inoue et al. 2009;Keane&Runkle 1990;Manski 2004, 2006; Pesaran&Weale2006).
These forecasts from professionals about core inflation and long-run average inflation provideadditional insight into the stability of forward inflation expectations. Because many of the shocksthat move around total inflation at high frequencies are removed from core inflation, forecasts ofcore inflation in the short to medium term provide an additional check on the anchoring of in-flation expectations. Recently, with the large increase in economic slack produced by the GreatRecession, there has been considerable debate on the relative strengths of slack to generate a de-cline in inflation versus the power of anchored inflation expectations to restrain this decline.
Figure 3 shows some detail on the recent behavior of the forecasts for core PCE from the SPFanddispersion in long-runCPI forecasts. Figure 3a shows the average of point forecasts since 2007for the current-year andyear-ahead core PCE inflation rates.Asonewould expect, the current-yearforecast ismore variable, and for themost part, the year-ahead forecast remains above the current-year forecast after the financial crisis, consistent with the pull of anchored inflation expectations.Both sets of forecasts are very close to the Federal Open Market Committee’s 2% longer-runinflation objective. Figure 3b shows ameasure of uncertainty for these forecasts (see Rich&Tracy2010 for further details on the computation of the uncertainty measure derived from the SPFresponses). Here we can see that uncertainty increased as the financial crisis took hold. Figure 3cshows that disagreement across forecasters, as measured by the standard deviation of the in-dividual point forecasts, also increasedwith the financial crisis.Much of this disagreement appearsto be related to differing views on the strength of standard Phillips curve dynamics versus otherapproaches to inflation dynamics.
Figure 3d shows the disagreement in 10-year average CPI forecasts over the past 20 years. Oneof the great successes of the Federal Reserve in the 1980s and 1990s was a reduction in long-runinflation expectations. Indeed since 1994 the median forecast from this SPF question has stayedwithin a very narrow range. However, the amount of disagreement around this median hasincreased recently.
Years ahead0 1 2 3 4
Basi
s po
ints
–100
–75
–50
–25
0
25
Figure 2
Changes inone-year forward inflation compensation (sinceApril 2, 2012).Data from theFederalReserveBoard.
276 Armantier et al.
Ann
u. R
ev. E
con.
201
3.5:
273-
301.
Dow
nloa
ded
from
ww
w.a
nnua
lrev
iew
s.or
gby
Uni
vers
itat Z
uric
h- H
aupt
bibl
ioth
ek I
rche
l on
07/0
1/14
. For
per
sona
l use
onl
y.

In addition to market-based measures and survey evidence from professional forecasters,central banks rely on survey measures of the public’s inflation expectations. As mentioned above,households in aggregate are important drivers of economic activity and play a major role in thetransmission mechanism through which inflation expectations impact future realized inflation(Bernanke 2004, 2007). An important survey-based source of information on US households’inflation expectations is the Thomson Reuters/University of Michigan Survey of Consumers.Often referred to as theMichigan Survey, it randomly surveys anationally representative sample ofapproximately 500households eachmonth.Amongother questions, the survey solicits year-aheadand 5–10-year-ahead forecasts for expected changes to “prices in general.” These questions haveremained essentially unchanged for the past 30 years.
Figure 4 shows the median year-ahead and 5–10-year-ahead inflation expectations sinceOctober 2007. The volatility of year-ahead expectations, relative to 5–10-year-ahead expect-ations, is notable. After a sharp rise coinciding with the oil price spike in 2008 and the financialcrisis, in recent years year-ahead inflation expectations have returned to values in the3.5–4.0 rangethat preceded the financial crisis. The 5–10-yearmeasure has beenmuchmore stable than the year-ahead measure, increasing somewhat during the 2008–2009 period, but remaining close to 3%since early 2010.
0
0.5
1.0
1.5
2.0
2.5
2007 2008 2009 2010 2011 20120
0.1
0.2
0.3
0.4
0.5
0.6
2007 2008 2009 2010 2011 2012
0
0.1
0.2
0.3
0.4
0.5
0.6
0.7
0.8
2007 2008 2009 2010 2011 2012
Q1
surv
ey p
erce
nt
0.2
0.4
0.6
0.8
1.0
1992 1996 2000 2004 2008 2012
Q4
surv
ey p
erce
nt
Perc
ent
Q1
surv
ey p
erce
nt
One year ahead
Current year
(13Q4/12Q4)
2012Q1
(12Q4/11Q4)
2012Q1
One year ahead
Current year
One year ahead
Current year
10-year
headline CPI
Mean of core PCE (Q4/Q4) inflation forecasts
a b
c d
Uncertainty in core PCE (Q4/Q4)inflation forecasts
Disagreement in core PCE (Q4/Q4)inflation forecasts
Disagreement in long-runinflation forecasts
Figure 3
Data from the Survey of Professional Forecasters (SPF) inflation forecasts. (a) Themean of, (b) uncertainty in, and (c) disagreement in corePersonalConsumptionExpenditures (PCE) (Q4/Q4) inflation forecasts. (d)Disagreement in long-run inflation expectations. In panelsa–c,the dates represent the survey release. Abbreviation: CPI, Consumer Price Index.
277www.annualreviews.org � Measuring Inflation Expectations
Ann
u. R
ev. E
con.
201
3.5:
273-
301.
Dow
nloa
ded
from
ww
w.a
nnua
lrev
iew
s.or
gby
Uni
vers
itat Z
uric
h- H
aupt
bibl
ioth
ek I
rche
l on
07/0
1/14
. For
per
sona
l use
onl
y.

Comparing the mean forecast for year-ahead inflation in the Michigan Survey with that ofprofessional forecasters in the SPF shown in Figure 3, we find that the Michigan Survey’s meanforecast is on average higher and shows more variation but shows otherwise similar patterns overtime. The higher average is common to other consumer surveys of inflation expectations, andmany possible explanations have been proposed, some of which are discussed in more detailbelow. One possible explanation relates to question wording and interpretation, and the exactmeasure of inflation used by consumers, which may differ from the PCE. Another explanation forthe higher average forecast and increased volatility concerns consumers’ knowledge/information,financial literacy, and forecast ability.2
Although its findings are closely monitored, theMichigan Survey has a number of well-knowndrawbacks. Besides its somewhat ambiguous question wording, which we discuss in more detailbelow, and the lack of a measure of an individual’s uncertainty about future inflation outcomes,its monthly sample essentially represents a repeated cross section (that is, a different sample ofrespondents each month), so month-to-month changes in average expectations in part reflectsample composition changes.3 During the past decade, many central banks and academicresearchers have begun to explore ways to improve the measurement of the public’s inflationexpectations through surveys and to better understand how the public forms and updates beliefsabout future inflation.4 In addition to initiating new surveys and gradually moving from
0
1
2
3
4
5
6
Oct07
Jan08
Apr08
Jul08
Oct08
Jan09
Apr09
Jul09
Oct09
Jan10
Apr10
Jul10
Oct10
Jan11
Apr11
Jul11
Oct11
Jan12
Apr12
Jul12
Perc
ent
1-year
5–10-year
Figure 4
Trends in 1-year and 5–10-year inflation expectations, based on Michigan Survey micro data, illustrating themedian of point forecasts from the “prices in general” survey question.
2The inflation expectations measure from the Conference Board’s Consumer Confidence Survey shows similar characteristics(see also Blanchflower & Coille 2009, Bryan & Venkatu 2001).3This drawback applies to an even greater extent to themuch smaller sample size in the SPF, as documented by Engelberg et al.(2011).4Central banks that survey consumers about their inflation expectations include the Bank of England, the European CentralBank, the Bank of Australia, the Bank of Japan, the Reserve Bank of India, and the Sveriges Riksbank. Examples of academicresearchers using inflation expectations surveys include Roberts (1995), Carroll (2003), Mankiw et al. (2004), Nunes (2010),and Adam & Padula (2011).
278 Armantier et al.
Ann
u. R
ev. E
con.
201
3.5:
273-
301.
Dow
nloa
ded
from
ww
w.a
nnua
lrev
iew
s.or
gby
Uni
vers
itat Z
uric
h- H
aupt
bibl
ioth
ek I
rche
l on
07/0
1/14
. For
per
sona
l use
onl
y.

traditionally qualitative to more quantitative questions and measures, they are conducting re-search to analyze the quality and information content of survey-based measures of inflationexpectations [see recent work by Anderson et al. (2010), Badarinza & Buchmann (2009), Barnettet al. (2010), and Galati et al. (2011)].
A recent example of such an innovation is the Business Inflation Expectations survey that theFederal Reserve Bank of Atlanta (Atlanta Fed) has been fielding in the US Southeast on a regularbasis since October 2011. The Atlanta Fed survey focuses on business expectations of unit costs.Thus, unlikemost othermeasures, it does not immediatelymap into ameasure of consumer priceinflation. The Atlanta Fed also asks a number of questions about what firms expect the maindrivers of changes in unit costs to be. Its most recent surveys include a special question onexpectations of unit costs over the next 5 to 10 years. Again the idea is to obtain information onthe anchoring of inflation expectations, but in this case at the intermediate level of unit costs.Figure 5 illustrates the distribution of these expectations: According to the Atlanta Fed panel ofbusinesses, the most likely outcome for inflation in the near and long term is somewhere in the1–3% range. But the risks seem to be imbalanced. In the near term, businesses think thereis potential for costs to grow even less. But over the longer term, businesses indicate that therisk to unit costs shifts to the upside.
In late 2006, theNewYork Fed initiated amajor research project to examine a number of issuesrelated to inflation expectations. First, what is the best way to measure the public’s inflationexpectations in terms of inflation concepts and forecast horizon? Second, how do householdsform and update their expectations of future inflation? To what extent are they based on pastinflation experiences, and what information sources do they rely on? Third, do people act ontheir expectations and if so, how? The remainder of this review surveys our recent work onthese questions.
Despite the importance of inflation expectations for forecasting future inflation and economicactivity, and despite the key role played by inflation expectations in the monetary transmissionmechanism, there was surprisingly little information when we started this project to directlyanswer these questions. This was partly because, until recently, macroeconomists had enjoyedaround 20 years of success with models in which these questions were answered in a simple and
12 months ahead
5–10 years ahead
0
5
10
15
20
25
30
35
40
<–1% –1% to 1% 1% to 3% 3% to 5% >5%
Perc
ent
Cost change
Figure 5
Distribution of respondent expectations for unit costs (April 16–21, 2012). Data from the Federal ReserveBank of Atlanta.
279www.annualreviews.org � Measuring Inflation Expectations
Ann
u. R
ev. E
con.
201
3.5:
273-
301.
Dow
nloa
ded
from
ww
w.a
nnua
lrev
iew
s.or
gby
Uni
vers
itat Z
uric
h- H
aupt
bibl
ioth
ek I
rche
l on
07/0
1/14
. For
per
sona
l use
onl
y.

unambiguous manner by imposing a rational expectations assumption. As we painfully learnedfrom the 2008 financial crisis and its aftermath, the success of these models resulted much morefrom luck than from deep insight.
Our relative ignorance was also partly because economists do not receive detailed training inthe design of survey questions. One issue that sparked our initial interest was the wording ofquestions. We found that most questions on inflation expectations did not directly ask aboutinflation but instead asked about prices. For example, theMichigan Survey asks about the changein“prices in general,” and the Bankof England/GfKNOP InflationAttitudes survey asks about theexpected“change in prices in shops generally.”Not being experts in survey design,we decided thatwe needed a wide collaboration to understand the implications of asking about prices in generaland whether it was possible to ask directly about the rate of inflation. We formed a cross-disciplinary team among the Federal Reserve research staff, academic economists, and psy-chologists at Carnegie Mellon University who specialize in behavioral decision making as well asrisk perception and communication. The initial part of the project was structured in three stages.The first two stages—preliminary inquiries conducted through phone and Internet surveys—gauged how individuals interpreted the Michigan Survey questions and how they would respondto alternative questions about future inflation. The Internet surveys also piloted questions onwageexpectations and inflation uncertainty to expand the information currently elicited by theMichigan Survey. These preliminary inquiries guided the final formulation of the questions for thethird stage: the actual implementation of an alternative experimental Internet survey of inflationexpectations using a sample panel of households drawn from previous respondents to theMichigan Survey.5
The rest of this review is organized as follows. Section 2 describes how we used tools from thesurvey design literature to better understand how survey respondents interpret various possiblewordings of questions about inflation expectations. Section 3 is devoted to probabilistic surveyquestions and their use tomeasure forecast uncertainty.We discuss an information experiment onexpectations formation and updating in Section 4. We report on a financially incentivized ex-periment we conducted to study the link between inflation expectations and behavior in Section 5.Section 6 describes the measurement of expectations at different time horizons and for additionalvariables of interest, namely house prices and wage earnings. Section 7 concludes.
2. INSIGHTS ABOUT SURVEY DESIGN
The survey design literature treats surveys as a form of communication (Bruine de Bruin 2011,Schwarz 1996), suggesting that effective exchange of information occurs when questions areinterpreted in the same way by researchers and respondents. Miscommunications may arise whenquestionwriters fail to recognize, for instance, that average adult literacy in theUnited States variesbetween the seventh and ninth grade (Neuhauser & Paul 2011). Hard-to-read survey questionsmay create confusion about how to answer, resulting in increased use of missing responses(Velez&Ashworth 2007). However, even simple words may be interpreted differently by expertsand nonexperts, leading to misinterpretations of seemingly straightforward questions aboutdemographic characteristics (McKenney & Bennett 1994). For example, respondents who arecohabiting in heterosexual relationships may fail to choose the response option to indicate thatthey are “married or living with a partner” because they interpret the term partner as reserved forhomosexual relationships (Hunter 2005).
5All the Internet surveys discussed here were fielded through Rand’s American Life Panel survey.
280 Armantier et al.
Ann
u. R
ev. E
con.
201
3.5:
273-
301.
Dow
nloa
ded
from
ww
w.a
nnua
lrev
iew
s.or
gby
Uni
vers
itat Z
uric
h- H
aupt
bibl
ioth
ek I
rche
l on
07/0
1/14
. For
per
sona
l use
onl
y.

National surveys of consumer inflation expectations are being conducted in many countries(e.g.,Blanchflower&Coille 2009, Jonung 1981,Ranyard et al. 2008). To avoid the term inflation,most existing inflation expectations questions, such as those posed in theMichigan Survey, ask forexpected changes in prices. For example, the Michigan Survey has been measuring inflationexpectations in theUnited States formore than 50 years (Curtin 2006) by asking, “During the next12months, do you think that prices in generalwill go up, or godown, or staywhere they are now?”followed by the response options “go up,” “stay the same,” and “go down.” Those who respond“go up” or “go down” are then asked to give a specific percent.Median responses to theMichiganquestion generally track actual inflation estimates such as the CPI and sometimes outperformprofessional and model-based forecasts in predicting actual inflation (Ang et al. 2007, Thomas1999). Yet, even in periods of relatively stable inflation, survey measures tend to show largedisagreement between respondents, with some giving seemingly excessive overestimations ofofficial inflation estimates (Bryan & Venkatu 2001, Ranyard et al. 2008).
Because product categories may experience different levels of inflation, it has been argued thatvariations in individuals’ consumption patterns across product categories may partially explainthe observed variations in their experienced inflation as well as their inflation expectations(Bryan&Venkatu 2001,McGranahan& Paulson 2006, Ranyard et al. 2008). However, Hobijnet al. (2009) suggest that individual differences in experienced inflation tend to be relativelysmall, varying by only 0.2–0.4% across different demographic groups in 1995–2005, whereasinflation expectations have varied much more extensively.
In our project, we examined whether variations in the interpretation of the “prices in general”wording used by theMichigan Survey and many other national surveys may be another source ofthe relatively large dispersion in responses. As is commonly recommended in the survey designliterature, we first conducted cognitive pilot interviews with a small sample to identify potentialinterpretations of the question (Bruine de Bruin 2011, Bruine de Bruin & Bostrom 2013, Dillmanet al. 2009). After reading theMichigan Survey question out loud, interviewees were instructed tothink out loud while generating their answers. We tallied the question interpretations and foundthat some interviewees recognized the question as asking about inflation, whereas others inter-preted it as asking about their personal price experiences.
We then conducted an Internet survey in December 2007 with a larger sample recruitedthrough Rand’s American Life Panel, thus obtaining sufficient statistical power to examine theassociation of question interpretations with responses. Respondents first received the MichiganSurvey question about prices in general and subsequently rated how much they were thinkingof different question interpretations taken directly from our cognitive interviews, including “theprices of things you spend money on” and “inflation.” As expected, we found that thinkingrelatively more about personal price experiences when answering questions about expectations forprices in general was associated with giving much higher responses (Bruine de Bruin et al. 2010).
Psychological theories suggest that consumers pay more attention to price increases than toprice decreases, especially if they are large, frequently experienced, and already a focus of con-sumers’ concern (Brachinger 2008, Christandl et al. 2011, Jungermann et al. 2007, Greitemeyeret al. 2005, Kahneman & Tversky 1979, Ranyard et al. 2008). Perhaps as a result, when peoplemake predictions about the future, they consider their past, with more extreme experiences themost likely to come to mind (Morewedge et al. 2005). Hence reported inflation expectations maybe artificially increased when respondents think of personal price experiences, owing to extremeexperiences, with, for example, gas and food prices the most likely to come to mind (Bruine deBruin et al. 2011b).
When we probed our survey respondents about their understanding of changes to prices ingeneral (the Michigan Survey question), we found that a significant fraction believed we were
281www.annualreviews.org � Measuring Inflation Expectations
Ann
u. R
ev. E
con.
201
3.5:
273-
301.
Dow
nloa
ded
from
ww
w.a
nnua
lrev
iew
s.or
gby
Uni
vers
itat Z
uric
h- H
aupt
bibl
ioth
ek I
rche
l on
07/0
1/14
. For
per
sona
l use
onl
y.

inquiring about the prices they recently paid themselves—often prices that had increased or de-creased markedly, such as those for food or gasoline. We also found this tendency to think moreabout prominent price changes in one’s own experience to be particularly common amongrespondents with lower financial literacy. By contrast, when we asked about expectations for therate of inflation, respondents tended to think less about a few salient price changes specific to theirown experience and more about price changes across a broader set of items or about changes inthe cost of living—a result that aligns more with economists’ definition of inflation. Asking aboutthe rate of inflation directly therefore produces answers more consistent with the concept of theforward inflation expectations of interest to central banks.
Taken together, these results seem to suggest that questions that ask about prices in generalelicit dispersed responsesowing tovariations in respondents’ interpretations about how to answer.Because interpreting the question as asking about inflation seemed to be associated with lessdisagreement about question interpretation and with less extreme responses, a follow-up studyexamined the effect of asking directly for expectations of inflation rather than prices in general(Bruine de Bruin et al. 2012). Although the term inflation refers to a relatively complex concept,consumers tend to have a basic understanding of what it means (Leiser &Drori 2005, Svenson&Nilsson 1986). Respondents were randomly assigned to answering questions about their ex-pectations for prices in general or inflation. We found that questions that asked directly aboutexpectations for inflation showed much less disagreement between respondents and more rea-sonable expectations than do questions about expectations for prices in general.
These findings were subsequently confirmed in our experimental panel survey, participantsof which were recruited from the Michigan Survey. Figure 6 plots the time series of medianresponses to a question regarding prices in general and one regarding the rate of inflation. Onecan see that the median expectation for the question regarding the rate of inflation is lessvariable. Interestingly, the recent spikes inMichigan short-term expectations inMarch of 2011and 2012 (mirrored by our question regarding prices in general) correspond to spikes in year-ahead inflation expectations for gasoline (Figure 7). Our preferred question regarding the
Perc
ent
–2
0
2
4
6
8
10
12
Prices in general
Rate of inflation
25th percentile
75th percentile
Oct07
Jan08
Apr08
Jul08
Oct08
Jan09
Apr09
Jul09
Oct09
Jan10
Apr10
Jul10
Oct10
Jan11
Apr11
Jul11
Oct11
Jan12
Apr12
Figure 6
Median (and 25th and 75th percentiles) of year-ahead forecasts of prices in general and the rate of inflation.Data from the Federal Reserve Bank of New York and the American Life Panel.
282 Armantier et al.
Ann
u. R
ev. E
con.
201
3.5:
273-
301.
Dow
nloa
ded
from
ww
w.a
nnua
lrev
iew
s.or
gby
Uni
vers
itat Z
uric
h- H
aupt
bibl
ioth
ek I
rche
l on
07/0
1/14
. For
per
sona
l use
onl
y.

rate of inflation is less sensitive to movements in prices or expectations for specific com-modities that may be salient for consumers. We also find that the dispersion of responses issignificantly larger for the question regarding prices in general than for that regarding the rateof inflation.
Other researchers have also noted the importance of the wording of economic expectationsquestions (Glaser et al. 2007). Thus, although simpler wording (such as prices in general) isgenerally recommended in the survey design literature, sometimes more complex terms (suchas inflation) do a better job at communicating the question designers’ intent and reducingrespondents’ disagreements about the meaning of the question. As our study shows, cognitiveinterviews and follow-up surveys are needed to understand whether respondents do indeedinterpret economic survey questions in the way the question designers intended.
3. MEASURING FORECAST UNCERTAINTY
In addition to developing new and better wording for questions aimed at eliciting point forecastsfor inflation, we have also designed and fielded probabilistic questions to elicit consumers’ sub-jective probability distribution over future inflation outcomes. These questions ask respondents toassign probabilities to predetermined intervals or bins for future changes in prices and othervariables of interest. For each individual respondent, the resulting density forecast enables us toconstruct individual measures of central tendency (e.g., the density mean or median) and un-certainty (e.g., the dispersion of the reported probability distribution).6 Being able to measure
Jan10
Apr10
Jul10
Oct10
Jan11
Apr11
Jul11
Oct11
Jan12
Apr12
Perc
ent
0
2
4
6
8
10
12
Gas
Food
Housing costs
Medical costs
Figure 7
Median year-ahead commodity price inflation expectations. Data from the Federal Reserve Bank ofNewYorkand the American Life Panel.
6Probabilistic questions are being increasingly used in large-scale household surveys such as the Health and RetirementStudy, the Survey of Economic Expectations, the Dutch VSB Panel Survey, and the National Longitudinal Survey of Youth1997.
283www.annualreviews.org � Measuring Inflation Expectations
Ann
u. R
ev. E
con.
201
3.5:
273-
301.
Dow
nloa
ded
from
ww
w.a
nnua
lrev
iew
s.or
gby
Uni
vers
itat Z
uric
h- H
aupt
bibl
ioth
ek I
rche
l on
07/0
1/14
. For
per
sona
l use
onl
y.

consumers’ expectations as densities of future outcomes is important to get a sense of how wellanchored expectations are. It could be, for instance, that althoughmeasures of central tendency donot vary much over a given period, other moments of individuals’ forecast densities may changesignificantly—for instance, their dispersion, skewness, or perceived tail risks (which can bemeasured by looking at the probability assigned to extreme inflation outcomes, or at the 90–10thor 75–25th percentiles).
Our probabilistic question about future price inflation follows a format similar to thatemployed, for example, in the SPF and the Bank of Italy’s Survey of Household Income andWealth. We define several possible bins for the rate of change of prices in general.7 We then askrespondents to indicate “the percent chance that, over the next 12 months, the following thingsmay happen” followed by predefined categories for expected prices in general, with the reminderthat numbers need to add up to 100%:8
go up by 12% or more ______ percent chancego up by 8–12% ______ percent chancego up by 4–8% ______ percent chancego up by 2–4% ______ percent chancego up by 0–2% ______ percent chancego down by 0–2% ______ percent chancego down by 2–4% ______ percent chancego down by 4–8% ______ percent chancego down by 8–12% ______ percent chancego down by 12% or more ______ percent chance
100% total.
Weuse each individual’s responses to the probabilistic questions to parametrically estimate theunderlying forecast density function (following Engelberg et al. 2009). More specifically, whena respondent assigns a positive probability to three or more bins, we assume an underlyinggeneralized beta distribution, which has four parameters, two to determine its support and twoto determine its shape, allowing the mean, median, and mode to take on different values. Forrespondents assigning a positive probability to only one or two bins, the underlying distribution isassumed to have the shape of an isosceles triangle [for further details about the estimation of bothdistributions, including the treatment of positive probability bins that are open ended (on theboundary), see Engelberg et al. 2009].
Based on the probability density function for each respondent, we computed correspondingdensity means and medians. Furthermore, we used the density interquartile range (IQR) asa measure of individual forecast uncertainty. We chose this measure because the IQR is less
7We follow here the exposition in Bruine de Bruin et al. (2011b), which focuses on the question regarding prices in general.The format of our preferred question regarding the rate of inflation is very similar.We chose this specific set of bins based onhistorical patterns as well as initial findings from our set of pilot and cognitive interviews.8These questions are presented with instructions adapted from those used previously in the Survey of Economic Expectations(Dominitz &Manski 1997): “Now we would like you to think about the percent chance that different things may happen toprices in general during the next 12months. The percent chance canbe thought of as the number of chances out of 100.You canuse any number between 0 and 100. For example, numbers like: 2 and 5 percent may be ‘almost no chance,’ 20 percent or somaymean ‘notmuch chance,’ a 45 or 55 percent chancemay be a ‘pretty even chance,’ 80 percent or somaymean a ‘very goodchance,’ and a 95 or 98 percent chancemay be ‘almost certain.’”Underneath the question, it states “Please note: The numbersneed to add up to 100 percent.” Respondents who nevertheless give answers that do not add up to 100 percent receive thenotice“Your total adds up to [x%]. Please go back and change the numbers in the table so they add up to 100 percent or choosenext to continue.”
284 Armantier et al.
Ann
u. R
ev. E
con.
201
3.5:
273-
301.
Dow
nloa
ded
from
ww
w.a
nnua
lrev
iew
s.or
gby
Uni
vers
itat Z
uric
h- H
aupt
bibl
ioth
ek I
rche
l on
07/0
1/14
. For
per
sona
l use
onl
y.

sensitive than, for example, the standard deviation to small variations in the tails of the estimateddensity.
We first fielded this question in a one-time Internet survey (referred to as the special surveybelow) to examine its properties and found respondents to be willing and able to report prob-abilistic responses. Since then, we have also fielded it in our ongoing experimental panel surveyof consumers. As described in Bruine de Bruin et al. (2011a), the response rates were close to100%, as reported on the special and panel surveys. Only approximately 1% of respondentsprovided assessments that did not add up to 100%. These response patternsmay be attributed inpart to specific features of our surveys, which ask respondents to return to a question after theytry to skip it and notify respondents if their assigned probabilities do not add up to 100%. If so,these findings suggest that with a little encouragement, probabilistic questions about futureinflation are likely to have high response rates and a high proportion of respondents givingresponses that add up to 100%.
Table 1 presents various measures suggesting that, when given the opportunity, mostrespondents choose to express uncertainty in their density forecasts. The proportion of re-spondents who put positive probability mass in more than one bin is very high for the prob-abilistic version of the question regarding prices in general: 96% in the special survey (conductedat a time when median expectations were relatively high) and approximately 89% in the panelsurveys (conductedwhenmedian expectations varied). The average number of binswith positiveprobability is also quite high: 4.8 for the special survey and 3.8 for the panel surveys. Thus it isnot the case that respondents concentrate all probability mass in one or two bins—rather, theymake full use of the possibility of expressing more spread-out beliefs about future inflationoutcomes. Furthermore, the fraction of respondents who put positive mass in noncontiguousbins is very low, ranging from1.3% in the special survey to 1.6% in the panel surveys. Generally,Bruine de Bruin et al. (2011a) find that the resulting forecast histograms can be approximatedreasonably well by our parametric specifications, which assume probabilistic beliefs to beunimodal.
Table 1 Qualitative features of responses to probabilistic questions
Special survey Panel surveys
Response rate 98.80% 99.60%
Percent chance response does not add to 100% 1.10% 0.90%
Proportion with positive probability in more thanone bin
96.40% 89.40%
Average number of bins with positive probability 4.76 3.83
Median uncertainty (IQR) 2.79 2.43
Proportion with positive probability on noncontiguous bins 1.30% 1.60%
Proportion with range response 42.90% 28.90%
Correlation between range use and uncertainty 0.11�� 0.05��
Correlation between range use and number of nonzero bins 0.09� 0.04�
Correlation between range size and uncertainty 0.58�� 0.49��
All reported correlations are Spearman rank correlations. �� and � indicate significance at the 5% and 10% levels, respectively.Abbreviation: IQR, interquartile range.
285www.annualreviews.org � Measuring Inflation Expectations
Ann
u. R
ev. E
con.
201
3.5:
273-
301.
Dow
nloa
ded
from
ww
w.a
nnua
lrev
iew
s.or
gby
Uni
vers
itat Z
uric
h- H
aupt
bibl
ioth
ek I
rche
l on
07/0
1/14
. For
per
sona
l use
onl
y.

Finally, responses to the probabilistic questions appear reliable, as seen in significant cor-relations with other measures of uncertainty. Even though the question regarding the pointforecast specifically asks for a number, between 30% and 40% of all respondents initially gavea range for expected price inflation (Table 1).9 This use of ranges is positively correlated to boththe uncertainty expressed in individuals’ density forecasts and to the number of bins that receivea positive probability mass in the probabilistic price inflation question. Furthermore, thecorrelation between the width of the range reported and individual uncertainty is stronglypositive (0.49 in the panel, 0.58 in the special survey).
With regard to the measures of central tendency that can be computed from density forecasts,we find that point forecasts are highly correlated with both the medians and means of individualdensities, and their average values are quite similar, again suggesting the reliability of measure-ments obtained from probabilistic questions. We also find a systematic relationship betweenmeasures of central tendency and those of forecast uncertainty, with higher point forecasts as-sociatedwith larger forecast uncertainty. These results are in line with the finding that members ofsome demographic groups and individuals with higher financial literacy report higher pointforecasts and more forecast uncertainty (see Bruine de Bruin et al. 2010). Table 2 further showsthat the positive association between point forecasts and individual forecast uncertainty is robust,holding across surveys, and for the various measures of central tendency (point forecasts, densitymedians, andmeans). Similar positive associations, reported by Bruine de Bruin et al. (2011a), arealso obtained for expectations for wage inflation.
We also find interesting dynamic associations between uncertainty and point forecasts, andin the evolution of forecast uncertainty over time. Exploiting the longitudinal structure of ourpanel survey data, we ran regressions relating individual forecast uncertainty in period t anduncertainty in period t� 1. The regression results indicate that uncertainty at time t is positivelyassociated with uncertainty in the previous period, even after controlling for individualattributes, such as demographic characteristics. However, the introduction of individual un-observed heterogeneity in the form of random effects captures this persistence almost entirely.Thus the persistence in individual forecast uncertainty seems to be explained by permanent time-invariant idiosyncratic differences across individuals. In addition, we ran a number of regres-sions to examine the relationship between uncertainty in period t � 1 and subsequent (absolute)changes in point forecasts between period t � 1 and t. We find that higher uncertainty in oneperiod is associated with larger absolute revisions in point forecasts from that period to the next,even after controlling for individual random effects, a finding that is consistent with Bayesianupdating.
4. FORMATION AND UPDATING OF INFLATION EXPECTATIONS
As noted above, inflation expectations are central to modern monetary policy, and managingconsumers’ inflation expectations has become one of the main goals of central banks (Bernanke2004). However, managing inflation expectations requires not just monitoring expectations,but also understanding how these expectations are formed and revised in response to newinformation. Several models have been proposed to explain the cross-sectional variation in
9This includes individuals who reported both a range and a point forecast. In the special survey, more than half of theserespondents initially reported only a range. Range responses are also common in the Michigan Survey. In that survey, aswell as ours, those who initially provide a range as an answer are subsequently asked to report their best guess as a pointforecast.
286 Armantier et al.
Ann
u. R
ev. E
con.
201
3.5:
273-
301.
Dow
nloa
ded
from
ww
w.a
nnua
lrev
iew
s.or
gby
Uni
vers
itat Z
uric
h- H
aupt
bibl
ioth
ek I
rche
l on
07/0
1/14
. For
per
sona
l use
onl
y.

consumers’ inflation expectations,10 but there is little direct evidence on how individual con-sumers form their inflation expectations. With few exceptions (see Anderson 2008, Madeira &Zafar 2012, Pfajfar & Santoro 2008, Souleles 2004), previous work has analyzed the aggregateevolution of beliefs and has not studied the actual updating at the individual consumer level,which leads to ambiguous interpretations of the findings of previous work on learning inexpectation updating.
InArmantier et al. (2012b), we present direct empirical evidence on how individual consumersuse new information in forming their inflation expectations. In early 2011, we conducted aninformation-based experiment embedded in an online survey, in which we randomly provideda subset of 667 respondentswith information about either past-year average foodprice inflation orprofessional economists’ median forecast of year-ahead inflation; in addition, another subset ofrespondents did not receive any information (the control group). Before this subset of respondentsreceived this information, andagain some time after this subset received this information,we askedall respondents for their expectations of future year-ahead inflation. This experimental design thuscreates a unique panel data set that allows us to observe how this new information inducesrespondents to update their inflation expectations.11 In the discussion below, we focus mostly onthe subset of respondents who were assigned the information treatment about past-year averagefood price inflation but discuss overall results for those who received information about pro-fessional economists’ inflation forecasts as well.
If past-year food price information is relevant for inflation expectations, then we expectrespondents who, prior to receiving the selected information, are less informed about it to findthe informationmore valuable and to bemore responsive to it. Therefore, to gauge respondents’familiarity with the selected information, we asked, “Over the last twelve months, by howmuch do you think the average prices of food and beverages in the US have changed?” Therespondents who were randomly assigned to receive the selected information (the informationgroup) were then informed that food/beverage price inflation in the United States had been1.39%over the past 12months, based on data from the Bureau of Labor Statistics. Respondents
Table 2 Correlation between measures of central tendency and uncertainty [individualinterquartile range (IQR)]
Measures of central tendency of future price inflationCorrelation with uncertainty
Special survey Panel surveys
Point forecast 0.53�� 0.46��
Density median 0.47�� 0.44��
Density mean 0.53�� 0.48��
�� and � indicate significance at the 5% and 10% levels, respectively.
10All these models impose some expectation-formation processes to explain the variation in inflation expectations, forexample, some formof bounded rationality (Mankiw&Reis 2002, Sargent 1993), adaptive learning (Orphanides&Williams2006), switching between different prediction rules (Branch 2007), time-dependent rules under which expectations areupdated only at fixed intervals (Carroll 2003), and learning from experience (Malmendier & Nagel 2009).11Compared to existing studies, our approach differs in that we (a) do not make assumptions about the respondent’sinformation set, (b) do not impose any particular learning or information-processing rule to explain the heterogeneity inexpectations, and (c) can directly infer the causal effects of different types of inflation-relevant information on expectationupdating.
287www.annualreviews.org � Measuring Inflation Expectations
Ann
u. R
ev. E
con.
201
3.5:
273-
301.
Dow
nloa
ded
from
ww
w.a
nnua
lrev
iew
s.or
gby
Uni
vers
itat Z
uric
h- H
aupt
bibl
ioth
ek I
rche
l on
07/0
1/14
. For
per
sona
l use
onl
y.

in the control group did not receive this information. We measure respondents’ perception gapas the difference between the objective information value (1.39%) and respondents’ priorbeliefs; a negative perception gap corresponds to overestimation of past food/beverage priceinflation. We find that the average perception gap in our sample is �4.92 percentage points(meaning that respondents report past food/beverage price inflation on average to be 6.39%). Infact, nearly 40%of our respondents believe past-year food and beverage price inflationwas 7%or more, when in fact the published measure was only 1.39% and has not risen as high as 7%since 1981.
If the selected information is useful for respondents in forming inflation expectations, andrespondents find the information to be reliable, we would expect our information treatment tohave a causal impact on inflation expectations in the information group, especially for respondentswith high perception gaps. More specifically, revisions in inflation expectations should be posi-tively related to perception gaps,12 and the larger the perception gap, the larger should be therevision in inflation expectations. Meanwhile, there should be no systematic relationship be-tween revisions and perception gaps for the control group. Figures 8 and 9 test for these expectedpatterns by showing the mean revisions in inflation expectations by respondents’ perception gapdecile. Our experiment used two different question wordings to elicit inflation expectations:We randomly asked half of our respondents for their expectations of overall inflation (the “rate ofinflation”), while we asked the other half for the expectations of their own-basket inflation (the“prices of things you usually spend money on”/“prices you pay”).13
In Figure 8a, which shows data for prices-you-pay respondents, we observe the expectedpositive relationship between perception gaps and revisions for the information group.One can seethat all the data points fall in a shaded quadrant; that is, mean revisions are in fact negative fornegative perception gaps, and there is a clear positive relationship between mean revisions andperception gaps (the line depicting the relationship between the data is upward sloping and lies inthe shaded quadrants). This is, however, not the case for the no-information control group shown inFigure 8b: All data points do not lie in the shaded quadrants, and the relationship between meanrevisions and perception gaps is not statistically different from zero. Instead, in Figure 9, whichshows data for the rate-of-inflation respondents, the relationship between revisions of overallinflation (rate-of-inflation) expectations and the perception gap is flat for both the informationand control groups. In other words, information about past food/beverage prices does not lead torevisions in expectations about the year-ahead rate of inflation.14 For the subset of respondentsassigned to the experts’ forecast treatment—results of which are discussed in detail in Armantieret al. (2012b)—we find that information about experts’ forecasts of overall inflation causesconsumers to update primarily their expectations for the rate of inflation but not own-basketinflation expectations.
12That is, respondents who overestimate food/beverage price inflation (those with negative perception gaps) shouldrevise inflation expectations downward, and the converse should be observed for respondents with positive perceptiongaps.13The question regarding the prices you pay is similar to the one used in theMichigan Survey. TheMichigan Survey questionasks about prices in general, and as discussed above, Bruine de Bruin et al. (2012) find that it often tends to be interpreted byrespondents as asking about prices that they are paying.14The greater response of own-basket inflation (prices-you-pay) expectations to food price information, relative to overallinflation (rate-of-inflation) expectations, may be a consequence of (a) food price changes being perceived to have morerelevance for consumers’ own-basket inflation rate than for the CPI, (b) consumers having biased perceptions about the shareof food expenditures in their budget, or (c) consumers focusing on specific salient price changeswhen considering the change inprices rather than inflation (Bruine de Bruin et al. 2012).
288 Armantier et al.
Ann
u. R
ev. E
con.
201
3.5:
273-
301.
Dow
nloa
ded
from
ww
w.a
nnua
lrev
iew
s.or
gby
Uni
vers
itat Z
uric
h- H
aupt
bibl
ioth
ek I
rche
l on
07/0
1/14
. For
per
sona
l use
onl
y.

These results indicate that consumers incorporate heterogeneous information in forming andupdating their inflation expectations—forecasts of experts in the case of overall inflation, and pastfood prices in the case of own-basket inflation—and that providing such information inducesconsumers to revise their expectations sensibly. In addition, our finding that information about pastfood price inflation has limited pass-through to consumers’ expectations of the rate of inflationsuggests that the question regarding the rate of inflation (and not the question regarding the prices youpay) is a more stable survey question, in the sense that it is less susceptible to volatile price changes.
We find substantial heterogeneity by demographics in expectation updating: Female, low-income, low-education, and low–financial literacy respondents are more responsive to the in-formation treatments relative to their counterparts. These results are important for inflationexpectations survey data in general. Previous research shows that the same demographic groups—female, older, low-education, and low–financial literacy respondents—more often report inflationexpectations in the right tail of the population distribution of inflation expectations (seeBlanchflower & Coille 2009, Bruine de Bruin et al. 2010, Bryan & Venkatu 2001, Jonung 1981,Lombardelli & Saleheen 2003). We replicate these results: The first row in Table 3 shows thatthese demographic groups report higher prices-you-pay expectations at the baseline, whereas thesecond row shows that the same demographic groups have greater uncertainty about futureinflation, and the third row shows that themean perception gaps aremuch larger for these groups.For example, respondents without a four-year college degree have a mean perception gap of�6.3(that is, the overprediction of past food/beverage price changes by 6.3 percentage points) com-pared with �3.6 for college-graduate respondents; however, non-college-educated respondentsare also much more responsive to the information.
Similar patterns hold by gender, income, and age such that these groups’ inflation expectationsconverge across demographic groups after the information treatment. Thuswe offer an alternativeexplanation for the systematically high inflation expectations of certain demographic groups byidentifying a relative gap in their own information sets about objective inflation measures. Thissuggests a potential role for policies that incorporate public information campaigns to effectivelycontrol the high-expectation right tail of the public’s inflation expectations distribution. Becausekeeping consumers’ inflation expectations anchored is generally important for controlling in-flation (Bernanke 2007), public information campaigns about past and current inflationmay havea role in prudent monetary policy: The findings in Armantier et al. (2012b) suggest that such
876543210
–1–2–3–4–5–6
PP × food information group
Revi
sion
PP × food control group
Perception gap Perception gap–20 –15 –10 –5 0 5 –20 –15 –10 –5 0 5
876543210
–1–2–3–4–5–6
a b
Figure 8
Relationship between revisions of “prices you pay” (PP) inflation expectations and the perception gap. Each point in the figures shows themean revision by perception gap decile (because deciles overlap, there are fewer than 10 points).
289www.annualreviews.org � Measuring Inflation Expectations
Ann
u. R
ev. E
con.
201
3.5:
273-
301.
Dow
nloa
ded
from
ww
w.a
nnua
lrev
iew
s.or
gby
Uni
vers
itat Z
uric
h- H
aupt
bibl
ioth
ek I
rche
l on
07/0
1/14
. For
per
sona
l use
onl
y.

information dissemination may lead to more informed and reliable reporting of inflationexpectations by consumers.
5. INFLATION EXPECTATIONS AND BEHAVIOR: DO SURVEYRESPONDENTS ACT ON THEIR BELIEFS?
Although inflation expectations surveys of consumers are now routinely conducted worldwideand used by central bankers and academic researchers, two questions have been left essentiallyunanswered. First, to what extent are responses to these surveys informative about the respond-ents’ true beliefs? As discussed in Section 1, it is often argued that, because of the absence of directfinancial incentives, surveys may suffer from a cheap-talk problem. Second, do consumers reallyact on their inflation beliefs? Although most modern macroeconomic models rest on this as-sumption (Gali 2008, Sims 2009,Woodford 2005), because householdsmay facemore significantrisks (related, e.g., to employment or health), future inflation prospects may not be sufficientlysalient to influence consumers’ behavior.
To address these two questions, in Armantier et al. (2012a) we compare the behavior ofconsumers in a financially incentivized investment experimentwith the beliefs they self-report in aninflation expectations survey.We can then gauge the information content of the survey by studyinghow the inflation expectations the consumers report correlate with their decisions in the in-vestment experiment. Furthermore, we can conduct a simple, yet formal, test of the microfoundations of macro theory, by examining the extent to which inflation expectations and ex-perimental decisions comply with expected utility theory.
The survey was conducted over the Internet with Rand’s American Life Panel. It was fieldedtwicewith the same respondents in July 2010 and January 2011. In total, 771 and734 respondentsparticipated in the first and second survey, respectively. In the survey, the respondents first hadto answer an inflation expectations question of the form, “Over the next 12 months, I expect therate of inflation to be ___% OR the rate of deflation (the opposite of inflation) to be ___%.”
Then the respondents took part in an experiment consisting of 10 questions. For each question,the respondent was asked to choose between two investments: investment A and investment B.Each investment produces a specific revenue payable 12 months later. Investment B producesa fixed dollar amount, whereas investment A is indexed on future inflation. More specifically, the
RI × food information group RI × food control group6543210
–1–2–3–4–5–6
Revi
sion
Perception gap Perception gap–20 –15 –10 –5 0 5 –20 –15 –10 –5 0 5
6543210
–1–2–3–4–5–6
a b
Figure 9
Relationship between revisions of “rate of inflation” (RI) inflation expectations and the perception gap. Eachpoint in the figures shows the mean revision by perception gap decile (because deciles overlap, there are fewerthan 10 points).
290 Armantier et al.
Ann
u. R
ev. E
con.
201
3.5:
273-
301.
Dow
nloa
ded
from
ww
w.a
nnua
lrev
iew
s.or
gby
Uni
vers
itat Z
uric
h- H
aupt
bibl
ioth
ek I
rche
l on
07/0
1/14
. For
per
sona
l use
onl
y.
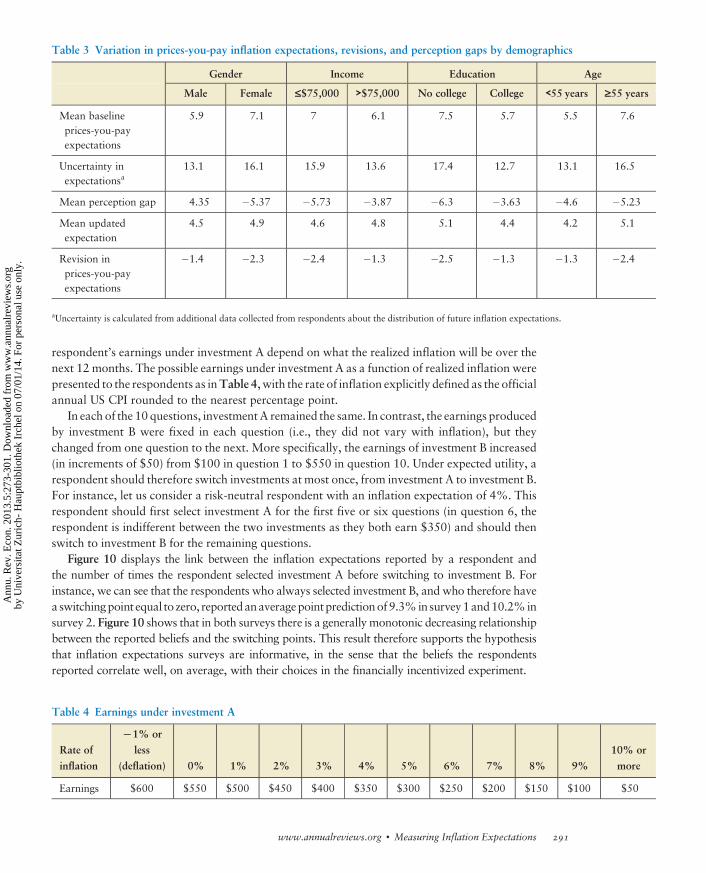
respondent’s earnings under investment A depend on what the realized inflation will be over thenext 12 months. The possible earnings under investment A as a function of realized inflation werepresented to the respondents as inTable 4, with the rate of inflation explicitly defined as the officialannual US CPI rounded to the nearest percentage point.
In each of the 10questions, investmentA remained the same. In contrast, the earnings producedby investment B were fixed in each question (i.e., they did not vary with inflation), but theychanged from one question to the next. More specifically, the earnings of investment B increased(in increments of $50) from $100 in question 1 to $550 in question 10. Under expected utility, arespondent should therefore switch investments at most once, from investment A to investment B.For instance, let us consider a risk-neutral respondent with an inflation expectation of 4%. Thisrespondent should first select investment A for the first five or six questions (in question 6, therespondent is indifferent between the two investments as they both earn $350) and should thenswitch to investment B for the remaining questions.
Figure 10 displays the link between the inflation expectations reported by a respondent andthe number of times the respondent selected investment A before switching to investment B. Forinstance, we can see that the respondents who always selected investment B, and who therefore havea switchingpoint equal to zero, reportedanaveragepointpredictionof9.3%insurvey1and10.2%insurvey 2. Figure 10 shows that in both surveys there is a generally monotonic decreasing relationshipbetween the reported beliefs and the switching points. This result therefore supports the hypothesisthat inflation expectations surveys are informative, in the sense that the beliefs the respondentsreported correlate well, on average, with their choices in the financially incentivized experiment.
Table 3 Variation in prices-you-pay inflation expectations, revisions, and perception gaps by demographics
Gender Income Education Age
Male Female £$75,000 >$75,000 No college College <55 years ‡55 years
Mean baselineprices-you-payexpectations
5.9 7.1 7 6.1 7.5 5.7 5.5 7.6
Uncertainty inexpectationsa
13.1 16.1 15.9 13.6 17.4 12.7 13.1 16.5
Mean perception gap 4.35 �5.37 �5.73 �3.87 �6.3 �3.63 �4.6 �5.23
Mean updatedexpectation
4.5 4.9 4.6 4.8 5.1 4.4 4.2 5.1
Revision inprices-you-payexpectations
�1.4 �2.3 �2.4 �1.3 �2.5 �1.3 �1.3 �2.4
aUncertainty is calculated from additional data collected from respondents about the distribution of future inflation expectations.
Table 4 Earnings under investment A
Rate of
inflation
L1% or
less
(deflation) 0% 1% 2% 3% 4% 5% 6% 7% 8% 9%
10% or
more
Earnings $600 $550 $500 $450 $400 $350 $300 $250 $200 $150 $100 $50
291www.annualreviews.org � Measuring Inflation Expectations
Ann
u. R
ev. E
con.
201
3.5:
273-
301.
Dow
nloa
ded
from
ww
w.a
nnua
lrev
iew
s.or
gby
Uni
vers
itat Z
uric
h- H
aupt
bibl
ioth
ek I
rche
l on
07/0
1/14
. For
per
sona
l use
onl
y.
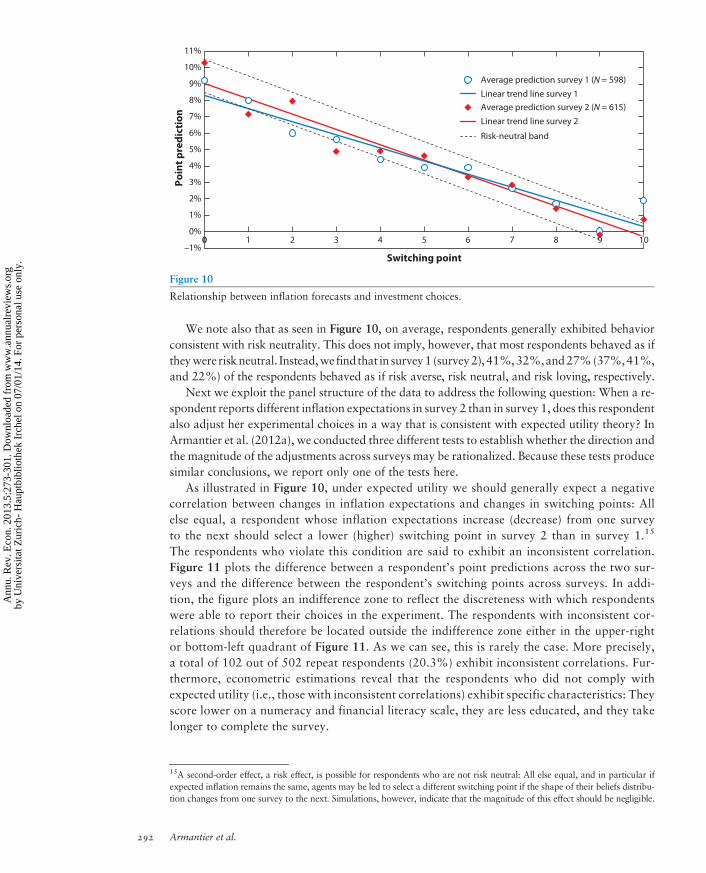
We note also that as seen in Figure 10, on average, respondents generally exhibited behaviorconsistent with risk neutrality. This does not imply, however, that most respondents behaved as iftheywere riskneutral. Instead,we find that in survey1 (survey2), 41%,32%,and27%(37%,41%,and 22%) of the respondents behaved as if risk averse, risk neutral, and risk loving, respectively.
Next we exploit the panel structure of the data to address the following question: When a re-spondent reports different inflation expectations in survey 2 than in survey 1, does this respondentalso adjust her experimental choices in a way that is consistent with expected utility theory? InArmantier et al. (2012a), we conducted three different tests to establish whether the direction andthe magnitude of the adjustments across surveys may be rationalized. Because these tests producesimilar conclusions, we report only one of the tests here.
As illustrated in Figure 10, under expected utility we should generally expect a negativecorrelation between changes in inflation expectations and changes in switching points: Allelse equal, a respondent whose inflation expectations increase (decrease) from one surveyto the next should select a lower (higher) switching point in survey 2 than in survey 1.15
The respondents who violate this condition are said to exhibit an inconsistent correlation.Figure 11 plots the difference between a respondent’s point predictions across the two sur-veys and the difference between the respondent’s switching points across surveys. In addi-tion, the figure plots an indifference zone to reflect the discreteness with which respondentswere able to report their choices in the experiment. The respondents with inconsistent cor-relations should therefore be located outside the indifference zone either in the upper-rightor bottom-left quadrant of Figure 11. As we can see, this is rarely the case. More precisely,a total of 102 out of 502 repeat respondents (20.3%) exhibit inconsistent correlations. Fur-thermore, econometric estimations reveal that the respondents who did not comply withexpected utility (i.e., those with inconsistent correlations) exhibit specific characteristics: Theyscore lower on a numeracy and financial literacy scale, they are less educated, and they takelonger to complete the survey.
–1%
0%
1%
2%
3%
4%
5%
6%
7%
8%
9%
10%
11%
00 1 2 3 4 5 6 7 8 9 101010
Poin
t pre
dict
ion
Switching point
Average prediction survey 1 (N = 598)
Average prediction survey 2 (N = 615)
Risk-neutral band
Linear trend line survey 1
Linear trend line survey 2
Figure 10
Relationship between inflation forecasts and investment choices.
15A second-order effect, a risk effect, is possible for respondents who are not risk neutral: All else equal, and in particular ifexpected inflation remains the same, agents may be led to select a different switching point if the shape of their beliefs distribu-tion changes from one survey to the next. Simulations, however, indicate that the magnitude of this effect should be negligible.
292 Armantier et al.
Ann
u. R
ev. E
con.
201
3.5:
273-
301.
Dow
nloa
ded
from
ww
w.a
nnua
lrev
iew
s.or
gby
Uni
vers
itat Z
uric
h- H
aupt
bibl
ioth
ek I
rche
l on
07/0
1/14
. For
per
sona
l use
onl
y.

The results inArmantier et al. (2012a) therefore confirm that our inflation expectations surveyis informative in the sense that the beliefs reported by the respondents are correlated with theirchoices in the experiment. Perhaps more importantly, by showing that respondents generally acton their stated inflation beliefs in a way consistent with expected utility theory, our results providesome evidence to support one of the key assumptions underlyingmacroeconomicmodels wherebyforward-looking agents make economic decisions that are influenced by their beliefs about futureinflation. Finally, our finding that consumerswith lownumeracy and low financial literacy are lesslikely to act on their reported beliefs in accordance with expected utility theory is particularlyrelevant in the context of the rapidly growing literature on the role of numeracy and financialliteracy in economic decisions. In particular, by identifying a breakdown of the connection be-tween beliefs and actions, our results suggest a specific channel through which financial literacyaffects economic behavior.
6. ADDITIONALMEASURES: DIFFERENT TIME HORIZONS, HOME PRICES,AND WAGE GROWTH
As emphasized above, anchoring long-term inflation expectations is crucial for monetary policy.In the Michigan Survey, information on long-term inflation expectations is generated by a ques-tion asking about “the change in prices in general over the next 5 to 10 years.” Our initial ex-ploratorywork confirmed thatmany householdswere confused by thiswordingwith regard to theactual horizon they were asked to think about, and whether they were asked to report an averageor some other summary statistic over the time period (see van der Klaauw et al. 2008, p. 38). Asshown in Figure 12, the Michigan Survey question also contains various challenges to therespondents if they report inflation expectations above 5%: It appears that small changes in these
–10–10
1010
–30–30 3030
–10
–5
5
00
5
10
–30 –20 –10 00 10 20 30
Prediction difference
Switching-pointdifference
Indifference zone
54 Inconsistent correlationsare in this quadrant
48 Inconsistent correlationsare in this quadrant
Figure 11
Relationship between revisions in inflation forecasts and revisions in investment choices. The area of eachbubble reflects the number of respondents at that point.
293www.annualreviews.org � Measuring Inflation Expectations
Ann
u. R
ev. E
con.
201
3.5:
273-
301.
Dow
nloa
ded
from
ww
w.a
nnua
lrev
iew
s.or
gby
Uni
vers
itat Z
uric
h- H
aupt
bibl
ioth
ek I
rche
l on
07/0
1/14
. For
per
sona
l use
onl
y.

challenges could lower the median response by a significant margin. Furthermore, asking aboutthe rate of inflation directly produced answers more consistent with the concept of the forwardinflation expectations of interest to central banks.
Rather than replicating the Michigan long-term inflation expectations question replacing“prices in general” with the “rate of inflation,” we decided to work with a medium-term explicithorizon (three years) and use only a probabilistic version of the question. We chose this timehorizon to let respondents focus on a time frame that is salient to them,while being less sensitive tocyclical fluctuations. For example, in themost recent fielding of our survey, the panelwas asked thefollowing:
Nowwewould like you to think of inflation 3 years from now. In your view, what would you say is
the percent chance that the following thingsmayhappenover the one-year periodbetween July 2014
and July 2015?
(Please note: Numbers need to add up to 100%.)
The rate of:
Inflation will be 12% or higher _____ percent chance
Inflation will be between 8% and 12% _____ percent chance
Inflation will be between 4% and 8% _____ percent chance
Inflation will be between 2% and 4% _____ percent chance
Inflation will be between 0% and 2% _____ percent chance
Deflation will be between 0% and 2% _____ percent chance
Deflation will be between 2% and 4% _____ percent chance
Deflation will be 4% or higher _____ percent chance
100% total.
What about the outlook for prices over thenext 5 to 10 years? Do you think prices ingeneral will be higher, about the same,
or lower, 5 to 10 years from now?
Lower Higher
By about what percent peryear do you expect pricesto go down, on average,
during the next 5 to 10 years?
By about what percent peryear do you expect prices
to go up, on average,during the next 5 to 10 years?
Same
Do you mean that prices will go up at the same rate
as now or that prices ingeneral will not go up
during the next 5 to 10 years?
Will not go up Will go up at same rate
Greater than 5% Greater than 5%
Yes NoNo Yes
Would that be [x%] per year,or is that the total for pricesover the next 5 to 10 years?
Would that be [x%] per year,or is that the total for pricesover the next 5 to 10 years?
Per yearTotalTotalPer year
About what percent peryear would that be?
About what percent peryear would that be?
Figure 12
Structure of the Michigan Survey’s long-term inflation expectations question.
294 Armantier et al.
Ann
u. R
ev. E
con.
201
3.5:
273-
301.
Dow
nloa
ded
from
ww
w.a
nnua
lrev
iew
s.or
gby
Uni
vers
itat Z
uric
h- H
aupt
bibl
ioth
ek I
rche
l on
07/0
1/14
. For
per
sona
l use
onl
y.

We have been fielding the medium-term inflation expectations question in our experimentalpanel since spring 2008. Figure 13 compares the time series at the one- and three-year horizon:Medium-term inflation expectations tend to be more stable than short-term ones over the sampleperiod.
As a complement to our attempt to improve the measurement of household inflation expect-ations, we have also been investigating expectations about future house-price appreciation andabout wage-earnings growth. House-price expectations are likely to be an important determinantof household behaviorwith regard tomortgage default and homebuying.Figure 14 plots quartilesof responses for the expected change in average home prices one year ahead separately by incomegroup.Median expectations dropped significantly in fall 2010 and evenmore acutely in fall 2011,especially for low-income households, but have since recovered for all income groups. Withapproximately one-quarter of mortgage holders being under water during the past few years, anincrease in the proportion of households expecting large declines in home prices was of someconcern.
Because firms and workers may negotiate changes in wages to be in line with their ex-pected rate of inflation, data on wage expectations are an additional information source foranalyzing inflation dynamics and the interaction between wage and price determination. Fur-thermore, discrepancies between expected changes in wages and expected inflation may affecthouseholds’ financial decisions. Despite the obvious importance of wage expectations, in-formation on wage expectations is particularly scarce. In formulating a question on wageexpectations, we needed to pose a hypothetical situation to gain information of direct relevanceto inflation.
Accordingly, we first asked individuals who reported to be working for pay how many jobsthey had. We then informed them that in some subsequent questions we would ask about theirmain job, which we defined to be the job at which they usually work the most hours. We thenasked,
Perc
ent
11
12
10
9
8
7
6
5
4
3
2
1
0May08
Aug08
Nov08
Feb09
May09
Aug09
Nov09
Feb10
May10
Aug10
Nov10
Feb11
May11
Aug11
Nov11
Feb12
May12
25th percentile
75th percentileThree-year-ahead
rate of inflation
One-year-ahead
rate of inflation
Figure 13
Trends inmedians of individual (25th, 50th, and 75th) quartiles of one-year- and three-year-ahead forecasts ofthe rate of inflation. Data from the Federal Reserve Bank of New York and the American Life Panel.
295www.annualreviews.org � Measuring Inflation Expectations
Ann
u. R
ev. E
con.
201
3.5:
273-
301.
Dow
nloa
ded
from
ww
w.a
nnua
lrev
iew
s.or
gby
Uni
vers
itat Z
uric
h- H
aupt
bibl
ioth
ek I
rche
l on
07/0
1/14
. For
per
sona
l use
onl
y.

Suppose that, 12months from now, you actually are working in the exact same [MAIN] job at the
same place you currently work, and working the exact same number of hours. Twelve months
from now, do you expect your earnings on this job, before taxes and deductions, to have gone up,
or gone down, or stayed where they are now?
For those who said gone up or gone down we then asked,
By about what percent do you expect that your earnings on this job, before taxes and other
deductions, will have gone [UP/DOWN], 12 months from now, if you actually are working in the
exact same job at the same place you currently work, andworking the exact same number of hours?
Figure 15 reports the quartiles of density medians across respondents by income. Nominalwage-growth expectations dropped significantly in fall 2008 at the height of the financial crisisand have remained within a narrow band between 1% and 2% since. Expected nominal wagegrowth tends to be slightly higher for high-income households. Figure 16 depicts year-ahead realwage-growth expectations by combining information from respondents’ wage-growth and rate-of-inflation expectations. Median real wage-growth expectations have remained in negativeterritory since we started collecting this series, ranging roughly between 0 and�2% growth. Thistype of information can be quite useful to analyze inflation dynamics as well as household finan-cial decisions, insofar as they are affected by expected real income growth.
7. CONCLUSION
The importance of accurate measurements of agents’ subjective expectations has been increas-ingly recognized in economics in a variety of areas (Manski 2004). In particular, in modernmonetary and macroeconomics, inflation expectations are considered a crucial determinantof agents’ decisions. In equilibrium, the public’s behavior determines actual inflation, thusestablishing a direct link between expected and realized inflation. Central banks recognize the
Perc
ent
12
10
8
6
4
2
0
–2
–4
–6
–8
–10
–12Sep 09
Nov09
Jan10
Mar10
May10
Jul10
Sep10
Nov10
Jan11
Mar11
May11
Jul11
Sep11
Nov11
Jan12
Mar12
May12
25th percentile
75th percentileIncome > $75K
Income < $75K
Figure 14
Quartiles (25th, 50th, and 75th) of year-ahead house-price expectations, by income groups. Data from theFederal Reserve Bank of New York and the American Life Panel.
296 Armantier et al.
Ann
u. R
ev. E
con.
201
3.5:
273-
301.
Dow
nloa
ded
from
ww
w.a
nnua
lrev
iew
s.or
gby
Uni
vers
itat Z
uric
h- H
aupt
bibl
ioth
ek I
rche
l on
07/0
1/14
. For
per
sona
l use
onl
y.

importance of this transmission mechanism and therefore devote particular attention to themeasurement of inflation expectations.
In this review we describe the findings of a large ongoing research project that aims at (a)understanding the impact of different questionwordings on themeasurement of household inflationexpectations through surveys; (b) developing new, better measures that elicit the entire probabilitydistribution that households hold over future inflation outcomes; (c) better understanding howhouseholds form and update expectations, through experiments that provide new information ina controlled setting and then measure its impact on expectations updating; and (d) documenting thelink between inflation expectations and actual behavior using a financially incentivized experiment.
We believe these are important issues, and a variety of approaches can be brought to bear toanswer them. Surveys, field experiments, and financially incentivized laboratory experiments canbe useful to further our understanding of these issues, which lie at the heart of monetary eco-nomics and of the mandate of any central bank. We believe our research has produced valuablenew insights on these issues. We have learned how to ask questions to elicit inflation expectationsthat are informative and less susceptible to various biases.We have shown that survey respondentsare willing and able to provide answers to probabilistic questions, with responses having internalconsistency and measurement reliability. Consumers exhibit some sophistication with respectto inflation expectations as they generally update their beliefs sensibly when provided with in-formation. Moreover, there is experimental evidence that consumers act on their inflation beliefsin a way that may be rationalized.
Going forward, we plan to focus on three main areas of research. First, a better un-derstanding of the properties of subjective belief distributions and their relationship withreported point forecasts (and the persistence of that relationship) is needed. Although densityforecasts reveal more information than that captured in a simple point forecast, the implicationsfor aggregate trends based on density and point forecasts require additional exploration. Fur-ther research is needed to figure out whichmeasure of central tendency (point forecast or densitymean/median) best captures changes in overall expectations and which measure matters for
–2
–1
0
1
2
3
4
5
6
7
8
Jun08
Sep08
Dec08
Mar09
Jun09
Sep09
Dec09
Mar10
Jun10
Sep10
Dec10
Mar11
Jun11
Sep11
Dec11
Mar12
Jun12
Income < $75K
Income > $75K 25th percentile
75th percentile
Perc
ent
Figure 15
Quartiles (25th, 50th, and 75th) of year-ahead wage-growth expectations, by income groups. Data from theFederal Reserve Bank of New York and the American Life Panel.
297www.annualreviews.org � Measuring Inflation Expectations
Ann
u. R
ev. E
con.
201
3.5:
273-
301.
Dow
nloa
ded
from
ww
w.a
nnua
lrev
iew
s.or
gby
Uni
vers
itat Z
uric
h- H
aupt
bibl
ioth
ek I
rche
l on
07/0
1/14
. For
per
sona
l use
onl
y.

behavior. We also hope to examine the forecasting power derived from individual uncertainty,by analyzing both whether episodes of high uncertainty about future inflation help predict fu-ture turning points in realized inflation andwhether weighting point forecasts of future inflationby their associated uncertainty helps improve our ability to forecast future inflation. Second,understanding the formation of expectations remains an understudied area (Manski 2004). Ourfinding that, in a stylized setting, consumersmeaningfully respond to information in the revisionof their inflation expectations is just the first step in an attempt to understand expectationsformation and revisions.
Finally, establishing a link between inflation expectations and actual behavior—a key as-sumption underlying macroeconomic models—requires further investigation, and there remainstremendous value in linking expectations with the actual real-world behavior of households.Understanding the factors that may lead to the breakdown of the expected connection betweeninflation expectations and financial decisions is particularly relevant in the context of a growingliterature on the role of financial literacy and education in economic decisions (Lusardi&Mitchell2007). In our view, one promising strategy to investigate this issue further is to collect micro dataon inflation expectations as well as actual consumption, saving, and investment decisions by thesame households over time.
DISCLOSURE STATEMENT
The authors are not aware of any affiliations, memberships, funding, or financial holdings thatmight be perceived as affecting the objectivity of this review.
ACKNOWLEDGMENTS
The views expressed are those of the authors and do not necessarily reflect those of the FederalReserve Bank of New York or the Federal Reserve System. We are grateful to Chuck Manski for
Perc
ent
25th percentile
75th percentile
–6
–5
–4
–3
–2
–1
0
1
2
3
May08
Aug08
Nov08
Feb09
May09
Aug09
Nov09
Feb10
May10
Aug10
Nov10
Feb11
May11
Aug11
Nov11
Feb12
May12
Figure 16
Quartiles (25th, 50th, and 75th) of year-ahead real wage-growth expectations. Data from the Federal ReserveBank of New York and the American Life Panel.
298 Armantier et al.
Ann
u. R
ev. E
con.
201
3.5:
273-
301.
Dow
nloa
ded
from
ww
w.a
nnua
lrev
iew
s.or
gby
Uni
vers
itat Z
uric
h- H
aupt
bibl
ioth
ek I
rche
l on
07/0
1/14
. For
per
sona
l use
onl
y.

his many insightful and encouraging comments. We also thank Charles Bellemare, RichardBlundell, Michael Bryan, Jeff Dominitz, Julie Downs, Baruch Fischhoff, Jordi Gali, Charlie Holt,Eric Johnson, Arthur Kennickell, Rosemarie Nagel, Athanasios Orphanides, OnurOzgur, RobertRich, and Ken Wolpin for their advice on this project, as well as Sandy Chien, Tim Colvin, PeterFielding, Daniel Forman, Daniel Greenwald, Tanya Gutsche, Mandy Holbrook, Scott Nelson,and Bas Weerman for their help with conducting the research.
LITERATURE CITED
Adam K, Padula M. 2011. Inflation dynamics and subjective expectations in the United States. Econ. Inq.49:13–25
Anderson R. 2008. US consumer inflation expectations: evidence regarding learning, accuracy and de-mographics. Discuss. Pap. 099, Cent. Growth Bus. Cycle Res., Univ. Manchester, Manchester, UK
Anderson R, Becker R, Osborn D. 2010. Heterogeneity in consumers’ learning about inflation. Work. Pap.2010/02, Newcastle Univ., Newcastle, UK
Ang A, Bekaert G, Wei M. 2007. Do macro variables, asset markets or surveys forecast inflation better?J. Monet. Econ. 54:1163–212
Armantier O, Bruine de Bruin W, Topa G, van der Klaauw W, Zafar B. 2012a. Inflation expectations andbehavior: Do survey respondents act on their beliefs? Work. Pap., Fed. Reserve Bank New York, NewYork
Armantier O, Nelson S, Topa G, van der KlaauwW, Zafar B. 2012b. The price is right: updating of inflationexpectations in a randomized price information experiment. StaffRep. 543, Fed.Reserve BankNewYork,New York
Badarinza C, Buchmann M. 2009. Inflation perceptions and expectations in the euro area: the role of news.Work. Pap. 1088/2009, Eur. Central Bank, Frankfurt
Barnett A, Mumtaz H, Paustian M, Pezzini S. 2010. Household inflation expectations in the UK: exploitingthe cross-sectional dimension. Unpublished manuscript, Bank Engl., London
Bernanke B. 2004.The economic outlook andmonetary policy. Presented at BondMark. Assoc. Annu.Meet.,New York
Bernanke B. 2007. Inflation expectations and inflation forecasting. Presented at Monet. Econ. Workshop,Natl. Bur. Econ. Res. Summer Inst., Cambridge, MA
Blanchflower D, Coille C. 2009. The formation of inflation expectations: an empirical analysis for the U.K.Paper presented at Banco Bras. X1 Annu. Inflat. Target. Semin., Rio de Janeiro
Brachinger H. 2008. A new index of perceived inflation: assumptions, method, and application to Germany.J. Econ. Psychol. 29:433–57
BranchW. 2007. Sticky information and model uncertainty in survey data on inflation expectations. J. Econ.Dyn. Control 31:245–76
Bruine de Bruin W. 2011. Framing effects in survey design: how respondents make sense of the questions weask. In Perspectives on Framing, ed. G Keren, pp. 303–24. London: Taylor & Francis
Bruine de BruinW, BostromA. 2013.How to find out what information to address in science communication:an introduction for scientific experts. Proc. Natl. Acad. Sci. USA. In press
Bruine de Bruin W, Manski CF, van der KlaauwW, Topa G. 2011a. Measuring consumer uncertainty aboutfuture inflation. J. Appl. Econ. 26:454–78
Bruine de Bruin W, van der Klaauw W, Downs JS, Fischhoff B, Topa G, Armantier O. 2010. Expectationsof inflation: the role of financial literacy and demographic variables. J. Consum. Aff. 44:381–402
Bruine de Bruin W, van der KlaauwW, Topa G. 2011b. Inflation expectations: the biasing effect of thoughtsabout specific prices. J. Econ. Psychol. 32:834–45
Bruine de Bruin W, van der Klaauw W, Topa G, Downs JS, Fischhoff B, Armantier O. 2012. The effect ofquestion wording on consumers’ reported inflation expectations. J. Econ. Psychol. 4:749–57
BryanM, Venkatu G. 2001. The demographics of inflation opinion surveys. Fed. Reserve Bank Clevel. Econ.Comment. 2001(Oct.):1–4
299www.annualreviews.org � Measuring Inflation Expectations
Ann
u. R
ev. E
con.
201
3.5:
273-
301.
Dow
nloa
ded
from
ww
w.a
nnua
lrev
iew
s.or
gby
Uni
vers
itat Z
uric
h- H
aupt
bibl
ioth
ek I
rche
l on
07/0
1/14
. For
per
sona
l use
onl
y.

Carroll C. 2003. Macroeconomic expectations of households and professional forecasters. Q. J. Econ.118:269–98
Christandl F, Fetchenhauer D, Hoelzl E. 2011. Price perception and confirmation bias in the context of a VATincrease. J. Econ. Psychol. 32:131–41
Curtin R. 2006. Inflation expectations: theoretical models and empirical tests. Presented at Natl. Bank Pol.Workshop Role Inflat. Expect. Model. Monet. Policy Mak., Warsaw
Dillman DA, Smyth JD, Christian LM. 2009. Internet, Mail, and Mixed-Mode Surveys: The Tailored DesignMethod. New York: Wiley
Dominitz J, Manski C. 1997. Using expectations data to study subjective income distribution. J. Am. Stat.Assoc. 92:855–67
Ehrbeck T, Waldmann R. 1996. Why are professional forecasters biased? Agency versus behavioralexplanations. Q. J. Econ. 111:21–40
Engelberg J, Manski CF, Williams J. 2009. Comparing the point predictions and subjective probabilitydistributions of professional forecasters. J. Bus. Econ. Stat. 27:30–41
Engelberg J, Manski CF, Williams J. 2011. Assessing the temporal variation of macroeconomic forecasts bya panel of changing composition. J. Appl. Econ. 26:1059–78
Galati G, Heemeijer P, Moessner R. 2011. How do inflation expectations form? New insights from a high-frequency survey. DNB Work. Pap. 283, Res. Dep., Neth. Central Bank, Amsterdam
Gali J. 2008. Monetary Policy, Inflation and the Business Cycle: An Introduction to the New KeynesianFramework. Princeton, NJ: Princeton Univ. Press
Glaser M, Langer T, Reynders J, Weber M. 2007. Framing effects in stock market forecasts: the differencebetween asking for prices and asking for returns. Rev. Finance 11:325–57
Greitemeyer T, Schulz-Hardt S, Traut-Mattausch E, FreyD. 2005. The influence of price trend expectations onprice trend estimates: why the euro seems to make life more expensive. J. Econ. Psychol. 26:541–48
Hobijn B, TopaG,Mayer K, Stennis C. 2009.Whose inflation is it? Household level vs. aggregate measures ofinflation. Unpublished manuscript, Fed. Reserve Bank New York, New York
Hunter J. 2005. Report on cognitive testing of cohabitation questions.Rep., US Bur. Census,Washington, DCInoue A, Kilian L, Kiraz F-C. 2009. Do actions speak louder than words? Household expectations of inflation
based on micro consumption data. J. Money Credit Bank. 41:1331–63Jonung L. 1981. Perceived and expected rates of inflation in Sweden. Am. Econ. Rev. 71:961–68JungermannH,BrachingerHW,Belting J,GrinbergK,Zacharias E. 2007.The euro changeover and the factors
influencing perceived inflation. J. Consum. Policy 30:405–19Kahneman D, Tversky A. 1979. Prospect theory: an analysis of decision under risk. Econometrica 47:263–91KeaneM, Runkle D. 1990. Testing the rationality of price forecasts: new evidence from panel data.Am. Econ.
Rev. 80:714–35Leiser D, Drori S. 2005. Naïve understanding of inflation. J. Socio-Econ. 34:179–98Laster D, Bennett P, Geoum I. 1999. Rational bias in macroeconomic forecasts. Q. J. Econ. 114:293–318Lombardelli C, Saleheen J. 2003. Public expectations of UK inflation. Bank Engl. Q. Bull. 2003(3):281–90Lusardi A, Mitchell O. 2007. Financial literacy and retirement preparedness: evidence and implications for
financial education. Bus. Econ. 2007(1):35–44Madeira C, Zafar B. 2012. Heterogeneous inflation expectations, learning, and market outcomes. Staff Rep.
536, Fed. Reserve Bank New York, New YorkMalmendier U,Nagel S. 2009.Learning from inflation experiences.Work. Pap., StanfordUniv., Stanford, CAMankiw NG, Reis R. 2002. Sticky information versus sticky prices: a proposal to replace the new Keynesian
Phillips curve. Q. J. Econ. 117:1295–328Mankiw G, Reis R, Wolfers J. 2004. Disagreement about inflation expectations. In NBER Macroeconomics
Annual 2003, Vol. 18, ed. M Gertler, K Rogoff, pp. 209–70. Cambridge, MA: MIT PressManski C. 2004. Measuring expectations. Econometrica 72:1329–76Manski C. 2006. Interpreting the predictions of prediction markets. Econ. Lett. 91:425–29McGranahan L, Paulson A. 2006. Constructing the Chicago Fed Income Based Economic Index–Consumer
Price Index: inflation experiences by demographic group: 1983–2005. Work. Pap. WP2005-20, Fed.Reserve Bank Chicago
300 Armantier et al.
Ann
u. R
ev. E
con.
201
3.5:
273-
301.
Dow
nloa
ded
from
ww
w.a
nnua
lrev
iew
s.or
gby
Uni
vers
itat Z
uric
h- H
aupt
bibl
ioth
ek I
rche
l on
07/0
1/14
. For
per
sona
l use
onl
y.

McKenney NR, Bennett CE. 1994. Issues regarding data on race and ethnicity: the Census Bureau experience.Public Health Rep. 109:16–25
Morewedge CK, Gilbert DT, Wilson TD. 2005. The least likely of times: how remembering the past biasesforecasts of the future. Psychol. Sci. 16:626–30
Neuhauser L, Paul K. 2011.Readability, comprehension, and usability. InCommunicatingRisks andBenefits:An Evidence-Based User’s Guide, ed. B Fischhoff, NT Brewer, J Downs, pp. 129–48. Washington, DC:Food Drug Admin.
Nunes R. 2010. Inflation dynamics: the role of expectations. J. Money Credit Bank. 42:1161–72Orphanides A, Williams J. 2006. The decline of activist stabilization policy: natural rate misperceptions,
learning, and expectations. J. Econ. Dyn. Control 29:1927–50Ottaviani M, Sørensen P. 2006. Reputational cheap talk. Rand J. Econ. 37:155–75PesaranMH,WealeM. 2006. Survey expectations. InHandbook of Economic Forecasting, ed. G Elliott, CWJ
Granger, A Timmermann, 1:715–76. Amsterdam: ElsevierPfajfar D, Santoro E. 2008. Asymmetries in inflation expectation formation across demographic groups.
Work. Pap. 0824, Cambridge Univ.Ranyard R, Del Missier F, Bonini N, Duxbury D, Summers B. 2008. Perceptions and expectations of price
changes and inflation: a review and conceptual framework. J. Econ. Psychol. 29:378–400Rich R, Tracy J. 2010. The relationships among expected inflation, disagreement and uncertainty: evidence
from matched point and density forecasts. Rev. Econ. Stat. 92:200–7Roberts J. 1995. New Keynesian economics and the Phillips curve. J. Money Credit Bank. 27:975–84Sargent T. 1993. Bounded Rationality in Macroeconomics. Oxford, UK: ClarendonSchwarz N. 1996. Cognition and Communication: Judgmental Biases, Research Methods, and the Logic of
Conversation. Mahwah, NJ: ErlbaumSimsC. 2009. Inflation expectations, uncertainty andmonetary policy.Work. Pap. 275, Bank Int. Settl., Basel,
Switz.Souleles N. 2004. Expectations, heterogeneous forecast errors, and consumption: micro evidence from the
Michigan Consumer Sentiment Surveys. J. Money Credit Bank. 36:39–72Svenson O, Nilsson G. 1986. Mental economics: subjective representations of factors related to expected
inflation. J. Econ. Psychol. 7:327–49Thomas LB Jr. 1999. Survey measures of expected U.S. inflation. J. Econ. Perspect. 13(4):125–44van der Klaauw W, Bruine de Bruin W, Topa G, Potter S, Bryan MF. 2008. Rethinking the measurement of
household inflation expectations: preliminary findings. Staff Rep. 359, Fed. Reserve Bank New York,New York
Velez P, Ashworth SD. 2007. The impact of item readability on the endorsement of the midpoint response insurveys. Surv. Res. Methods 1:69–74
Woodford M. 2005. Central bank communication and policy effectiveness. Proc. Fed. Reserve Bank Kans.City 2005(Aug.):399–474
301www.annualreviews.org � Measuring Inflation Expectations
Ann
u. R
ev. E
con.
201
3.5:
273-
301.
Dow
nloa
ded
from
ww
w.a
nnua
lrev
iew
s.or
gby
Uni
vers
itat Z
uric
h- H
aupt
bibl
ioth
ek I
rche
l on
07/0
1/14
. For
per
sona
l use
onl
y.

Annual Review of
Economics
Volume 5, 2013Contents
Early-Life Health and Adult Circumstance in Developing CountriesJanet Currie and Tom Vogl . . . . . . . . . . . . . . . . . . . . . . . . . . . . . . . . . . . . . 1
Fetal Origins and Parental ResponsesDouglas Almond and Bhashkar Mazumder . . . . . . . . . . . . . . . . . . . . . . . . 37
Quantile Models with EndogeneityV. Chernozhukov and C. Hansen . . . . . . . . . . . . . . . . . . . . . . . . . . . . . . . 57
Deterrence: A Review of the Evidence by a Criminologist for EconomistsDaniel S. Nagin . . . . . . . . . . . . . . . . . . . . . . . . . . . . . . . . . . . . . . . . . . . . 83
Econometric Analysis of Games with Multiple EquilibriaÁureo de Paula . . . . . . . . . . . . . . . . . . . . . . . . . . . . . . . . . . . . . . . . . . . 107
Price Rigidity: Microeconomic Evidence and Macroeconomic ImplicationsEmi Nakamura and Jón Steinsson . . . . . . . . . . . . . . . . . . . . . . . . . . . . . . 133
Immigration and Production TechnologyEthan Lewis . . . . . . . . . . . . . . . . . . . . . . . . . . . . . . . . . . . . . . . . . . . . . . 165
The Multinational FirmStephen Ross Yeaple . . . . . . . . . . . . . . . . . . . . . . . . . . . . . . . . . . . . . . . . 193
Heterogeneity in the Dynamics of Labor EarningsMartin Browning and Mette Ejrnæs . . . . . . . . . . . . . . . . . . . . . . . . . . . . 219
Empirical Research on Sovereign Debt and DefaultMichael Tomz and Mark L.J. Wright . . . . . . . . . . . . . . . . . . . . . . . . . . . 247
Measuring Inflation ExpectationsOlivier Armantier, Wändi Bruine de Bruin, Simon Potter, Giorgio Topa,Wilbert van der Klaauw, and Basit Zafar . . . . . . . . . . . . . . . . . . . . . . . . 273
Macroeconomic Analysis Without the Rational Expectations HypothesisMichael Woodford . . . . . . . . . . . . . . . . . . . . . . . . . . . . . . . . . . . . . . . . . 303
v
Ann
u. R
ev. E
con.
201
3.5:
273-
301.
Dow
nloa
ded
from
ww
w.a
nnua
lrev
iew
s.or
gby
Uni
vers
itat Z
uric
h- H
aupt
bibl
ioth
ek I
rche
l on
07/0
1/14
. For
per
sona
l use
onl
y.

Financial Literacy, Financial Education, and Economic OutcomesJustine S. Hastings, Brigitte C. Madrian, and William L. Skimmyhorn . . . 347
The Great Trade CollapseRudolfs Bems, Robert C. Johnson, and Kei-Mu Yi . . . . . . . . . . . . . . . . . . 375
Biological Measures of Economic HistoryRichard H. Steckel . . . . . . . . . . . . . . . . . . . . . . . . . . . . . . . . . . . . . . . . . 401
Goals, Methods, and Progress in NeuroeconomicsColin F. Camerer . . . . . . . . . . . . . . . . . . . . . . . . . . . . . . . . . . . . . . . . . . 425
Nonparametric Identification in Structural Economic ModelsRosa L. Matzkin . . . . . . . . . . . . . . . . . . . . . . . . . . . . . . . . . . . . . . . . . . 457
Microcredit Under the Microscope: What Have We Learned in the Past TwoDecades, and What Do We Need to Know?Abhijit Vinayak Banerjee . . . . . . . . . . . . . . . . . . . . . . . . . . . . . . . . . . . . 487
Trust and GrowthYann Algan and Pierre Cahuc . . . . . . . . . . . . . . . . . . . . . . . . . . . . . . . . . 521
Indexes
Cumulative Index of Contributing Authors, Volumes 1–5 . . . . . . . . . . . . . . 551Cumulative Index of Article Titles, Volumes 1–5 . . . . . . . . . . . . . . . . . . . . . 554
Errata
An online log of corrections toAnnual Review of Economics articles may be foundat http://econ.annualreviews.org
vi Contents
Ann
u. R
ev. E
con.
201
3.5:
273-
301.
Dow
nloa
ded
from
ww
w.a
nnua
lrev
iew
s.or
gby
Uni
vers
itat Z
uric
h- H
aupt
bibl
ioth
ek I
rche
l on
07/0
1/14
. For
per
sona
l use
onl
y.

AnnuAl Reviewsit’s about time. Your time. it’s time well spent.
AnnuAl Reviews | Connect with Our expertsTel: 800.523.8635 (us/can) | Tel: 650.493.4400 | Fax: 650.424.0910 | Email: [email protected]
New From Annual Reviews:
Annual Review of Statistics and Its ApplicationVolume 1 • Online January 2014 • http://statistics.annualreviews.org
Editor: Stephen E. Fienberg, Carnegie Mellon UniversityAssociate Editors: Nancy Reid, University of Toronto
Stephen M. Stigler, University of ChicagoThe Annual Review of Statistics and Its Application aims to inform statisticians and quantitative methodologists, as well as all scientists and users of statistics about major methodological advances and the computational tools that allow for their implementation. It will include developments in the field of statistics, including theoretical statistical underpinnings of new methodology, as well as developments in specific application domains such as biostatistics and bioinformatics, economics, machine learning, psychology, sociology, and aspects of the physical sciences.
Complimentary online access to the first volume will be available until January 2015. table of contents:•What Is Statistics? Stephen E. Fienberg•A Systematic Statistical Approach to Evaluating Evidence
from Observational Studies, David Madigan, Paul E. Stang, Jesse A. Berlin, Martijn Schuemie, J. Marc Overhage, Marc A. Suchard, Bill Dumouchel, Abraham G. Hartzema, Patrick B. Ryan
•The Role of Statistics in the Discovery of a Higgs Boson, David A. van Dyk
•Brain Imaging Analysis, F. DuBois Bowman•Statistics and Climate, Peter Guttorp•Climate Simulators and Climate Projections,
Jonathan Rougier, Michael Goldstein•Probabilistic Forecasting, Tilmann Gneiting,
Matthias Katzfuss•Bayesian Computational Tools, Christian P. Robert•Bayesian Computation Via Markov Chain Monte Carlo,
Radu V. Craiu, Jeffrey S. Rosenthal•Build, Compute, Critique, Repeat: Data Analysis with Latent
Variable Models, David M. Blei•Structured Regularizers for High-Dimensional Problems:
Statistical and Computational Issues, Martin J. Wainwright
•High-Dimensional Statistics with a View Toward Applications in Biology, Peter Bühlmann, Markus Kalisch, Lukas Meier
•Next-Generation Statistical Genetics: Modeling, Penalization, and Optimization in High-Dimensional Data, Kenneth Lange, Jeanette C. Papp, Janet S. Sinsheimer, Eric M. Sobel
•Breaking Bad: Two Decades of Life-Course Data Analysis in Criminology, Developmental Psychology, and Beyond, Elena A. Erosheva, Ross L. Matsueda, Donatello Telesca
•Event History Analysis, Niels Keiding•StatisticalEvaluationofForensicDNAProfileEvidence,
Christopher D. Steele, David J. Balding•Using League Table Rankings in Public Policy Formation:
Statistical Issues, Harvey Goldstein•Statistical Ecology, Ruth King•Estimating the Number of Species in Microbial Diversity
Studies, John Bunge, Amy Willis, Fiona Walsh•Dynamic Treatment Regimes, Bibhas Chakraborty,
Susan A. Murphy•Statistics and Related Topics in Single-Molecule Biophysics,
Hong Qian, S.C. Kou•Statistics and Quantitative Risk Management for Banking
and Insurance, Paul Embrechts, Marius Hofert
Access this and all other Annual Reviews journals via your institution at www.annualreviews.org.
Ann
u. R
ev. E
con.
201
3.5:
273-
301.
Dow
nloa
ded
from
ww
w.a
nnua
lrev
iew
s.or
gby
Uni
vers
itat Z
uric
h- H
aupt
bibl
ioth
ek I
rche
l on
07/0
1/14
. For
per
sona
l use
onl
y.