Measuring Gene Expression Part 2 David Wishart Bioinformatics 301 [email protected].

Measuring Gene Expression
David Wishart
Bioinformatics 301
Looking at Genes
• Where? (where are genes located?)– Genes are located using gene finding
programs (Glimmer, Genscan, GRPL)
• What? (what do these genes do?)– Genes are characterized using gene
annotation tools (Pedant, Magpie, etc.)
• How Many? (how abundant are they?)– Gene expression is measured
experimentally using SAGE or gene chips
Different Kinds of “Omes”
• Genome– Complement of all genes in a cell,
tissue, organ or organism
• Transcriptome– Complement of all mRNA transcripts in
a cell, tissue, organ or organism
• Proteome– Complement of all proteins in a cell,
tissue, organ or organism
Different Kinds of “Omes”
Genome
Transcriptome
Proteome
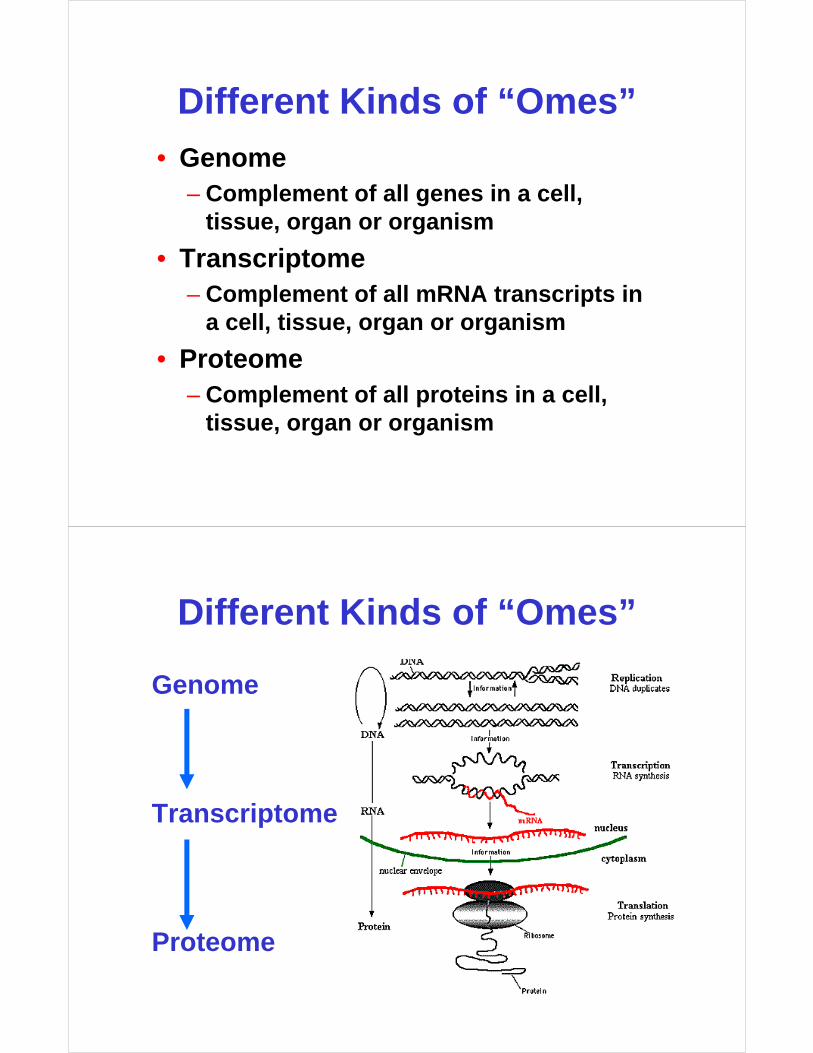
The Measurement Dichotomy
DNA
RNA
protein
metabolite
phenotype
Biological relevance
Ease of measurement
Less
More
Easy
Hard
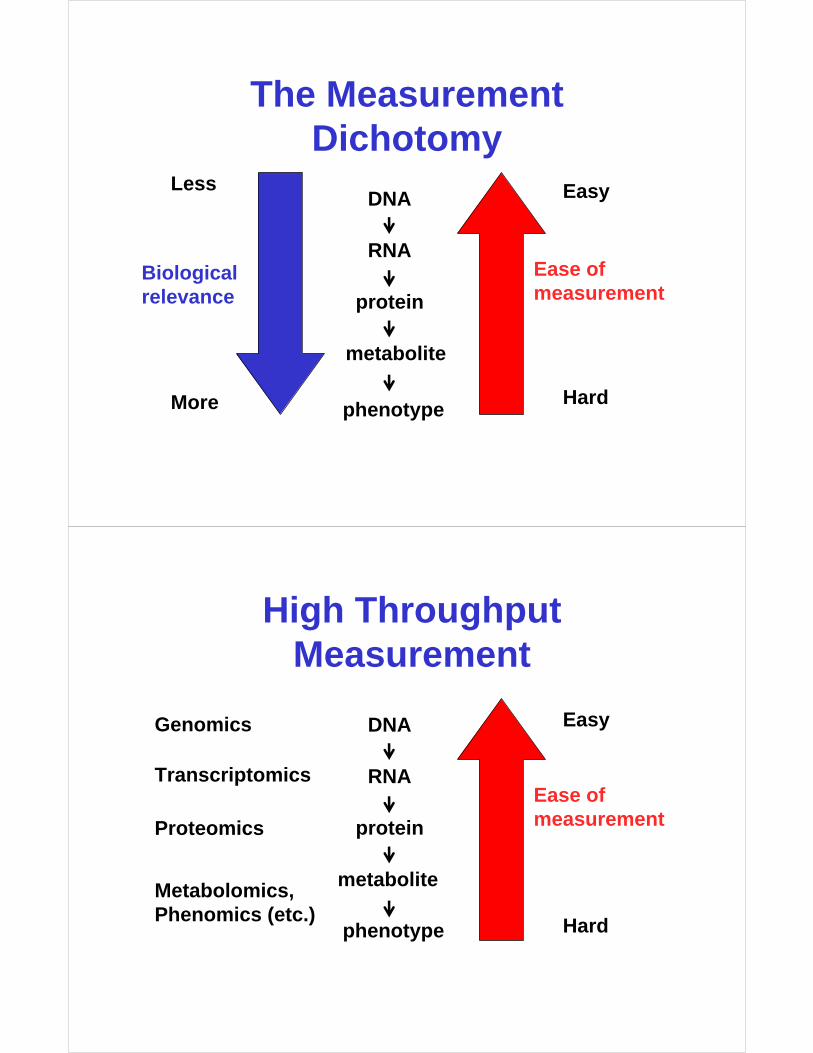
High Throughput Measurement
DNA
RNA
protein
metabolite
phenotype
Ease of measurement
Genomics
Transcriptomics
Proteomics
Metabolomics,Phenomics (etc.)
Easy
Hard

-Omics Mania
http://www.genomicglossaries.com/content/omes.asp
biome, CHOmics, cellome, cellomics, chronomics, clinomics, complexome, crystallomics, cytomics, cytoskeleton, degradomics, diagnomicsTM, enzymome, epigenome, expressome, fluxome, foldome, secretome, functome, functomics, genomics, glycomics, immunome, transcriptomics, integromics, interactome, kinome, ligandomics, lipoproteomics, localizome, phenomics, metabolome, pharmacometabonomics, methylome, microbiome, morphome, neurogenomics, nucleome, secretome, oncogenomics, operome, transcriptomics, ORFeome, parasitome, pathome, peptidome, pharmacogenome, pharmacomethylomics, phenomics, phylome, physiogenomics, postgenomics, predictome, promoterome, proteomics, pseudogenome, secretome, regulome, resistome, ribonome, ribonomics, riboproteomics, saccharomics, secretome, somatonome, systeome, toxicomics, transcriptome, translatome, secretome, unknome, vaccinome, variomics...
Why Measure Gene Expression?
• Assumption that more abundant genes/transcripts are more important
• Assumption that gene expression levels correspond to protein levels
• Assumption that a normal cell has a standard expression profile/signature
• Changes to that expression profile indicate something is happening
Why Measure Gene Expression?
• Gene expression profiles represent a snapshot of cellular metabolism or activity at the molecular scale
• Gene expression profiles represent the cumulative interactions of many hard to detect events or phenomena
• Gene expression is a “proxy” measure for transcription/translation events
mRNA level = Protein level?
• Gygi et al. (1999) Mol. Cell. Biol. compared protein levels (MS, gels) and RNA levels (SAGE) for 156 genes in yeast
• In some genes, mRNA levels were essentially unchanged, but protein levels varied by up to 20X
• In other genes, protein levels were essentially unchanged, but mRNA levels varied by up to 30X

SAGE vs. 2D Gel
mRNA Protein
mRNA level = Protein level?
Gygi et al. (1999) Mol. Cell. Biol
R = 0.35
R = 0.95

• Griffen TJ et al. (2002) Mol. Cell. Proteomics 1:323-333
• Compared protein levels (MS, ICAT) and RNA levels (microarray) for 245 genes in yeast on galactose/ethanol medium
• “Significant number of genes show large discrepancies between abundance ratios when measured at the levels of mRNA and protein expression”
mRNA level = Protein level?
Microarray vs. ICAT
mRNA Protein

mRNA vs. Protein levels
Griffen TJ et al. (2002)
mRNA vs. Protein levels
Griffen TJ et al. (2002)

Why Do It?
DNA
RNA
protein
metabolite
phenotype
Ease of measurement
Genomics
Transcriptomics
Proteomics
Metabolomics,Phenomics (etc.)
Easy
Hard
It’s easier to do than the other measurements
How Relevant are RNA Levels to Protein Levels?
“ [transcript abundance] doesn’t tell
us everything, but it tells us a lot
more than we knew before ”
--Pat Brown, StanfordMicroarray pioneer
Measuring Gene Expression
• Differential Display
• Serial Analysis of Gene Expression (SAGE)
• Rapid Analysis of Gene Expression (RAGE)
• RT-PCR (real-time PCR)
• Northern/Southern Blotting
• DNA Microarrays or Gene Chips
Differential Display (DD)• Basic idea:
– Run two RNA (cDNA) samples side by side on a gel
– Excise and sequence bands present in one lane, but not the other
• The clever trick:– Reduce the complexity of the samples by
making the cDNA with primers that will prime only a subset of all transcripts

Differential Display
CAAAAAn
TAAAAAn
TAAAAAn
GAAAAAn
Prime with polyT Prime with C(polyT)
CAAAAAn
TAAAAAn
TAAAAAn
GAAAAAn
Differential Display (Detail)

CAAAAAn
TAAAAAn
TAAAAAn
GAAAAAn
prime with polyT prime with C(polyT)
CTTTTTn
CAAAAAn
TAAAAAn
TAAAAAn
GAAAAAnTTTTTn
TTTTTn
TTTTTn
TTTTTn
Complex cDNA mixture Less complex cDNA mixture
Differential Display (Detail)
Differential Display
10hr11hr12hr16hr

Advantages of DD
• Oldest of all transcript expression methods
• Technically and technologically simplest of all transcript methods
• Does not require ESTs, cDNA libraries, or any prior knowledge of the genome
• Open-ended technology
Disadvantages of DD
• Not very quantitative
• Sensitivity can be an issue
• Only a fraction of the transcripts can be analyzed in any single reaction
• Prone to false positives
• Not easily automated or scaled-up

SAGE
• Principle is to convert every mRNA molecule into a short (10-14 base), unique tag. Equivalent to reducing all the people in a city into a telephone book with surnames
• After creating the tags, these are assembled or concatenated into a long “list”
• The list can be read using a DNA sequencer and the list compared to a database to ID genes or proteins and their frequency
SAGE Tools

SAGE
Convert mRNAto dsDNA
Digest with NlaIII
Split into 2 aliquots
AttachLinkers
SAGE
Linkers havePCR & TaggingEndonuclease
Cut with TEBsmF1
Mix both aliquotsBlunt-end ligateto make “Ditag”
Concatenate& Sequence

SAGE of Yeast Chromosome
Advantages of SAGE
• Very direct and quantitative method of measuring transcript abundance
• Open-ended technology
• Near infinite dynamic range
• Built-in quality control: – e.g. spacing of tags & 4-cutter
restriction sites

Disadvantages of SAGE
• Expensive, time consuming technology - must sequence >50,000 tags per sample (>$5,000 per sample)
• Most useful with fully sequenced genomes (otherwise difficult to associate 15 bp tags with their genes)
• 3’ ends of some genes can be very polymorphic
RT-PCR

Principles of PCR
Polymerase Chain Reaction
PCR Tools
Thermocycler Oligo Synthesizer

Reverse Transcriptase PCR
• Two kinds of “RT-PCR” - confusing
• One uses reverse transcriptase (RT) to help produce cDNA from mRNA
• Other uses real time (RT) methods to monitor PCR amplification
RT-PCR
• RT (Real Time) PCR is a method to quantify mRNA and cDNA in real time
• A quantitative PCR method
• Measures the build up of fluorescence with each PCR cycle
• Generates quantitative fluorescence data at earliest phases of PCR cycle when replication fidelity is highest

RT-PCR (Taqman)An oligo probe with 2 flurophoresis used (a quencher & reporter)
RT-PCR vs. Microarray
Advantages of RT-PCR
• Sensitive assay, highly quantitative, highly reproducible
• Considered “gold standard” for mRNA quantitation
• Can detect as few as 5 molecules
• Excellent dynamic range, linear over several orders of magnitude
Disadvantages of RT-PCR
• Expensive (instruments are >$150K, materials are also expensive)
• Not a high throughput system (10’s to 100’s of genes – not 1000’s)
• Can pick up RNA carryover or contaminating RNA leading to false positives

Northern Blots
Northern Blots
• Method of measuring RNA abundance
• Name makes “fun” of Southern blots (which measure DNA abundance)
• mRNA is first separated on an agarosegel, then transferred to a nitrocellulose filter, then denatured and finally hybridized with 32P labelledcomplementary DNA
• Intensity of band indicates abundance
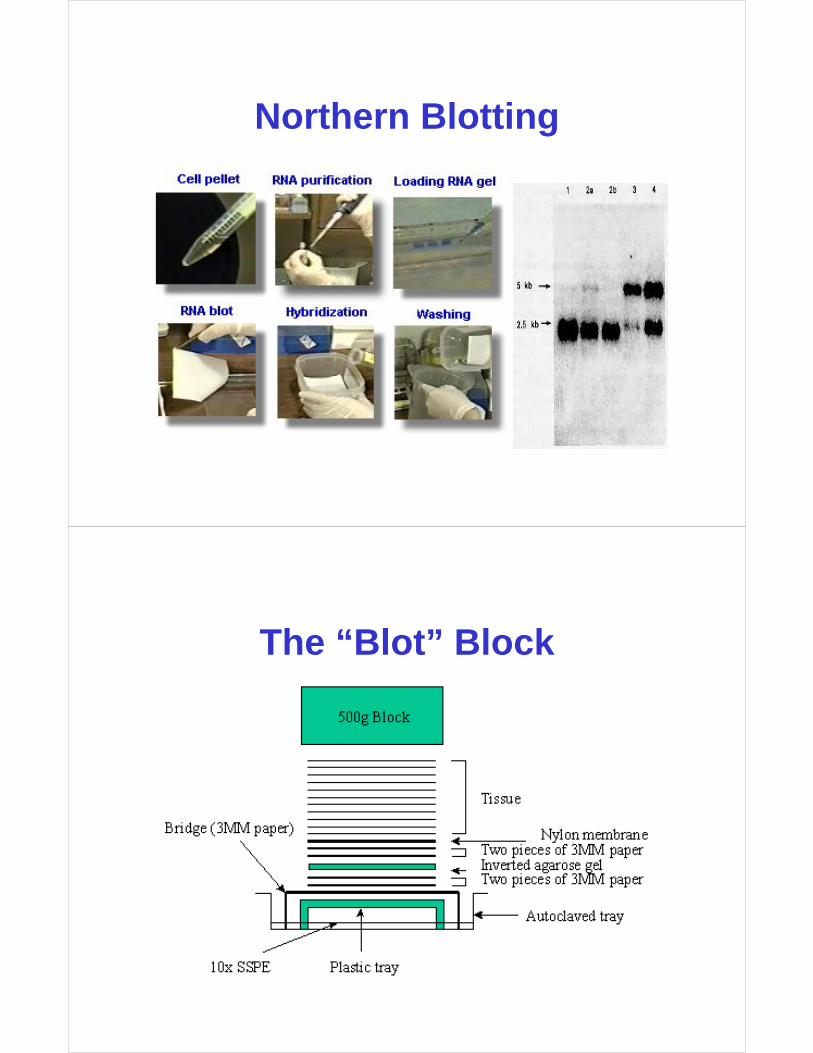
Northern Blotting
The “Blot” Block

Advantages of Northerns
• Inexpensive, quantitative method of measuring transcript abundance
• Well used and well understood technology
• Use of radioactive probes makes it very sensitive
• Near infinite dynamic range
Disadvantages of Northerns
• Relies on radioactive labelling –“dirty” technology
• Quality control issues
• “Old fashioned” technology, now largely replaced by microarrays and other technologies

Microarrays
• Basic idea:– Reverse Northern blot on a huge scale
• The clever trick:– Miniaturize the technique, so that many
assay can be carried out in parallel
– Hybridize control and experimental samples simultaneously; use distinct fluorescent dyes to distinguish them
Microarrays
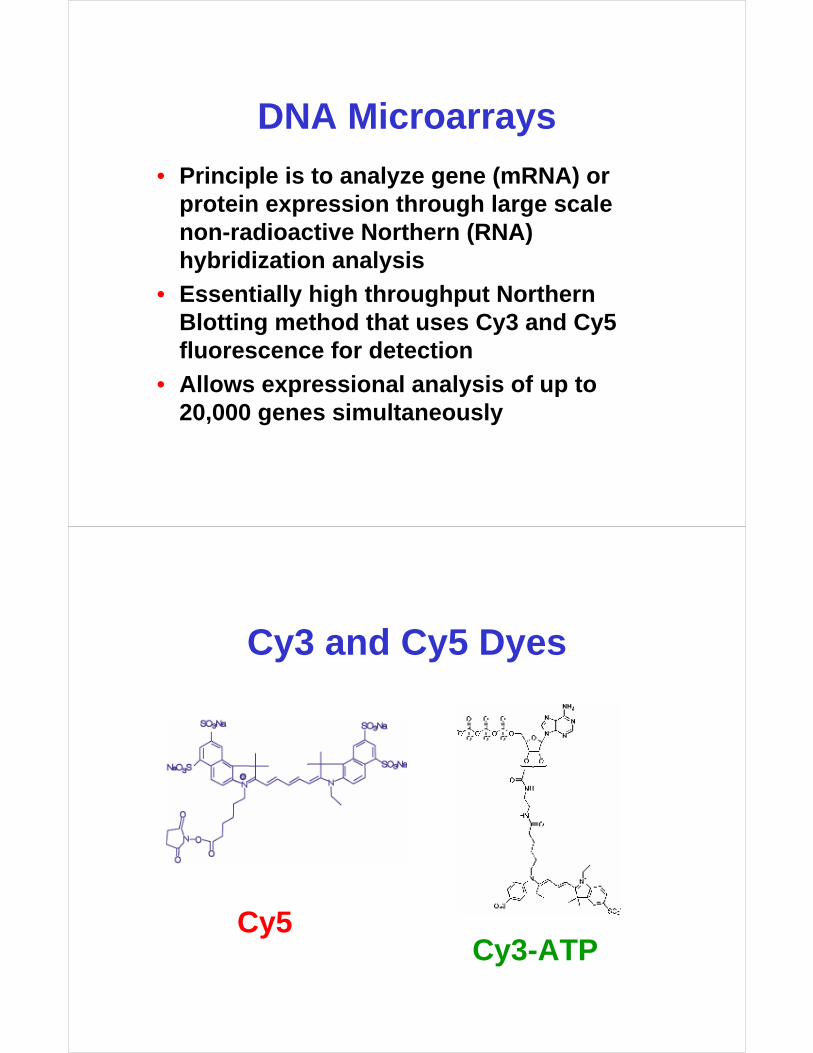
DNA Microarrays
• Principle is to analyze gene (mRNA) or protein expression through large scale non-radioactive Northern (RNA) hybridization analysis
• Essentially high throughput Northern Blotting method that uses Cy3 and Cy5 fluorescence for detection
• Allows expressional analysis of up to 20,000 genes simultaneously
Cy3 and Cy5 Dyes
Cy3-ATPCy5

Principles of Microarrays
Typical Microarray Data
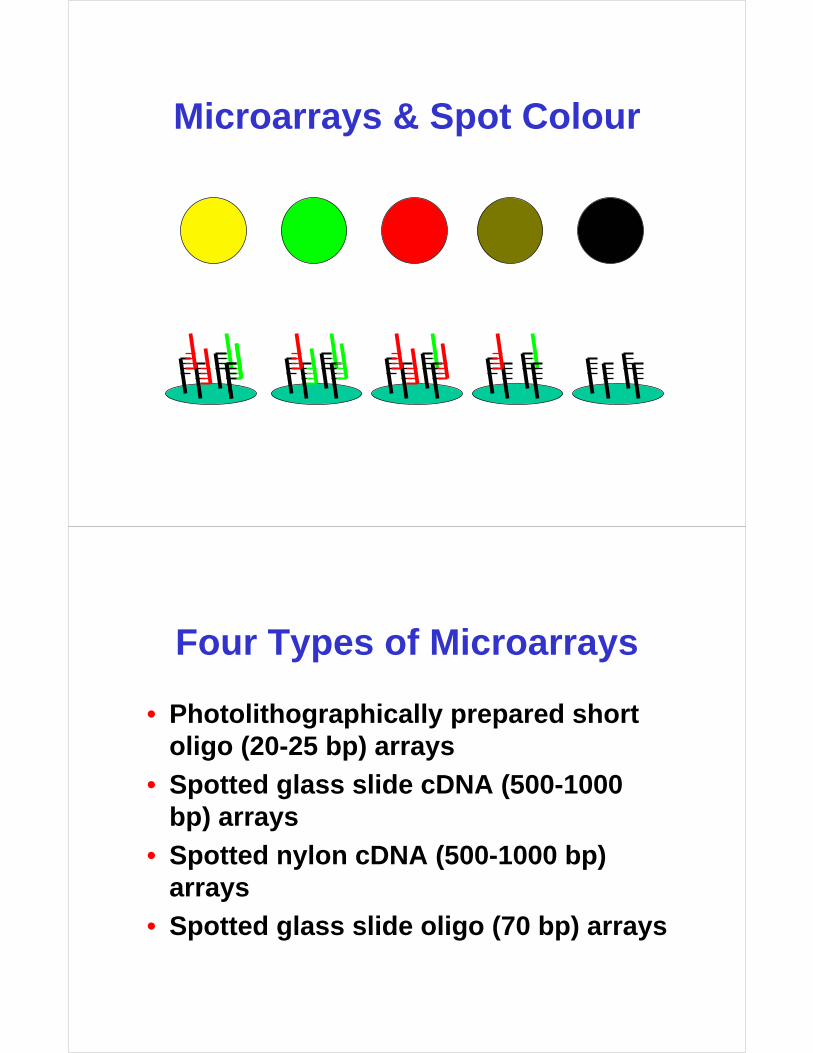
Microarrays & Spot Colour
Four Types of Microarrays
• Photolithographically prepared short oligo (20-25 bp) arrays
• Spotted glass slide cDNA (500-1000 bp) arrays
• Spotted nylon cDNA (500-1000 bp) arrays
• Spotted glass slide oligo (70 bp) arrays

Affymetrix GeneChips
Glass Slide Microarrays

Advantages to Microarrays
• High throughput, quantitative method of measuring transcript abundance
• Avoids radioactivity (fluorescence)
• Kit systems and commercial suppliers make microarrays very easy to use
• Uses many “high-tech” techniques and devices – cutting edge
• Good dynamic range
Disadvantages to Microarrays
• Relatively expensive (>$1000 per array for Affy chips, $300 per array for “home made” systems)
• Quality and quality-control is highly variable
• Quantity of data often overwhelms most users
• Analysis and interpretation is difficult

Conclusions
• Multiple methods for measuring RNA or transcript abundance– Differential Display
– Serial Analysis of Gene Expression (SAGE)
– RT-PCR (real-time PCR)
– Northern Blotting
– DNA Microarrays or Gene Chips
Conclusions
• Some methods are better or, at least, more reliable than others
• Agreement between mRNA levels and protein levels is generally very poor – calls into question the utility of these measurements
• All mRNA measurement methods require a “second opinion”