
Measuring Freedom: An Analysis of the Economic Freedom Index
64
Clemson University TigerPrints All eses eses 12-2009 Measuring Freedom: An Analysis of the Economic Freedom Index Derek Mcafee Clemson University, [email protected] Follow this and additional works at: hps://tigerprints.clemson.edu/all_theses Part of the Economics Commons is esis is brought to you for free and open access by the eses at TigerPrints. It has been accepted for inclusion in All eses by an authorized administrator of TigerPrints. For more information, please contact [email protected]. Recommended Citation Mcafee, Derek, "Measuring Freedom: An Analysis of the Economic Freedom Index" (2009). All eses. 703. hps://tigerprints.clemson.edu/all_theses/703
Transcript of Measuring Freedom: An Analysis of the Economic Freedom Index

Clemson UniversityTigerPrints
All Theses Theses
12-2009
Measuring Freedom: An Analysis of the EconomicFreedom IndexDerek McafeeClemson University, [email protected]
Follow this and additional works at: https://tigerprints.clemson.edu/all_theses
Part of the Economics Commons
This Thesis is brought to you for free and open access by the Theses at TigerPrints. It has been accepted for inclusion in All Theses by an authorizedadministrator of TigerPrints. For more information, please contact [email protected].
Recommended CitationMcafee, Derek, "Measuring Freedom: An Analysis of the Economic Freedom Index" (2009). All Theses. 703.https://tigerprints.clemson.edu/all_theses/703

i
MEASURING FREEDOM: AN ANALYSIS OF THE ECONOMIC FREEDOM INDEX
A Thesis Presented to
the Graduate School of Clemson University
In Partial Fulfillment of the Requirements for the Degree
Master of Arts Economics
by Derek C. McAfee December 2009
Accepted by: Dr. Raymond D. Sauer, Committee Chair
Dr. Robert D. Tollison Dr. Michael T. Maloney

ii
ABSTRACT
The creation and empirical use of economic freedom indices has produced a growing
amount of literature over the last decade. A survey of this literature is provided, and the
difficulty of measuring this concept, as well as the usefulness and limits of the various
indices are discussed. The indices are reduced to their components, and testable models
are used in order to determine which components are most important. Secure property
rights are found to be the most important component driving the results. The results are
consistent with previous studies, which indicate that greater economic freedom is related
to greater growth and wealth. Not all of the components of an aggregate index have the
same impact or even the same relationship. The aggregate indices are highly correlated at
the international levels, lending support to the reliability of the measures, but there is no
consensus on the appropriate aggregation method. Care should be put on the
interpretation of the actual point estimates when the aggregate index is used empirically,
but the relationships are robust and the indices are very useful and growing in
importance.

iii
ACKNOWLEDGMENTS
I am very appreciative for the guidance and friendship of Dr. Raymond D. Sauer. This
work would not have been possible without his assistance. I am also grateful for the
opportunity to learn from Dr. Robert D. Tollison. A special thanks needs to be extended
to Dr. Robert Lawson of Auburn University for his helpful comments and advise. I also
need to thank Dr. Michael T. Maloney for his assistance, and for accepting my late
graduate application to study at the John E. Walker Department of Economics. I am
eternally grateful for the love and support of my wife, parents, and extended family, too
many to list, but always supportive of my many endeavors. Finally, I am appreciative to
the American taxpayers for the financial support through the United States Army, Indiana
National Guard, and the Veterans Administration.

iv
TABLE OF CONTENTS
Page
TITLE PAGE .................................................................................................................... i ABSTRACT ..................................................................................................................... ii ACKNOWLEDGMENTS .............................................................................................. iii LIST OF TABLES ........................................................................................................... v LIST OF FIGURES ........................................................................................................ vi CHAPTER I. INTRODUCTION ......................................................................................... 1 Theory and Relevance.............................................................................. 1 Previous Literature ................................................................................. 10 Weighting ............................................................................................... 12 II. INTERNATIONAL LEVEL ....................................................................... 17 Summary ................................................................................................ 17 Comparison and Analysis ...................................................................... 27 Model and Data ...................................................................................... 34 Results .................................................................................................... 37 III. NATIONAL LEVEL ................................................................................... 43 Summary ................................................................................................ 43 Model and Data ...................................................................................... 45 Results .................................................................................................... 46 IV. CONCLUSION ............................................................................................ 49 V. REFERENCES ............................................................................................ 54
v
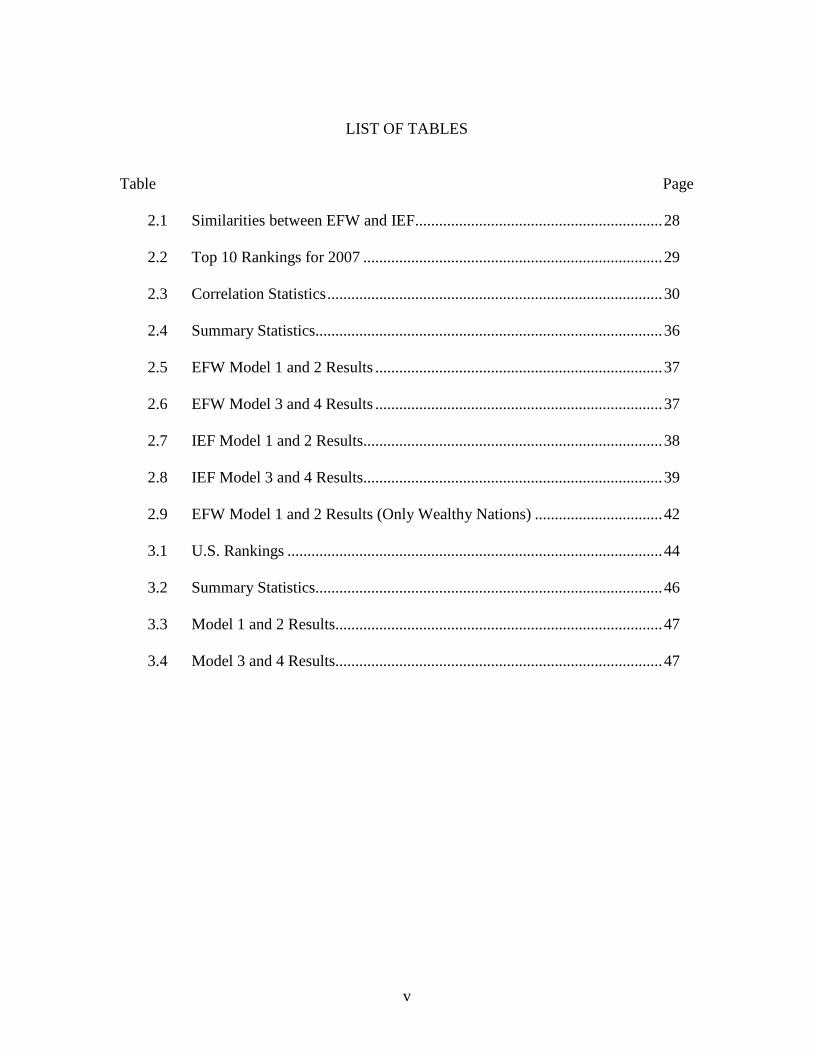
LIST OF TABLES
Table Page 2.1 Similarities between EFW and IEF.............................................................. 28 2.2 Top 10 Rankings for 2007 ........................................................................... 29 2.3 Correlation Statistics .................................................................................... 30 2.4 Summary Statistics....................................................................................... 36 2.5 EFW Model 1 and 2 Results ........................................................................ 37 2.6 EFW Model 3 and 4 Results ........................................................................ 37 2.7 IEF Model 1 and 2 Results........................................................................... 38 2.8 IEF Model 3 and 4 Results........................................................................... 39 2.9 EFW Model 1 and 2 Results (Only Wealthy Nations) ................................ 42 3.1 U.S. Rankings .............................................................................................. 44 3.2 Summary Statistics....................................................................................... 46 3.3 Model 1 and 2 Results.................................................................................. 47 3.4 Model 3 and 4 Results.................................................................................. 47

vi
LIST OF FIGURES
Figure Page 2.1 Overall Index Scores over 2000-2007 ......................................................... 32 2.2 Standard Deviation over 2000-2007 ............................................................ 32 2.3 Guyana Index Score (One of the most volatile countries in sample) .......... 33 2.4 Iran Index Score ........................................................................................... 33 3.1 U.S. Over Time ............................................................................................ 45

1
CHAPTER ONE
INTRODUCTION
“The moment the idea is admitted into society that property is not as sacred as the
law of God, and that there is not a force of law and public justice to protect it, anarchy
and tyranny commence.” – John Adams, 17871
THEORY AND RELEVANCE:
The debate, whether it be economic, political, or moral, between socialism and
capitalism was a major theme over the last century across many disciplines. The writing
and analysis of these continue, but with the apparent failure and eventual dissolution of
the Soviet Union, they are not viewed as strict alternatives as they once were. In reality,
economies tend to lie somewhere between, and what differs is the degree to which
governments attempt to control economic decisions made by private citizens, and
whether prices are allowed to allocate resources within a largely free market.2
Within the economics profession, theory has supported the idea that the level of
economic freedom affects the incentives individuals face, and therefore, economic
performance. In the last two decades, ground has been made in empirical work to support
theory in this area. This has largely been made possible and supported by the creation of
various economic freedom indices.
1 A Defense of the Constitutions of Governments of the United States of America, 1787
2 From Ashby and Sobel (2008)

2
Economic freedom is a fairly broad term, but it relates to the level in which
property that individuals acquire through moral and legal means is protected, and the
freedom in which these individuals can use, give, or exchange that property as they see
fit. It has mainly been treated and thought of as it relates to other desirable outcomes such
as general growth, health, life expectancy, entrepreneurship, and income equality.
However, its relationship to growth and income level has dominated the literature.
The causes of economic growth have been at the center of economic inquiry. The
importance of certain institutions, such as a fair and balanced judiciary, protection of
property rights, and free markets, as they relate to growth and prosperity have been
aspects explored for centuries. In some ways, it begins with Adam Smith arguing that
individuals’ freely pursuing their own interests leads to prosperity for society at large.
Smith stated that, “little else is requisite to carry a state to the highest degree of opulence
from the lowest barbarism, but peace, easy taxes, and a tolerable administration of
justice; all the rest being brought about by the natural course of things.”3
Although early modern economics primarily revolved around an inquiry into
institutions, the economic development literature by the mid- to late 1900s was
dominated by theories based on neoclassical growth and input-output models that
attributed prosperity primarily to factors such as the abundance of resources,
geographical location, and the availability of human and physical capital.4 This
development has reversed course some over the last couple of decades, with a large
amount of literature based on the analysis of institutions as the primary factor affecting
3 Adam Smith, The Wealth of Nations (cited from Sobel, Chap 2 of EFNA, 2008 edition)
4 Chapter 2 EFNA, 2008 edition.p31

3
economic prosperity. Authors such as P.T. Bauer and Douglas North have contributed to
this development, as well as work written in the Public Choice literature.5
Russell Sobel explains that, “Within this literature, ‘institutions’ are broadly
defined as the formal and informal ‘rules of the game’ governing action and interaction
among individuals, and the enforcement of those rules. Simply put, making analogous to
the board game Monopoly, the behavior of the agents is influenced in predictable ways
by the structure of the rules under which the game is played. Imagine, for example, that a
new rule was created making it legitimate to steal the property cards of other players if
they were not looking. The play and outcomes from a game of Monopoly would be
significantly different under these different institutional rules as players would respond to
them by altering their behavior. Not only would this rule change increase the rate of theft
among players, it would also result in fewer properties being purchased, less investment
on the properties, and more resources being devoted to trying to steal the property of
other players.”6
William Baumol (1990) introduced a theory of productive and unproductive
entrepreneurship.7 He suggested that entrepreneurs have a choice between spending their
efforts toward private-sector wealth creation, or toward securing wealth redistribution
through the political and legal process. The quality of the institutions, as well as certain
policies, influences the potential payoffs between the two activities. Thus, if the political
structure of a state creates incentives to lobby for wealth transfers rather than produce,
5 See Douglas North, Institutions, Institutional Change and Economic Performance
6 Chapter 2 EFNA, 2008 edition.p32
7 Baumol, W.J, “Entrepreneurship” 1990

4
this is bound to have a negative effect on its growth. Baumol’s theory of unproductive
entrepreneurship is concentrated on the process of business creation. A similar concept is
captured by the general term of rent seeking used often in public choice literature.
Rent seeking is the socially costly pursuit of wealth transfers, and the concept was
introduced to the economics profession in 1967 by Tullock.8 He argued that expenditures
made to capture a wealth transfer were a form of social costs, and therefore, is not
costless as was previously hypothesized in economic literature. The social cost arises
because the resources used for transfers have a positive opportunity cost somewhere else
in the economy. These costs are inherent in the process by which resources are shifted
from positive to zero and negative-sum activities.
Clearly, certain government roles are conducive to desirable economic
performance, while some serve as a hindrance. When institutions in a state provide for
secure property rights, a fair and balanced judicial system, contract enforcement, and
effective constitutional limits on government’s ability to transfer wealth through taxation
and regulation, it reduces the profitability of unproductive political activity.9 These
aspects capture what is meant by economic freedom and the efforts at the measurement of
the various aspects of an economy that are consistent with this idea is the subject of this
paper.
Broadly speaking, the literature on institutions generally has covered the legal
institutions of a country, and recently it’s heritage with some inquiry at whether a country
8 See Tollison, “Rent Seeking” 1997 and Tullock, Toward a Mathematics of Politics 1967
9 Baumol, W.J., “Entrepreneurship” 1990

5
is closer to English common law or French civil law.10 The idea is that English common
law gives stronger protections to private property and creditors, and therefore, we would
expect more investment and output due to the incentives created when individuals can
expect future returns from their work and investment. We have known since the
beginning of modern economics that good institutions are correlated with good economic
outcomes, but the more contentious question is what causes what? Is it the institutions,
economic freedom in this case, that lead to better economic conditions or vice versa?
With a broad and longer run view, this should not be very controversial. It is hard
to believe that the lack of property rights, absence of the rule of law, or an unstable
monetary environment would be conducive to growth. It would follow that these
institutions would be considered a prior on straight logical grounds, but this has also
been supported by empirical work already mentioned such as Acemoglu, Johnson, and
Robinson (2001). Their work examines how the colonial origins of a country and the
institutions formed have affected economic performance on a long term basis. It is
plausible that the colonial origin affected growth over the last couple of centuries, but it is
hard to argue the reverse. Growth and prosperity did not cause colonial origins.
There are aspects of economic freedom though, that are closer to policy decisions
such as the level of taxes and regulation. It is possible that some of the components
included in a measure of economic freedom could be demanded after more prosperity. In
the U.S., perhaps the rise in prosperity experienced in the 1980s and 1990s decreased the
demand for regulation and restrictions, and the drop in growth during the recession of
10
Acemoglu, Johnson and Robinson, “The Colonial Origins of Comparative Developments” 2001

6
2001 increased the demand for regulation. This may be the case with some of the
components included in an aggregate economic freedom index.
Again, with the longer run view, this does not answer why the growth happened
in the first place. If it is merely a function of capital and investment, where or how does
this originate, if not by the institutions in place? Though on a shorter run basis, and
especially in analyzing changes in this environment, studies have been conducted to
determine the causal relationship.
This has been addressed using statistical methods in Heckelman (2000)11 and
Dawson (2002)12 with relation to growth, and Kreft and Sobel (2005)13 in regard to
entrepreneurship. All came to the general conclusion that causality started with economic
freedom. To test whether freedom causes growth, growth causes freedom, or the two are
jointly determined, Heckelman (2000) uses a Granger-causality test to tease out the
relationship, and concludes that economic freedom precedes growth. The same for
Dawson (2002), and similar results are found with entrepreneurship. Heckelman (2000)
did find contradictory evidence with a couple of the components when the index is
broken down, which will be discussed again later in this paper.
There is no doubt that economic freedom has had popular proponents for many
years. With F.A Hayek’s Road to Serfdom, and Milton Friedman’s Capitalism and
Freedom, the broader concepts of freedom were espoused with great clarity to millions of
readers, but this was not largely reflected in the professional economic journals. This is
11
Heckelman, Jac C. Economic Freedom and Economic Growth: A Short-run Causal Investigation. 2000 12
Dawson, John W. Causality in the Freedom-Growth Relationship. 2003 13
Kreft, Steven and Russell Sobel. Public Policy, Entrepreneurship, and Economic Freedom. 2005

7
likely the result of the difficulty in measuring this reality, but with the increase in
technology experienced over the last couple of decades, the collection of the data
necessary to construct such an index has become much less costly, and the emergence of
these indices has reduced this gap.
Economic freedom indices try to capture a large aspect of these institutions, a
basket of many factors that create an environment of relative economic freedom or lack
thereof. Each are created differently, but are trying to capture the same concept. The
attempt is to put a quantitative number on the level of economic freedom in a country or
state. Similar approaches have been taken by organizations to measure other areas of
interest such as tort liability and taxation. The Pacific Research Institute publishes a Tort
Liability Index and the Tax Foundation publishes a Tax Climate Index. 14
The indices have primarily been produced and largely supported by free-market
think tanks, and this is due to the value that empirical data can make to the their
arguments, as well as the attention they have been able to attract to their organizations.
Steve Forbes, referring to the PRI’s U.S. Tort Liability Index, said “When you can
measure something, you can reform it”15, which can be applied to any index, including
the economic freedom indices. It is one thing to say that more freedom means more
prosperity, but even more convincing to say that it can be demonstrated empirically that
societies that have adopted certain traits are more prosperous than those that do not.
14
Full reports at http://liberty.pacificresearch.org/publications/us-tort-liability-index-2008-report-2 and
http://www.taxfoundation.org/research/show/22658.html 15
See back cover of U.S. Tort Liability Index: 2006 Report

8
Some of the early economic freedom indices were created by scholars creating their own
such as Scully and Slottje (1991)16, but this was only done for one year. The Freedom
House has published an index in their series World Survey of Economic Freedom17, but
their purpose for the index and interpretation of economic freedom are different than
others published. They stress the interrelationship with political rights and civil
liberties.18 They do not include measures for taxation or government spending.
On the international scale, two indices emerged in the mid 1990s that have
dominated this arena. The Index of Economic Freedom was created by The Heritage
Foundation and The Wall Street Journal in 1994 and has been published annually for the
last 15 years. Around the same time the Economic Freedom of the World Index (EFW)
was published by the Frasier Institute, and has been published annually for the last 8
years.
These international indices have become increasingly important within and
outside of the economics profession. In a correspondence with one of the authors of the
Economic Freedom of the World, Robert Lawson, stated that “the Free Market
Foundation in South Africa has been effective in using the index with South African
officials. They frequently are asked how a particular law will impact their rating. The
IMF’s World Economic Outlook publication featured our index prominently in its report
on ‘Building Institutions.’ Also, the report has been used extensively in the Republic of
16
Scully, G.W. and D.J. Slottje. “Ranking Economic Liberty Across Countries” 1991 17
Full report at www.freedomhouse.org/template.cfm?page=15 18
See Heckelman, Jac C. and Michael D. Stroup. “Which Economic Freedoms Contribute to Growth” 2000
for short summary of Freedom House study. Also see, Richard Messick, World Survey of Economic
Freedom.

9
Georgia as a roadmap for economic reforms.” He continued that, “we are cited hundreds
of times annually in media reports and often officials are asked to comment in these
stories.”19
Robert Lawson also reported that they have received much feedback, not always
positive. In the last few years, they have received feedback from officials from France,
Hong Kong, and Pakistan. With the exception of Georgia, many more countries have
taken steps that have increased their ratings, but he can’t say these changes were
necessarily driven by the existence of the index. He says the index is an academic project
and that he doesn’t follow the policy debates much.
There are numerous indices that are produced at the sub-national level. The
Frasier Institute produces some through their relationships with think tanks in their
Economic Freedom Network.20 The U.S. Economic Freedom Index (USEF) was first
published in 1998 and with the support of the Pacific Research Institute and Forbes has
been updated twice in 2004 and 2008. The Mercatus Center at George Mason University
has also recently published the Freedom in the 50 States, which has a measure of
economic freedom and personal freedom. The index that will be discussed at length in
Chapter 3 is the Economic Freedom of North America (EFNA) from the Frasier Institute,
in order to provide insight and comparison for the results found at the international level.
The following will be a brief survey of the literature that has used these indices, and then
a discussion of the controversy on the appropriate weighting of components within the
various indices. This will be followed by an analysis of the construction and comparison
19
Email correspondence with Robert Lawson on November 21, 2009 20
http://www.freetheworld.com/member.html

10
of the international indices. The aggregated indices will be reduced to their sub-
components and their relationship to GDP and growth will be tested using linear
regression. This will be done in order to test the sensitivity of the index, and contribute to
the discussion on the interpretation of the results and what policy implications can be
drawn. A similar approach will be used on the national level for the U.S. This will be
followed with concluding remarks.
PREVIOUS LITERATURE:
Over the last decade, there have been many empirical studies that have used one
or several of the economic freedom indices. A search on Google Scholar results in over
300 citations for Frasier’s EFW index and over 200 citations for Heritage’s IEF.
Therefore, what follows is a brief overview. They have primarily been used empirically
in relation to growth, entrepreneurship, other measures of well-being, and then less
directly.
As already mentioned, causality test with respect to growth have been conducted
by Heckelman (2000) and Dawson (2003). A comparison and overview of the two
international indices, IEF and EFW, and their relationship with growth was also analyzed
in Haan and Sturm (2000). Other studies examining the relationship between aggregate
economic freedom are Dawson (1998), Hanson (2000), Ali and Crain (2001), Pitlik
(2002), Adkins, Moomaw, and Savvides (2002), and Carlsson and Lundstrom (2002).
A growing body of literature has explored the dynamics of entrepreneurship and the
policies and institutions that either hinder or spur this activity, and economic freedom
indices have been used to provide insight. On the international level, Bjornshov and Foss

11
(2008) looked at cross-country evidence using components of the Frasier Institute’s EFW
Index. They find a mixture of results, with the size of government being negatively
correlated and sound money being positively correlated with growth, and no significant
relationship with other components.
This relationship has also been studied within the United States. Using the EFNA
index, Kreft and Sobel (2005) find that entrepreneurial activity is significantly impacted
by the degree of economic freedom within a state. They argue that the relationship
between economic freedom and economic growth is entrepreneurship created by low
taxes, low regulations, and secure private property rights. These results are further
supported by a similar approach conducted in a working paper by Kreft.21
Other measures of well-being such as educational attainment, the environment,
and life expectancy in relation to economic freedom have been studied in Gwartney,
Lawson, Holcombe (1999), and Grubel (1998). The indices have also been used less
directly. Djankov, Gasner, McLiesh, Ramalho, and Schleifer (2008) used component data
from Heritage’s IEF and Frasier’s EFW to study the effects of corporate taxes on
investment and entrepreneurship. The effect of government’s ownership of banks in
Porta, Lopez-de-Silanes, Schliefer (2002) used data from the 1996 EFW.
Income inequality was examined in Berggren (1999) and Scully (2002) with
international indices, and Ashby and Sobel (2006) used the EFNA index to study this
within the U.S. states. A working paper by Boettke, Wright, Gordon, Ikeda, Leeson, and
Sobel of the Mercatus center cites the USEF index by the Pacific Research Center in their
21
Working paper from Kelley School of Business, Indiana University. Entrepreneurship and State Public
Policy

12
analysis of how cultural and institutional aspects contributed to the recovery of the U.S.
South after being severely damaged by Hurricane Katrina.
An important aspect to note at this point is that the construction of these indices,
especially the EFW created by Gwartney and Lawson, as well as Heritage’s IEF, have
changed and been updated throughout the last decade. The main controversy has been the
weights to apply to each component in order to create the aggregate index.
WEIGHTING:
Before the specific construction of these indices is covered, it is important to
discuss the general construction of this type of index and the issue of how much weight to
place on each data point or component. All of the economic freedom indices collect data
that is thought to define an element of economic freedom, and then this data is usually
grouped into a particular component. For instance, the Frasier Institute’s EFNA index
uses 10 data points such as government consumption spending, total tax revenue as
percentage of GDP, top marginal income tax rate, minimum wage legislation, etc. Then
they group these data points into 3 individual areas (components). From this point, they
aggregate the components into one score for each state to represent the level of economic
freedom. In this particular index, simple arithmetic averages are used within each
component and among them to compute the aggregate score.
The major point of contention is what weight to place on each component or each
data point within the components. As already cited, there have been a large number of
empirical studies that have used these indices to study the relationship between economic
freedom and other economic variables, mainly growth. Most have verified a positive

13
statistical relationship between economic freedom as measured and growth.
Underpinning these results is the accuracy in which the index used is capturing economic
freedom.
Berggren (2003) points out the apparent fact that the data points, components, as
well as the weighting schemes, have changed over the years in the various editions that
have been published. This alludes to the complexity and subjectivity of not only the
proper weight to use, but also what components should be used. This has created debate
on how much confidence we can place on the results from these studies.
The most comprehensive assessment and critique of the problems faced in the
aggregation procedure has been Heckelman and Stroup (2005). They recount the
evolution of the various weighting schemes that Gwartney and Lawson, authors of
Frasier’s EFW index, have used over the decade prior. One method surveyed a panel of
experts, asking which particular elements of freedom they thought would be more
important in determining a country’s degree of economic freedom, and assigned weights
to these elements based directly on the results of that survey. A separate method assumed
that each element (data point) was equally important, and used a weight for each element
that was the inverse of the standard deviation of that element across countries. They
initially favored the survey method, but in later editions switched back to the element
equality weights. In the 2000 edition, they used weights derived from the absolute value
of the first principal components of the elements. Beginning in the 2002 edition and
continuing to today, they turned to using simple averaging of the components, as well as
within the components.
14
In Heckelman and Stroup (2000), some of the elements of economic freedom
were not found to be significantly related to growth using bivariate and multivariate
regression analysis. While they found most elements had a statistically significant
positive relationship, they also found that some of the elements have a negative
relationship. Because of this opposite relationship, it is unclear how the empirical
analysis of the statistical relationship between the economic freedom index and growth
could be properly interpreted. An increased presence of economic freedom in any
specific element monotonically increases the overall value of the index but some
elements of the index can be shown to hamper growth while others promote it.
These indices are created to measure the institutional characteristics consistent
with economic freedom. Heckelman (2005) argues that measuring the quality of these
institutions depends on the intended purpose of them. If it is merely to measure the
intrinsic quality of economic freedom itself, then there is no need to compare the index
with other socio-economic variable. If the objective is to assess the quality of the
institutions as a means of some particular end, such as growth, then an interpretation of
the relative quality of these institutions depends upon the degree to which the objective
has been realized. Several studies as already mentioned have found no relationship and
even negative relationship with growth for a couple of the variables. The problem is that
allowing some variable values to subtract from the overall aggregate index would be
failing to accurately measure the value of economic freedom, and therefore, alter the
interpretation of the index.

15
The methodology used by the authors of The U.S Economic Freedom Index
published by the Pacific Research Institute is unique among the indices, and their
weighting is more complex. They construct the index in four major steps. First, they
compiled a set of indicators for economic freedom and created 5 data sets. Second, the
data sets were converted into 35 different indexes using different weighting techniques.
Third, the indexes were compared to each other in terms of its ability to explain human
migration across the 50 US states. Finally, the index with the greatest statistical link to
migration was chosen as the best and was used to rank the US states in terms of economic
freedom.
This index attempts to assign a valid weight to each component by using
something other than what it might be regressed against such as growth or GDP. Many
people migrate for many different reasons though, and it is difficult to control for these.
Also, net migration is likely to be highly correlated with most other measures of well-
being. Therefore, it is not clear that the aggregate index is not biased in a similar fashion
to Heckelman and Stroup (2000), which was simply assigning a weight to each
component on their ability to explain growth. Assigning greater weights to the
components that best explain growth and then running the aggregate against growth
though, biases the overall results in the direction that is being investigated. It is a ‘circular
thinking’ that is criticized in Sturm, Leertouwer, and Haan (2002).
All of the methods used thus far have shortcomings. Surveys are always
problematic, and there has been much criticism of the principle component methodology.
Heckelman (2005) sums up much of the thought on this type of weighting. They state

16
that, “while it allows the data to determine the weighting, it fails to reflect any conceptual
link between the economic theory behind the selection of the elements being aggregated
and the aggregate index value itself.”22 Principal component analysis may generate
negative weights, which means we can no longer interpret the aggregate index as
measuring overall economic freedom. This is because greater levels of a variable (that is
supposed to signify an aspect consistent with economic freedom) are given a negative
weight would actually reduce the aggregate index value.
The simple averaging approach has the advantage of simplicity and ease of
understanding, but it also has problems as it is arbitrary. It applies equal weight to each of
the components. However, considering that there are a different number of variables in
each component, this means unequal weight is given to each variable.
The many different weighting schemes have created different empirical results
when using an aggregate index. This is likely due to some of the elements in the
economic freedom index impacting the socio-economic variable of interest with very
different magnitudes, whether growth, entrepreneurship, or any other. With growth, some
have actually showed a negative relationship. This problem has been highlighted in
Heckelman and Stroup (2000) at the individual element (variable) level, and at the
component level in Carlsson and Lundstrom(2002).
22
From Heckelman and Stroup (2005)

17
CHAPTER TWO
INTERNATIONAL LEVEL
SUMMARY OF INDICES:
-The Index of Economic Freedom (IEF): The Heritage Foundation23
The IEF was an idea developed by The Heritage Foundation in the late 1980s and
was first published in 1994. Their goal was to develop a systematic, objective, and
empirical measurement of economic freedom in economies around the world.24 Their
methodology has gradually changed over the years as the data necessary for the
construction of the index has grown over the 15 years the index has been published. In
2007, they updated the basic scale for each component from a ranking of 1 to 5, with
lower scores reflecting more freedom, to a scale of 0 to 100, with higher scores reflecting
more freedom.
The index now covers 183 countries and measures 10 separate components of
economic freedom. As with all of the indices covered, the components are to provide a
portrait of a country’s economic policies and institutions, assigning a quantitative
measure that establishes benchmarks by which to gauge strengths and weaknesses with
regard to economic freedom. The 10 components are as follows:25
1. Business Freedom- This is to measure an individual’s right to create, operate,
and close an enterprise without interference from the state. The score is based
23
Full report can be found at http://www.heritage.org/index/ 24
View Executive Summary, 2009 Edition 25
Based off of 2009 Index, see Methodology appendix on page 441 of 2009 edition

18
on 10 factors, all weighted equally, using data from the World Bank’s Doing
Business study:
a. Starting a business- number of procedures
b. Starting a business- number of days
c. Starting a business- cost as percent of income per capita
d. Starting a business- minimum capital as percent of income per capita
e. Obtaining a license- number of procedures
f. Obtaining a license- number of days
g. Obtaining a license- cost as percent of income per capita
h. Closing a business- number of years
i. Closing a business- cost as percent of estate
j. Closing a business- recovery rate as cents on the dollar
2. Trade Freedom- This reflects the ability of a country to experience the gains
from trade created in an environment open to imports of goods and services
from abroad and for citizens to interact freely in the international marketplace.
The trade freedom score is based on 2 inputs:
a. The trade-weighted average tariff rate
b. Non-tariff barriers
3. Fiscal Freedom- The freedom of individuals and businesses to keep and
control their income and wealth for their own benefit and use. More than just
taking personal and corporate tax rates, they have aimed to take into account
other taxes that can be imposed. Governments impose taxes such as payroll,

19
sales, excise, tariffs, and value-added taxes. They attempt to capture these by
measuring total government revenues from all forms of taxation as a
percentage of total GDP. There are 3 factors used:
a. The top tax rate on individual income
b. The top tax rate on corporate income
c. Total tax revenue as a percentage of GDP
4. Government Size- This component is straight-forward and uses the level of
government expenditures as a percentage of GDP, and this includes
government consumption and transfers. They state that some level of
government expenditures represents true public goods, which would imply an
ideal level greater than zero, but they believe it is too difficult to apply
universally. Also, there are few countries, if any, that are below this level.
Therefore, they treat zero government spending as the benchmark.
Government expenditures necessarily compete with private agents and
interfere in market prices by over-stimulating demand and potentially
diverting resources through a crowding-out effect.
5. Monetary Freedom- Price stability and an assessment of price controls are
combined to measure monetary freedom. Price stability without
microeconomic intervention is the ideal state for the free market. The 2 inputs
are as follows:
a. The weighted average inflation rate for the most recent three years
b. Price controls

20
6. Investment Freedom- In a free market, capital will flow to its best use where it
is most needed, and therefore, areas that will likely produce the highest return.
Restrictions on foreign investment diminish this process and limits both
inflows and outflows of capital. There is a subjective nature to this measure.
They explore questions such as whether there is a foreign investment code that
defines the country’s investment laws and procedures; whether foreign
investment is encouraged through fair and equitable treatment of investors;
equal treatment for foreign firms as domestic firms under the law; etc. They
apply a score of either 100, 90, 80, 70, 60, 50, 40, 30, 20, 10, or 0.
7. Financial Freedom- This is a measure of banking security and the
independence from government control. The idea is that state ownership of
banks and other financial institutions such as insurers and capital markets is an
inefficient manner to regulate capital that reduces competition and generally
lowers the level of available services. The scoring is synonymous to that of
investment freedom, using criteria such as the extent of state intervention in
banks and other financial services, government influence on the allocation of
credit, and the difficulty of opening and operating financial services firms.
8. Property Rights- This is an assessment of the ability of individuals to
accumulate private property, which is an essential force in a market economy.
The rule of law is vital for a free market to function, as it provides confidence
for individuals to undertake commercial activities and save and invest for their
future well-being. This component is again scored as investment and financial

21
freedom, with a score of 100 being applied to a country where private
property is guaranteed by the government, the court system enforces contracts
efficiently, and the justice system punishes unlawfully confiscating private
property. Zero is applied to the other extreme, where private property is rarely
protected and property is mostly either directly or indirectly controlled by the
state.
9. Freedom from Corruption- This component is derived for most of the
countries by using the Transparency International’s Corruption Perceptions
Index (CPI), which gives a score of 0 to 10 and then they convert it over to the
0 to 100 scale. The idea with corruption is simply that the more it exists the
more it erodes economic freedom by introducing insecurity and uncertainty
into economic relationships.
10. Labor Freedom- This is measure of a country’s legal and regulatory
framework as it applies to the labor market. The easier individuals can move
in and out of occupations, the more efficiently labor moves to more
productive and higher valued work. There are 6 equally weighted factors in
this component:
a. Ratio of minimum wage to the average value added per worker
b. Hindrance to hiring additional workers
c. Rigidity of hours
d. Difficulty of firing redundant employees
e. Legally mandated notice period

22
f. Mandatory severance pay
The authors of IEF point out that they apply an equal weight to each of the 10
components so that the overall score will not be biased toward any one component or
policy direction. They state that the purpose of the index is to reflect the economic
environment in every country surveyed in as balanced a way as possible. This is the same
view that the authors of the EFW index take in their latest edition, which will be
examined next.
-Economic Freedom of the World Index (EFW): The Frasier Institute26
The objective of the EFW published by the Frasier Institute is the same as the
IEF. They define as consistent with economic freedom, institutions and policies that
provide an infrastructure for voluntary exchange and protect individuals and their
property from aggressors. In order to achieve a high EFW rating, a country must provide
secure protection of privately owned property, even-handed enforcement of contracts,
and a stable monetary environment. They also must keep taxes low, refrain from creating
barriers to both domestic and international trade, and rely more fully on markets rather
than the political process to allocate goods and resources.
The EFW was first published around the same time as the IEF, only a couple of
years later in 1996. It has been published annually since 2000. The authors state that the
index is based on 3 important methodological principles. First, objective components are
always preferred to those that involve surveys or value judgments. This said, they felt in
necessary to use data based on surveys due to the importance of legal and regulatory
26
Full report can be found at http://www.freetheworld.com/release.html

23
institutions where the appropriate objective data is difficult to ascertain. Second, on that
same theme, the data used to construct the index ratings are from external sources such as
the IMF, World Bank, and World Economic Forum that provide data for a large number
of countries. Third, transparency is present throughout.
The 2009 edition of the index covers 141 countries, and is constructed by using
42 data points that are grouped into 5 major components. Each component score is
converted into a scale between 0 to 10, a higher score reflecting more economic freedom,
and each are equally weighted to compute the overall score. They have also created a
chain-linked summary index that is useful for comparison over a longer time frame. The
components are as follows:27
1. Size of Government: Expenditures, Taxes, and Enterprises- This is to measure
the extent to which countries rely on the political process to allocate resources
and goods and services. It is made up of 4 sub-components:
a. General government consumption spending as a percentage of total
consumption
b. Transfers and subsidies as a percentage of GDP
c. Government enterprises and investment
d. Top marginal tax rate
i. Top marginal income tax rate
ii. Top marginal income and payroll tax rates
27
See chapter 1 of 2009 annual report

24
2. Legal Structure and Security of Property Rights- This component is to
measure the rule of law and the extent to which property is protected. The data
used is from surveys by the Global Competitive Report, the International
Country Risk Guide, and Doing Business. The subcomponents are:
a. Judicial Independence
b. Impartial Courts
c. Protection of property rights
d. Military interference in rule of law and the political process
e. Integrity of the legal system
f. Legal enforcement of contracts
g. Regulatory restrictions on the sale of real property
3. Access to Sound Money- This is very similar to a combination of IEFs
monetary freedom and investment freedom. Inflation or instability in the
money supply can undermine gains from trade, and this component is to
gauge the extent of this aspect. It is broke into 4 subcomponents:
a. Money Growth
b. Standard deviation of inflation
c. Inflation: Most recent year
d. Freedom to own foreign currency bank accounts
4. Freedom to Trade International- This is straight-forward, gains from trade are
the essence of growth and vital to economic freedom. This especially applies

25
to international markets due to the increase in specialization in various parts of
the world. This is created using 5 subcomponents:
a. Taxes on international trade
i. Revenues from trade taxes as percent of trade sector
ii. Mean tariff rate
iii. Standard deviation of tariff rates
b. Regulatory trade barriers
i. Non-tariff trade barriers
ii. Compliance cost of importing and exporting
c. Size of trade sector relative to expected
d. Black-market exchange rates
e. International capital market controls
i. Foreign ownership and investment restrictions
ii. Capital controls
5. Regulation of Credit, Labor, and Business- This component captures many
aspects of the environment of regulation. Regulation can in many ways be
helpful to economic freedom when it contributes to more clearly defined
property rights and a functioning market, but in most cases regulation tends to
go further than this. The more regulations a country has in place is likely to
restrict entry into markets and reduce the freedom to engage in the
marketplace, and therefore, reduce economic freedom. This area is made up
with 3 subcomponents that contain 17 data points:

26
a. Credit market regulation
i. Ownership of banks
ii. Foreign bank competition
iii. Private sector credit
iv. Interest rate controls/negative real interest rates
b. Labor market regulations
i. Minimum wage
ii. Hiring and firing regulations
iii. Centralized collective bargaining
iv. Mandated cost of hiring
v. Mandated cost of worker dismissal
vi. Conscription
c. Business regulations
i. Price controls
ii. Administrative requirements
iii. Bureaucracy costs
iv. Starting a business
v. Extra payments/ bribes
vi. Licensing restrictions
vii. Cost of tax compliance

27
COMPARISON AND ANALYSIS:
In the most recent editions as described, it is apparent that both indices are similar
in many aspects. Table 2.1 is a summary of the similarities in construction. Both have the
same idea of what economic freedom entails; low regulation, low taxes, a stable
monetary environment, labor mobility, secure private property, ease in starting a
business, etc. Each index uses straight averaging in order to aggregate each component
and then again for the overall score.
Both indices have made some changes since their inception, Frasier’s EFW more
so than IEF. As already mentioned, EFW has experimented with various weighting
schemes and have increased the number of data points and components. Heritage has
maintained a more consistent methodology, but has changed the scale of rating. They had
formerly used a 1-5 point scale, which was criticized as obscuring important differences
among nations, but have now changed this to a 0-100 scale. EFW uses a 0-10 scale, but is
continuous (uses decimals) and therefore is just as rich. When making updates, EFW has
updated their past data to allow for comparison over time. They both appear to have
settled on a consistent method over the last few years. Also, in previous studies using
these indices, EFW was missing many data points, but with time they have been able to
fill this gap in data.
Table 2.1 clearly displays that there is great overlap and similarities between the
indices in regard to what should be included. The only direct component that differs
between the indices is the Freedom from Corruption that is used in the IEF, but not
accounted for in EFW.

28
Table 2.1: Similarities between EFW and IEF Economic Freedom of the World Index of Economic Freedom 1.Size of Government -General Gov’t consumption as % of total consumption -Transfers and subsidies as % of GDP -Gov’t enterprise and investment -Top marginal tax rate -Top marginal tax rate -Top marginal income and payroll tax rates
3.Fiscal Freedom -Top tax rate on individual income -Top tax rate on corporate income -Total tax revenue as % of GDP 4.Government Size -Gov’t expenditures as % of GDP
2.Legal Structure and Security of Property Rights -Judicial independence -Impartial courts -Protection of property rights -Military interference in rule of law/politics -Integrity of the legal system -Legal enforcement of contracts -Regulatory restrictions on the sale of real estate
8.Property Rights
3.Access to Sound Money -Money growth -Standard deviation of inflation -Inflation in most recent year -Freedom to own foreign currency bank accounts
5.Monetary Freedom -Weighted average inflation rate (3 most recent years) -Price controls 6.Investment Freedom
4.Freedom to Trade Internationally -Taxes on international trade -Regulatory trade barriers -Size of trade sector relative to expected -Black market exchange rates -International capital market controls
2. Trade Freedom -Trade-weighted average tariff rate -Non-tariff barriers
5.Regulation of Credit, Labor, and Business -Credit market regulations -Labor market regulations -Business regulations
7.Financial Freedom 10.Labor Freedom 1.Business Freedom
29
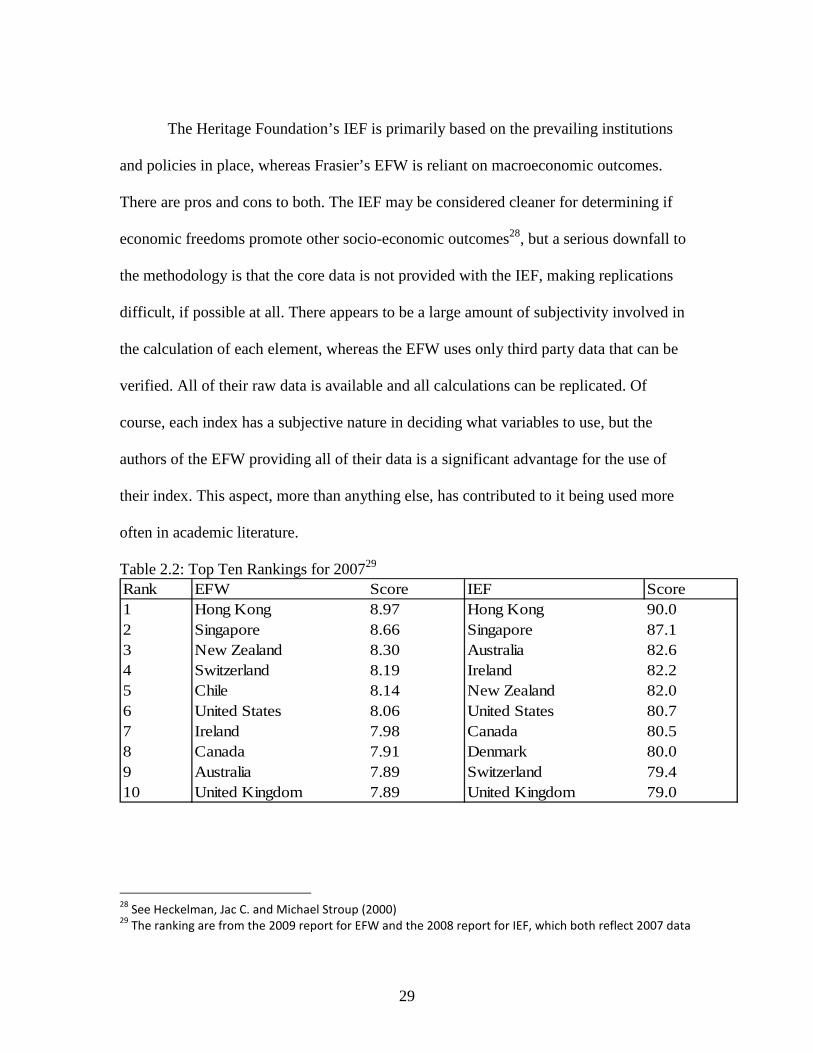
The Heritage Foundation’s IEF is primarily based on the prevailing institutions
and policies in place, whereas Frasier’s EFW is reliant on macroeconomic outcomes.
There are pros and cons to both. The IEF may be considered cleaner for determining if
economic freedoms promote other socio-economic outcomes28, but a serious downfall to
the methodology is that the core data is not provided with the IEF, making replications
difficult, if possible at all. There appears to be a large amount of subjectivity involved in
the calculation of each element, whereas the EFW uses only third party data that can be
verified. All of their raw data is available and all calculations can be replicated. Of
course, each index has a subjective nature in deciding what variables to use, but the
authors of the EFW providing all of their data is a significant advantage for the use of
their index. This aspect, more than anything else, has contributed to it being used more
often in academic literature.
Table 2.2: Top Ten Rankings for 200729 Rank EFW Score IEF Score1 Hong Kong 8.97 Hong Kong 90.02 Singapore 8.66 Singapore 87.13 New Zealand 8.30 Australia 82.64 Switzerland 8.19 Ireland 82.25 Chile 8.14 New Zealand 82.06 United States 8.06 United States 80.77 Ireland 7.98 Canada 80.58 Canada 7.91 Denmark 80.09 Australia 7.89 Switzerland 79.410 United Kingdom 7.89 United Kingdom 79.0
28
See Heckelman, Jac C. and Michael Stroup (2000) 29
The ranking are from the 2009 report for EFW and the 2008 report for IEF, which both reflect 2007 data

30
Table 2.3 displays some general correlation statistics of the indices since the year
2000. The IEF covers more countries than EFW, so all countries not covered by the EFW
were dropped out of the comparison. Also, aggregate component scores are missing for
some countries in both indices, and those countries were dropped as well. This left 117
countries covering 8 years from the year 2000 through 2007.
Table 2.3: Correlation Statistics Overall Correlation Correlation with IEF Lag Correlation with EFW Lag
2000-07 0.868 EFW IEF EFW IEF2007 0.891 2001-07 0.859 2000-06 2000-06 0.875 2001-072006 0.893 2007 0.885 2006 2006 0.893 20072005 0.900 2006 0.881 2005 2005 0.908 20062004 0.898 2005 0.891 2004 2004 0.899 20052003 0.872 2004 0.882 2003 2003 0.879 20042002 0.863 2003 0.856 2002 2002 0.881 20032001 0.850 2002 0.844 2001 2001 0.865 20022000 0.827 2001 0.834 2000 2000 0.837 2001
Corr. w/o Corruption OECD Correlation Standard Deviation2000-07 0.841 2000-07 0.853 Both Indices 2000-07 9.71
2007 0.890 2007 0.8902006 0.874 2006 0.902 EFW 2000-07 9.032005 0.886 2005 0.929 Min 28.902004 0.871 2004 0.875 Max 89.702003 0.831 2003 0.8532002 0.837 2002 0.911 IEF 2000-07 9.982001 0.818 2001 0.897 Min 29.452000 0.778 2000 0.805 Max 89.97
The two indices have not been as highly correlated as expected, but have become
more so over the last decade. It is not clear why this is the case, and without the raw data
being provided by Heritage’s IEF, it is difficult to investigate fully. I suspect that this has
been a result of data collection more than methodology. On the part of both indices, data
has become more readily available, which has allowed fewer gaps in the component

31
scores. With regard to the IEF, the data collection has been less transparent and with the
raw data not provided, it is likely they have modified their data collection due to criticism
and honest improvements. It is proposed here that these two aspects have led to the
convergence. The correlation over the last four years has been consistent and stable at .89
to .90.
As presented in Table 2.3, the indices were compared in several different manners
in an attempt to determine whether the difference in the last several years, determined by
the correlation, results more from differences in data collection or in aggregation
methodology. The timing of the data was addressed by running the correlation with a lag.
When each index is published, they determine some cutoff date in which the data they
have will be applied, but they have numerous sources and all of which publish their data
at different times. The correlation remained between .88 and .90 with each index lagged
for one year.
A challenge to any index is the accuracy and reliability of the data collected. It
seems reasonable to expect that data collected from developed countries or more
democratic countries would be more reliable than underdeveloped or autocratic countries.
To explore the sensitivity of this aspect, a correlation is calculated between the indices
using only OECD30 member countries. There is no overall increase in the correlation over
this time period. There is a more significant difference during 2001 through 2003, but this
dissipates after that period and there is very little difference over the last 4 years,
suggesting that imperfections in the data collection may have improved.
30
Organization for Economic Cooperation and Development

32
As already stated, another aspect explored was the observation that the IEF
contains a corruption component, whereas this is not directly addressed in the EFW. The
significance of this is examined by determining the correlation between the indices after
dropping the corruption component. The correlation remains similar, but is reduced a
small amount, implying that the corruption component provides some strength to the
index. The trend throughout the observation period remains the same, but the corruption
component does have a depressing affect on the IEF index and contributes to its lower
score on average over this time period.
Figure 2.1: Overall Index Scores over 2000-2007
Figure 2.2: Standard Deviation over 2000-2007

33
Figure 2.3: Guyana Index Score (One of the most volatile countries in sample)
A glance at the correlation results also seem to show that while there was an
increase in the correlation through most of the period, there was a bounce up during the
2003-2004 periods, and the correlation has stayed fairly level since then. Both indices
have been modified some throughout this period, but IEF does not have the labor
freedom component prior to 2005. This area is a major component for both indices, and
the addition of this has created a more stable correlation between the two.
Figure 2.4: Iran Index Scores
34
MODEL AND DATA:
As already noted, growth and economic freedom have been found to be highly
correlated in most studies that have used the aggregate economic freedom score. Most of
these studies have used data from the 1990s. Carlsson and Lundstrum (2002) explored the
relationship further by testing a model using the individual components of the EFW
index. They found that not all of the components are positively correlated with growth,
including the size of government and freedom to trade internationally. Several of the
studies that tested short term causality suggested that the size of government component
didn’t precede growth, but that growth may cause a larger size of government.
In order to investigate these indices further, several regression models were
specified that are similar to those used in Dawson (1998) and Carlsson and Lundstrum
(2002). The aim is to inquire at whether these results can be supported by using more
recent data, and whether the results are sensitive to what index is used. An additional step
is also taken by recalculating each index after dropping a component. It is thought that
this can provide insight into whether the component dropped adds or detracts from the
overall index, and explain whether a particular component is driving most of the results
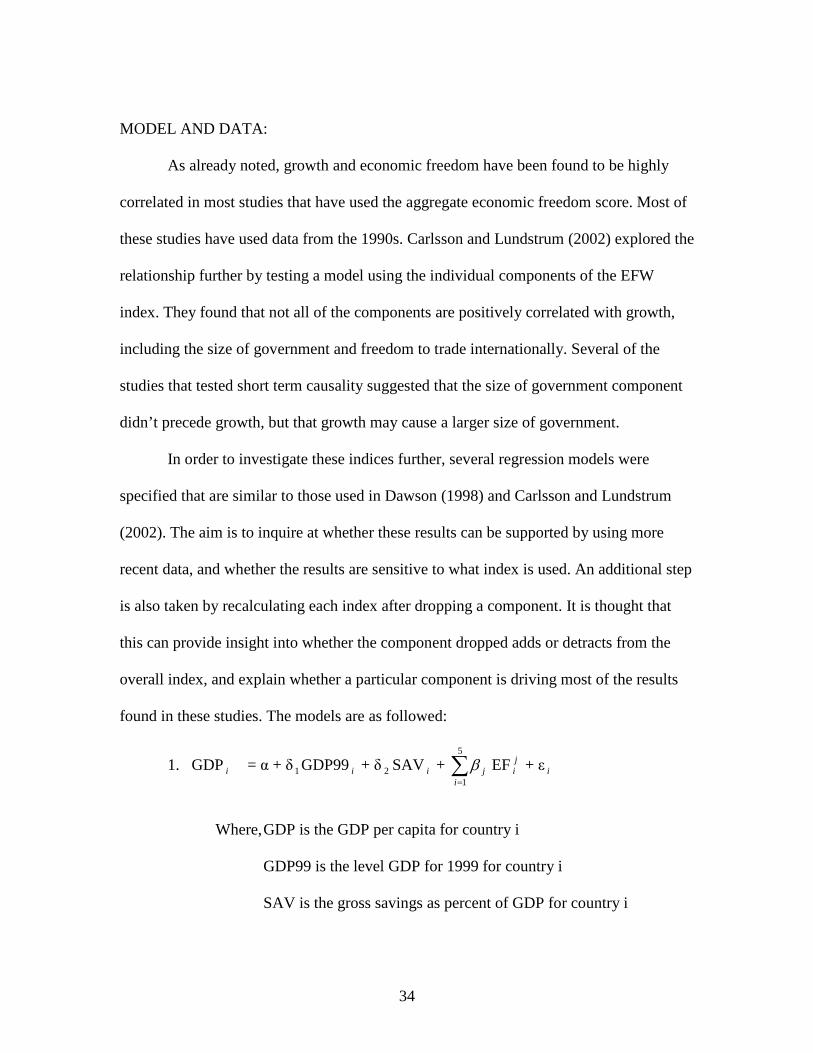
found in these studies. The models are as followed:
1. GDPi = α + δ 1GDP99i + δ 2 SAV i + ∑=
5
1ijβ EF j
i + ε i
Where, GDP is the GDP per capita for country i
GDP99 is the level GDP for 1999 for country i
SAV is the gross savings as percent of GDP for country i

35
EF is the component score assigned to country i for component j
(The same model was specified using IEF and EFW components)
2. G i = α + δ 1GDP99i + δ 2 SAV i + ∑=
5
1ijβ CEF j
i + ε i
Where, G is the growth rate for country i
CEF is the change in the component j score
3. GDPi = α + δ 1GDP99i + δ 2 SAV i + β EFWi + ε i
This is repeated substituting EFW-1, EFW-2, EFW-3, EFW-4, and EFW-5
Where, EFW-1 is the aggregate score without the Size of Government
EFW-2 is the aggregate score without Property Rights
EFW-3 is the aggregate score without Sound Money
EFW-4 is the aggregate score without International Trade
EFW-5 is the aggregate score without the Regulation component
(The model was also specified using the IEF scores in place of the EFW)
Where, IEF-1 is the aggregate score without the Business Freedom
This is continued with each of the 10 IEF components.
4. G i = α + δ 1GDP99i + δ 2 SAV i + β CEFWi + ε i
This is also repeated substituting CEFW-1, CEFW-2, CEFW-3, CEFW-4,
and CEFW-5 for each component removed from the EFW.
Where, CEFW is the change in the aggregate score
(The same definitions and model were conducted for the IEF)

36
The data used in the regressions cover the year 2000-2006. Ideally, a longer time
period could be used, but the objective is to provide a direct comparison between these
two indices and this is the time frame that annual scores have been produced for both.
The indexes cover up to 2007, but data for the dependent variables, GDP per capita and
growth rates, as well as the control variable, gross saving, could not be obtained for 2007.
In addition to having annual scores for both indices during this period, there are no gaps
in the index data during these periods. This seven year period allowed for 722
observations using GDP and 615 using growth.
Table 2.4: Summary Statistics GDP p/ Capita Growth 1999 GDP (mil) Gross Savings EFW CEFW IEF CIEF
Min 32.97 -15.31 200 -40.21 2.89 -20.96 29.45 -14.90Max 81982.22 95.28 9417100 57.59 8.97 18.47 89.97 18.82
Std Dev. 15403.44 4.58 991063 9.51 0.90 3.50 9.98 3.50
The index data was from their respective websites. The GDP and growth data are
from the ERS International Macroeconomic data set provided by the United States
Department of Agriculture. The rest of the data was gathered from the World
Development Indicators 2008 provided from the World Bank.
37
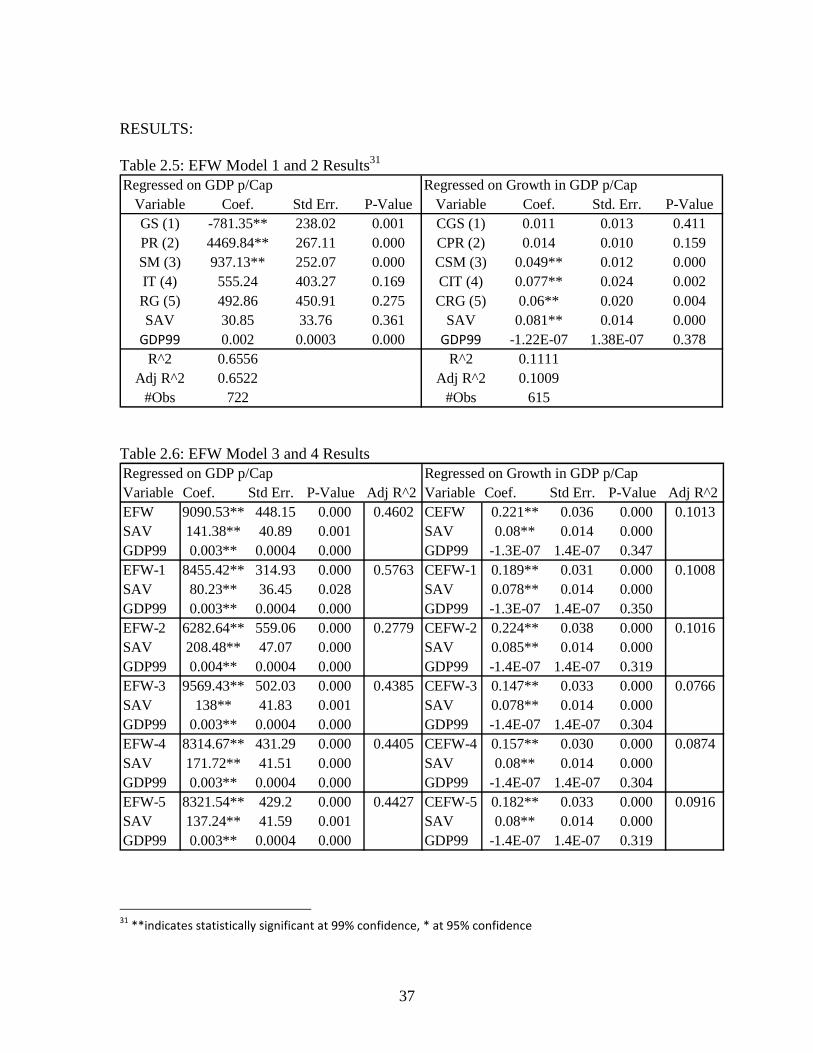
RESULTS:
Table 2.5: EFW Model 1 and 2 Results31 Regressed on GDP p/Cap Regressed on Growth in GDP p/Cap
Variable Coef. Std Err. P-Value Variable Coef. Std. Err. P-ValueGS (1) -781.35** 238.02 0.001 CGS (1) 0.011 0.013 0.411PR (2) 4469.84** 267.11 0.000 CPR (2) 0.014 0.010 0.159SM (3) 937.13** 252.07 0.000 CSM (3) 0.049** 0.012 0.000IT (4) 555.24 403.27 0.169 CIT (4) 0.077** 0.024 0.002RG (5) 492.86 450.91 0.275 CRG (5) 0.06** 0.020 0.004SAV 30.85 33.76 0.361 SAV 0.081** 0.014 0.000
GDP99 0.002 0.0003 0.000 GDP99 -1.22E-07 1.38E-07 0.378R^2 0.6556 R^2 0.1111
Adj R^2 0.6522 Adj R^2 0.1009#Obs 722 #Obs 615
Table 2.6: EFW Model 3 and 4 Results Regressed on GDP p/Cap Regressed on Growth in GDP p/CapVariable Coef. Std Err. P-Value Adj R^2 Variable Coef. Std Err. P-Value Adj R^2EFW 9090.53** 448.15 0.000 0.4602 CEFW 0.221** 0.036 0.000 0.1013SAV 141.38** 40.89 0.001 SAV 0.08** 0.014 0.000GDP99 0.003** 0.0004 0.000 GDP99 -1.3E-07 1.4E-07 0.347EFW-1 8455.42** 314.93 0.000 0.5763 CEFW-1 0.189** 0.031 0.000 0.1008SAV 80.23** 36.45 0.028 SAV 0.078** 0.014 0.000GDP99 0.003** 0.0004 0.000 GDP99 -1.3E-07 1.4E-07 0.350EFW-2 6282.64** 559.06 0.000 0.2779 CEFW-2 0.224** 0.038 0.000 0.1016SAV 208.48** 47.07 0.000 SAV 0.085** 0.014 0.000GDP99 0.004** 0.0004 0.000 GDP99 -1.4E-07 1.4E-07 0.319EFW-3 9569.43** 502.03 0.000 0.4385 CEFW-3 0.147** 0.033 0.000 0.0766SAV 138** 41.83 0.001 SAV 0.078** 0.014 0.000GDP99 0.003** 0.0004 0.000 GDP99 -1.4E-07 1.4E-07 0.304EFW-4 8314.67** 431.29 0.000 0.4405 CEFW-4 0.157** 0.030 0.000 0.0874SAV 171.72** 41.51 0.000 SAV 0.08** 0.014 0.000GDP99 0.003** 0.0004 0.000 GDP99 -1.4E-07 1.4E-07 0.304EFW-5 8321.54** 429.2 0.000 0.4427 CEFW-5 0.182** 0.033 0.000 0.0916SAV 137.24** 41.59 0.001 SAV 0.08** 0.014 0.000GDP99 0.003** 0.0004 0.000 GDP99 -1.4E-07 1.4E-07 0.319
31
**indicates statistically significant at 99% confidence, * at 95% confidence

38
Table 2.7: IEF Model 1 and 2 Results Regressed on GDP p/Cap Regressed on Growth in GDP p/Cap
Variable Coef. Std Err. P-Value Variable Coef. Std. Err. P-ValueBF (1) -36.75 29.09 0.207 CBF (1) -0.0046 0.016 0.767TF (2) 123.38** 20.87 0.000 CTF (2) -0.0003 0.0016 0.869FF (3) -161.26** 22.05 0.000 CFF (3) 0.0075 0.0178 0.673GS (4) -78.84** 15.20 0.000 CGS (4) -0.0004 0.0051 0.936MF (5) 58.35* 25.54 0.023 CMF (5) 0.0284* 0.0129 0.028IF (6) -53.09** 19.55 0.007 CIF (6) 0.0123 0.0082 0.132FiF (7) -18.21 17.93 0.310 CFiF (7) 0.0025 0.0055 0.650PR (8) 78.55** 23.30 0.001 CPR (8) 0.0125 0.0112 0.269FfC (9) 337.1** 24.71 0.000 CFfC (9) -0.0026 0.0059 0.665LF (10) removed n/a n/a CLF (10) removed n/a n/aSAV 42.09 25.79 0.103 SAV 0.083** 0.015 0.000
GDP99 0.002** 0.0004 0.000 GDP99 -1.76E-07 1.42E-07 0.216R^2 0.8087 R^2 0.0665
Adj R^2 0.8057 Adj R^2 0.0495#Obs 722 #Obs 615

39
Table 2.8: IEF Model 3 and 4 Results Regressed on GDP p/Cap Regressed on Growth in GDP p/CapVariable Coef. Std Err. P-Value Adj R^2 Variable Coef. Std Err. P-Value Adj R^2IEF 832.04** 41.56 0.000 0.4551 CIEF 0.0907* 0.0365 0.013 0.0553SAV 152.75** 41.04 0.000 SAV 0.0816** 0.0145 0.000GDP99 0.0032** 0.0004 0.000 GDP99 -2E-07 1.4E-07 0.201IEF-1 805.82** 42.66 0.000 0.4328 CIEF-1 0.0886** 0.0335 0.008 0.0566SAV 164.22** 41.83 0.000 SAV 0.0824** 0.0145 0.000GDP99 0.0034** 0.0004 0.000 GDP99 -2E-07 1.4E-07 0.210IEF-2 770.43** 41.8 0.000 0.4236 CIEF-2 0.089* 0.0347 0.0110.056SAV 149.64** 42.24 0.000 SAV 0.0821** 0.0145 0.000GDP99 0.0034** 0.0004 0.000 GDP99 -2E-07 1.4E-07 0.192IEF-3 821.53** 34.22 0.000 0.5290 CIEF-3 0.0869** 0.0335 0.010 0.0562SAV 146.12** 38.14 0.000 SAV 0.0814** 0.0145 0.000GDP99 0.0029** 0.0004 0.000 GDP99 -2E-07 1.4E-07 0.202IEF-4 790.51** 30.27 0.000 0.5645 CIEF-4 0.0809* 0.0329 0.014 0.0552SAV 134.05** 36.71 0.000 SAV 0.0827** 0.0145 0.000GDP99 0.0028** 0.0004 0.000 GDP99 -2E-07 1.4E-07 0.203IEF-5 778.01** 39.72 0.000 0.4465 CIEF-5 0.0664* 0.0320 0.038 0.0525SAV 154.4** 41.35 0.000 SAV 0.0818** 0.0145 0.000GDP99 0.003** 0.0004 0.000 GDP99 -2E-07 1.4E-07 0.203IEF-6 861.13** 44.10 0.000 0.4455 CIEF-6 0.0742* 0.0365 0.043 0.0522SAV 141.81** 41.46 0.000 SAV 0.0808** 0.0145 0.000GDP99 0.003** 0.0004 0.000 GDP99 -2E-07 1.4E-07 0.216IEF-7 889.71** 45.33 0.000 0.4473 CIEF-7 0.0868* 0.0384 0.024 0.0537SAV 126.12** 41.48 0.002 SAV 0.0804** 0.0145 0.000GDP99 0.0032** 0.0004 0.000 GDP99 -2E-07 1.4E-07 0.193IEF-8 779.9** 49.69 0.000 0.3678 CIEF-8 0.0685 0.0350 0.0510.0517SAV 179.92** 44.12 0.000 SAV 0.0813** 0.0145 0.000GDP99 0.0037** 0.0004 0.000 GDP99 -2E-07 1.4E-07 0.200IEF-9 722.57** 50.27 0.000 0.3406 CIEF-9 0.0828* 0.0354 0.020 0.0542SAV 195.97** 45.01 0.000 SAV 0.0814** 0.0145 0.000GDP99 0.0039** 0.0004 0.000 GDP99 -2E-07 1.4E-07 0.200IEF-10 830.22** 40.92 0.000 0.4603 CIEF-10 0.098** 0.0364 0.007 0.0570SAV 153.38** 40.83 0.000 SAV 0.0815** 0.0145 0.00GDP99 0.0033** 0.0004 0.000 GDP99 -2E-07 1.4E-07 0.211
The first observation of these results is that the overall economic freedom index,
whether EFW or IEF, is positively correlated with GDP and growth. The measure of
fitness between with EFW and IEF and GDP is close, with an adjusted R-squared of .46

40
using the EFW and .455 with IEF, suggesting that the model explains roughly 46 percent
of the variation in GDP per capita. The model suggest that a one unit increase in the EFW
leads to a $9000 increase in GDP per capita, and a 10 point increase in the IEF (which is
equivalent to one point in the EFW) leads to $8300 increase in GDP per capita. This
positive correlation is consistent with past literature.
Separating the indices into each component explains even more of the variation,
but consistent with the results found in Carlsson and Lundstrum (2002) and Heckelman
and Stroup (2000), some of the components that make up the index are found to be
negative. As displayed in Table 2.1, the Size of Government component in the EFW is
equivalent to the Fiscal Freedom and Government Size components of the IEF, and with
both indices, a negative coefficient is found with these in relation to GDP per capita, and
they are statistically significant. This is further supported when looking at the adjusted R-
squared of the indices after a component had been dropped. With both the EFW and IEF,
the stronger model, as measured by the adjusted R-squared, is after the government size
components are dropped.
A change in the aggregate indices are found to be statistically significant to
growth, but the explanatory power of the models is clearly weaker. Also, a change in
government size is not found to be significant to growth in this case. Property rights and
legal structure is clearly the area that has the largest impact. It is clear from the results
that property rights are crucial. The property rights component has the largest coefficient
with the EFW in Model 1, and also the model is weakest when that component was
removed.

41
Heckelman (2005) suggested that when using an economic freedom index in
empirical work, especially in relation to growth, we should be careful in our
interpretation of the aggregate score, and that the components or data points should be
analyzed separately. This is because some of the components have a negative coefficient.
The results here support this conclusion.
The results with government size are somewhat surprising. Although the
coefficient suggest that the economic significance of this component is much less than
most of the other components, it is still hard to believe that an increase in government
size would lead to an increase in prosperity. An explanation of the government size
component though, is that the causal relationship is reversed. This is what was found in
Heckelman (2000), which was that the short-run causal relationship between government
intervention and growth was that growth preceded government intervention. Although the
causal relationship is not being examined directly, these results are consistent with this.
In Peltzman (1980), it was hypothesized that the leveling of income differences,
basically the growth of the middle class, was a major source of the growth of
government. This theory would indicate that wealthy developed nations can afford and
demand more redistribution through government. Therefore, higher growth may lead to a
larger size of government, but it is not suggested that this is beneficial to long term
growth.
The range of countries used in the sample varies greatly, from wealthy societies
such as the U.S. and Europe to poorer nations such as Zimbabwe. It is suggested that the
increase demand for more government is less likely to hold within countries that already

42
have large governments. To investigate this further, Models 1 and 2 with the EFW are
reran, but using only countries that have a GDP per capita over $30,000 as of 2007.
Table 2.8 displays the results when using only these countries. With many fewer
observations, the model is weaker. The results indicate that the relationships are sensitive
to the sample selection. The sign doesn’t change on the government size component, but
it is no longer statistically significant. This will also be tested further when economic
freedom among the U.S states is examined.
Table 2.9: EFW Model 1 and 2 Results (Only Wealthy Nations)32 Regressed on GDP p/Cap Regressed on Growth in GDP p/Cap
Variable Coef. Std Err. P-Value Variable Coef. Std. Err. P-ValueGS (1) -780.37 543.82 0.154 CGS (1) -0.0063 0.0112 0.576PR (2) 2840.48** 856.64 0.001 CPR (2) -0.0454 0.0289 0.120SM (3) -10109.68** 3679.15 0.007 CSM (3) -0.1536 0.1406 0.277IT (4) -2268.34* 1072.26 0.036 CIT (4) 0.016 0.0493 0.746RG (5) 2080.84 1178.51 0.080 CRG (5) 0.0626* 0.0312 0.048SAV 358.3** 110.36 0.002 SAV -0.0744** 0.0273 0.008
GDP99 0.0003 0.0003 0.344 GDP99 -1.57E-07* 7.18E-08 0.031R^2 0.3862 R^2 0.1506
Adj R^2 0.3501 Adj R^2 0.0912#Obs 127 #Obs 108
32
Only Countries with at least $30,000 in GDP per capita in 2007 are included.

43
CHAPTER THREE
NATIONAL LEVEL
SUMMARY OF INDEX:
-Economic Freedom of North America (EFNA): The Frasier Institute
The EFNA index was first published in 2002 and The Frasier Institute is now on
the 5th edition of the index. It covers the United States and Canada, and in the last edition,
includes Mexico where data collection has proved more difficult. In this study, only the
rating of U.S. States will be analyzed. The index rates economic freedom on a 10 point
scale, just as their international index, and at two levels, the sub-national and the all-
government. The aim of the all-government level is to capture the impact of restrictions
on economic freedom by all levels of government (federal, state/provincial, and
municipal/local), and the sub-national includes the impact of only state/provincial and
local governments. The impact of economic freedom at the all-government level is
greater than the impact at the sub-national level because it captures a broader range of
limitations on economic freedom.
The theory of economic freedom at the national or regional level is no different
than that already covered at the international level, but different components to proxy
economic freedom have been used. The authors of the EFNA have used a very similar
approach for this index as was used on the international level with EFW, but some
aspects had to be changed or left out. Some categories of the world index had too little
variance from one jurisdiction to another at this level. The stability of the legal system,

44
which is used in EFW, does not differ much among the U.S. states. The same can be said
for private ownership of banks, avoidance of negative interest rates, monetary policy, the
freedom to own foreign currency, the right to international exchange, structure of capital
markets, and black-market exchange rates.
Table 3.1: U.S. Rankings33 Rank State Score Rank State Score1 Delaware 8.5 44 Alaska 6.42 Texas 7.8 44 New York 6.45 Colorado 7.6 45 Vermont 6.35 Georgia 7.6 46 Rhode Island 6.25 North Carolina 7.6 47 Hawaii 6.17 Nevada 7.5 48 Montana 6.07 New Hamphire 7.5 48 New Mexico 6.010 Indiana 7.4 49 Maine 5.810 Tennessee 7.4 49 Mississppi 5.810 Utah 7.4 50 West Virginia 5.3
The index has 10 data points that are grouped into 3 major components. Each data
point is equally weighted within the component and each component is equally weighted.
The areas are as follows:
1. Size of Government
a. General consumption expenditures by government as a percentage of
GDP
b. Transfers and subsidies as a percentage of GDP
c. Social security payments as a percentage of GDP
2. Takings and Discriminatory Taxation
a. Total tax revenue as a percentage of GDP
33
Based on 2008 report. For full report see www.freetheworld.com/efna.html

45
b. Top marginal income tax rate and the threshold at which it applies
c. Indirect tax revenue as a percentage of GDP
d. Sales taxes collected as a percentage of GDP
3. Labor Market Freedom
a. Minimum wage legislation
b. Government employment as a percentage of total state employment
c. Union Density
Figure 3.1: U.S. Over Time34
MODEL AND DATA:
In the 2008 Annual Report of the EFNA, Karabegovic and McMahon run several
regressions using the aggregate EFNA score with relationship to GDP and growth among
the U.S. States and Canadian Provinces. Building off of their analysis and in the same
approach taken with the international indices, this aggregate index will be reduced to its
components and regressed against GDP and growth.
34
Average Score is used for EFW during years 1995-2000. EFNA is average of all state scores at All-
Government level

46
The same linear regression models that were tested on the international level are
specified again, but now using the EFNA index. The control variables are the level GDP
at the beginning of the period, which was used previously, and the percentage of a state’s
population 25 years or older that has attained at least a high school diploma (HG).
Data was collected for the time period of 1990 through 2005. The index
component data is provided through the Frasier Institute’s website. GDP and growth data
were gathered from the Bureau of Economic Analysis. The educational attainment data
was published by the Digest of Education Statistics and found through the National
Center for Education Statistics.
Table 3.2: Summary Statistics GDP p/Capita Growth EFNA CEFNA HG GDP89
Min 18094 -0.13 4.90 -0.11 64.30 10702Max 59520 0.11 8.50 0.08 90.27 734406
Std Dev. 6585 0.02 0.57 0.02 5.35 130270
Examining economic freedom within the U.S. provides a couple of advantages
over international studies. First, the data is much fuller, and the time period examined can
be longer. Second, because of the relative stability and similarities among the states, the
results are much less prone to be affected by outliers and turbulent economic conditions
that many third world countries produce.
RESULTS:
The results are presented in Table 3.3 and Table 3.4. Again, economic freedom is
significantly correlated to GDP per capita, and an increase in economic freedom
correlates with an increase in growth. What is different from the international results is

47
that each component is positively correlated, with the exception that the labor freedom
component is not statistically significant when regressed to GDP per capita.
Table 3.3: Models 1 and 2 Results35 Regressed on GDP p/Cap Regressed on Growth in GDP p/Cap
Variable Coef. Std Err. P-Value Variable Coef. Std. Err. P-ValueGS (1) 2441.25** 240.54 0.000 CGS (1) 0.5137** 0.0286 0.000TT (2) 1635.39** 235.31 0.000 CTT (2) 0.0404** 0.0142 0.005LF (3) -106.64 332.95 0.749 CLF (3) 0.1085** 0.0366 0.003HG 617.22** 32.82 0.000 HG -0.0004** 0.0001 0.004
GDP89 0.0108** 0.0014 0.000 GDP89 -8.19E-09 5.57E-09 0.142R^2 0.5078 R^2 0.3839
Adj R^2 0.5047 Adj R^2 0.3797#Obs 800 #Obs 750
Table 3.4: Model 3 and 4 Results Regressed on GDP p/Cap Regressed on Growth in GDP p/CapVariable Coef. Std Err. P-Value Adj R^2 Variable Coef. Std Err. P-Value Adj R^2EFNA 4613.28** 298.49 0.000 0.4862 CEFNA 0.5398** 0.0347 0.000 0.2423HG 643.3** 31.84 0.000 HG -0.0006** 0.0002 0.000GDP89 0.0123** 0.0013 0.000 GDP89 -7.45E-09 6.1E-09 0.226EFNA-1 3810.76** 313.24 0.000 0.4367 CEFNA-1 0.273** 0.0315 0.000 0.0882HG 701.49** 33.32 0.000 HG -0.0004** 0.0002 0.015GDP89 0.0162 0.0014 0.000 GDP89 -5.85E-09 6.7E-09 0.385EFNA-2 4002.7** 295.56 0.000 0.4571 CEFNA-2 0.7034** 0.0362 0.000 0.3339HG 600.23** 33.15 0.000 HG -0.0003 0.0002 0.065GDP89 0.0112** 0.0013 0.000 GDP89 -4.38E-09 5.8E-09 0.447EFNA-3 4040.67** 244.33 0.000 0.5028 CEFNA-3 0.3805** 0.0272 0.000 0.2050HG 638.59** 31.34 0.000 HG -0.0006** 0.0002 0.000GDP89 0.0119** 0.0013 0.000 GDP89 -8.72E-09 6.3E-09 0.167
The results at this level are consistent with previous studies in that it show that higher
economic freedom correlates with higher GDP per capita and higher growth. The
negative relationship found at the international level between the size of government
component and GDP per capita doesn’t hold up within the U.S. States. In fact, the size of 35
The growth model uses data from 1991-2005 instead of 1990-2005.

48
government has the largest coefficient. It is positively correlated with GDP per capita and
an increase in this component, meaning a smaller government size, correlates with higher
growth. Labor freedom appears to have the smallest effect on GDP per capita, but a
change in this component does have an effect on growth.
All of the results hold up when ran against a three year moving average of GDP as
well. This was suggested and performed in the 2008 edition of the EFNA in order to
control for business cycles that might naturally affect annual data. Consistent with their
results using the aggregate index, the results presented here do not change significantly
using the moving average instead of annual GDP.

49
CHAPTER FOUR
CONCLUSION
On the international and national level, a greater level of economic freedom is
found to be correlated with greater wealth, and an increase in economic freedom means
an increase in growth. The relationship is complex though, and not every component that
makes up the international indices is positively correlated. It is not clear if the
relationship found with the size of government among underdeveloped countries is the
same as developed countries. The results in this area are likely affected by a reverse
casual relationship.
The IEF and EFW are strongly correlated, and regarding the U.S, the trend is the
same between the two international indices and the average of the EFNA. The IEF has a
lower ranking of all countries on average, and little inconsistency could be detected.
A criticism of these indices has been that they are created with a political axe to
grind; that since those who construct them are in favor of free markets, they are biased
and are able to take the data they want, while leaving out other data, and support the
conclusion they are seeking. It is true that some data is left out, because it must be so.
This is the case with all social science. It is not possible to account for all the possible
variables that affect people’s behavior.
Each index studied here purports to use 3rd party data to make the results as
objective as possible. An advantage to using EFW over IEF is simply the fact that they
provide the raw data used to construct the index. This is a valuable contribution to
academic research. What variables and attributes of a society that constitutes economic

50
freedom has to be based on judgment. This judgment must be based on solid reasoning
and sound economic theory. It is a statistical reality that studies using these indices are
producing results that are consistent with theory. It does appear that countries/states that
have relatively more economic freedom as measured have higher well-being, and
therefore, critics of this variety would have to explain why this is the case.
It is possible that economic freedom is increased because of growth, but it is
normally thought, as well as supported by empirical studies, that growth, income levels,
and well-being in general are the results, and not the cause, of business activity and gains
from trade, which are enhanced by the institutions in place. Within a large spectrum of
countries, government size may be an exception to this. It was found to be negatively
correlated when using a large number of countries with great variation, but not so among
the U.S. States and is not significant within a smaller sample of developed nations.
Certainly, it is likely some variables are duplicated and/or left out, but no author
of these indices has claimed otherwise. It is not claimed that each sector within an index
is completely endogenous to each other. There may be some overlap between the sectors,
but this does not diminish from the usefulness of an index. The attempt is broad, which is
to look at the institutional makeup of a country or region and be able to state with some
accuracy, backed with empirical knowledge, as to how economically free the people are
in this country, relative to other countries or states. It is one thing to observe that
American citizens are freer than the people living in North Korea, but by how much?
Clearly, the gap is large in that instance, but what about the difference between Germany

51
and Austria, or even South Carolina and West Virginia? The economic freedom index
contributes to this comparison.
It was said by Lord Kelvin, the 19th-century British Physicist, that “When you can
measure what you are speaking about, and express it in numbers, you know something
about it. But when you cannot measure it, when you cannot express it in numbers, your
knowledge is of a meager and unsatisfactory kind: it may be the beginning of knowledge,
but you have scarcely, in your thoughts, advanced to the stage of science, whatever
matter may be.”36 The economic freedom indices are a logical attempt at measuring the
institutions and policies that are conducive to trade, and therefore, they make it possible
to understand with more precision why we would expect some states to grow faster than
others and by how much.
A valid critique can be made on the precision of the measurements made in these
economic freedom indices. Because of the varying relationships between the components
of the index and the dependent variables, GDP and growth in this instance, it is suggested
that the aggregate index be interpreted carefully. It is possible to institute policy that
would increase the aggregate score but have no effect on growth because it would depend
on what component is being affected. It is suggested that studies analyze the components
separately.
It is largely agreed that private property, low taxes, and other variables in
economic freedom are good for investment and improvement, but how large of an effect
is more controversial. There are many aspects, an infinite amount, that are not and cannot
36
Quote cited in PRI’s 2008 report of The U.S. Economic Freedom Index

52
be controlled for, and therefore, we may not put much stock in the point estimates, but
these quantitative results do provide us many qualitative conclusions. They give us
empirical support that economic freedom does matter, and can have significant results.
By breaking down the indices into each component, we are able to determine
what aspects are more important in determining the relationship. It has been
demonstrated here that property rights are crucial. As Tom Bethell states in his book, The
Noblest Triumph, that “when property is privatized, and the rule of law is established, in
such a way that all including the rulers themselves are subject to the same law, economies
will prosper and civilization will blossom.”37
It may not point to an easy or quick policy solution to perceived problems in the
world, but nor does it claim to do so. It is akin to the study of history. Having an
understanding of the human condition may not tell us the exact magnitude we should
expect from some event, but it does guide our understanding of the general trends in
particular countries and across countries, and the consequences we may expect of certain
events. It is doubtful whether any of these indices are useful for forecasting. Even with
modern technology, it still takes years for the data to trickle in and be calculated. Because
of this lag, it is likely that the index will capture the reality that stock and bond markets
have already reflected to some extent.
Institutional analysis aids in our understanding of the world. We expect higher
growth and welfare where markets work, and we know that markets work better under
37
Found on page 3 in The Noblest Triumph: Property and Prosperity through the Ages. 1998 (Paperback)

53
certain conditions and environments. It works where there is a rule of law and people are
able to keep the fruits of their labor.
The Economic Freedom Index serves as a valuable tool for cross country and
regional comparisons. It provides a framework for understanding the institutions that are
correlated to greater prosperity. It is useful to view over time and provides insight into the
general trend of growth or well-being that we can expect a nation to experience due to an
institutional or policy change. What it does not provide are answers on how to implement
appropriate institutional change. Some are more straight-forward such as lowering
marginal tax rates done through policy, but how do we create a legal environment that is
conducive to investment? Regardless, any answer or improvement will take many years
or even generations to implement. The answer to whether the agents that institute policies
are actually interested in the long run effects of more economic freedom is a question
better answered within the public choice literature.

54
REFERENCES
Acemoglu, Daron, Simon Johnson, and James A. Robinson (2001). The Colonial Origins of Comparative Development: An Empirical Investigation. American Economic Review. 91: 1369-1401 Acemoglu, Daron, and Simon Johnson (2005). Unbundling Institutions. Journal of Political Economy 115: 949-95 Adkins, Lee C., R. L. Moomaw, and A. Savvides (2002). Institutions, Freedom, and Technical Efficiency. Southern Economic Journal. Vol. 69, July: 92-108 Ali, Abdiweli, and W. Mark Crain (2001). Political Regimes, Economic Freedom, Institutions, and Growth. Journal of Public Finance and Public Choice. Vol. 19 (1): 3-22 Ashby, Nathan J. and Russell Sobel (2008). Income Inequality and Economic Freedom in the U.S. States. Public Choice 134 (3-4): 329-46 Baumol, W.J. (1990). Entrepreneurship: Productive, Unproductive, and Destructive. Journal of Political Economy. Vol. 98 (5): 893-921 Bethell, Tom (1998). The Noblest Triumph: Property and Prosperity Through the Ages. St. Martin’s Press. Copyright 1998 Berggren, Niclas (1999). Economic Freedom and Equality: Friends or Foes. Public Choice. Vol. 100 (3-4): 203-223 Berggren, Niclas (2003). The Benefits of Economic Freedom: A Survey. The Independent Review. www.freetheworld.com/papers/berggren_review.pdf Bjornskov, Christian, and Nicolai J. Foss (2008). Economic Freedom and Entrepreneurial Activity: Some Cross-Country Evidence. Public Choice. Vol. 134: 307-328 Boettke, Peter, E. Chamlee-Wright, P. Gordon, S. Ikeda, P. Leeson, and R. Sobel (2007). The Political, Economic and Social Aspects of Katrina, working paper. Southern Economic Journal. Mercatus Center Bureau of Economic Analysis (2009). Regional Economic Accounts. www.bea.gov/regional /gsp/ Carlsson, Fredrik and Susanna Lundstrom (2002). Economic Freedom and Growth: Decomposing the Effects. Public Choice. Vol. 112: 335-344

55
Dawson, John W. (1998). Institutions, Investment, and Growth: New Cross-Country and Panel Data Evidence. Economic Inquiry. Vol. 36, Oct: 603-619 Dawson, John W. (2003). Causality in the Freedom-Growth Relationship. European Journal of Political Economy. Vol. 19: 479-495 Djankov, S, T. Ganser, C. McLiesh, R. Ramalho, and A. Shleifer (2008). The Effect of Corporate Taxes on Investment and Entrepreneurship. NBER Working Paper Series. Jan 2008, Paper 80 Economic Research Service (2009). ERS International Macroeconomic Data Set, Updated 11/02/09. The United States Department of Agriculture. www.ers.usda.gov/data/macroeconomics/ Friedman, Milton (2002). Capitalism and Freedom: The Fortieth Anniversary Edition. The University of Chicago Press. Copyright 1962 Gwartney, J.D., Robert A. Lawson, and Randall G. Holcombe (1999). Economic Freedom and the Environment for Economic Growth. Journal of Institutional and Theoretical Economics 155. December: 1-21 Gwartney, James, Robert A. Lawson and Joshua Hall (2009), Economic Freedom of the World; 2009 Annual Edition. Vancouver, Frasier Institute. Economic Freedom Network. <www.frasierinstitute.org> and <www. freetheworld.com> Haan, Jakob de, and Jan-Egbert Sturm (2000). On the Relationship Between Economic Freedom and Economic Growth. European Journal of Political Economy. Vol. 16 (2): 215-41 Hanson, John R. (2000). Prosperity and Economic Freedom. The Independent Review. Vol. 4 (4): 525-31 Hayek, F.A. [1944] (2007). (Bruce Caldwell ed.), The Road to Serfdom: Text and Documents. (The Definitive Edition) The University of Chicago Press. Heckelman, Jac C. (2000). Economic Freedom and Economic Growth: A Short-run Causal Investigation. Journal of Applied Economics. Vol. III (1) May: 71-91 Heckelman, Jac C., and Michael D. Stroup (2000). Which Economic Freedoms Contribute to Growth. Kyklos. Vol. 53 (4): 527-544 Heckelman, Jac C. (2002). On the Measurement of Comparative Economic Freedom across Nations. International Journal of Business and Economics. Vol. 1 (3): 251-261

56
Heckelman, Jac C., and Michael Stroup (2005). A Comparison of Aggregation Methods for Measures of Economic Freedom. European Journal of Political Economy. Vol. 21: 953-966 Karabegovic, Amela, Fred McMahon, Nathan J. Ashby, and Russell S. Sobel (2008), Economic Freedom of North America; 2008 Annual Report, Canadian Edition. Vancouver, Frasier Institute. www.fraserinstitute.org/researchandpublications/publications/5729.aspx Kreft, F. Steven, and Russell S. Sobel (2005). Public Policy, Entrepreneurship, and Economic Freedom. Cato Journal 25 (3) Fall: 595-616. www.cato.org/pubs/journal/cj25n3/cj25n3-15.pdf. Kreft, Steven, and Elham Mafi-Kreft. Entrepreneurship and State Public Policy, working draft. Kelley School of Business, Indiana University. Lawson, Robert A. Email Correspondence. Nov 21, 2009 McQuillan, Lawrence J. and Hovannes Abramyan (2008). U.S. Tort Liability Index: 2008 Report. Pacific Research Institute. <special.pacificresearch.org/pub/sab/2008/Tort_Index/> McQuillan, Lawrence J., Michael T. Maloney, Eric Daniels, and Brent M. Eastwood (2008), U.S. Economic Freedom Index, 2008 Report. Pacific Research Institute and Forbes. <special.pacificresearch.org/pub/sab/entrep/2008/Economic_Freedom/map.html> Miller, Terry, K.R. Holmes, Anthoney B. Kim, Daniella Markheim, James M. Roberts, Caroline Walsh, and Steve Moore (2009), 2009 Index of Economic Freedom, Washington DC. The Heritage Foundation and the Wall Street Journal. www.heritage.org/index/ National Center for Education Statistics (2009). Digest for Education Statistics. <nces.ed.gov/pubsearch/getpubcats.asp?sid=091# North, Douglass (1990). Institutional, Institutional Change and Economic Performance. Cambridge University Press. Padgitt, Kail (2009). 2010 State Business Tax Climate Index: Seventh Edition. The Tax Foundation. www.taxfoundation.org/research/show/22658.html Peltzman, Sam (1980). The Growth of Government, Journal of Law and Economics. The University of Chicago Press. Vol. 23 (2) Oct: 209-287 Pitlik, Hans (2002). The Path of Liberalization and Economic Growth. Kyklos. Vol. 55 (1): 57-80

57
Porta, Rafael la, Florencio Lopez-de-silanes, and Andrei Shleifer (2002). Government Ownership of Banks. The Journal of Finance. Vol LVII (1), Feb: 265-301 Ruger, William P. and Jason Sorens (2009), Freedom in the 50 States: An Index of Personal and Economic Freedom. Mercatus Center, George Mason University. www.mercatus.org/uploadedFiles/Mercatus/Publications/Freedom%20in%20the%2050%20States.pdf Sculley, Gerald, and Daniel J. Slottje (1991). Ranking Economic Liberty Across Countries. Public Choice. Vol. 69 (2): 121-152 Sculley, Gerald (2002). Economic Freedom, Government Policy, and the Trade-Off Between Equity and Economic Growth. Public Choice. Vol. 113 (1-2): 77-96 Smith, Adam [1776] (1904). (Edwin Cannan ed.). An Inquiry into the Nature and Causes of the Wealth of Nations. 5th edition. Methuen. Sobel, Russell S. (2007). Testing Baumol: Institutional Quality and the Productivity of Entrepreneurship. Journal of Business Venturing Sturm, J. E, E. Leertouwer, and J. de Haan (2002). Which Economic Freedoms Contribute to Growth? Kyklos. Vol. 53: 527-544 Tollison, Robert D. (1997). “Rent Seeking.” (Mueller ed.), Perspectives on Public Choice. Chapter 23. Cambridge University Press Tullock, Gordon (1967). Toward a Mathematics of Politics. University of Michigan Press World Bank (2008). 2008 World Development Indicators CD-rom. The World Bank


