Measuring fluency: Temporal variables and pausing patterns ...
138
Purdue University Purdue e-Pubs Open Access Dissertations eses and Dissertations 4-2016 Measuring fluency: Temporal variables and pausing paerns in L2 English speech Soohwan Park Purdue University Follow this and additional works at: hps://docs.lib.purdue.edu/open_access_dissertations Part of the Linguistics Commons is document has been made available through Purdue e-Pubs, a service of the Purdue University Libraries. Please contact [email protected] for additional information. Recommended Citation Park, Soohwan, "Measuring fluency: Temporal variables and pausing paerns in L2 English speech" (2016). Open Access Dissertations. 692. hps://docs.lib.purdue.edu/open_access_dissertations/692
Transcript of Measuring fluency: Temporal variables and pausing patterns ...
Purdue UniversityPurdue e-Pubs
Open Access Dissertations Theses and Dissertations
4-2016
Measuring fluency: Temporal variables and pausingpatterns in L2 English speechSoohwan ParkPurdue University
Follow this and additional works at: https://docs.lib.purdue.edu/open_access_dissertations
Part of the Linguistics Commons
This document has been made available through Purdue e-Pubs, a service of the Purdue University Libraries. Please contact [email protected] foradditional information.
Recommended CitationPark, Soohwan, "Measuring fluency: Temporal variables and pausing patterns in L2 English speech" (2016). Open Access Dissertations.692.https://docs.lib.purdue.edu/open_access_dissertations/692
Graduate School Form30 Updated
PURDUE UNIVERSITYGRADUATE SCHOOL
Thesis/Dissertation Acceptance
This is to certify that the thesis/dissertation prepared
By
Entitled
For the degree of
Is approved by the final examining committee:
To the best of my knowledge and as understood by the student in the Thesis/Dissertation Agreement, Publication Delay, and Certification Disclaimer (Graduate School Form 32), this thesis/dissertation adheres to the provisions of Purdue University’s “Policy of Integrity in Research” and the use of copyright material.
Approved by Major Professor(s):
Approved by:Head of the Departmental Graduate Program Date
Soohwan Park
MEASURING FLUENCY: TEMPORAL VARIABLES AND PAUSING PATTERNS IN L2 ENGLISH SPEECH
Doctor of Philosophy
April GintherChair
Atsushi Fukada
Mary K Niepokuj
Elaine J Francis
April Ginther
Felicia D Roberts 4/11/2016

i
MEASURING FLUENCY: TEMPORAL VARIABLES AND PAUSING PATTERNS
IN L2 ENGLISH SPEECH
A Dissertation
Submitted to the Faculty
of
Purdue University
by
Soohwan Park
In Partial Fulfillment of the
Requirements for the Degree
of
Doctor of Philosophy
May 2016
Purdue University
West Lafayette, Indiana

ii
ACKNOWLEDGEMENTS
I would like to express my appreciation to my advisor, Dr. April Ginther for being
a great mentor and giving me all this work; Dr. Atsushi Fukada for supporting my study;
Dr. Mary Niepokuj and Dr. Elaine Francis for being my committee members.
My gratitude is extended to Xun, Ploy, Rodrigo, and former and current staffs at
Oral English Proficiency Program (OEPP) for helping me collecting data; Mark Haugen
for editing my dissertation paper; the members of Language Testing Research Meeting
for supporting each other’s research.
I thank Linguistics Program (LING), School of Language and Culture (SLC),
Second Language Studies (SLS), Purdue Linguistics Association (PLA), and the chair
professors of our program, Dr. Felicia Roberts and Dr. Ronnie Wilbur for providing me
wonderful places to work and study at Purdue.
I also want to thank Dr. Nancy Kauper for being such a great friend and comrade;
my colleagues at Purdue, Bo, Dr. Kim, Li, and Dr. Cao; my dearest friends in Korea,
Ahn, Noh, Oh, June, and Dr. Yang.
Finally, very special thanks go to my beloved family; my parents, Hyeja Kang
and Youngmoo Park; my sister and brother-in law, Dr. Soomin Park and Dr. Lei Shen,
and their beautiful kids, Ellie and Aidan.
iii
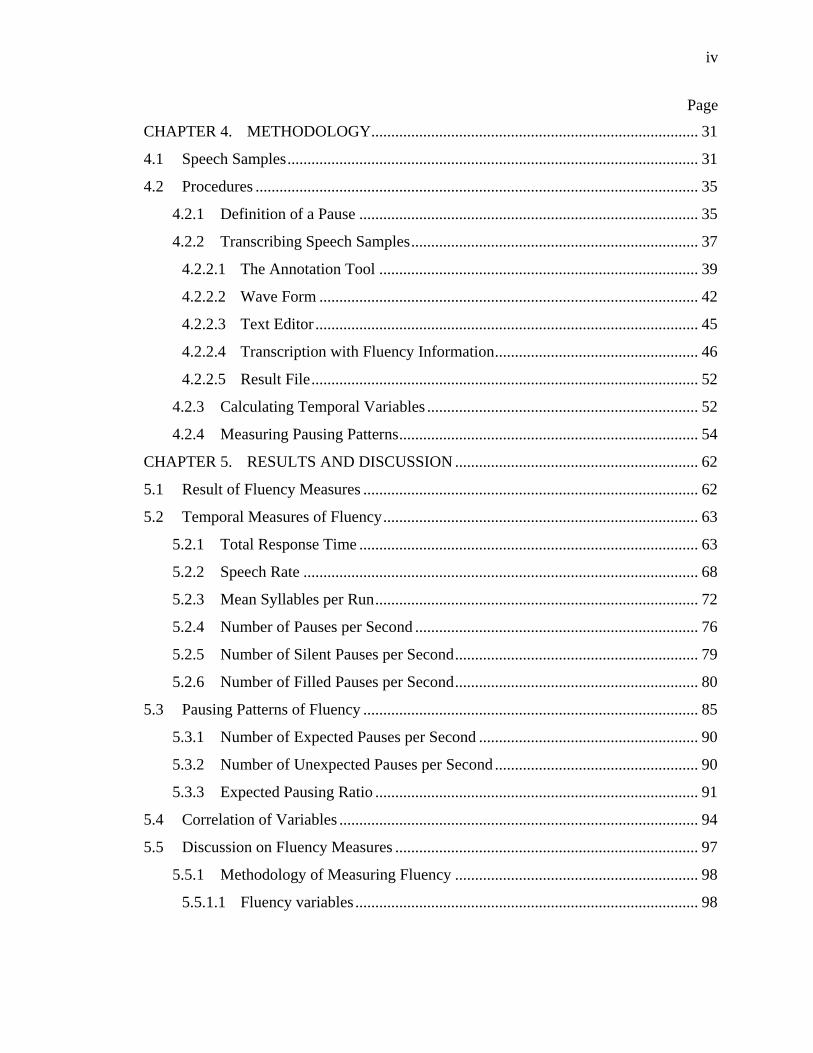
TABLE OF CONTENTS
Page
LIST OF TABLES ............................................................................................................. vi
LIST OF FIGURES ......................................................................................................... viii
ABSTRACT ........................................................................................................................ x
CHAPTER 1. INTRODUCTION .................................................................................... 1
1.1 Introduction ............................................................................................................... 1
1.1.1 Evaluating Oral Proficiency ............................................................................ 1
1.1.2 Oral Proficiency in L2 English Speech Sample .............................................. 2
1.1.3 Fluency as a Component of Oral Proficiency .................................................. 3
1.1.4 Extracting Temporal and Pausing Information from Speech Samples ............ 4
1.1.5 Temporal Variables as the Speed of Oral Delivery ......................................... 5
1.1.6 Pausing Patterns as Smoothness of Oral Delivery. .......................................... 6
CHAPTER 2. LITERATURE REVIEW ......................................................................... 8
2.1 Fluency as a Component of Oral Proficiency ........................................................... 8
2.1.1 Definition of Fluency ....................................................................................... 8
2.1.2 Pausing as Hesitation Phenomena ................................................................. 11
2.1.3 Characteristics of Silent Pauses ..................................................................... 12
2.1.4 Pausing Positions in Oral Delivery ................................................................ 15
2.1.5 Pausing as a Component of Prosody ............................................................. 16
2.2 Measuring Oral Proficiency .................................................................................... 17
2.2.1 Testing Oral Proficiency ................................................................................ 17
2.2.2 Measuring Fluency with Temporal Variables ............................................... 20
2.2.3 Measuring Smoothness of Fluency with Pausing Pattern .............................. 26
CHAPTER 3. RESEARCH QUESTION ....................................................................... 28
iv
Page
CHAPTER 4. METHODOLOGY .................................................................................. 31
4.1 Speech Samples ....................................................................................................... 31
4.2 Procedures ............................................................................................................... 35
4.2.1 Definition of a Pause ..................................................................................... 35
4.2.2 Transcribing Speech Samples ........................................................................ 37
4.2.2.1 The Annotation Tool ................................................................................ 39
4.2.2.2 Wave Form ............................................................................................... 42
4.2.2.3 Text Editor ................................................................................................ 45
4.2.2.4 Transcription with Fluency Information ................................................... 46
4.2.2.5 Result File ................................................................................................. 52
4.2.3 Calculating Temporal Variables .................................................................... 52
4.2.4 Measuring Pausing Patterns ........................................................................... 54
CHAPTER 5. RESULTS AND DISCUSSION ............................................................. 62
5.1 Result of Fluency Measures .................................................................................... 62
5.2 Temporal Measures of Fluency ............................................................................... 63
5.2.1 Total Response Time ..................................................................................... 63
5.2.2 Speech Rate ................................................................................................... 68
5.2.3 Mean Syllables per Run ................................................................................. 72
5.2.4 Number of Pauses per Second ....................................................................... 76
5.2.5 Number of Silent Pauses per Second ............................................................. 79
5.2.6 Number of Filled Pauses per Second ............................................................. 80
5.3 Pausing Patterns of Fluency .................................................................................... 85
5.3.1 Number of Expected Pauses per Second ....................................................... 90
5.3.2 Number of Unexpected Pauses per Second ................................................... 90
5.3.3 Expected Pausing Ratio ................................................................................. 91
5.4 Correlation of Variables .......................................................................................... 94
5.5 Discussion on Fluency Measures ............................................................................ 97
5.5.1 Methodology of Measuring Fluency ............................................................. 98
5.5.1.1 Fluency variables ...................................................................................... 98
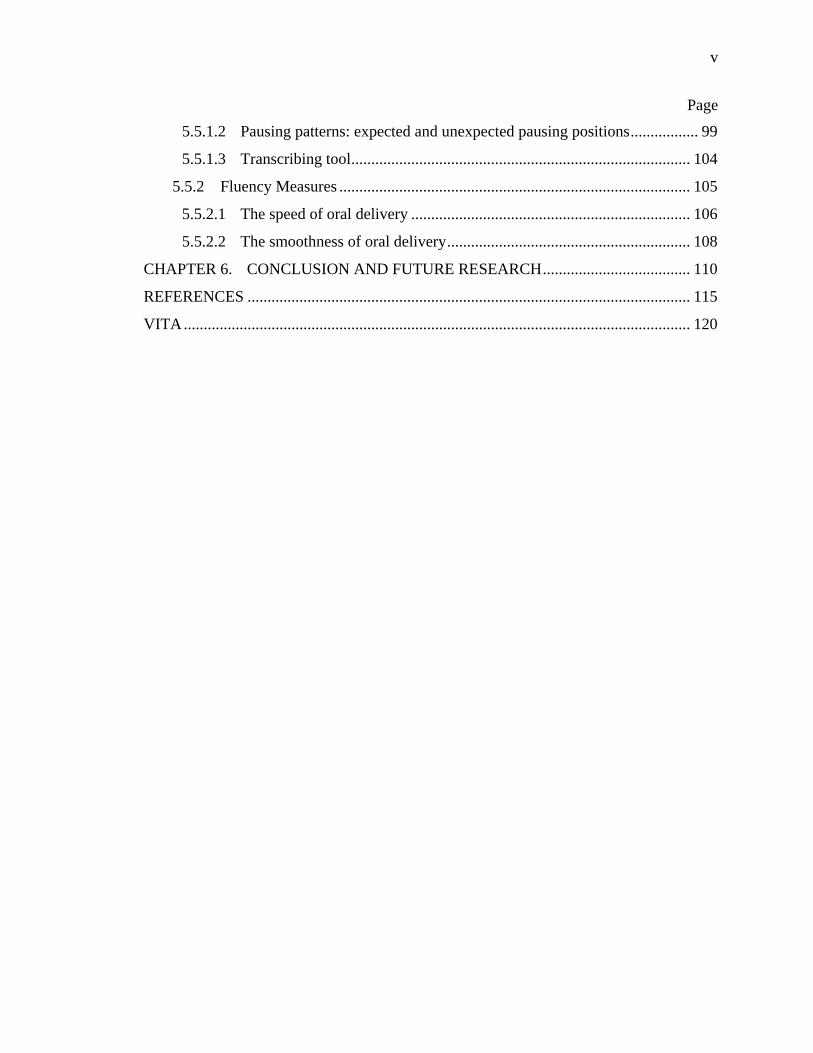
v
Page
5.5.1.2 Pausing patterns: expected and unexpected pausing positions ................. 99
5.5.1.3 Transcribing tool ..................................................................................... 104
5.5.2 Fluency Measures ........................................................................................ 105
5.5.2.1 The speed of oral delivery ...................................................................... 106
5.5.2.2 The smoothness of oral delivery ............................................................. 108
CHAPTER 6. CONCLUSION AND FUTURE RESEARCH ..................................... 110
REFERENCES ............................................................................................................... 115
VITA ............................................................................................................................... 120
vi
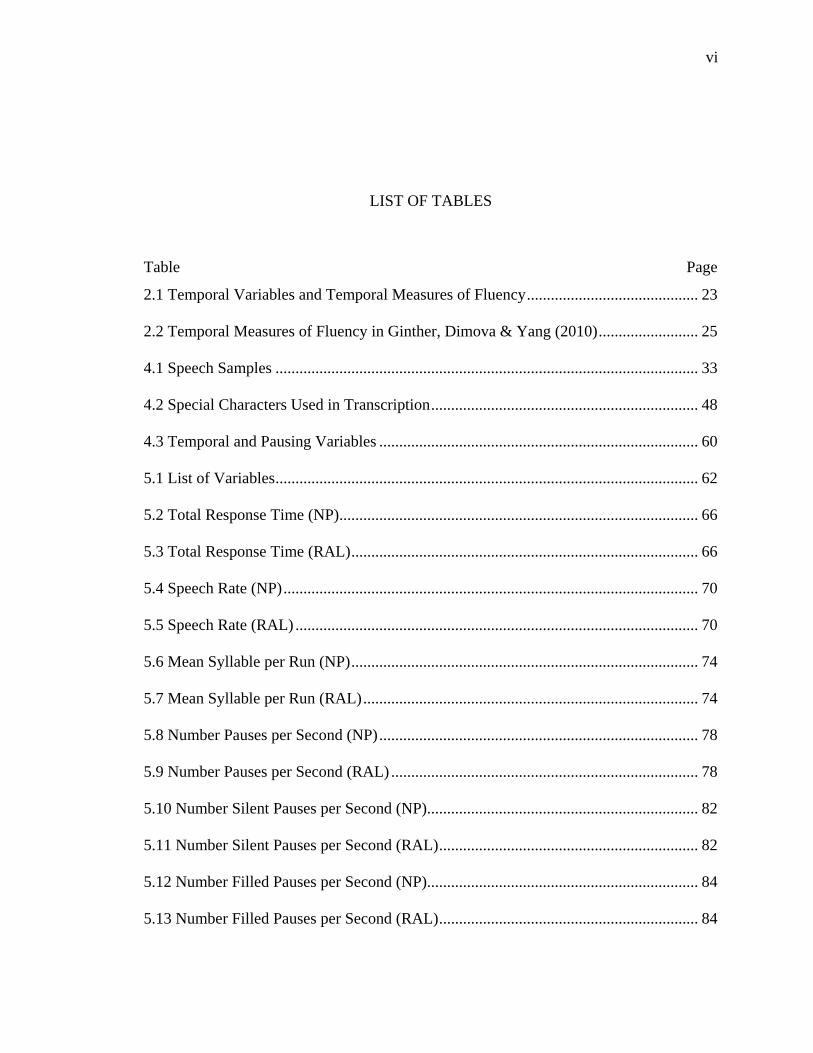
LIST OF TABLES
Table .............................................................................................................................. Page
2.1 Temporal Variables and Temporal Measures of Fluency ........................................... 23
2.2 Temporal Measures of Fluency in Ginther, Dimova & Yang (2010) ......................... 25
4.1 Speech Samples .......................................................................................................... 33
4.2 Special Characters Used in Transcription ................................................................... 48
4.3 Temporal and Pausing Variables ................................................................................ 60
5.1 List of Variables .......................................................................................................... 62
5.2 Total Response Time (NP) .......................................................................................... 66
5.3 Total Response Time (RAL) ....................................................................................... 66
5.4 Speech Rate (NP) ........................................................................................................ 70
5.5 Speech Rate (RAL) ..................................................................................................... 70
5.6 Mean Syllable per Run (NP) ....................................................................................... 74
5.7 Mean Syllable per Run (RAL) .................................................................................... 74
5.8 Number Pauses per Second (NP) ................................................................................ 78
5.9 Number Pauses per Second (RAL) ............................................................................. 78
5.10 Number Silent Pauses per Second (NP).................................................................... 82
5.11 Number Silent Pauses per Second (RAL) ................................................................. 82
5.12 Number Filled Pauses per Second (NP).................................................................... 84
5.13 Number Filled Pauses per Second (RAL) ................................................................. 84
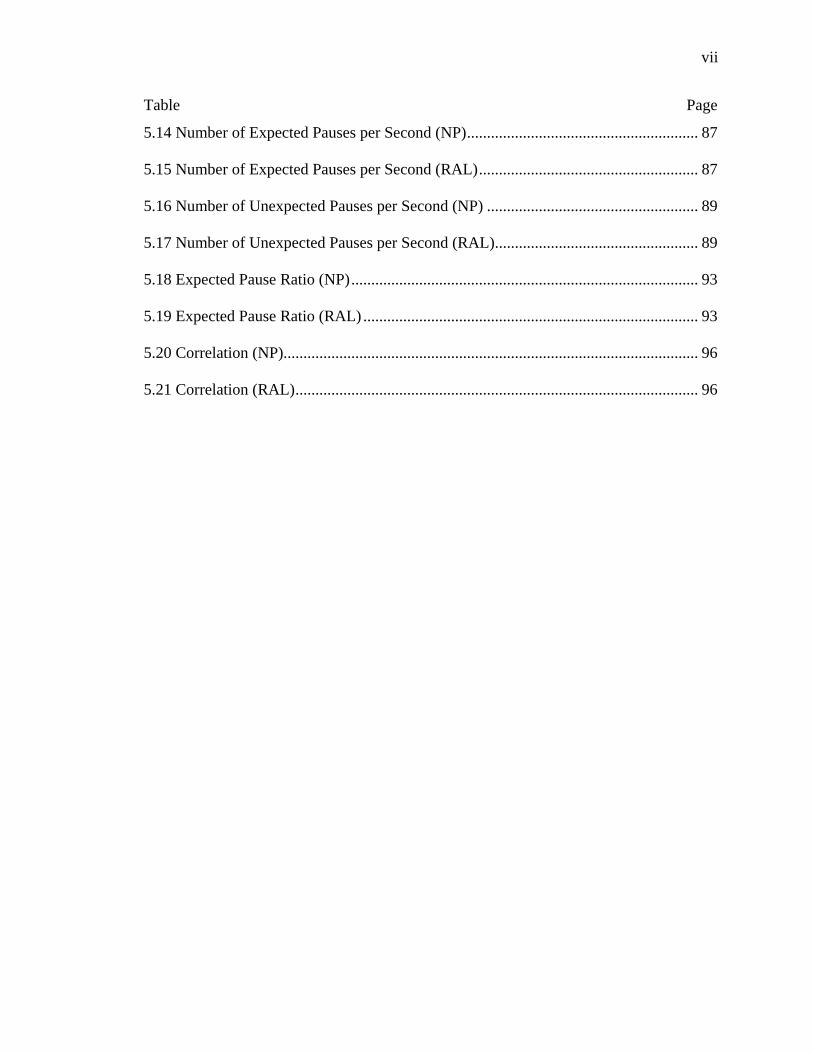
vii
Table .............................................................................................................................. Page
5.14 Number of Expected Pauses per Second (NP) .......................................................... 87
5.15 Number of Expected Pauses per Second (RAL) ....................................................... 87
5.16 Number of Unexpected Pauses per Second (NP) ..................................................... 89
5.17 Number of Unexpected Pauses per Second (RAL)................................................... 89
5.18 Expected Pause Ratio (NP) ....................................................................................... 93
5.19 Expected Pause Ratio (RAL) .................................................................................... 93
5.20 Correlation (NP)........................................................................................................ 96
5.21 Correlation (RAL) ..................................................................................................... 96
viii
LIST OF FIGURES
Figure ............................................................................................................................. Page
1.1 Components in Oral Proficiency ................................................................................... 3
2.1 The Analysis of Hesitations (Trevor, 2006, p.432) .................................................... 11
4.1 Steps in Processing Fluency Variables ....................................................................... 34
4.2 Sample Screen of the Annotation Tool ....................................................................... 40
4.3 Wave Form.................................................................................................................. 43
4.4 Text Editor .................................................................................................................. 45
4.5 Transcription with Fluency Information ..................................................................... 46
4.6 Result Text File Example ............................................................................................ 51
5.1 Total Response Time (NP) .......................................................................................... 65
5.2 Total Response Time (RAL) ....................................................................................... 65
5.3 Speech Rate (NP) ........................................................................................................ 69
5.4 Speech Rate (RAL) ..................................................................................................... 69
5.5 Mean Syllables per Run (NP) ..................................................................................... 73
5.6 Mean Syllables per Run (RAL) .................................................................................. 73
5.7 Number of Pauses per Second (NP) ............................................................................ 77
5.8 Number of Pauses per Second (RAL) ......................................................................... 77
5.9 Number of Silent Pauses per Second (NP) ................................................................. 81
5.10 Number of Silent Pauses per Second (RAL) ............................................................ 81
ix
Figure ............................................................................................................................. Page
5.11 Number of Filled Pauses per Second (NP) ............................................................... 83
5.12 Number of Filled Pauses per Second (RAL) ............................................................ 83
5.13 Number of Expected Pauses per Second (NP) .......................................................... 86
5.14 Number of Expected Pauses per Second (RAL) ....................................................... 86
5.15 Number of Unexpected Pauses per Second (NP) ..................................................... 88
5.16 Number of Unexpected Pauses per Second (RAL)................................................... 88
5.17 Expected Pause Ratio (NP) ....................................................................................... 92
5.18 Expected Pause Ratio (RAL) .................................................................................... 92
5.19 Scatter Plots (NP) ...................................................................................................... 95
5.20 Scatter Plots (RAL) ................................................................................................... 97
x
ABSTRACT
Park, Soohwan. Ph.D., Purdue University, May 2016. Measuring Fluency: Temporal Variables and Pausing Patterns in L2 English Speech. Major Professor: April Ginther. This paper examines temporal variables and pausing patterns in L2 English speech to
investigate fluency as a measurable component of oral proficiency. Fluency can be
defined as ‘speed and smoothness of oral delivery’. We can measure the speed of oral
delivery through calculating temporal variables such as speech rate and mean syllables
per run where ‘run’ is the vocal chunk between silent pauses. The smoothness of oral
delivery can be measured through examination of pausing patterns by classifying the
placement of pauses. Pauses may be placed in expected positions such as clause/phrase
boundaries or in unexpected positions. Pause placement in unexpected positions may
reduce the smoothness of oral delivery. The data sets are speech samples from the Oral
English Proficiency Test (OEPT) but include the responses from two items (RAL: read
aloud; NP: news passage). A total of 325 speakers across four different language groups
(native speakers of Korean, Chinese, Hindi, and English) are represented across 6
proficiency levels (rated by holistic scoring based on the OEPT scale from 35 to 60). The
speech samples were transcribed manually using a computer-assisted annotation tool that
allowed capture of information about syllables, pausing boundaries, and types of pausing
positions. Development of the annotation tool became a central concern of this study as
xi
establishing reliable and efficient methods in fluency research. Speech rate, mean
syllables per run, and number of pauses per second were selected to examine temporal
variables; number of unexpected pauses per second and expected pausing ratio were
selected to compare pausing patterns across proficiency levels and language
backgrounds. The results show that there are some linear relationships in temporal and
pausing variables. High proficiency level speakers spoke at higher rates with expected
pausing patterns compared to low proficiency level speakers who spoke at slower rates
with almost no identifiable pausing patterns.
Keywords: second language acquisition, language testing, oral proficiency, fluency,
pausology
1
CHAPTER 1. INTRODUCTION
1.1 Introduction
Fluency is one of the most important components of oral proficiency and can be
used to represent general oral proficiency. In the narrow and focused definition, fluency
can be defined as the speed and smoothness of oral delivery (Lennon 1990, 2000). The
speed of oral delivery can be represented by temporal variables, and research on fluency
has generally focused on the speed of oral delivery because temporal variables are
relatively easy to extract and calculate from speech samples. However, fluency
measurement as represented by pausing patterns and temporal variables in L2 English
speech samples are less frequently examined together. This study investigates the
possibility of expanding the measurement of fluency beyond speed to include the
smoothness of oral delivery by examining pausing patterns.
1.1.1 Evaluating Oral Proficiency
Measuring oral proficiency has been limited due to difficulties in collecting and
analyzing speech samples. In addition, although evaluating proficiency in speaking is
essential in evaluating overall language proficiency, testing speaking has only recently
become a standard component of language tests. Recent developments in computer
technology have aided efforts to effectively test speaking rates in language test, and large
2
scale collection and analysis of speech samples to investigate the components of oral
proficiency has become easier for researchers.
1.1.2 Oral Proficiency in L2 English Speech Sample
This study examines speech samples of L2 and L1 English speakers. More
specifically, the speech samples analyzed in this study are collected from the OEPT (Oral
English Proficiency Test) at Purdue University. The OEPT is a local, semi-direct English
proficiency test for prospective international graduate teaching assistants. The OEPT test
takers are assumed to have at least an intermediate level of English proficiency because
they have been already admitted to the graduate school and have met the required
language proficiency cut-off for the TOEFL iBT (77 total score) or a comparable test.
The rating scale of the OEPT consists of six score points 35, 40, 45, 50, 55, and 60.
The three major language groups of international graduate students who take the
OEPT are Chinese, Korean, and Hindi. Hindi speakers from India generally score at the
higher proficiency levels while the oral English proficiency levels of Korean and Chinese
test takers distribute across score points. The majority of Korean and Chinese test takers
have scores of 40 and 45 with smaller numbers at levels of 50 and 35, and less frequently
at 55 and 60.
The data set in this study is composed of the OEPT responses from Korean,
Chinese, and Hindi language groups across score levels of 35, 40, 45, 50, and 55. Item
responses from those groups should not be considered equivalent because Korean,
Chinese, and Hindi speakers have different characteristics in speaking their first language
backgrounds, and language learning experiences affect their performance in responses.
3
Therefore, when we compare test takers, we must keep in mind how those language
backgrounds may have affected language performances.
1.1.3 Fluency as a Component of Oral Proficiency
There are common components in language proficiency such as grammar and
vocabulary that are assumed to have similar roles in language use for listening, reading,
writing, and speaking. Fluency is another component of language use. For example, we
can discuss fluency in reading to refer to whether we can read written English passages
with speed and smoothness. However, fluency is most commonly associated with oral
proficiency.
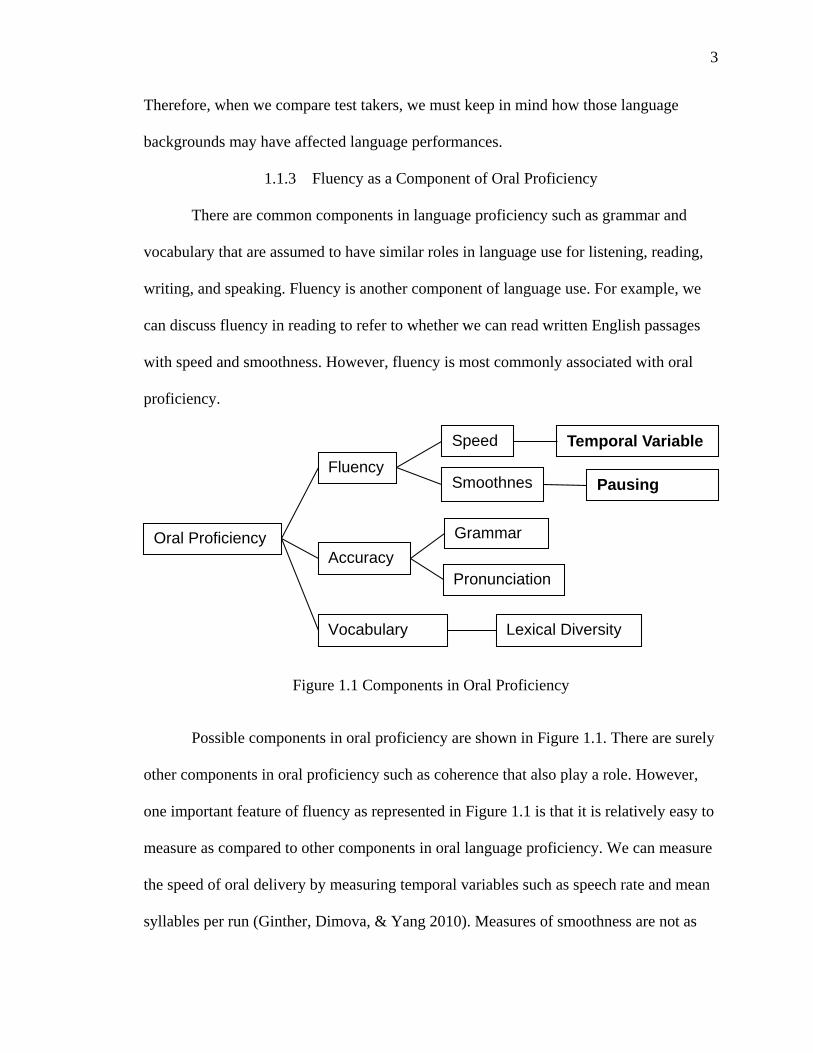
Figure 1.1 Components in Oral Proficiency
Possible components in oral proficiency are shown in Figure 1.1. There are surely
other components in oral proficiency such as coherence that also play a role. However,
one important feature of fluency as represented in Figure 1.1 is that it is relatively easy to
measure as compared to other components in oral language proficiency. We can measure
the speed of oral delivery by measuring temporal variables such as speech rate and mean
syllables per run (Ginther, Dimova, & Yang 2010). Measures of smoothness are not as
Oral Proficiency
Fluency
Accuracy
Speed
Smoothnes
Temporal Variable
Vocabulary Lexical Diversity
Pausing
Grammar
Pronunciation
4
easily established. However, it has been suggested that pausing patterns are related to the
smoothness of oral delivery. (Petrie 1987; Riggenbach 1991)
1.1.4 Extracting Temporal and Pausing Information from Speech Samples
This paper analyzed relatively large numbers of responses from 325 subjects to
extract temporal and pausing information. Speech samples were transcribed to count the
number of syllables and tagged to determine the boundaries of phonetically realized
vocalizations and silent pauses. Each pause was marked as occurring in an expected or
unexpected position. Speech samples in this study were collected from responses of the
read aloud (RAL) and news passage (NP) items of the OEPT and the length of the
responses are restricted to two minutes long maximum. It was not necessary to transcribe
the RAL item because test takers were reading scripts. After the NP item responses were
transcribed, tagged, and marked for the main analysis of measuring fluency, temporal
information such as total response time, number of syllables, and number of pauses were
extracted for calculating temporal and pausing variables.
Using an effective tool is important in language processing because processing
tagged language data from any raw audio and text data is tedious and hard work if it is
done by hand. That is why most fluency research has analyzed only relatively small
amounts of data. Although this study does not include fully computerized natural
language processing, e.g., calculating speech rates automatically by detecting number of
syllables with a computer application, tagging a transcribed speech sample to get
positions of pauses is not possible without a computer-assisted annotation tool. This
study uses a computer assisted annotation tool developed specially for fluency research
that is covered in this study. The computer-assisted tool aids in manual transcription of
5
speech samples, determination of boundaries of runs and pauses, and indication of types
of pauses. The tool also automatically extracts temporal and pausing information from
transcription, and calculates temporal and pausing variables. In addition, transcription
conventions to mark fluency related features from speech samples are included.
Development of the computer-assisted annotation tool is a central concern in establishing
methods for fluency research.
1.1.5 Temporal Variables as the Speed of Oral Delivery
Research on fluency has been focused on calculating and comparing temporal
variables across different language proficiency levels and the use of temporal variables to
represent overall oral proficiency has worked well (Kormos & Denes 2004). Temporal
information from speech samples are categorized into length and number variables, such
as the length of spoken and silent time periods, and the number of syllables and pauses.
The syllable is the basic unit of production and the average number of syllables with a
given time period has been recognized as a good measure of oral proficiency. Pauses are
silent parts that occur between runs and denote hesitation or breathing, and long silent
pauses are regarded as basic evidence of non-fluency. However, not every pause is silent
and pauses vocalizations such as ‘uh’ are called filled pauses. Filled pauses are not
necessarily evidence of non-fluency.
From the information on length and number (e.g., total response time, total
number of syllables, silent pause time, and total number of pauses), we can calculate
various temporal variables of quantity and rate of production (e.g., speech time ratio,
speech rate, and mean syllable per run), and frequency and length of pauses (e.g., number
of silent pauses per second, silent pause total response ratio). Among those temporal
6
variables, rate of production (i.e., speech rate and mean syllable per run) have been
chosen for this study because counting the number of syllables and silent pauses is highly
reliable, and rate of production has been found to be related to the holistic ratings by
human raters (Riggenbach, 1991; Kormos & Denes, 2004; Ginther, Dimova, & Yang,
2010). Therefore, speech rates, number of silent pauses per minutes, and mean syllables
per run are calculated to establish that temporal variables can represent overall oral
proficiency in speech samples from the OEPT across different proficiency levels.
1.1.6 Pausing Patterns as Smoothness of Oral Delivery.
When measuring fluency, the pause, along with the syllable, is one of the basic
units in oral production. Pauses are generally regarded as hesitation phenomena in oral
delivery and evidence of non-fluency. However, not every pause is due to hesitation. We
need pauses in oral production because we have to breathe occasionally when we speak.
Pausing as a hesitation phenomenon may not be found in some oral delivery. In
conversations between two people, a relatively long pause may indicate turn-taking. In
other words, a pause is an indication that a speaker has finished his or her turn and the
other conversational partner can take a turn in the conversation. Or the speaker stops oral
production, pauses as a hesitation, and the hesitation could incorrectly signal turn-taking
and the other conversational partner might take the next turn.
In spontaneous monologic speech, like the responses to the OEPT, pauses are
commonly found and can be associated with hesitation phenomena or normal respiration.
Speech samples from higher proficiency levels contain fewer pauses because speakers
with higher proficiency do not hesitate as often as lower proficiency speakers in their
responses. In contrast, the responses of lower level speakers often contain noticeable
7
pauses in their oral production and those pauses tend to be longer. Pausing is a distinctive
characteristic of lower proficiency speakers.
However, oral delivery without pauses would be fast and fluent but not
necessarily evidence of ‘good’ oral delivery. Pausing, therefore, can be understood and
categorized as expected versus unexpected. Fluent speakers place pauses in the ‘right’
places and expected placement does not reduce fluency. In other words, when pauses
occur in oral delivery, pauses in ‘expected’ positions such as phrase and clause
boundaries help listeners to process messages. For example, a pause placed between a
subject and a verb would be in an expected position while a pause placed between an
article and a noun would be in an unexpected position. Speakers with higher proficiency
level might produce more pauses in expected positions while lower level speakers may
pause more frequently in unexpected positions. This paper identifies expected pauses
based on the list of expected pausing positions from Goldman-Eisler (1968) and then
analyzes pausing patterns to compare across proficiency levels.
Therefore, this study suggests pausing patterns as a component of fluency to
measure smoothness of oral delivery, along with temporal variables to measure speed of
oral delivery, by showing whether there are differences across proficiency levels
regarding to temporal and pausing variables in speech samples. Moreover, this study
provides detailed procedures for processing speech sample data with a computer-assisted
tool in order to measure fluency.
8
CHAPTER 2. LITERATURE REVIEW
2.1 Fluency as a Component of Oral Proficiency
2.1.1 Definition of Fluency
Fillmore (1979) categorized four different dimensions of fluency: “1) the ability
to talk at length with few pauses and to fill time with talk. 2) the ability to talk in
coherent, reasoned, and ‘semantically dense’ sentences. 3) the ability to have appropriate
things to say in a wide range of contexts. 4) the ability (that some people have) to be
creative and imaginative in their language use such as to express their ideas in novel
ways, or to create and build on metaphors.” (p. 51) Fillmore summarized these
dimensions based on how well people speak in their native languages. In other words,
fluency as developed by Fillmore is closely related to the proficiency of L1 language use.
Because Fillmore was discussing fluency with respect to first language speaking
abilities, the four dimensions in Fillmore’s scheme may be problematic when applied to
second language speaking. Specifically the first dimension of “simply the ability to talk at
length with few pauses, the ability to fill time with talk” is a challenge for second
language speakers. Fillmore gave the example of disc jockeys or sports announcers who
may be able to speak fluently, but not necessary in “a semantically dense” manner.
Fillmore gave scholars as an example for the other aspects of fluency (the second, third,
9
and fourth dimensions), which suggest that such fluent speakers may be outlying
performers, even among first language speakers.
Fillmore’s discussion on first language speaking can, to some extent, be extended
to second language speaking abilities, and fluency has been widely researched in second
language studies. Lennon (1990) presented a new point of departure to examine fluency
in second language speaking and explained two senses of fluency: a broad sense and a
narrow sense (p. 389).
(1) The broad sense: fluency corresponding roughly to all-round oral proficiency
(2) The narrow sense: fluency referring to the speed and smoothness of oral
proficiency
In the broad sense, fluency is often used as a synonym for overall proficiency, as
in “She speaks English fluently” which is more expected than to say “She speaks English
proficiently”. Thus, “She speaks English fluently” can mean “She speaks English with
good oral proficiency” while it might also refer to the narrow sense as in “She speaks
English with speed and smoothness”. In the narrow sense, speaking at a particular rate
and smoothly is generally recognized as a necessary but insufficient condition for overall
oral proficiency.
Developing the concept of fluency further, Lennon (2000) argued that a narrow
sense of fluency constituted lower-order fluency, while the broad sense of fluency
represented higher-order fluency. (p. 25) Lower-order fluency can be measured by
examining temporal variables such as speech rate and dysfluency markers (i.e. pauses).
However, Lennon also pointed out that “temporal variables were merely the tip of iceberg
as indicators of fluency” because a listener’s perception of fluency was not simply
10
determined by temporal characteristics alone (p. 25). Furthermore, temporal variables
would vary even for an individual speaker depending on the discourse topic, situation,
interlocutor, and the speakers’ mental state. Lennon also distinguished ‘false fluency’
which is the outcome of a particular strategy employed by some language learners to
maintain high levels of purely temporal fluency by using and repeating familiar
automatized phrases. He suggested that fluency could only be accurately measured by
taking into account assessed topic, situation, and role relations. In addition, Lennon
discussed the relationship between fluency and error, and introduced ‘fossilized fluency’
to describe second language speech that may be fluent but displays systematic errors.
From the speaker’s point of view, there is a trade-off between temporal fluency and the
errors that are the result of processing pressures (p. 32). Lennon concluded that
eventually these errors will be ‘fossilized’ in order to maintain a particular level of
temporal fluency.
Lennon (2000) suggested a working definition of fluency as “the rapid, smooth,
accurate, lucid, and efficient translation of thought or communicative intention into
language under the temporal constraints of on-line processing.” (p. 26) This definition
contains the words ‘accurate’, ‘lucid,’ and ‘efficient’ as well as ‘smooth’ and ‘rapid,’
while the definition of the narrow sense of fluency only contains ‘speed’ and
‘smoothness.’. However, with regards to temporal variables, at present, we can only
really measure the narrow sense of fluency.
This study focuses on the low-order or narrow sense of fluency, that is, the speed
and smoothness of oral delivery. The speed of oral proficiency can be measured by
temporal variables and has been examined thoroughly in fluency research. Temporal
11
variables are calculated by information of articulated sounds and silent pauses in oral
delivery. Pauses have an important role in fluency that can affect both speed and
smoothness because frequent pausing or misplaced pauses are evidence of non-fluency.
2.1.2 Pausing as Hesitation Phenomena
A pause is a silent or non-semantic portion in speaking that is not a part of
meaningful oral delivery. In the view of regarding pausing as hesitation phenomena,
pauses are not obligatory when speaking and any noticeable pause can be regarded as
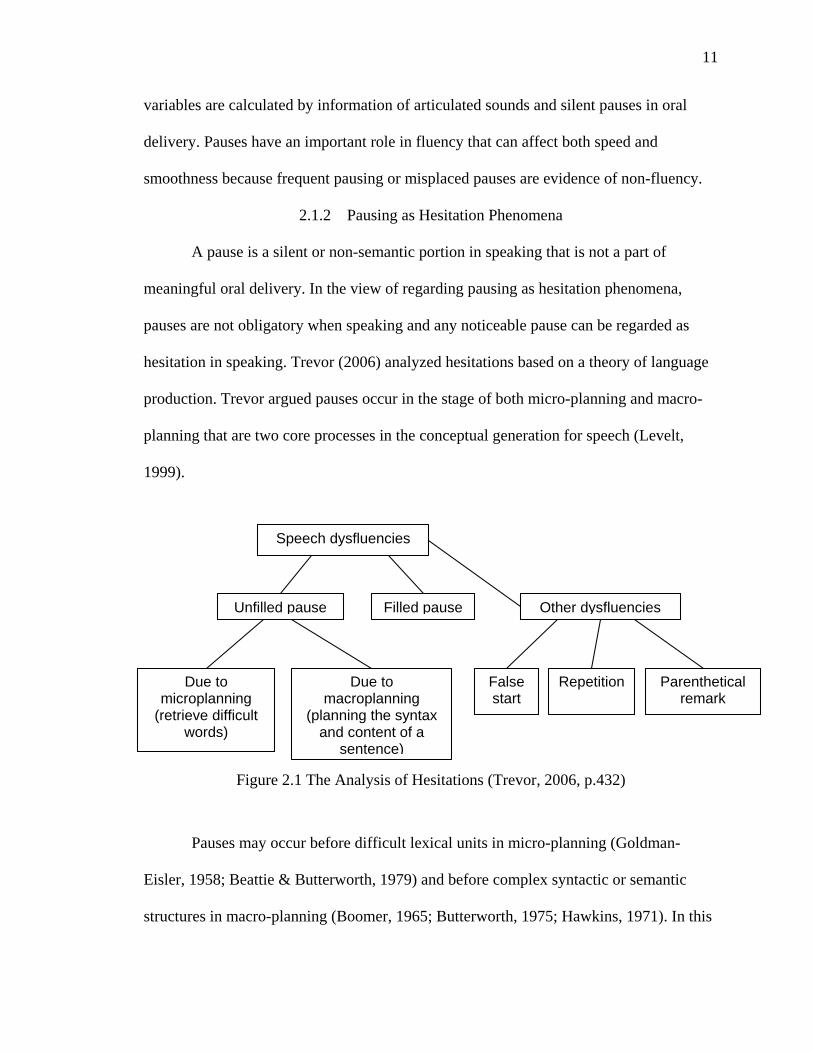
hesitation in speaking. Trevor (2006) analyzed hesitations based on a theory of language
production. Trevor argued pauses occur in the stage of both micro-planning and macro-
planning that are two core processes in the conceptual generation for speech (Levelt,
1999).
Figure 2.1 The Analysis of Hesitations (Trevor, 2006, p.432)
Pauses may occur before difficult lexical units in micro-planning (Goldman-
Eisler, 1958; Beattie & Butterworth, 1979) and before complex syntactic or semantic
structures in macro-planning (Boomer, 1965; Butterworth, 1975; Hawkins, 1971). In this
Speech dysfluencies
Unfilled pause Filled pause Other dysfluencies
Due to microplanning
(retrieve difficult words)
Due to macroplanning
(planning the syntax and content of a
sentence)
False start
Repetition Parenthetical remark
12
view, pauses may reflect evidence of additional effort in planning because there is
hesitation in oral delivery. Petrie (1987), based on the studies of Goldman-Eisler (1968),
discussed relationships between hesitation and word selection, speech task difficulty,
syntactic structure, and cognitive ‘cycles’ (semantic planning) in planning of utterances.
2.1.3 Characteristics of Silent Pauses
The term ‘unfilled pause’ refers to a silent pause that does not contain any
articulation. However, a very short silent part within an utterance would not be
recognized as hesitation. Goldman-Eisler (1958) noted that a pause of less than 0.25
seconds should not be considered a discontinuity (p. 12). However, she argued that, in
terms of planning of speech, a silent period longer than 0.25 seconds is related to
planning; and the silent pause may also contribute to reducing fluency, along with filled
pauses such as ‘uh’ and other dysfluencies such as self-repairs, repetitions, and false
starts.
Riggenbach (1991) investigated measures of fluency in the speech samples of
second language learners within an interactive context between NS (native speaker) and
NNS (non-native speaker). Riggenbach categorized measures of fluency into five parts:
1) hesitation phenomena, 2) repair phenomena, 3) rates and amount of speech, 4)
interactive phenomena, and 5) interactive features regarding to turn change types.
Hesitation phenomena included micropauses, hesitations, and unfilled pauses based on
their lengths, along with lexical and non-lexical filled pauses. Repair phenomena
included retraced restarts (i.e., reformulation in which part of the original utterance is
repeated) and unretraced restarts (i.e., reformation in which the original utterance is
rejected, or a ‘false start’). Rate and amount of speech included rate of speech (= number
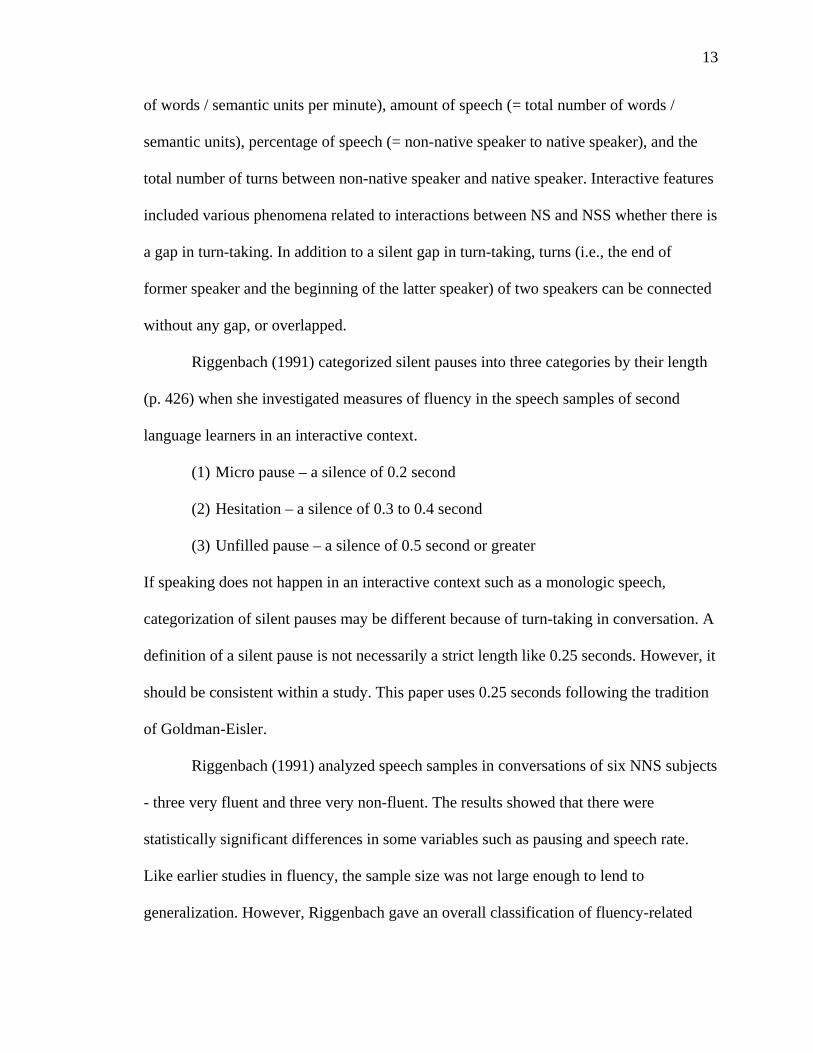
13
of words / semantic units per minute), amount of speech (= total number of words /
semantic units), percentage of speech (= non-native speaker to native speaker), and the
total number of turns between non-native speaker and native speaker. Interactive features
included various phenomena related to interactions between NS and NSS whether there is
a gap in turn-taking. In addition to a silent gap in turn-taking, turns (i.e., the end of
former speaker and the beginning of the latter speaker) of two speakers can be connected
without any gap, or overlapped.
Riggenbach (1991) categorized silent pauses into three categories by their length
(p. 426) when she investigated measures of fluency in the speech samples of second
language learners in an interactive context.
(1) Micro pause – a silence of 0.2 second
(2) Hesitation – a silence of 0.3 to 0.4 second
(3) Unfilled pause – a silence of 0.5 second or greater
If speaking does not happen in an interactive context such as a monologic speech,
categorization of silent pauses may be different because of turn-taking in conversation. A
definition of a silent pause is not necessarily a strict length like 0.25 seconds. However, it
should be consistent within a study. This paper uses 0.25 seconds following the tradition
of Goldman-Eisler.
Riggenbach (1991) analyzed speech samples in conversations of six NNS subjects
- three very fluent and three very non-fluent. The results showed that there were
statistically significant differences in some variables such as pausing and speech rate.
Like earlier studies in fluency, the sample size was not large enough to lend to
generalization. However, Riggenbach gave an overall classification of fluency-related
14
features and temporal variables. In addition, she provided a good description of the
results from dialogic as well as monologic speech samples. As mentioned in the
discussion of interactive phenomena, it is difficult to transcribe and mark interaction-
related features in the speech samples. For research purposes, it would be preferable to
narrow down the types of speech samples (e.g., a narrative task with a fixed content),
even though most speaking activities happen between two sides (i.e., speaker and
listener) with various and unlimited topics.
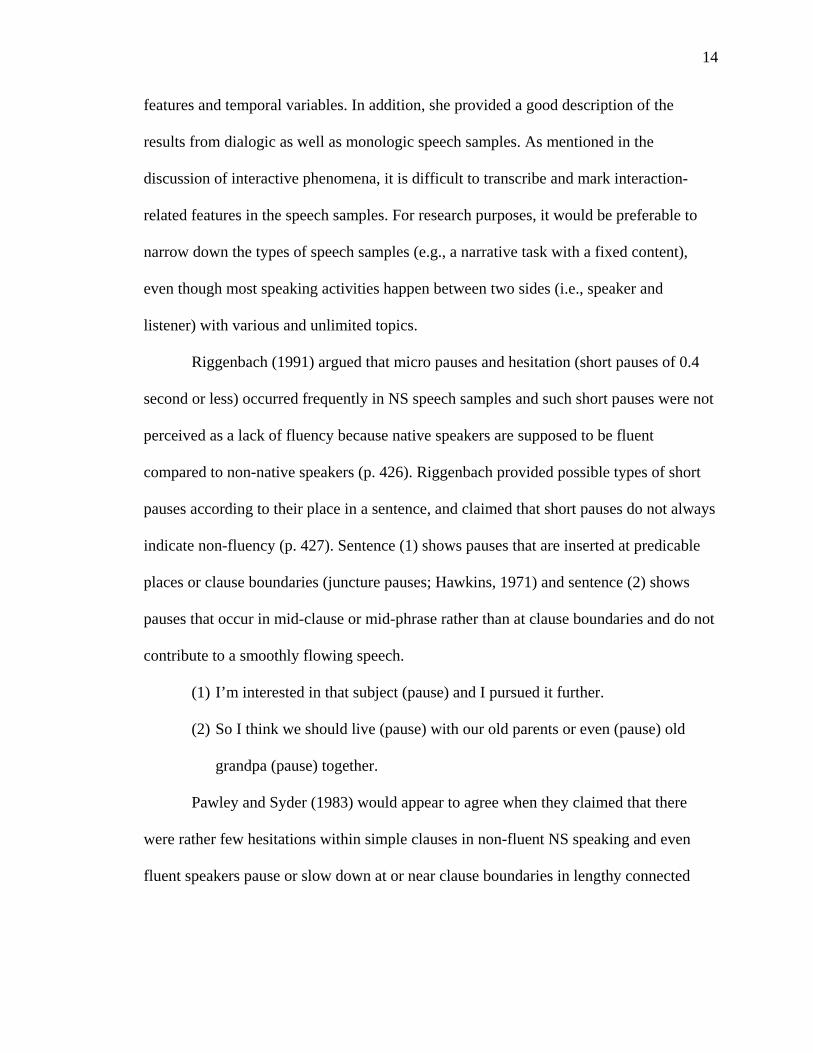
Riggenbach (1991) argued that micro pauses and hesitation (short pauses of 0.4
second or less) occurred frequently in NS speech samples and such short pauses were not
perceived as a lack of fluency because native speakers are supposed to be fluent
compared to non-native speakers (p. 426). Riggenbach provided possible types of short
pauses according to their place in a sentence, and claimed that short pauses do not always
indicate non-fluency (p. 427). Sentence (1) shows pauses that are inserted at predicable
places or clause boundaries (juncture pauses; Hawkins, 1971) and sentence (2) shows
pauses that occur in mid-clause or mid-phrase rather than at clause boundaries and do not
contribute to a smoothly flowing speech.
(1) I’m interested in that subject (pause) and I pursued it further.
(2) So I think we should live (pause) with our old parents or even (pause) old
grandpa (pause) together.
Pawley and Syder (1983) would appear to agree when they claimed that there
were rather few hesitations within simple clauses in non-fluent NS speaking and even
fluent speakers pause or slow down at or near clause boundaries in lengthy connected
15
discourse (p. 200). Pauses from NNS speaking would follow NS speaking in terms of
nativelike fluency and pauses may not indicate non-fluency either.
2.1.4 Pausing Positions in Oral Delivery
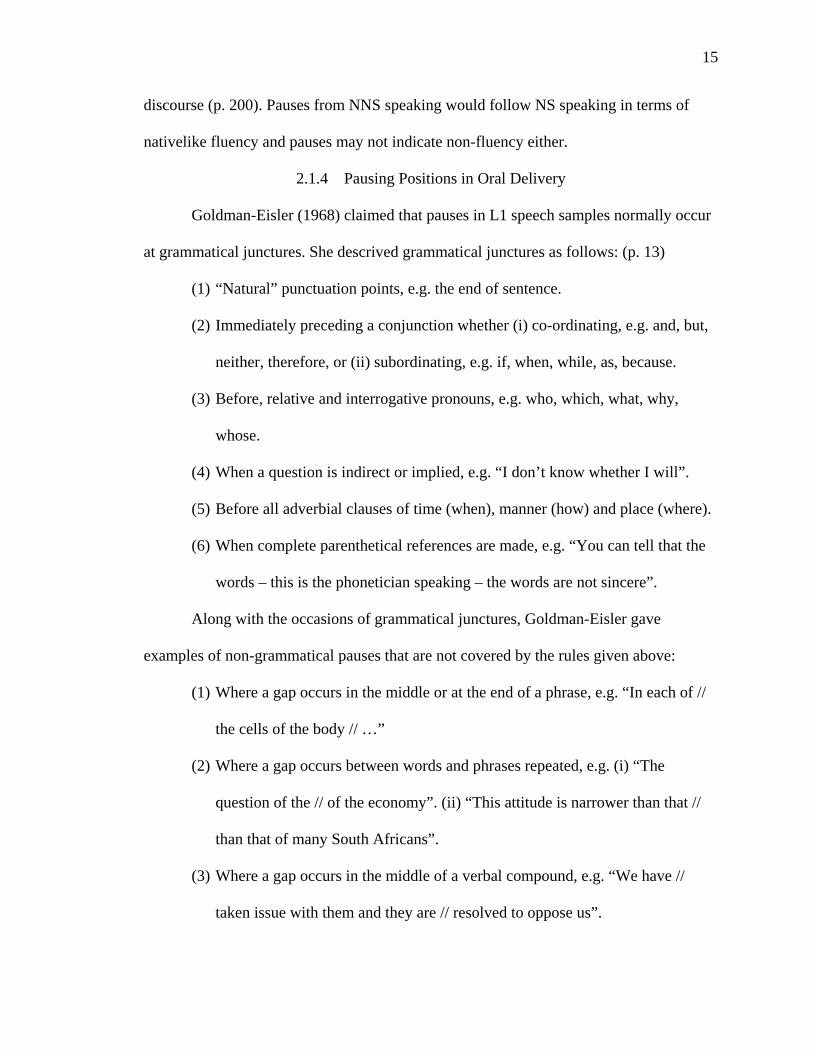
Goldman-Eisler (1968) claimed that pauses in L1 speech samples normally occur
at grammatical junctures. She descrived grammatical junctures as follows: (p. 13)
(1) “Natural” punctuation points, e.g. the end of sentence.
(2) Immediately preceding a conjunction whether (i) co-ordinating, e.g. and, but,
neither, therefore, or (ii) subordinating, e.g. if, when, while, as, because.
(3) Before, relative and interrogative pronouns, e.g. who, which, what, why,
whose.
(4) When a question is indirect or implied, e.g. “I don’t know whether I will”.
(5) Before all adverbial clauses of time (when), manner (how) and place (where).
(6) When complete parenthetical references are made, e.g. “You can tell that the
words – this is the phonetician speaking – the words are not sincere”.
Along with the occasions of grammatical junctures, Goldman-Eisler gave
examples of non-grammatical pauses that are not covered by the rules given above:
(1) Where a gap occurs in the middle or at the end of a phrase, e.g. “In each of //
the cells of the body // …”
(2) Where a gap occurs between words and phrases repeated, e.g. (i) “The
question of the // of the economy”. (ii) “This attitude is narrower than that //
than that of many South Africans”.
(3) Where a gap occurs in the middle of a verbal compound, e.g. “We have //
taken issue with them and they are // resolved to oppose us”.
16
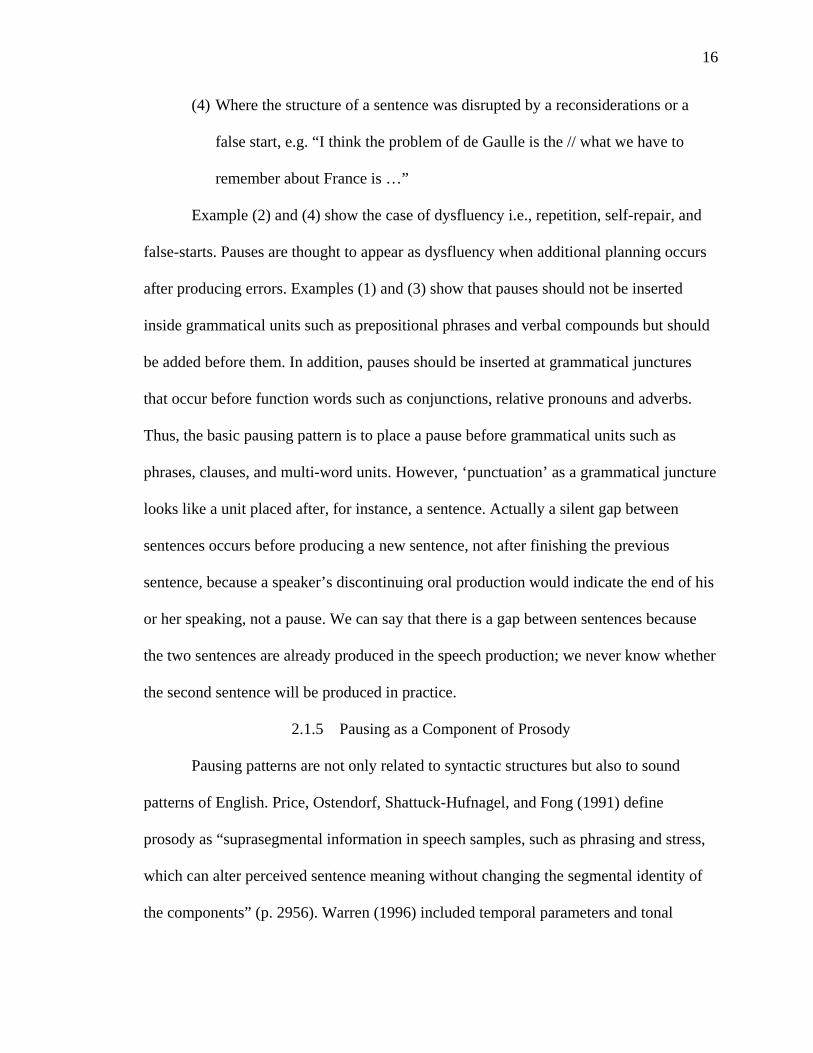
(4) Where the structure of a sentence was disrupted by a reconsiderations or a
false start, e.g. “I think the problem of de Gaulle is the // what we have to
remember about France is …”
Example (2) and (4) show the case of dysfluency i.e., repetition, self-repair, and
false-starts. Pauses are thought to appear as dysfluency when additional planning occurs
after producing errors. Examples (1) and (3) show that pauses should not be inserted
inside grammatical units such as prepositional phrases and verbal compounds but should
be added before them. In addition, pauses should be inserted at grammatical junctures
that occur before function words such as conjunctions, relative pronouns and adverbs.
Thus, the basic pausing pattern is to place a pause before grammatical units such as
phrases, clauses, and multi-word units. However, ‘punctuation’ as a grammatical juncture
looks like a unit placed after, for instance, a sentence. Actually a silent gap between
sentences occurs before producing a new sentence, not after finishing the previous
sentence, because a speaker’s discontinuing oral production would indicate the end of his
or her speaking, not a pause. We can say that there is a gap between sentences because
the two sentences are already produced in the speech production; we never know whether
the second sentence will be produced in practice.
2.1.5 Pausing as a Component of Prosody
Pausing patterns are not only related to syntactic structures but also to sound
patterns of English. Price, Ostendorf, Shattuck-Hufnagel, and Fong (1991) define
prosody as “suprasegmental information in speech samples, such as phrasing and stress,
which can alter perceived sentence meaning without changing the segmental identity of
the components” (p. 2956). Warren (1996) included temporal parameters and tonal
17
features in prosody. Warren defined temporal parameters as “the incidence and duration
of silent pauses, and the lengthening of speech segments and syllables before the
boundary” (p. 2) and noted that temporal parameters can be related to fluency in oral
delivery.
Ferreira (1993) provided the following example of prosodic boundary and
sentence structure (p. 234). The word ‘black’ in (1) would be produced longer than in (2)
with a pause. In other words, there is a prosodic boundary after the words ‘black’ in (1)
because (1) and (2) have different sentence structures.
(1) The table that I thought was black tempted me.
(2) The black table tempted me.
As pointed out in Fodor (2002), prosody has been widely researched in linguistics
in regards to sentence processing. It is obvious that we cannot easily separate prosody
from sentence processing in oral production and perception. Pausing phenomena as a part
of prosody are strongly related to sentence structure, and pauses can be investigated as
prosodic boundaries in sentence processing.
2.2 Measuring Oral Proficiency
2.2.1 Testing Oral Proficiency
The domain of language use and the situation of test takers may be differentiated
based upon the purpose of the oral proficiency test. Ginther (2003) summarized and
discussed various methods of testing the oral proficiency of International Teaching
Assistants (ITAs) in American universities. ITAs have the responsibility of teaching
undergraduate students in American university classrooms and therefore require
18
relatively high levels of oral proficiency to deliver the content of courses as well as
communicate with their students. In addition to teaching abilities, screening for the
position of ITA in American universities must pay special attention to oral proficiency
because the primary mode of instruction is oral. Thus, testing the oral English proficiency
of ITA is an example of language assessment for specific purposes.
Methods for assessing oral proficiency are categorized into indirect, semi-direct,
direct, and performance assessments. In the past, indirect methods produced scores for
English proficiency tests such as the TOEFL (Test of English as a Foreign Language) or
the GRE (Graduate Record Examination) verbal sections to determine the oral
proficiency of ITAs. Using indirect methods was based on assuming some correlation
between the TOEFL or the GRE verbal scores and levels of oral proficiency. However,
the use of indirect measures for ITA screening was problematic because TOEFL and
GRE did not include a speaking section.1
Semi-direct tests allow for large-scale measurement of oral proficiency through
testing actual spoken English. Ginther (2003) mentioned that the Test of Spoken English
(TSE) 2 is the classic example of a semi-direct test of oral proficiency. The main
characteristic of semi-direct tests is the absence of an interlocutor. In the TSE, examinees
responded to a series of prompts, which were audio taped and then sent to Educational
Testing Service (ETS) to be scored. Thus, there was no interaction with an interlocutor.
Despite the difference in tasks and interactions in direct and semi-direct measures,
1 The most recent version of TOEFL iBT does include a speaking section and TOEFL iBT is therefore no longer an indirect form of assessment. 2 TSE is not provided by ETS anymore due to the inclusion of a speaking section in the TOEFL iBT.
19
linguistic features appear to be similar, although responses from semi-direct tests have
been formed to be more coherent and organized due to the nature of the tasks and lack of
an interlocutor (p. 69).
Ginther (2003) explained that semi-direct tests provide no opportunity for
interaction with an interlocutor. However, for evaluating the teaching abilities of ITAs,
semi-direct tests have the advantage of evaluating examinees’ abilities in a standard
manner without the informality, interruptions, and asides associated with casual
conversation or interviews.
Purdue’s Oral English Proficiency Test (OEPT) was designed to test
communicative abilities of ITAs using a computer-based administrative platform. The
OEPT is a locally designed and administrated English test for a specific population:
international graduate students at a large mid-western American university. The OEPT
uses prompts that simulate various situations for TAs to provide information about the
abilities required for performing TA-related work (e.g, giving advice to students, leaving
message for an office mate). Thus, the OEPT not only evaluates general oral English
proficiency that is needed for studying at the graduate level, but also presents
communicative language abilities that are needed to become a successful ITA.
Ginther (2003) gave an example of Oral Proficiency Interviews (OPIs) for the
explanation of direct tests. OPIs are argued to test speaking ability in ‘real-life’ situations
because there is interaction between an interviewer and the examinee. However, OPIs do
not actually mirror natural conversation because examinees respond to interview
questions, but both testers and examinees might favor the interview format because it
allows for more control of the interaction through interaction and negotiation.
20
The final category of tests for ITAs is performance assessments. Ginther (2003)
explained that the common form of performance assessments is a teaching simulation. An
examinee of an ITA screening test is asked to prepare a short presentation on a topic from
the examinee’s field of study. Performance assessments have the advantage of simulating
classroom environments by giving an examinee the chance to teach in English. However,
like interviews, performance assessments are still not identical to natural teaching
situations and they are not cost-effective. Direct tests and performance assessments might
have greater face validity with respect to natural oral conversation, but they are not
always favored because of the considerable cost and the lack of reliability of test results
across performance contexts.
2.2.2 Measuring Fluency with Temporal Variables
Measuring the speed of oral delivery using temporal variables has been widely
used in fluency research of second language speakers (Möhle, 1984; Lennon, 1990;
Riggenbach, 1991; Towell, Hawkins, & Bazergui, 1996; Cucchiarini, Strik, & Boves,
2002; Wood, 2004; Kormos & Denes, 2004; Ginther, Dimova, & Yang, 2010). Based on
the literature, it is clear that temporal variables such as speech rate and mean syllables per
run are positively correlated with proficiency. It makes sense that L2 speakers with high
proficiency can speak faster than speakers with low proficiency. Furthermore, temporal
measures of fluency are reliable measures of oral proficiency because researchers can
provide an objective guideline of how to extract temporal features from speech samples
such as total response time, number of syllables, and number of pauses.
Monologic speech samples are common to many fluency studies (e.g., retelling a
story after watching video clips or responding to a question). However, Riggenbach
21
(1991) analyzed speech samples from interviews and noted that interactive situation is a
more natural environment for the use of spoken language. That being said, for ITAs who
will often be giving short lectures and instructions, monologues may also be considered
an appropriate measure. Analyzing monologic speech samples has the advantage of
control. Speech samples do not contain pausing features common to interaction and
extracting temporal and pausing information is much simpler.
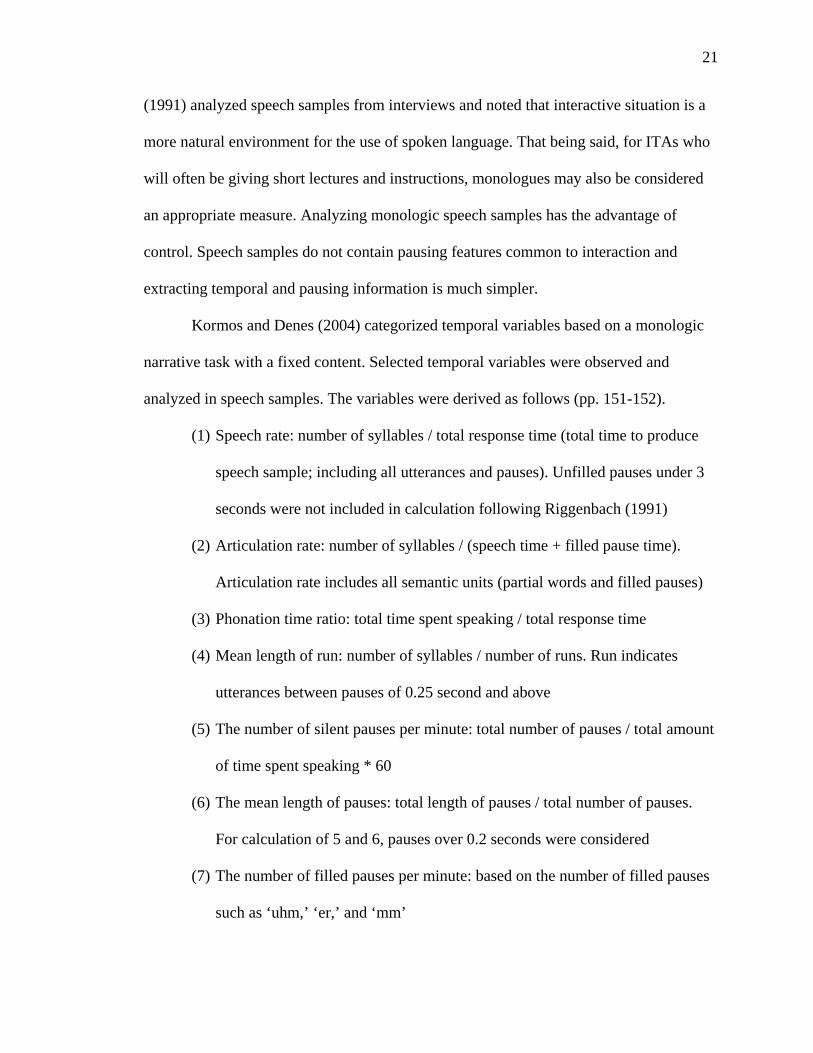
Kormos and Denes (2004) categorized temporal variables based on a monologic
narrative task with a fixed content. Selected temporal variables were observed and
analyzed in speech samples. The variables were derived as follows (pp. 151-152).
(1) Speech rate: number of syllables / total response time (total time to produce
speech sample; including all utterances and pauses). Unfilled pauses under 3
seconds were not included in calculation following Riggenbach (1991)
(2) Articulation rate: number of syllables / (speech time + filled pause time).
Articulation rate includes all semantic units (partial words and filled pauses)
(3) Phonation time ratio: total time spent speaking / total response time
(4) Mean length of run: number of syllables / number of runs. Run indicates
utterances between pauses of 0.25 second and above
(5) The number of silent pauses per minute: total number of pauses / total amount
of time spent speaking * 60
(6) The mean length of pauses: total length of pauses / total number of pauses.
For calculation of 5 and 6, pauses over 0.2 seconds were considered
(7) The number of filled pauses per minute: based on the number of filled pauses
such as ‘uhm,’ ‘er,’ and ‘mm’
22
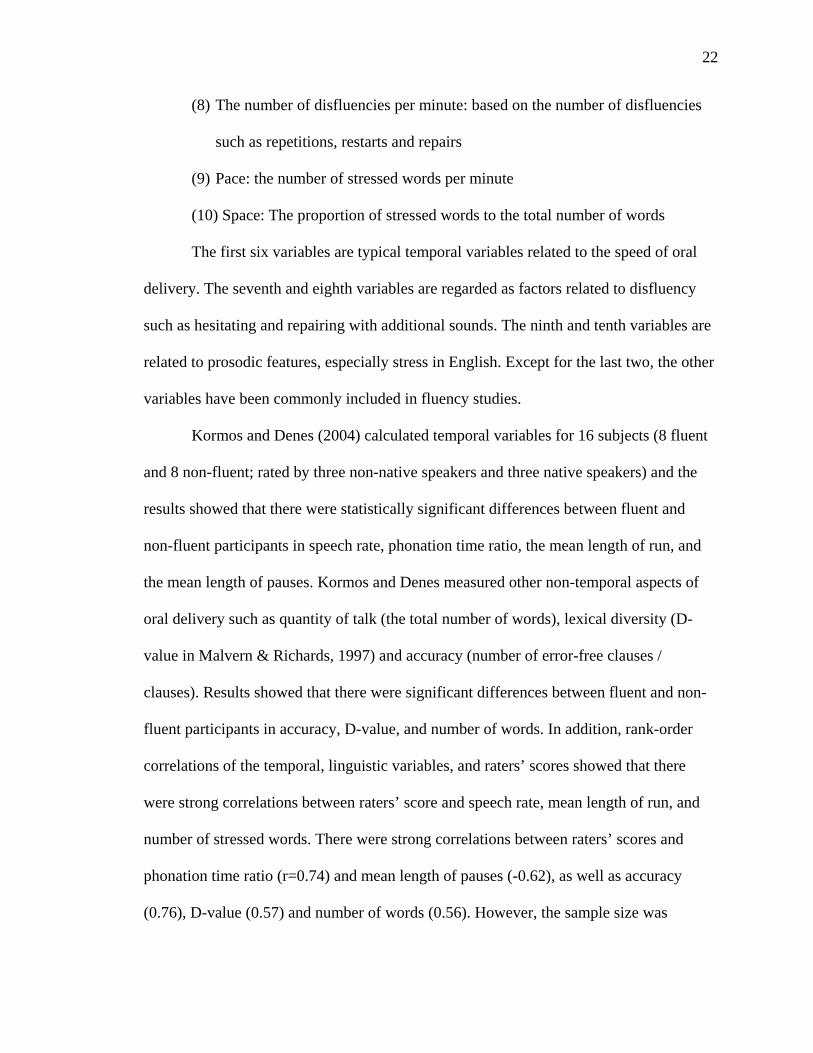
(8) The number of disfluencies per minute: based on the number of disfluencies
such as repetitions, restarts and repairs
(9) Pace: the number of stressed words per minute
(10) Space: The proportion of stressed words to the total number of words
The first six variables are typical temporal variables related to the speed of oral
delivery. The seventh and eighth variables are regarded as factors related to disfluency
such as hesitating and repairing with additional sounds. The ninth and tenth variables are
related to prosodic features, especially stress in English. Except for the last two, the other
variables have been commonly included in fluency studies.
Kormos and Denes (2004) calculated temporal variables for 16 subjects (8 fluent
and 8 non-fluent; rated by three non-native speakers and three native speakers) and the
results showed that there were statistically significant differences between fluent and
non-fluent participants in speech rate, phonation time ratio, the mean length of run, and
the mean length of pauses. Kormos and Denes measured other non-temporal aspects of
oral delivery such as quantity of talk (the total number of words), lexical diversity (D-
value in Malvern & Richards, 1997) and accuracy (number of error-free clauses /
clauses). Results showed that there were significant differences between fluent and non-
fluent participants in accuracy, D-value, and number of words. In addition, rank-order
correlations of the temporal, linguistic variables, and raters’ scores showed that there
were strong correlations between raters’ score and speech rate, mean length of run, and
number of stressed words. There were strong correlations between raters’ scores and
phonation time ratio (r=0.74) and mean length of pauses (-0.62), as well as accuracy
(0.76), D-value (0.57) and number of words (0.56). However, the sample size was
23
relatively small. Despite the assistance of computer-assisted tools to transcribe and
extract temporal variables as in Kormos & Denes, analyzing speech samples remains a
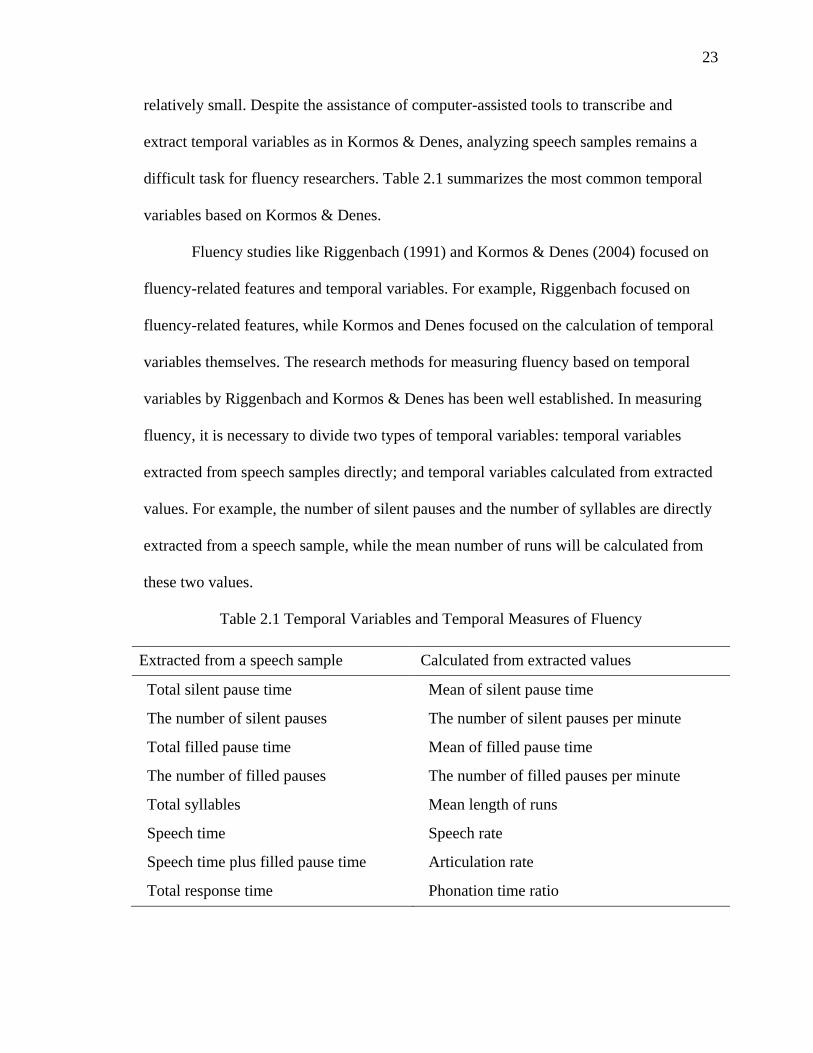
difficult task for fluency researchers. Table 2.1 summarizes the most common temporal
variables based on Kormos & Denes.
Fluency studies like Riggenbach (1991) and Kormos & Denes (2004) focused on
fluency-related features and temporal variables. For example, Riggenbach focused on
fluency-related features, while Kormos and Denes focused on the calculation of temporal
variables themselves. The research methods for measuring fluency based on temporal
variables by Riggenbach and Kormos & Denes has been well established. In measuring
fluency, it is necessary to divide two types of temporal variables: temporal variables
extracted from speech samples directly; and temporal variables calculated from extracted
values. For example, the number of silent pauses and the number of syllables are directly
extracted from a speech sample, while the mean number of runs will be calculated from
these two values.
Table 2.1 Temporal Variables and Temporal Measures of Fluency
Extracted from a speech sample Calculated from extracted values
Total silent pause time Mean of silent pause time
The number of silent pauses The number of silent pauses per minute
Total filled pause time Mean of filled pause time
The number of filled pauses The number of filled pauses per minute
Total syllables Mean length of runs
Speech time Speech rate
Speech time plus filled pause time Articulation rate
Total response time Phonation time ratio
24
Ginther, Dimova, and Yang (2010) conducted research on temporal measures of
fluency using a relatively large number of sample responses to the OEPT (Oral English
Proficiency Test). The 150 subjects represented various language backgrounds and levels
of English proficiency. The OEPT had 8 different test items. The examinees’ responses to
each item were rated by trained raters using a holistic scale ranging from 3 to 6. Test
takers who got scores of 3 and 4 were placed into a language support program while test
takers with 5 and 6 could teach in classroom without additional training in English.
Ginther, et al. (2010) analyzed OEPT examinee responses to measure their
fluency in English. Analyses were conducted on responses to the news item (NP) in
which test takers gave an opinion after reading a news passage related to life at the
university. The language backgrounds of examinees were the two largest populations of
ITAs: Chinese and Hindi. In addition, L1 English speakers recorded responses to provide
a comparison with the L2 English speakers. All speech samples were transcribed to
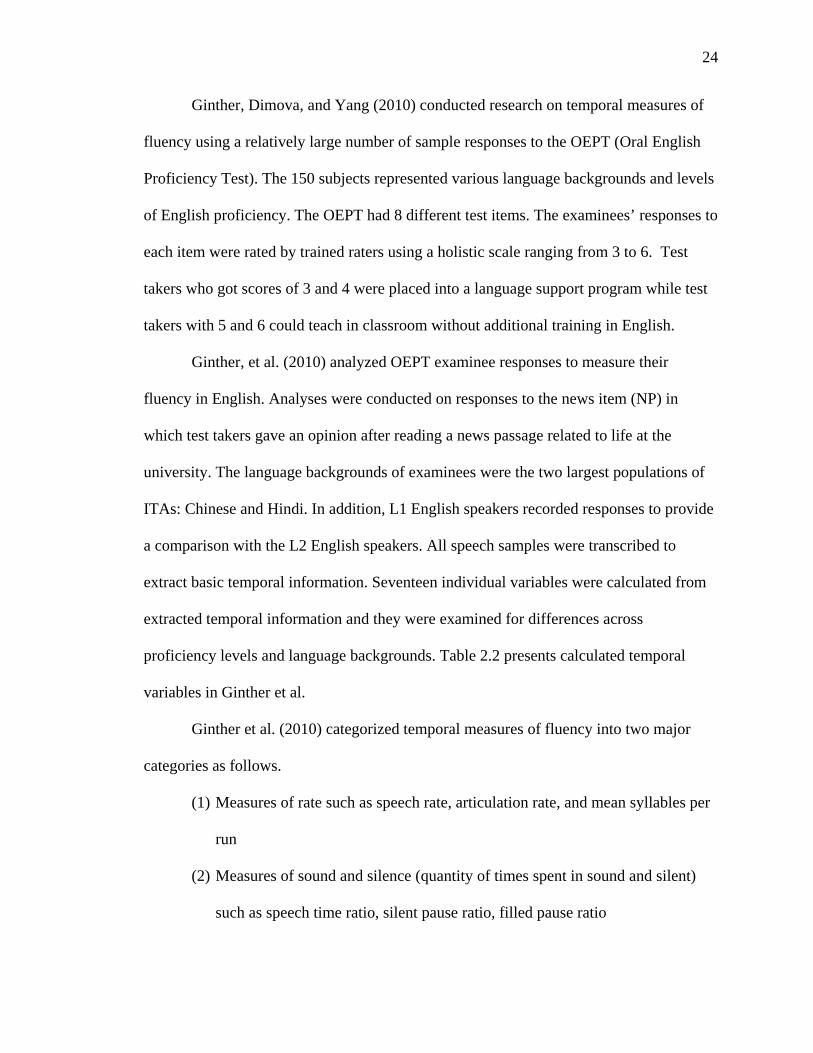
extract basic temporal information. Seventeen individual variables were calculated from
extracted temporal information and they were examined for differences across
proficiency levels and language backgrounds. Table 2.2 presents calculated temporal
variables in Ginther et al.
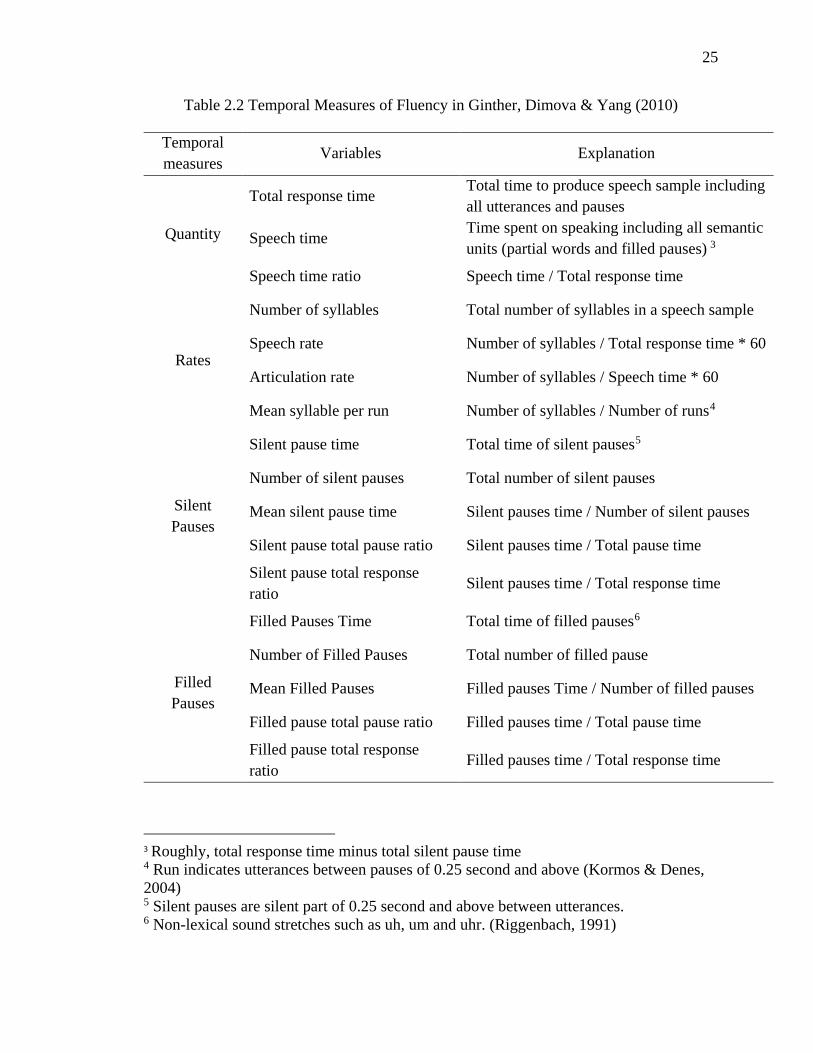
Ginther et al. (2010) categorized temporal measures of fluency into two major
categories as follows.
(1) Measures of rate such as speech rate, articulation rate, and mean syllables per
run
(2) Measures of sound and silence (quantity of times spent in sound and silent)
such as speech time ratio, silent pause ratio, filled pause ratio
25
Table 2.2 Temporal Measures of Fluency in Ginther, Dimova & Yang (2010)
Temporal measures
Variables Explanation
Quantity
Total response time Total time to produce speech sample including all utterances and pauses
Speech time Time spent on speaking including all semantic units (partial words and filled pauses) 3
Speech time ratio Speech time / Total response time
Rates
Number of syllables Total number of syllables in a speech sample
Speech rate Number of syllables / Total response time * 60
Articulation rate Number of syllables / Speech time * 60
Mean syllable per run Number of syllables / Number of runs4
Silent Pauses
Silent pause time Total time of silent pauses5
Number of silent pauses Total number of silent pauses
Mean silent pause time Silent pauses time / Number of silent pauses
Silent pause total pause ratio Silent pauses time / Total pause time
Silent pause total response ratio
Silent pauses time / Total response time
Filled Pauses
Filled Pauses Time Total time of filled pauses6
Number of Filled Pauses Total number of filled pause
Mean Filled Pauses Filled pauses Time / Number of filled pauses
Filled pause total pause ratio Filled pauses time / Total pause time
Filled pause total response ratio
Filled pauses time / Total response time
3 Roughly, total response time minus total silent pause time 4 Run indicates utterances between pauses of 0.25 second and above (Kormos & Denes, 2004) 5 Silent pauses are silent part of 0.25 second and above between utterances. 6 Non-lexical sound stretches such as uh, um and uhr. (Riggenbach, 1991)
26
The measures of rate are related to how quickly speakers produced their oral
delivery. For example, speech rate shows how many syllables are produced in one
minute. The research showed that a speaker who was rated highly in terms of English
proficiency produced a higher number of syllables per minute indicating they can talk
relatively quickly and continuously, as compared to lower proficiency speakers.
The measures of sound and silence are related to pausing as hesitation phenomena in oral
delivery. Ginther et al. (2010) found that there was no significant difference in filled
pause ratio across proficiency levels. Thus, it may not be necessary to examine filled
pauses separately and it may be possible to incorporate them with either silent pauses or
vocalization. It may be more natural to include filled pauses with silent pauses and
speech time ratio will be the same as silent pause ratio. Thus, we can contrast the silent
parts and the sounding parts of speech samples more effectively. Speech samples from
lower proficiency levels are composed of, on average 60% sound and 40% pausing, while
at higher proficiency levels it is on average 80% sound and 20% pausing (p. 392). To be
succinct, more pausing contributes to less fluent oral delivery and is correlated with a
lower proficiency level.
2.2.3 Measuring Smoothness of Fluency with Pausing Pattern
Speaking consists of sound creation that contains the actual content of oral
delivery and pausing that contains silence and non-lexical vocalization. It is important to
note that even a speech sample from a speaker who has a high proficiency level has 20%
pausing. Those pauses do not always indicate non-fluency and pauses in expected
position do not reduce the smoothness of oral delivery and may even facilitate listeners’
understanding. In other words, pauses do not always indicate a lower proficiency level of
27
speaking when they are in expected positions. From the discussions of characteristics of
pauses and their positions in Riggenbach (1991) and Goldman-Eisler (1968), the
positions of pauses may greatly contribute to the effective delivery of oral production.
Additionally, understanding pausing as a prosodic phenomenon and investigating its
patterns in oral delivery would help clarify the nature of fluency.
28
CHAPTER 3. RESEARCH QUESTION
The focus of this paper is the evaluation of oral proficiency through fluency
measures that are one of the most crucial components in language proficiency.
Examining fluency as a proxy for overall oral proficiency can be done by measuring
temporal variables and pausing patterns for the speed and smoothness of oral delivery.
This study uses responses from the OEPT for speech samples of various language
background and proficiency levels. Ginther et al. (2010) examined OEPT data regarding
temporal variables and showed that fluency may represent overall oral proficiency well.
Ginther, et al analyzed the old OEPT while this study analyses the second version of
OEPT (OEPT2) that is currently provided to international graduate students. The result of
this paper are expected to be similar to Ginther, et al. That is, speakers at higher
proficiency levels produce their responses faster than lower proficiency levels. However,
the result of this paper does not include a comparison of the temporal variables in
responses from OEPT1 and OEPT2 to validate each test in terms of fluency.
Examining fluency is done by analyzing temporal and pausing information in
speech samples. First, finding and summarizing expected pausing positions is necessary
for examining pausing patterns in different proficiency levels of L2 English. This
analysis is done through the read-aloud (RAL) item. Inspecting pausing patterns in read-
aloud speech samples across various L2 English levels including L1 English speakers
29
gives a basic idea of probable pausing patterns. Test takers read the same passages for the
RAL item and place pauses differently in their responses; some of the pauses would be
placed in expected positions while some are not. Speech samples from L1 speakers and
high proficiency level speakers should show expected pausing patterns as compared to
low level speakers. After finding a list of expected pausing positions from the RAL item,
the speech samples from the free-response news (NP) item are analyzed to compare
fluency with regards to pausing patterns of three different language groups of Korean,
Chinese, and Hindis with different proficiency levels from 35 to 60.
This study addresses the following research questions regarding measuring oral
proficiency in the responses from the OEPT2:
(1) What computer-assisted annotation tool and detailed procedures of measuring
temporal variables and pausing patterns in speech samples can most
effectively and consistently measure fluency?
(2) Can temporal variables effectively represent overall oral proficiency? Are
there differences across proficiency levels and language backgrounds
regarding the speed of oral delivery?
(3) Can pausing patterns effectively represent overall oral proficiency? Are there
differences across proficiency levels and language backgrounds regarding the
smoothness of oral delivery?
The first question (1) concerns the main contribution of this paper. The discussion
on the first question aims to establish procedures in measuring fluency by designing and
developing a computer-assisted annotation tool, and analyzing fluency variables using the
tool to process large amounts of speech samples. The second question (2) was discussed
30
in Ginther et al. (2010) regarding the responses from the OEPT1 and it is re-examined for
the OEPT2 for the further discussion of speed of oral delivery. The third question (3)
extends the second question of examining temporal variables to examining pausing
patterns related to smoothness of oral delivery.
31
CHAPTER 4. METHODOLOGY
4.1 Speech Samples
The speech samples used in this study are test takers’ responses from two OEPT
items. Test items are designed to represent various situations in language use that
correspond to instructional domains. Trained human raters evaluate recorded responses
from the OEPT using a holistic rating scale for evaluating the oral proficiency of test
takers. The human raters consider overall oral proficiency or general language
proficiency of the test takers when scoring the responses, they do not necessarily focus on
a certain component of oral proficiency such as fluency. The OEPT scale rubrics used for
holistic scoring include references to pronunciation, fluency, grammar, vocabulary,
content, and coherence. These six factors in the OEPT scale are common components of
oral proficiency scales (ETS, 2008). The main characteristics of the responses from the
examinees of the OEPT are as follows: the responses are recorded by graduate students
who have relatively high levels of English proficiency; the responses from test-takers are
monologic and fixed to each item because test-takers are supposed to make their
responses based on the prompt; and the responses are categorized by oral proficiency
level using holistic scoring by trained human raters.
This paper uses speech samples from the OEPT2. The OEPT scale ranges from 35
to 60. As a whole, all six factors in the OEPT scale represent oral proficiency of an
32
English learner by the proficiency levels of 35, 40, 45, 50, 55, and 60. In other words, the
oral proficiency of test takers is categorized into six levels using the holistic rating factors
mentioned above. Some factors, such as pronunciation, fluency, grammar, and
vocabulary, can be quantified easily, while others, such as content and coherence, are less
easily quantified.
Speech samples analyzed in this paper are randomly selected from the news item
(NP) following Ginther et al. (2010). In the news item, a news passage is provided to test-
takers as a prompt and the test-takers will respond with their own opinions and comments
about the news passage. In addition to NP, the read-aloud item (RAL) is analyzed for
providing expected pausing patterns to measure smoothness. The speech samples are
selected among the responses from test takers of the OEPT whose language backgrounds
are Korean, Mandarin Chinese (the majority Chinese language group represented among
OEPT examinees), and Hindi. It would be ideal if we had speech samples across all six
proficiency levels with each language background. However, there are not enough
examinees at certain levels. For example, most Hindi speakers have a higher level of
proficiency (50 and above) while there are fewer Chinese and Korean speakers who score
at 50 or above. Furthermore, there are few speakers who score 60 on the OEPT partly due
to the fact that international students who score higher than 27 on the TOEFL speaking
do not need to take the OEPT. With those limitations in mind, this paper looks at speech
samples from levels 35, 40, 45, and 50 for Korean speakers, levels 35, 40, 45, 50, and 55
for Chinese speakers, and levels 50, 55, and 60 for Hindi speakers.
Korean, Chinese, and Hindi speakers have different language backgrounds that
interact with English proficiency and Hindi speakers who have relatively higher
33
proficiency levels may not be compared directly with the lower levels of Korean and
Chinese speakers. Similarly, it may not be possible to compare the measures of fluency
across proficiency levels including L1 English speakers. L1 English speakers do not use
English as a second language or a foreign language and they belong to a different
population compared to L2 English speakers. However, analyzing speech samples from
Hindi speakers gives some patterns of fluency in L2 English that can be used for
analyzing relatively lower proficiency L2 English from Korean and Chinese speakers.
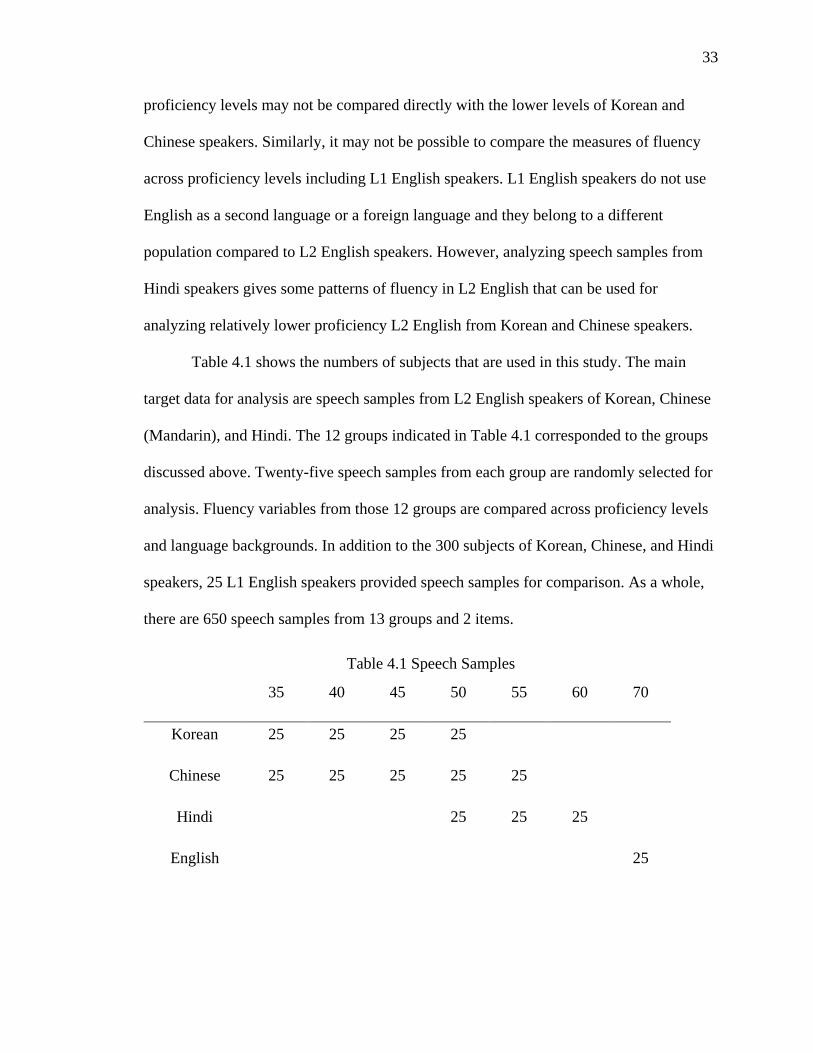
Table 4.1 shows the numbers of subjects that are used in this study. The main
target data for analysis are speech samples from L2 English speakers of Korean, Chinese
(Mandarin), and Hindi. The 12 groups indicated in Table 4.1 corresponded to the groups
discussed above. Twenty-five speech samples from each group are randomly selected for
analysis. Fluency variables from those 12 groups are compared across proficiency levels
and language backgrounds. In addition to the 300 subjects of Korean, Chinese, and Hindi
speakers, 25 L1 English speakers provided speech samples for comparison. As a whole,
there are 650 speech samples from 13 groups and 2 items.
Table 4.1 Speech Samples
35 40 45 50 55 60 70
Korean 25 25 25 25
Chinese 25 25 25 25 25
Hindi 25 25 25
English 25
34
This study uses a factor of proficiency levels (OEPT rating 35, 40, 45, 50, 55, and
60) combined with language backgrounds (i.e., Korean, Mandarin Chinese, and Hindi) as
an independent variable. The measures of fluency such as speed and smoothness of oral
delivery are the dependent variables of this study. The speech samples from the OEPT
are already categorized by proficiency level and language background, therefore this
study does not attempt to classify speech samples by their fluency measure into different
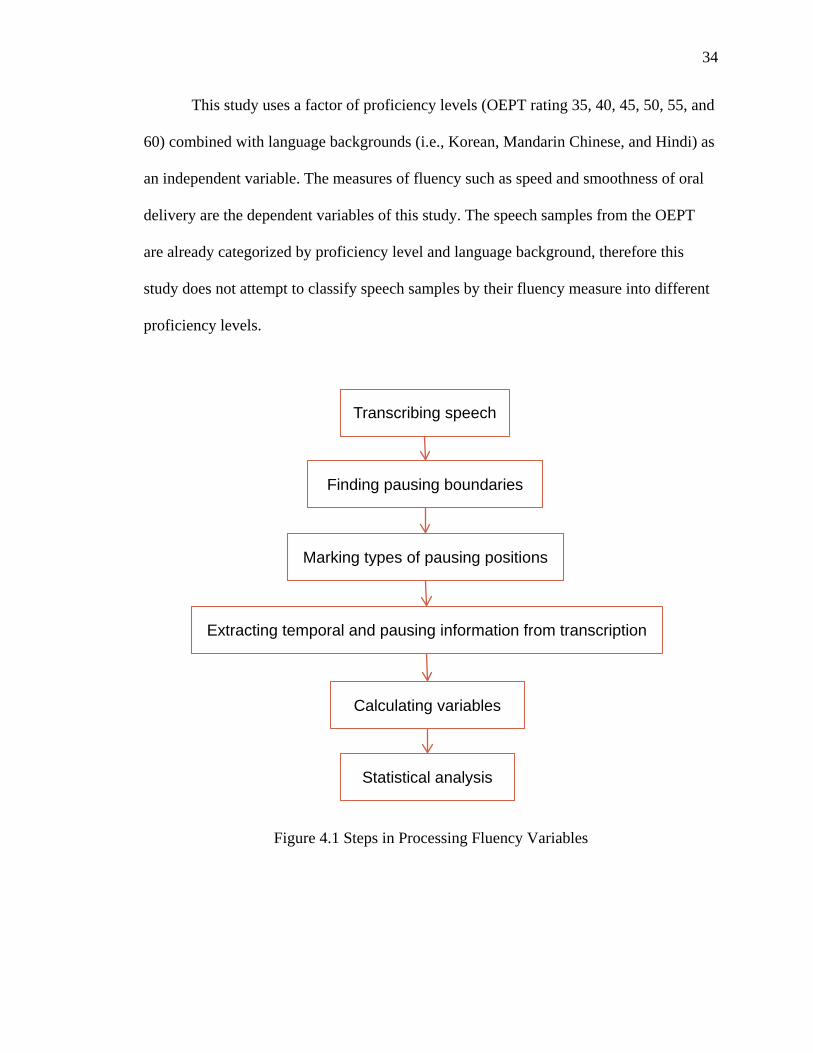
proficiency levels.
Figure 4.1 Steps in Processing Fluency Variables
Transcribing speech
Finding pausing boundaries
Marking types of pausing positions
Extracting temporal and pausing information from transcription
Calculating variables
Statistical analysis
35
4.2 Procedures
Figure 4.1 shows steps in processing fluency variables from speech samples.
Analyzing fluency in speech samples includes transcribing speech samples, finding
pausing boundaries, and marking types of pausing positions to extract temporal and
pausing information. From that information, temporal and pausing variables are
calculated for further analysis across proficiency levels and language backgrounds.
Figure 4.1 shows the procedures of data analysis in this study.
4.2.1 Definition of a Pause
This study defines a silent pause as a silent part longer than 0.25 seconds between
runs, following Goldman-Eisler (1968). Runs in the study of fluency are defined by the
sounding part between silent pauses and the definitions of run and silent pause are in fact
circular. Thus, it would be easier to say that categorizing parts in a speech sample into
sounding and silent and call sounding part ‘run’ and silent part ‘pause’. This study uses
‘run’ to denote sounding parts in a speech sample and ‘pause’ for the remaining parts
other than sounding parts.
Additionally, this study separates filled pauses from silent pauses and finds
boundaries of filled pauses in addition to silent pauses. However, filled pauses are not
included in runs. More specifically, filled pauses are not categorized separately and
included in silent pauses when counting the number of pauses. The number of filled
pauses, then, is not added to the number of syllables. Because filled pauses are not
included in syllables, filled pauses do not affect speech rates. However, filled pauses may
affect other measures of fluency that contain the number of pauses in their calculation
36
such as mean syllable per run because runs can be separated by filled pauses not just by
silent pauses.
This study does not categorize silent pauses by their lengths like Riggenbach
(1991). Long pauses may be categorized into different dysfluency factors because
different processing efforts may vary in different lengths of pauses. However, there is no
practical use in discerning these longer pauses in tested speech samples in this case,
regardless of either reading or spontaneous speech due to the fact that long pauses do not
occur frequently in oral production with an interlocutor. For example, if there is a long
pause in a conversation, people would take turns instead of waiting. In other words, a
silent part over than 200 or 300 milliseconds is usually recognized as a sign of turn taking
during conversation or completion of the task. In a response to an interview question,
people would insert filled pauses or small words (e.g., you know) to fill gaps in the effort
of avoiding an awkward long silence.
Categorizing short pauses by their length is unnecessary as well because slight
differences across pausing times are hardly noticed. For example, it is unclear whether a
silent pause of 0.5 seconds indicates double efforts in planning compared to a silent pause
of 0.25 seconds. Length of pause, rather, is dependent on an individual’s language
proficiency. Speakers who tend to make longer pauses might be more likely to include
many pauses in their oral production. In sum, a unified standard length of silent pauses
needs to be selected to normalize and measure temporal variables related to pauses such
as number of pauses. The selected length of silent pauses in this study is 0.25 seconds
following Goldman-Eisler (1968). Any silent part shorter than 0.25 seconds is not
37
regarded as a silent pause and all the silent parts longer than 0.25 seconds are categorized
as pauses regardless of their lengths.
4.2.2 Transcribing Speech Samples
All speech samples were transcribed manually by using a computer assisted tool.
There are several computer assisted tools that can be used for transcribing speech
samples (e.g., Praat7). However, those applications are not specially designed for
analyzing measures of fluency. Rather, they are targeted for discourse or acoustic
analysis. An application for transcribing and tagging fluency information has been
developed for this study. The application aids the transcription of speech samples, finds
pausing boundaries, counts the numbers of syllables and pauses, and marks
expected/unexpected pausing positions.
There are several ways to transcribe speech samples to mark temporal and
pausing information. For example, listening to an audio file while typing its content is a
simple method. However, using a computer assisted tool is a reasonable way to do data
analysis. One of the most popular transcribing tools is Praat, and Ginther et al. (2010)
used Praat to transcribe speech samples to get temporal information. Praat is a very
powerful acoustic analysis tool and has some advantages in transcribing speech samples.
For fluency analysis specifically, it provides the means for most essential function of
marking boundaries of sound and silence in speech samples. This aids in classifying
pauses and runs. Additionally, because Praat is an acoustic analysis tool, it is possible to
7 http://www.fon.hum.uva.nl/praat/
38
find syllables in a speech sample and count the number of syllables automatically without
transcribing its actual contents. (De Jong & Wempe, 2009).
However, Praat is a rather general tool for acoustic and phonetic analysis and not
specifically designed for fluency research. Finding and marking boundaries of sound and
silence in oral production is just one function of Praat; there are other functions that are
irrelevant to transcribing temporal and pausing information. The function of finding
syllables appears at first to be very useful, but the function is not 100% accurate when
detecting syllables. In order to count the number of syllables manually, the actual content
of the speech sample needs to be transcribed. Although Praat can transcribe the content of
oral production and mark the boundaries of sound and silence, it is not an ideal tool for
transcribing speech samples and extracting fluency information. When using Praat
directly for fluency research, there are several additional steps needed to apply functions
in Praat for analyzing speech samples. Besides, Praat saves results in its unique format of
text grid files and the result files from Praat need to be processed in order to extract
fluency information. Praat has lots of potential to use in various areas of acoustic analysis
but using Praat for annotate fluency information in a speech sample is not the main
application of Praat and using a targeted computer-assisted tool for fluency analysis is the
better choice in fluency researches.
For these reasons, I developed a computer-assisted annotation tool using Python8
for this study. The development of the tool is essential in terms of establishing an
effective methodology for measuring fluency. Considerations when designing the tool
8 https://www.python.org/
39
were focused on assisting the transcription of oral production and marking temporal and
pausing information. The tool is intended to aid in the transcription of speech samples in
order to analyze fluency and not considered for other applications such as discourse
analysis. The tool is a combination audio player and text editor for transcribing an audio
file, in this case a speech sample. It also has several other functions for marking temporal
and pausing information and saves analysis results in JSON9 files that can be directly
used for calculating fluency variables.
4.2.2.1 The Annotation Tool
Figure 4.2 shows a sample of the transcribing tool during use. The design and
implementation of the tool follows the steps in processing fluency variables in Figure 4.1.
Transcribing a speech sample and finding pausing boundaries in the speech sample are
not completely separated processes and can be done simultaneously. It is not likely to
listen to the whole speech sample at once and transcribe all of its content, and it is
necessary to break down the speech sample into small parts to process easily. Thus, it
would be good to mark pausing boundaries roughly first to break down the speech sample
by looking at the wave form of the speech sample. And then exact pausing boundaries
will be found and marked along with the actual transcription of the speech sample by
listening to each part.
The annotation tool is composed of three main parts that implement the first three
steps in Figure 4.1: transcribing speech sample, finding pausing boundaries, and marking
types of pausing positions. The next two steps of extracting temporal and pausing
9 http://json.org/
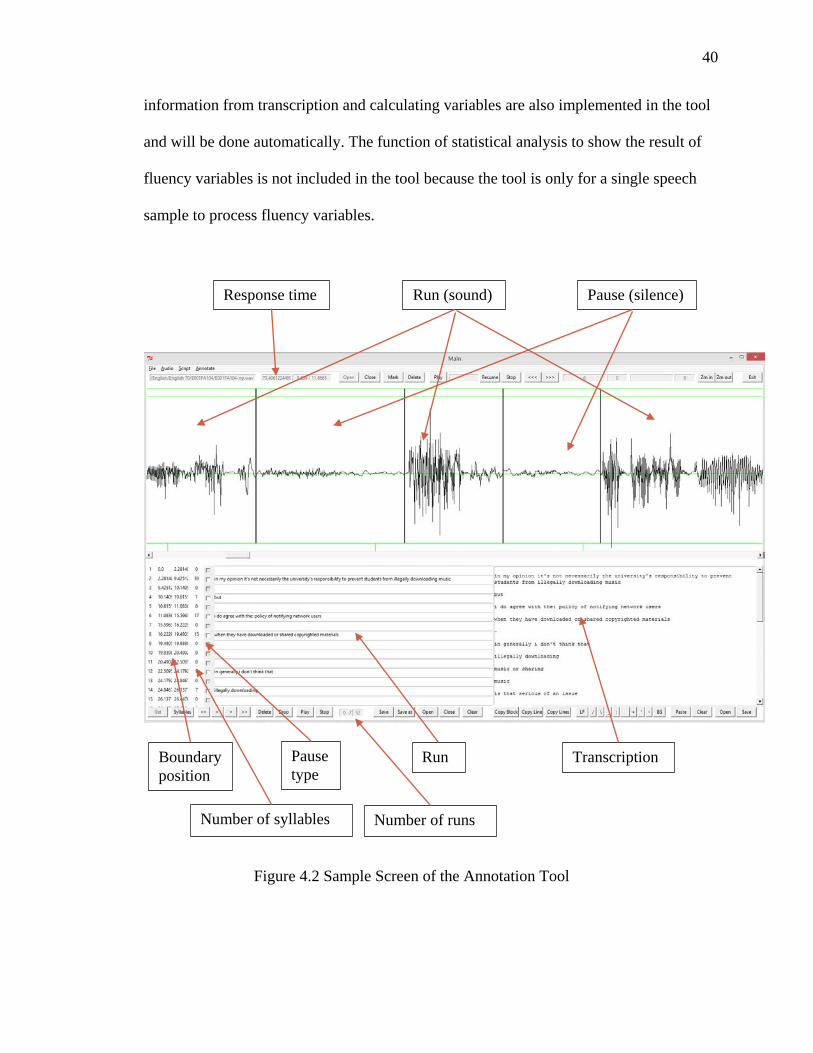
40
information from transcription and calculating variables are also implemented in the tool
and will be done automatically. The function of statistical analysis to show the result of
fluency variables is not included in the tool because the tool is only for a single speech
sample to process fluency variables.
Run (sound) Pause (silence) Response time
Pause type
Run Transcription
Number of syllables Number of runs
Boundary position
Figure 4.2 Sample Screen of the Annotation Tool
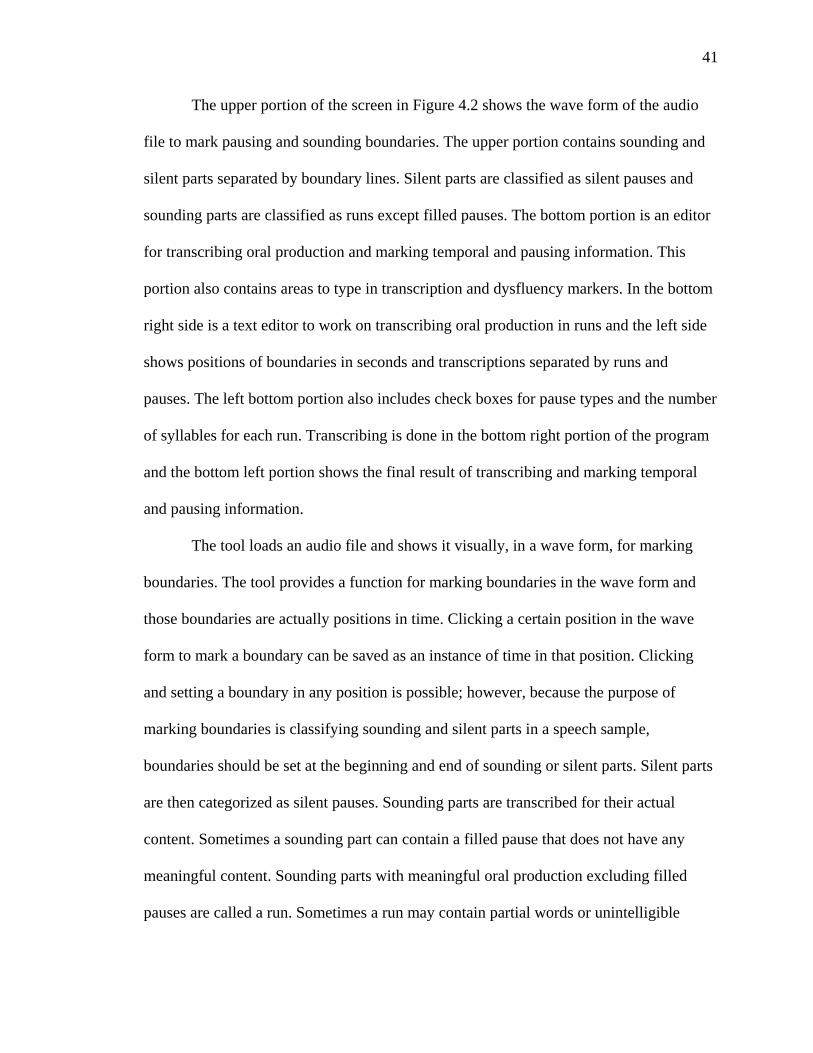
41
The upper portion of the screen in Figure 4.2 shows the wave form of the audio
file to mark pausing and sounding boundaries. The upper portion contains sounding and
silent parts separated by boundary lines. Silent parts are classified as silent pauses and
sounding parts are classified as runs except filled pauses. The bottom portion is an editor
for transcribing oral production and marking temporal and pausing information. This
portion also contains areas to type in transcription and dysfluency markers. In the bottom
right side is a text editor to work on transcribing oral production in runs and the left side
shows positions of boundaries in seconds and transcriptions separated by runs and
pauses. The left bottom portion also includes check boxes for pause types and the number
of syllables for each run. Transcribing is done in the bottom right portion of the program
and the bottom left portion shows the final result of transcribing and marking temporal
and pausing information.
The tool loads an audio file and shows it visually, in a wave form, for marking
boundaries. The tool provides a function for marking boundaries in the wave form and
those boundaries are actually positions in time. Clicking a certain position in the wave
form to mark a boundary can be saved as an instance of time in that position. Clicking
and setting a boundary in any position is possible; however, because the purpose of
marking boundaries is classifying sounding and silent parts in a speech sample,
boundaries should be set at the beginning and end of sounding or silent parts. Silent parts
are then categorized as silent pauses. Sounding parts are transcribed for their actual
content. Sometimes a sounding part can contain a filled pause that does not have any
meaningful content. Sounding parts with meaningful oral production excluding filled
pauses are called a run. Sometimes a run may contain partial words or unintelligible
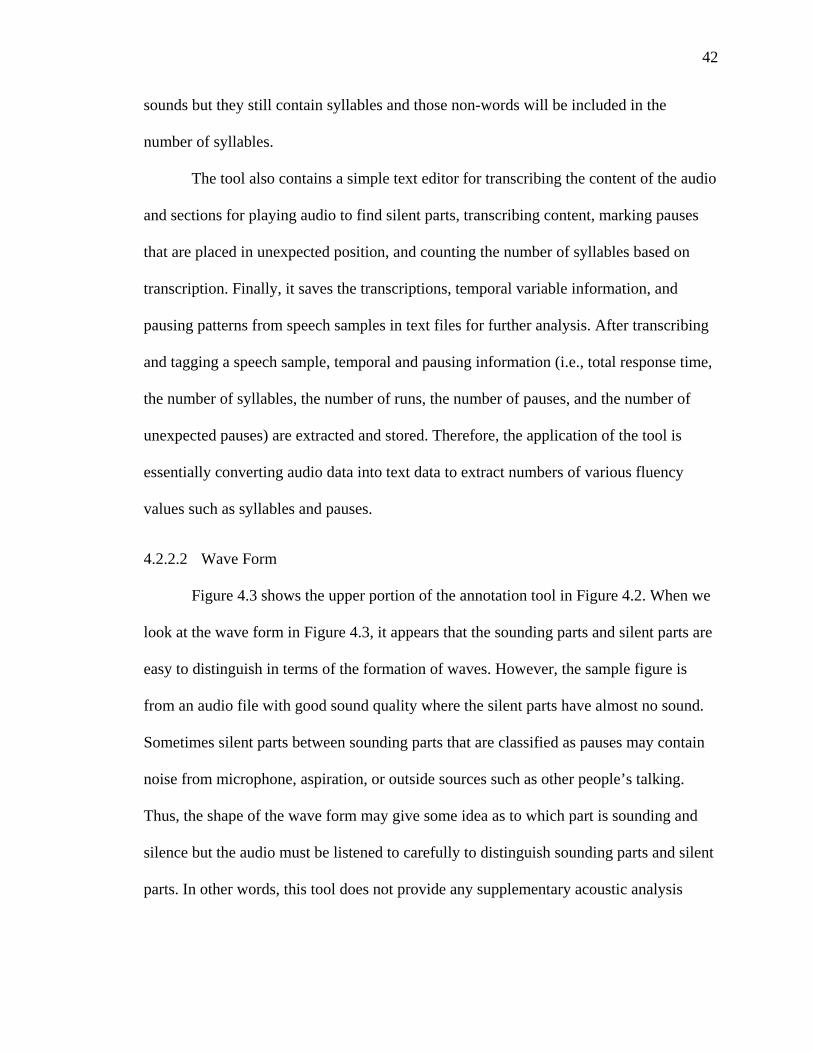
42
sounds but they still contain syllables and those non-words will be included in the
number of syllables.
The tool also contains a simple text editor for transcribing the content of the audio
and sections for playing audio to find silent parts, transcribing content, marking pauses
that are placed in unexpected position, and counting the number of syllables based on
transcription. Finally, it saves the transcriptions, temporal variable information, and
pausing patterns from speech samples in text files for further analysis. After transcribing
and tagging a speech sample, temporal and pausing information (i.e., total response time,
the number of syllables, the number of runs, the number of pauses, and the number of
unexpected pauses) are extracted and stored. Therefore, the application of the tool is
essentially converting audio data into text data to extract numbers of various fluency
values such as syllables and pauses.
4.2.2.2 Wave Form
Figure 4.3 shows the upper portion of the annotation tool in Figure 4.2. When we
look at the wave form in Figure 4.3, it appears that the sounding parts and silent parts are
easy to distinguish in terms of the formation of waves. However, the sample figure is
from an audio file with good sound quality where the silent parts have almost no sound.
Sometimes silent parts between sounding parts that are classified as pauses may contain
noise from microphone, aspiration, or outside sources such as other people’s talking.
Thus, the shape of the wave form may give some idea as to which part is sounding and
silence but the audio must be listened to carefully to distinguish sounding parts and silent
parts. In other words, this tool does not provide any supplementary acoustic analysis
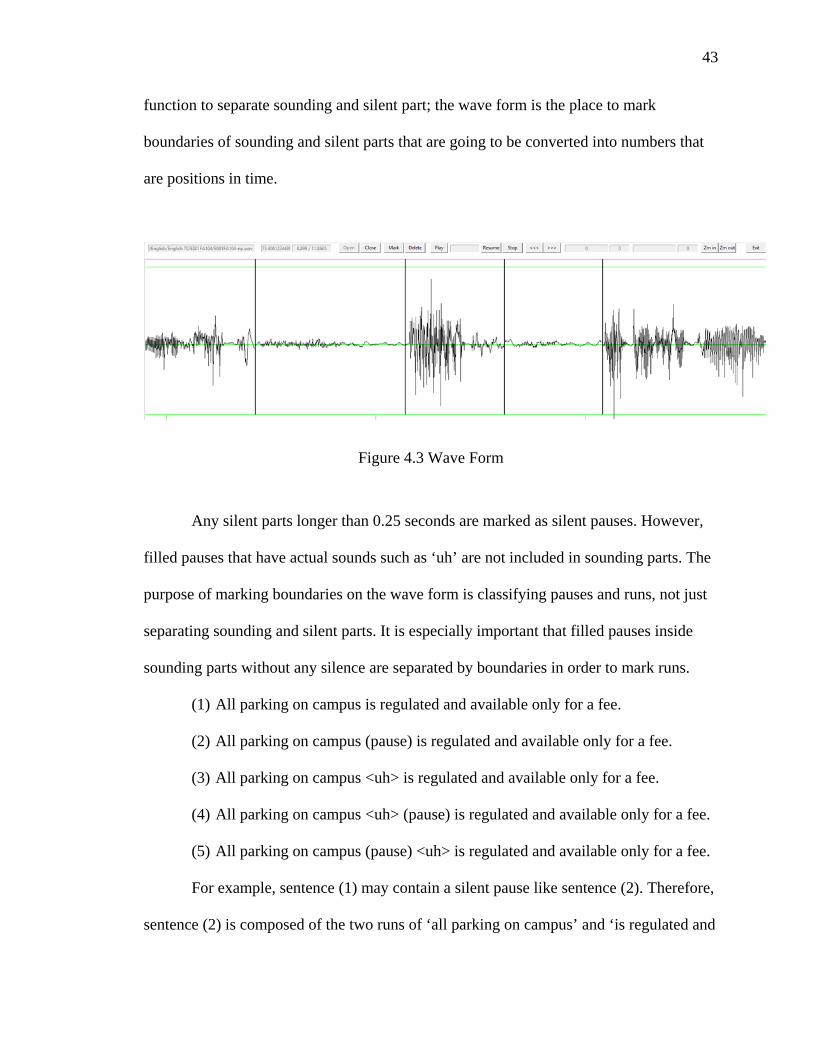
43
function to separate sounding and silent part; the wave form is the place to mark
boundaries of sounding and silent parts that are going to be converted into numbers that
are positions in time.
Figure 4.3 Wave Form
Any silent parts longer than 0.25 seconds are marked as silent pauses. However,
filled pauses that have actual sounds such as ‘uh’ are not included in sounding parts. The
purpose of marking boundaries on the wave form is classifying pauses and runs, not just
separating sounding and silent parts. It is especially important that filled pauses inside
sounding parts without any silence are separated by boundaries in order to mark runs.
(1) All parking on campus is regulated and available only for a fee.
(2) All parking on campus (pause) is regulated and available only for a fee.
(3) All parking on campus <uh> is regulated and available only for a fee.
(4) All parking on campus <uh> (pause) is regulated and available only for a fee.
(5) All parking on campus (pause) <uh> is regulated and available only for a fee.
For example, sentence (1) may contain a silent pause like sentence (2). Therefore,
sentence (2) is composed of the two runs of ‘all parking on campus’ and ‘is regulated and
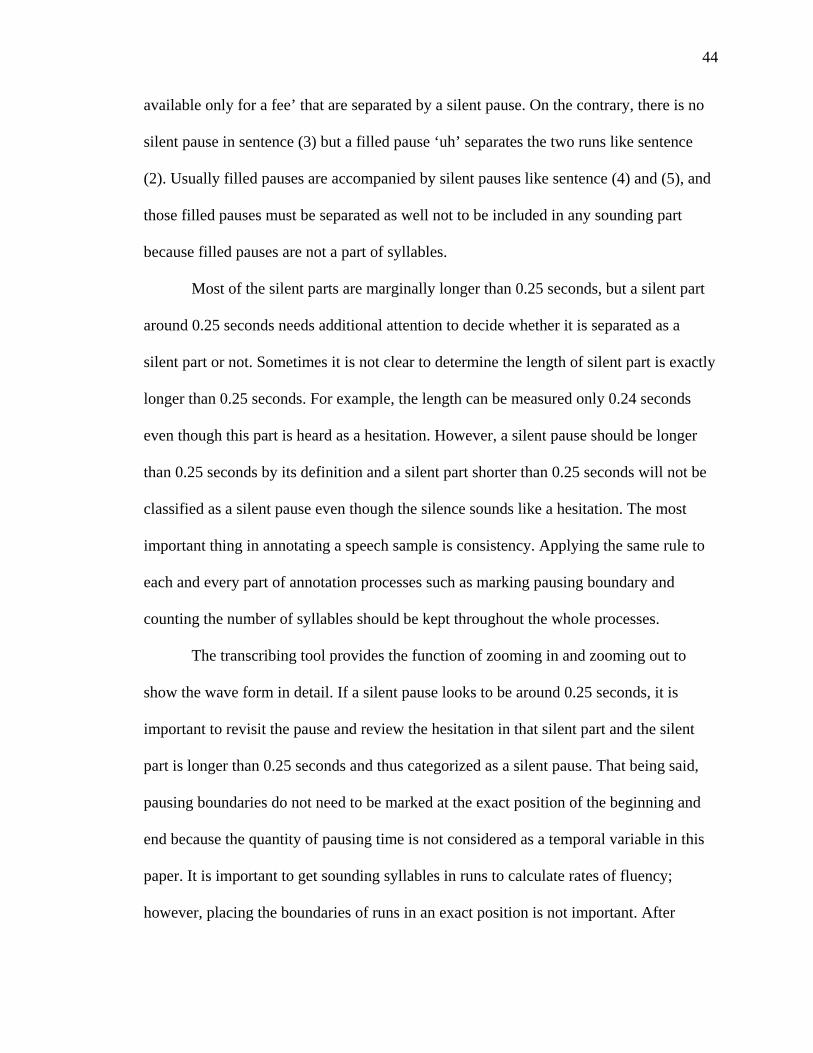
44
available only for a fee’ that are separated by a silent pause. On the contrary, there is no
silent pause in sentence (3) but a filled pause ‘uh’ separates the two runs like sentence
(2). Usually filled pauses are accompanied by silent pauses like sentence (4) and (5), and
those filled pauses must be separated as well not to be included in any sounding part
because filled pauses are not a part of syllables.
Most of the silent parts are marginally longer than 0.25 seconds, but a silent part
around 0.25 seconds needs additional attention to decide whether it is separated as a
silent part or not. Sometimes it is not clear to determine the length of silent part is exactly
longer than 0.25 seconds. For example, the length can be measured only 0.24 seconds
even though this part is heard as a hesitation. However, a silent pause should be longer
than 0.25 seconds by its definition and a silent part shorter than 0.25 seconds will not be
classified as a silent pause even though the silence sounds like a hesitation. The most
important thing in annotating a speech sample is consistency. Applying the same rule to
each and every part of annotation processes such as marking pausing boundary and
counting the number of syllables should be kept throughout the whole processes.
The transcribing tool provides the function of zooming in and zooming out to
show the wave form in detail. If a silent pause looks to be around 0.25 seconds, it is
important to revisit the pause and review the hesitation in that silent part and the silent
part is longer than 0.25 seconds and thus categorized as a silent pause. That being said,
pausing boundaries do not need to be marked at the exact position of the beginning and
end because the quantity of pausing time is not considered as a temporal variable in this
paper. It is important to get sounding syllables in runs to calculate rates of fluency;
however, placing the boundaries of runs in an exact position is not important. After
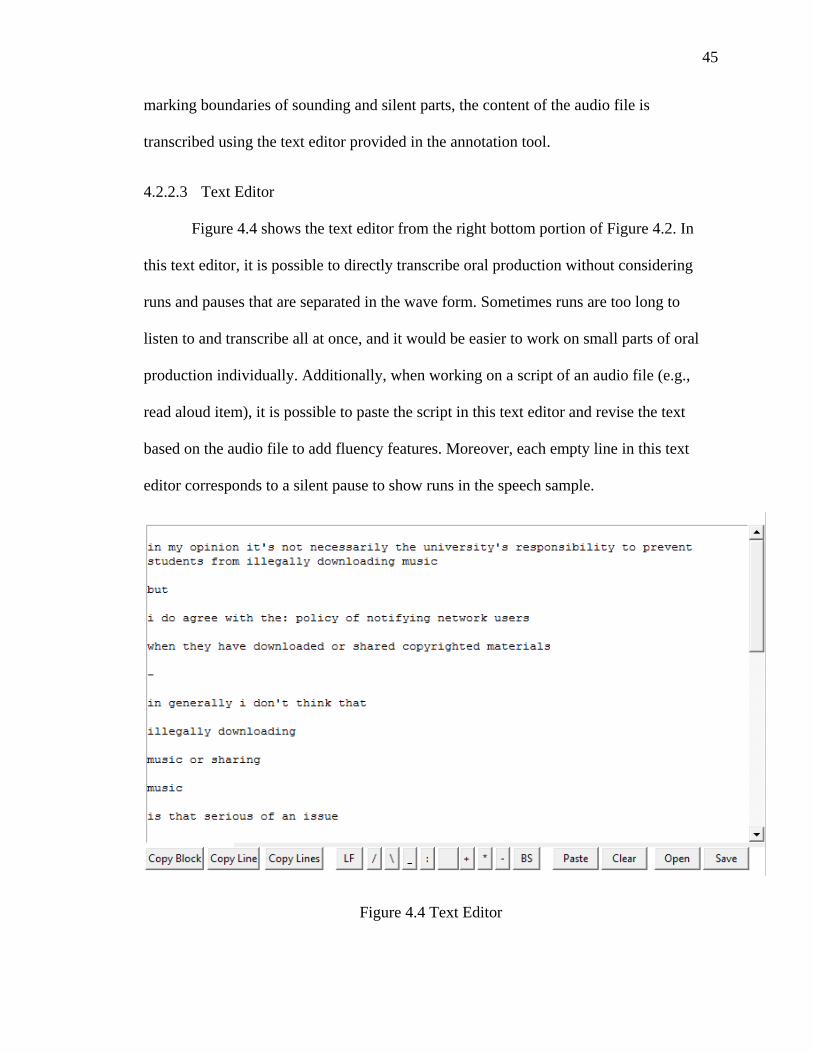
45
marking boundaries of sounding and silent parts, the content of the audio file is
transcribed using the text editor provided in the annotation tool.
4.2.2.3 Text Editor
Figure 4.4 shows the text editor from the right bottom portion of Figure 4.2. In
this text editor, it is possible to directly transcribe oral production without considering
runs and pauses that are separated in the wave form. Sometimes runs are too long to
listen to and transcribe all at once, and it would be easier to work on small parts of oral
production individually. Additionally, when working on a script of an audio file (e.g.,
read aloud item), it is possible to paste the script in this text editor and revise the text
based on the audio file to add fluency features. Moreover, each empty line in this text
editor corresponds to a silent pause to show runs in the speech sample.
Figure 4.4 Text Editor

46
Figure 4.5 Transcription with Fluency Information
4.2.2.4 Transcription with Fluency Information
Figure 4.5 shows the left bottom portion of Figure 4.2. The upper portion (Figure
4.3) and the right side of bottom portion (Figure 4.4) are places for run boundaries and
transcriptions, and the left side of bottom portion (Figure 4.5) contains the result of
transcribing and marking oral production. The bottom left side also can be used as a text
editor to transcribe oral production in each line separated by pauses and runs from the
wave form. However, the main work place for transcribing is the text editor in the bottom
right side. After the transcribing process is done in the bottom right side, the contents in
the right side (Figure 4.4) are copied into the left side (Figure 4.5) for storing as text data.
For instance, the text lines in Figure 4.4 are copied to runs in Figure 4.5 while empty
lines in Figure 4.4 correspond to pauses in Figure 4.5. Therefore, the contents of the right
side and the left side are exactly the same. The main difference between the right side
47
(Figure 4.4) and the left side (Figure 4.5) is that the left side contains boundary
information of sounding and silent parts as temporal information from the annotated
speech sample.
In addition, the number of syllables in each run are calculated automatically using
the syllable dictionary provided in the tool. The transcribing tool has a function for
counting the number of syllables in each run automatically using a MRD (Machine
Readable Dictionary) that is comprised of words and their number of syllables. The
purpose of using the syllable dictionary is that the MRD prevents errors in counting the
number of syllables by hand. Once a word is registered in the syllable dictionary, it is
counted as the same number of syllables repeatedly. Using this method, by a machine and
not a person, greatly reduces the effort in counting the numbers of syllables manually.
The use of syllable dictionary is also for providing standard and consistent guideline for
counting the number of syllables in each English word.
Syllable is a basic unit to measure production of oral delivery when calculating
temporal variables in fluency. Even though speech samples in this paper are from L2
English speakers and their productions of syllables may be different from L1 English
speakers because of possible influence of L1 language background of L2 English
speakers, the basic unit of oral production should be the same as syllables from L1
English speaker. L2 English speakers are speaking the same language as L1 English
speaker, and there is no reason to have a different guideline in analyzing the productions
of English from different proficiency levels and language backgrounds. Moreover, such
influences from L1 language would not appear in speech production from high
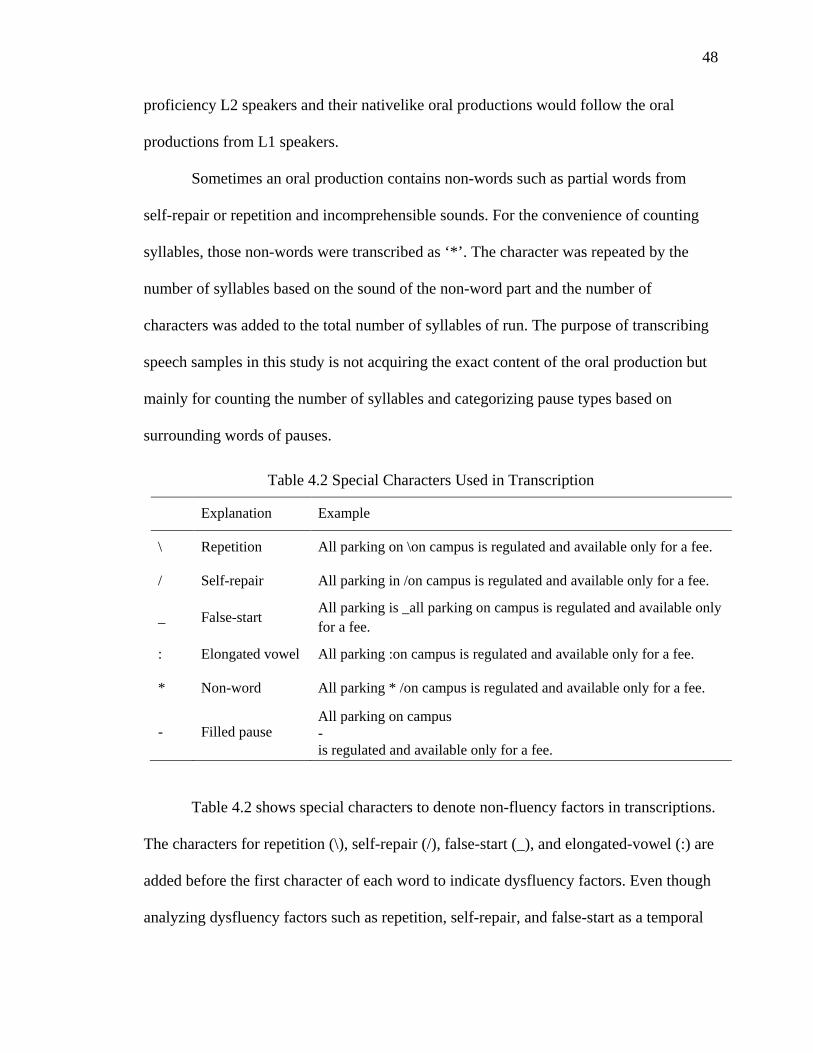
48
proficiency L2 speakers and their nativelike oral productions would follow the oral
productions from L1 speakers.
Sometimes an oral production contains non-words such as partial words from
self-repair or repetition and incomprehensible sounds. For the convenience of counting
syllables, those non-words were transcribed as ‘*’. The character was repeated by the
number of syllables based on the sound of the non-word part and the number of
characters was added to the total number of syllables of run. The purpose of transcribing
speech samples in this study is not acquiring the exact content of the oral production but
mainly for counting the number of syllables and categorizing pause types based on
surrounding words of pauses.
Table 4.2 Special Characters Used in Transcription
Explanation Example
\ Repetition All parking on \on campus is regulated and available only for a fee.
/ Self-repair All parking in /on campus is regulated and available only for a fee.
_ False-start All parking is _all parking on campus is regulated and available only for a fee.
: Elongated vowel All parking :on campus is regulated and available only for a fee.
* Non-word All parking * /on campus is regulated and available only for a fee.
- Filled pause All parking on campus - is regulated and available only for a fee.
Table 4.2 shows special characters to denote non-fluency factors in transcriptions.
The characters for repetition (\), self-repair (/), false-start (_), and elongated-vowel (:) are
added before the first character of each word to indicate dysfluency factors. Even though
analyzing dysfluency factors such as repetition, self-repair, and false-start as a temporal

49
variables is not included as a focus of this paper, dysfluencies in speech samples are
marked to help the transcribing process and classifying pauses. For example, a pause that
occur before or after a dysfluency factor is classified as an unexpected pause. This is
because the pause that occurs with an additional hesitation (i.e., dysfluency) is assumed a
processing error and therefore unexpected whether it occur in an expected or an
unexpected position. Any dysfluencies that occur within runs and not accompanied by a
pause may affect fluency because they are redundant production during oral production
but they are not treated separately in this paper. Besides, any partial or non-words
(transcribed as *) are included in counting numbers of syllables in each run while filled-
pauses (transcribed as _) are not included in counting numbers of syllables.
Marking pausing types by pausing positions is the final procedure of transcribing
and marking speech samples. There are check boxes for marking pausing types whether
pauses are placed in expected or unexpected positions. In Figure 4.5 (the left bottom part
of Figure 4.2), the check boxes are provided for marking the types of pause position.
Those check boxes are supposed to be checked for unexpected pauses because number of
unexpected pauses is smaller than expected pauses in most cases. The check boxes placed
before each pause are disabled to avoid any confusion because the types of pause
placement are checked (i.e., expected and unexpected positons), not the types of pauses
(e.g., silent and filled pauses). Pausing type should be checked at the beginning of each
run because sometimes filled pauses occur along with silent pauses to make one pause.
This is why the number of runs may be different from the number of pauses. In addition,
like silent pauses, filled pauses can be placed at either expected or unexpected positions
and not always classified as unexpected pauses.
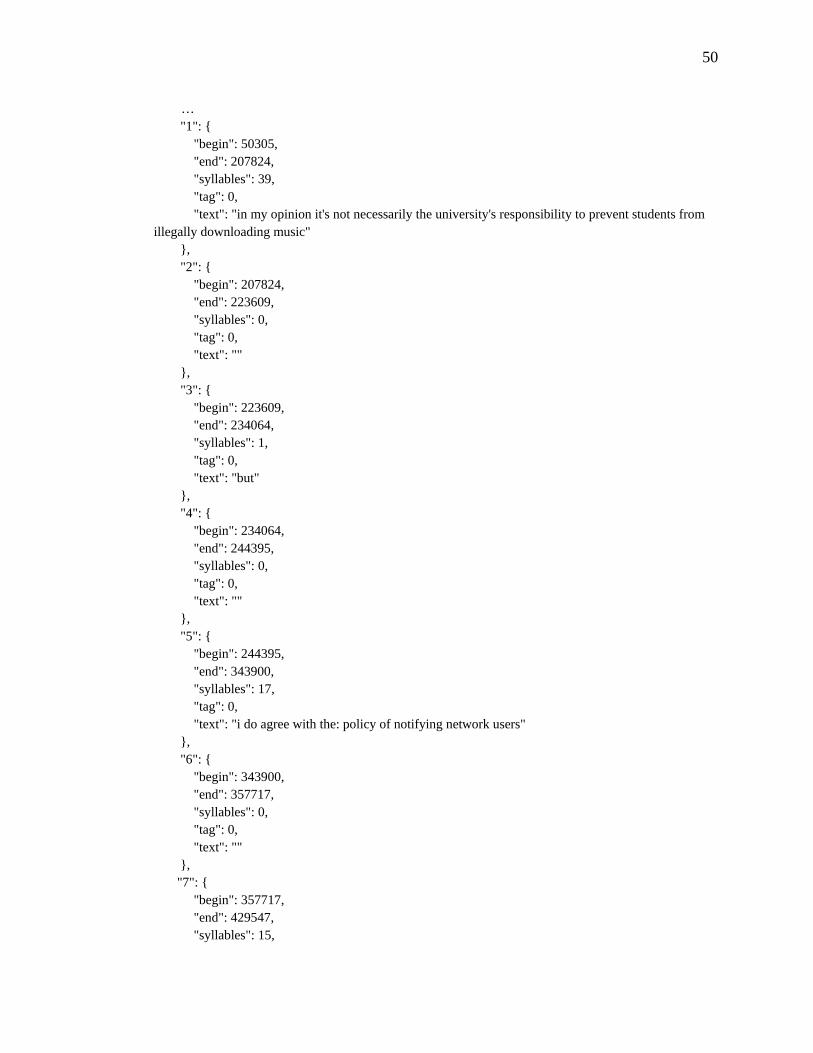
50
… "1": { "begin": 50305, "end": 207824, "syllables": 39, "tag": 0, "text": "in my opinion it's not necessarily the university's responsibility to prevent students from illegally downloading music" }, "2": { "begin": 207824, "end": 223609, "syllables": 0, "tag": 0, "text": "" }, "3": { "begin": 223609, "end": 234064, "syllables": 1, "tag": 0, "text": "but" }, "4": { "begin": 234064, "end": 244395, "syllables": 0, "tag": 0, "text": "" }, "5": { "begin": 244395, "end": 343900, "syllables": 17, "tag": 0, "text": "i do agree with the: policy of notifying network users" }, "6": { "begin": 343900, "end": 357717, "syllables": 0, "tag": 0, "text": "" }, "7": { "begin": 357717, "end": 429547, "syllables": 15,
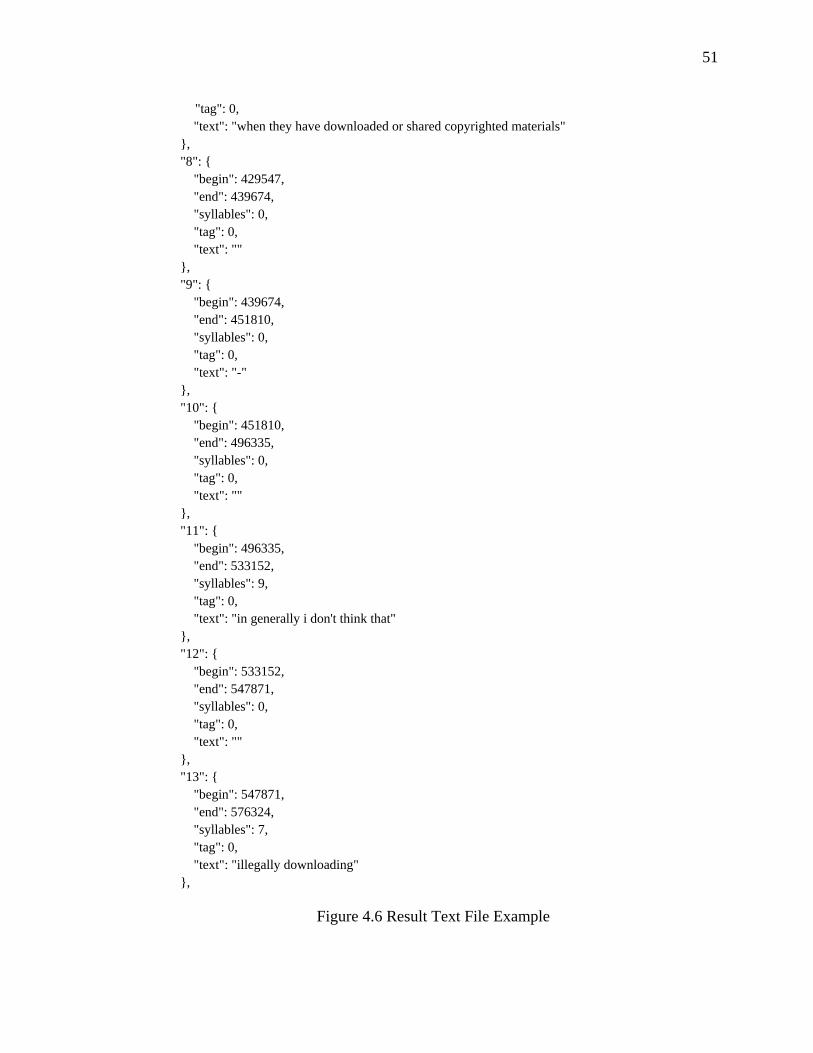
51
"tag": 0, "text": "when they have downloaded or shared copyrighted materials" }, "8": { "begin": 429547, "end": 439674, "syllables": 0, "tag": 0, "text": "" }, "9": { "begin": 439674, "end": 451810, "syllables": 0, "tag": 0, "text": "-" }, "10": { "begin": 451810, "end": 496335, "syllables": 0, "tag": 0, "text": "" }, "11": { "begin": 496335, "end": 533152, "syllables": 9, "tag": 0, "text": "in generally i don't think that" }, "12": { "begin": 533152, "end": 547871, "syllables": 0, "tag": 0, "text": "" }, "13": { "begin": 547871, "end": 576324, "syllables": 7, "tag": 0, "text": "illegally downloading" }, … Figure 4.6 Result Text File Example
52
4.2.2.5 Result File
The results of transcribing oral productions are saved in a text file for further
analysis. Figure 4.6 shows an example of result file. The analysis results in Figure 4.6
contains information of each run and pause with begin/end time, number of syllables
(syllable), pausing type (tag), and transcription (text). In this example, ‘5’, ‘7’, and ‘11’
are runs. ‘4’, ‘6’, ‘8’, and ‘10’ are silent pauses and ‘9’ is a filled pause. For calculating
temporal and pausing variables, the number of syllables is the sum of ‘syllable’, the
number of runs is the total number of ‘syllable’ that has value other than 0. The number
of pauses is the sum of silent and filled pauses, and the number of unexpected pauses is
the number of ‘tag’, and the number of expected pauses is the difference between the
number of runs and number of unexpected pauses. Finally ‘begin’, ‘end’, and ‘text’ are
not used when calculating temporal and pausing variables in this paper.
4.2.3 Calculating Temporal Variables
The temporal measures of fluency analyzed in this study are rate of production
related to number of pauses and syllables and not quantity of production related to
speaking and pausing time. Among the various temporal measures of fluency that
measure the speed of fluency, this study examines the following four temporal variables.
(1) Total response time
(2) Speech rate: number of syllables / total response time
(3) Mean syllables per run: number of syllables / number of runs (run: utterances
between silent pauses of 0.25 second and above, or filled pauses)
(4) Number of pauses per second: number of pauses / total response time
53
For example, in order to calculate the speed of oral delivery from a response on
the OEPT, we need to extract the number of syllables. Then the number of syllables is
normalized using the total spoken time in the speech sample to calculate speech rate.
Similarly, the number of pauses per second is a normalized number of pauses. Mean
syllable per run is calculated by using information from pauses and syllables. Mean
syllable per run, as we can see from its title, is based on the number of syllables in a
sound chunk delineated by silent pauses. For calculating mean syllable per run, pauses
are identified to separate runs in the speech sample and count the number of runs. In this
context, the number of runs equals the number of pauses. Thus, mean syllable run is the
normalized number of syllables regarding to the number of pauses.
However, the number of pauses are not always the same as the number of runs
because runs can also be separated by filled pauses. Additionally, silent pauses may be
preceded or followed by filled pauses. More importantly, a speech sample may or may
not end with a silent part because in this data the recording may stop while a responder is
still producing sound due to a time limit. This study distinguishes pauses from runs by
their number of syllables because silent and filled pauses do not have syllables to count.
As a result, the number of any sounding part that has more than one syllable is the
number of runs. A run does not have to be composed of meaningful sound. Any partial
words or unrecognizable sounds are regarded as a set of syllables and included in the
number of syllables.
Firstly, information is needed about the syllables and pauses in a given speech
sample in order to calculate speech rate, mean syllable per run, and the number of pauses
per second. The most efficient way to get this temporal information is finding the places
54
of syllables and pauses from the speech sample through transcribing the speech sample
manually. More accurately, we can count the number of syllables of each word from the
transcription of the speech sample, and we can mark the position of silent and filled
pauses in the transcription of the speech sample to count the number of pauses. The
number of syllables in each word are not counted manually in this study to avoid error in
discerning syllables in a word. A syllable dictionary is used for counting number of
syllables automatically within the transcribing tool.
4.2.4 Measuring Pausing Patterns
Pausing patterns are related to the positions of pauses and can be used for
representing the smoothness of oral delivery. Pausing positions can be categorized into
two types: expected and unexpected positions. A list of expected pausing positions was
made from the syntactic structure of English such as clause boundaries and phrase
boundaries. In addition, expected pausing positions are obtained from observing native
speakers’ speech samples. This study examines the results from the RAL item to provide
a basis for identifying expected pausing positions. Unexpected pausing positions must
have pauses other than expected pausing positions. In other words, if a pause is placed in
any positions other than that of expected pausing positions, the position of that pause is
marked as an unexpected pausing position. Expected pausing positions may include:
(1) After periods (or between sentences)
(2) Before conjunctions (and, or, and but)
(3) After subject clauses (or before verb or auxiliary verb)
(4) Before prepositions
(5) Before complementizers (if and that)
55
(6) At punctuations (comma, colon and semi-colon)
An additional type of pausing pattern not yet discussed is the skipped pausing
positions. It turns out that a pause may not be put in every expected position. In other
words, we do not have to put any pause in our oral delivery, especially within a sentence.
The most important place to put a pause is ‘after periods’ to denote the end of a sentence
or beginning of a new sentence. Period may be an imaginary boundary in an utterance but
used in transcription to separate sentences. Uttering a whole sentence without any pause
(i.e., hesitation) may indicate that the utterance is very speedy and smooth (i.e., fluent).
Furthermore, a pause does not necessarily have to be put between sentences because the
boundary of sentences can be identified by prosodic markers such as a falling intonation
at the end of a sentence and rising intonation at the beginning of a sentence. Thus, we
cannot assume that there is any skipped pause with respect to measuring pausing patterns.
Expected pausing positions merely indicate the tendency to pause in an expected position
to hesitate, for instance, for additional planning.
This study uses speech samples of RAL to create a detailed list of expected and
unexpected pausing positions based on the analysis of responses from L1 English
speakers and L2 English speakers with higher proficiency levels such as an OEPT score
of 55. Classifying expected and unexpected position is the first step of analyzing pausing
patterns. The list of expected pausing positions is summarized as follows. A pause can be
put in sentence, phrase and clause boundaries. In the examples, targeted clause are
highlighted as bolded and ‘|’ indicates the expected pause position.
(1) Between sentences or after .(period)
(2) After subject (or subject clause)
56
Faculty members | often receive inquiries from prospective students about
Purdue University.
Forms for this purpose | should be obtained through the school or department.
(3) Before preposition
University parking regulations and a ten mile per hour speed limit are continually
enforced | in the garages.
Forms for this purpose should be obtained | through the school or department.
(4) Before relative pronoun
Permits designated A allow the staff member | who has purchased and properly
displayed this permit to park in either A, B, or C areas.
(5) Before past participle
The University has built a reputation | respected in fields of education throughout
the world.
(6) Before present participle
Purdue marketing communications has reproduction proofs and instruction sheets
| outlining proper use of both the seal and the mascot logo.
The office of admissions makes the final determination of the quality of the
applicant's record | basing the decision on a combination of the applicant's high school
rank in class, standardized test scores, …, and trends in achievement.
(7) Before to infinitive
It is necessary that they receive academic adjustments | to make educational
opportunity more accessible.
(8) Before direct object with indirect object
57
This handling of inquiries can save the staff members | considerable time.
(9) Before predicative complement
It is necessary that they receive academic adjustments to make educational
opportunity | more accessible.
(10) Adverb (including adjunct phrase)
Also some students experience temporary disabilities | each year.
Students may operate university vehicles | only with an written approval of the
risk Manager.
Thus | Purdue does not permit the use of its name or the University title of any of
its employees …
Also | students who need to improve their academic records to meet program
requirements.
(11) Conjunctions
The office of admissions handles more than fifty thousand inquires per year | and
has on hand materials that need to be provided.
Some inquiries come from acquaintances of staff members, but most of the
inquiries come | because the staff member's name is seen in some publication.
The much larger classes will affect the quality of education | and | the quality of
education is being affect in a negative way.
(12) That & null-that
Purdue students have the opportunity to participate in cocurricular activities |
that supplement formal studies.
My opinion is | that large class sizes do affect the quality of education
58
My opinion is that | large class sizes do affect the quality of education
My opinion is | large class sizes do affect the quality of education
(13) Inserted clause such as ‘I think’, ‘I mean’, and ‘you know’
Academic adjustments may include | but are not limited to | alternate testing
methods, …
(14) Within, before, or/and after dysfluency markers – mostly unexpected pauses
False starts, self-repairs, repetition, partial word and unrecognizable sounds
(15) At comma and other punctuation markers (in RAL)
, ; : ( ) “ ‘ ! ?
The list of expected pausing positions is based on the item responses of RAL and
contains most structures that can be found in English sentences. Spontaneous item
responses in this data do not show frequent complex structures such as using a relative
pronoun. The most important expected pausing position is between a subject phrase and a
verb phrase. In contrast, a pause placed within a verb phrase, like between a verb and an
object, is in an unexpected position. Especially placing a pause within a verb phrase or a
prepositional phrase is a common mistake for an L2 English speaker.
Based on the list of expected pausing positions, each pause is classified as either
expected or unexpected. Similar to temporal variables, unexpected and expected pauses
are normalized to compare results across proficiency levels. The normalized number of
expected and unexpected pauses, and the ratio between them are a sub-variable of the
number of pauses per second. Pausing variables are calculated as follows.
(1) Expected pause ratio: number of expected pauses / number of pauses
59
(2) Number of expected pauses per minutes: number of expected pauses / total
response time * 60
(3) Number of unexpected pauses per minutes: number of unexpected pauses /
total response time * 60
In addition to the normalized number of pauses, it is possible to calculate a
variable that includes number of syllables similar to speech rate and mean syllable per
run. In other words, similar to expected and unexpected pauses, there might be expected
and unexpected runs. However, there is no difference between the numbers of syllables
delineated by expected or unexpected pauses. Thus, this study does not consider a
pausing variable in terms of the number of syllables.
Table 4.3 shows temporal and pausing information that are used in this paper. The
second column shows temporal and pausing information that are extracted from the result
text file. The variables in the third column are calculated from those temporal and
pausing information from the second column. This paper analyzed pausing rate variables
in Table 5.1 to observe pausing phenomena in speech samples regarding the smoothness
of oral delivery. However, not all pausing variables are needed for fluency research
because some pausing variables are highly correlated to each other such as number of
pauses per second and number of silent pauses per second. On the contrary, this paper
only calculated basic temporal rates of production such as speech rate and mean syllable
per run to show the speed of oral delivery. However, because result files from the
transcribing tool have other temporal information such as pausing and speech time, it is
possible to calculate quantities for fluency such as articulation time, speech ratio, and
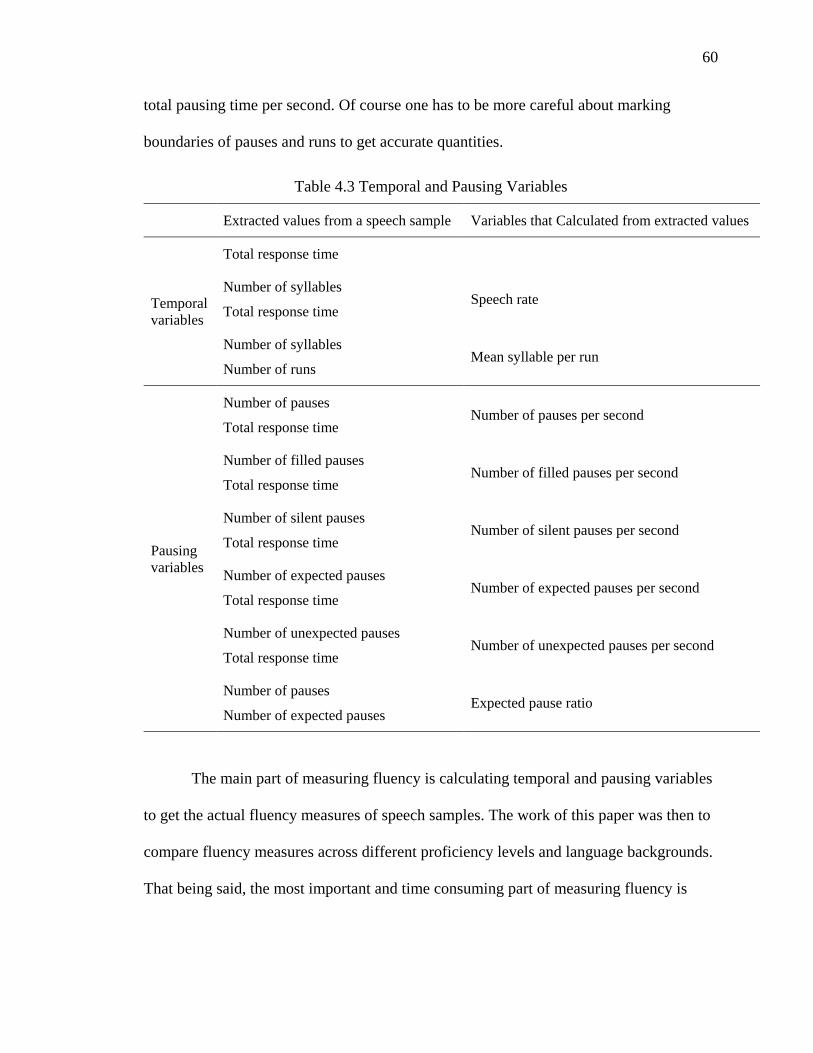
60
total pausing time per second. Of course one has to be more careful about marking
boundaries of pauses and runs to get accurate quantities.
Table 4.3 Temporal and Pausing Variables
Extracted values from a speech sample Variables that Calculated from extracted values
Temporal variables
Total response time
Number of syllables
Total response time Speech rate
Number of syllables
Number of runs Mean syllable per run
Pausing variables
Number of pauses
Total response time Number of pauses per second
Number of filled pauses
Total response time Number of filled pauses per second
Number of silent pauses
Total response time Number of silent pauses per second
Number of expected pauses
Total response time Number of expected pauses per second
Number of unexpected pauses
Total response time Number of unexpected pauses per second
Number of pauses
Number of expected pauses Expected pause ratio
The main part of measuring fluency is calculating temporal and pausing variables
to get the actual fluency measures of speech samples. The work of this paper was then to
compare fluency measures across different proficiency levels and language backgrounds.
That being said, the most important and time consuming part of measuring fluency is
61
transcribing speech samples to extract and calculate temporal and pausing variables. It
may not be a problem when analyzing a small number of speech samples. However, this
paper analyzed a large number, 650 speech samples, to compare across various
proficiency levels and language backgrounds. Developing a transcribing tool was one of
important processes in this research and facilitated analysis of more than a small sample.
The development of this tool will enhance research opportunities for others who want to
extend the findings reported in this paper.
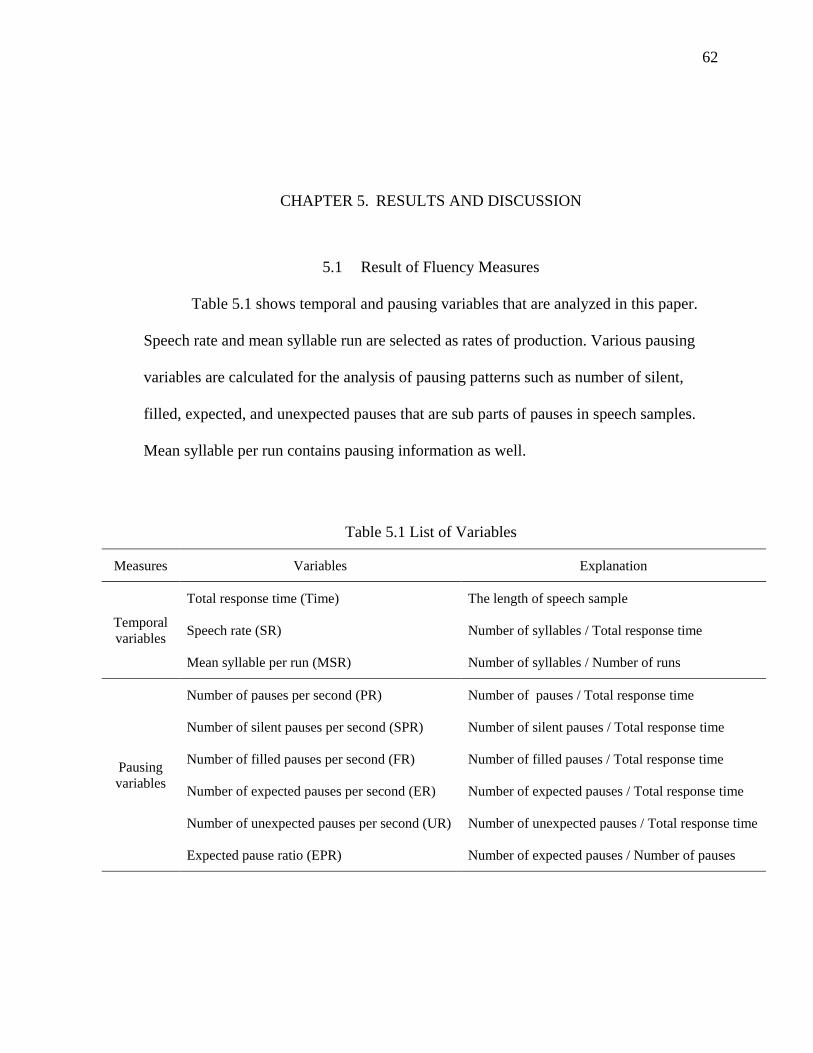
62
CHAPTER 5. RESULTS AND DISCUSSION
5.1 Result of Fluency Measures
Table 5.1 shows temporal and pausing variables that are analyzed in this paper.
Speech rate and mean syllable run are selected as rates of production. Various pausing
variables are calculated for the analysis of pausing patterns such as number of silent,
filled, expected, and unexpected pauses that are sub parts of pauses in speech samples.
Mean syllable per run contains pausing information as well.
Table 5.1 List of Variables
Measures Variables Explanation
Temporal variables
Total response time (Time) The length of speech sample
Speech rate (SR) Number of syllables / Total response time
Mean syllable per run (MSR) Number of syllables / Number of runs
Pausing variables
Number of pauses per second (PR) Number of pauses / Total response time
Number of silent pauses per second (SPR) Number of silent pauses / Total response time
Number of filled pauses per second (FR) Number of filled pauses / Total response time
Number of expected pauses per second (ER) Number of expected pauses / Total response time
Number of unexpected pauses per second (UR) Number of unexpected pauses / Total response time
Expected pause ratio (EPR) Number of expected pauses / Number of pauses
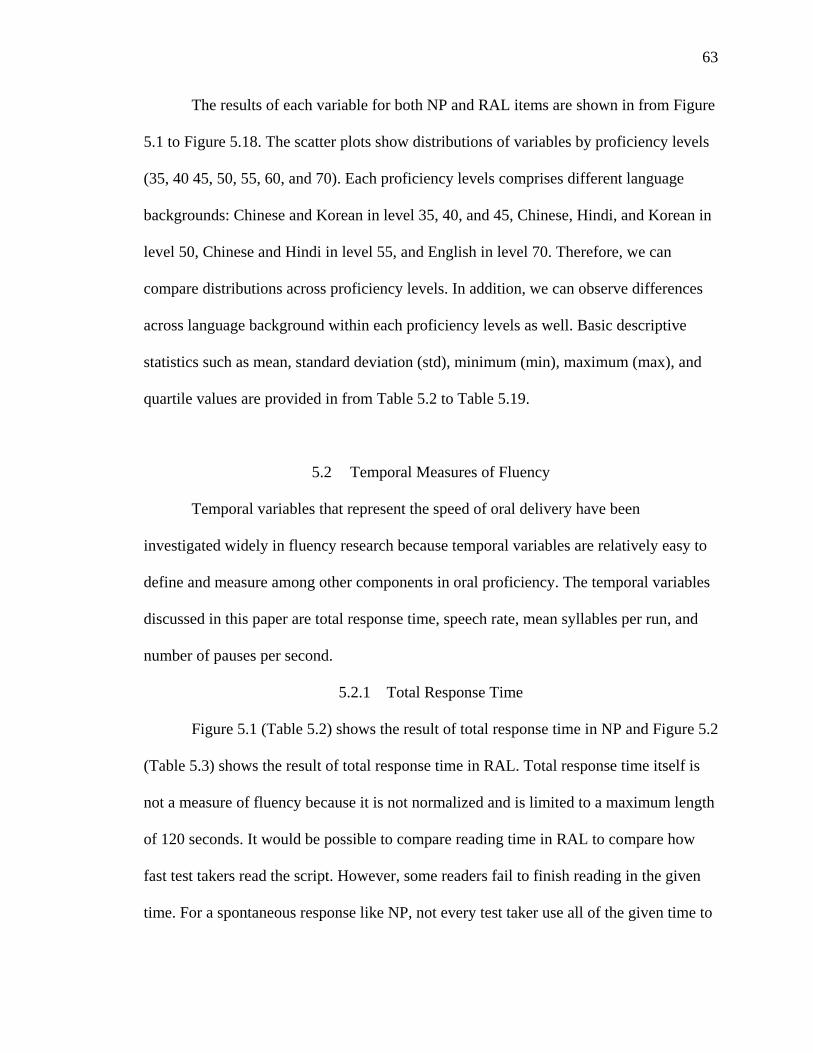
63
The results of each variable for both NP and RAL items are shown in from Figure
5.1 to Figure 5.18. The scatter plots show distributions of variables by proficiency levels
(35, 40 45, 50, 55, 60, and 70). Each proficiency levels comprises different language
backgrounds: Chinese and Korean in level 35, 40, and 45, Chinese, Hindi, and Korean in
level 50, Chinese and Hindi in level 55, and English in level 70. Therefore, we can
compare distributions across proficiency levels. In addition, we can observe differences
across language background within each proficiency levels as well. Basic descriptive
statistics such as mean, standard deviation (std), minimum (min), maximum (max), and
quartile values are provided in from Table 5.2 to Table 5.19.
5.2 Temporal Measures of Fluency
Temporal variables that represent the speed of oral delivery have been
investigated widely in fluency research because temporal variables are relatively easy to
define and measure among other components in oral proficiency. The temporal variables
discussed in this paper are total response time, speech rate, mean syllables per run, and
number of pauses per second.
5.2.1 Total Response Time
Figure 5.1 (Table 5.2) shows the result of total response time in NP and Figure 5.2
(Table 5.3) shows the result of total response time in RAL. Total response time itself is
not a measure of fluency because it is not normalized and is limited to a maximum length
of 120 seconds. It would be possible to compare reading time in RAL to compare how
fast test takers read the script. However, some readers fail to finish reading in the given
time. For a spontaneous response like NP, not every test taker use all of the given time to
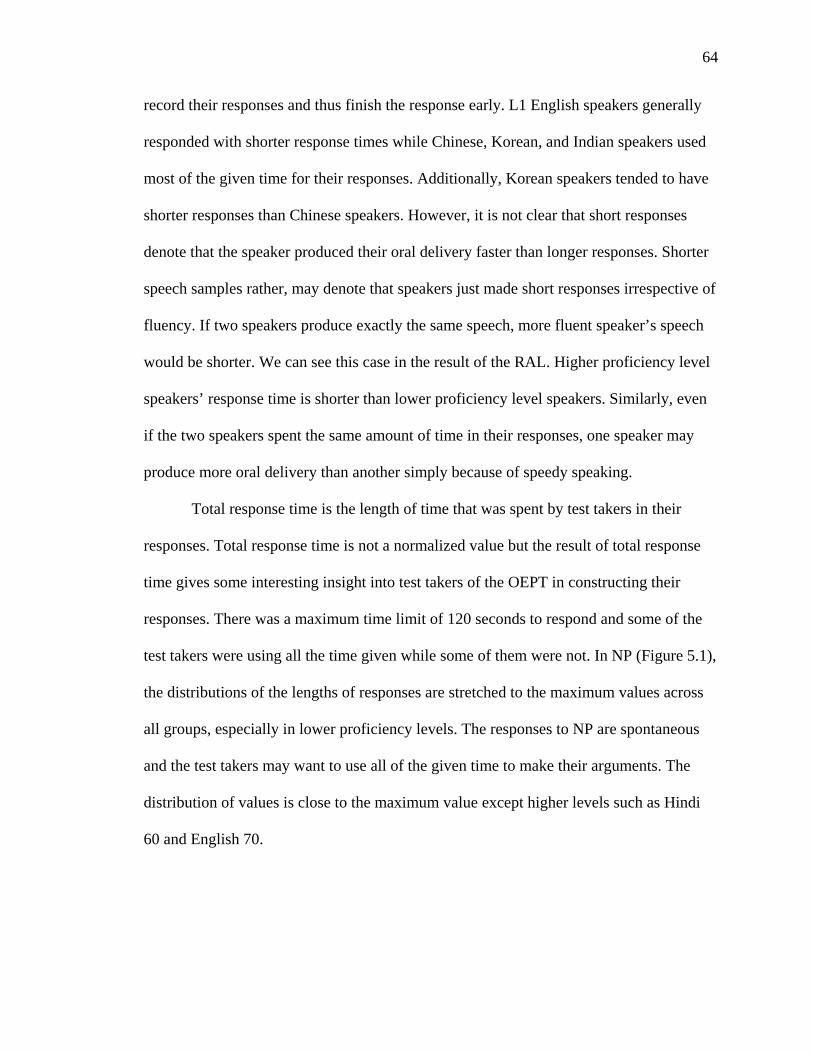
64
record their responses and thus finish the response early. L1 English speakers generally
responded with shorter response times while Chinese, Korean, and Indian speakers used
most of the given time for their responses. Additionally, Korean speakers tended to have
shorter responses than Chinese speakers. However, it is not clear that short responses
denote that the speaker produced their oral delivery faster than longer responses. Shorter
speech samples rather, may denote that speakers just made short responses irrespective of
fluency. If two speakers produce exactly the same speech, more fluent speaker’s speech
would be shorter. We can see this case in the result of the RAL. Higher proficiency level
speakers’ response time is shorter than lower proficiency level speakers. Similarly, even
if the two speakers spent the same amount of time in their responses, one speaker may
produce more oral delivery than another simply because of speedy speaking.
Total response time is the length of time that was spent by test takers in their
responses. Total response time is not a normalized value but the result of total response
time gives some interesting insight into test takers of the OEPT in constructing their
responses. There was a maximum time limit of 120 seconds to respond and some of the
test takers were using all the time given while some of them were not. In NP (Figure 5.1),
the distributions of the lengths of responses are stretched to the maximum values across
all groups, especially in lower proficiency levels. The responses to NP are spontaneous
and the test takers may want to use all of the given time to make their arguments. The
distribution of values is close to the maximum value except higher levels such as Hindi
60 and English 70.
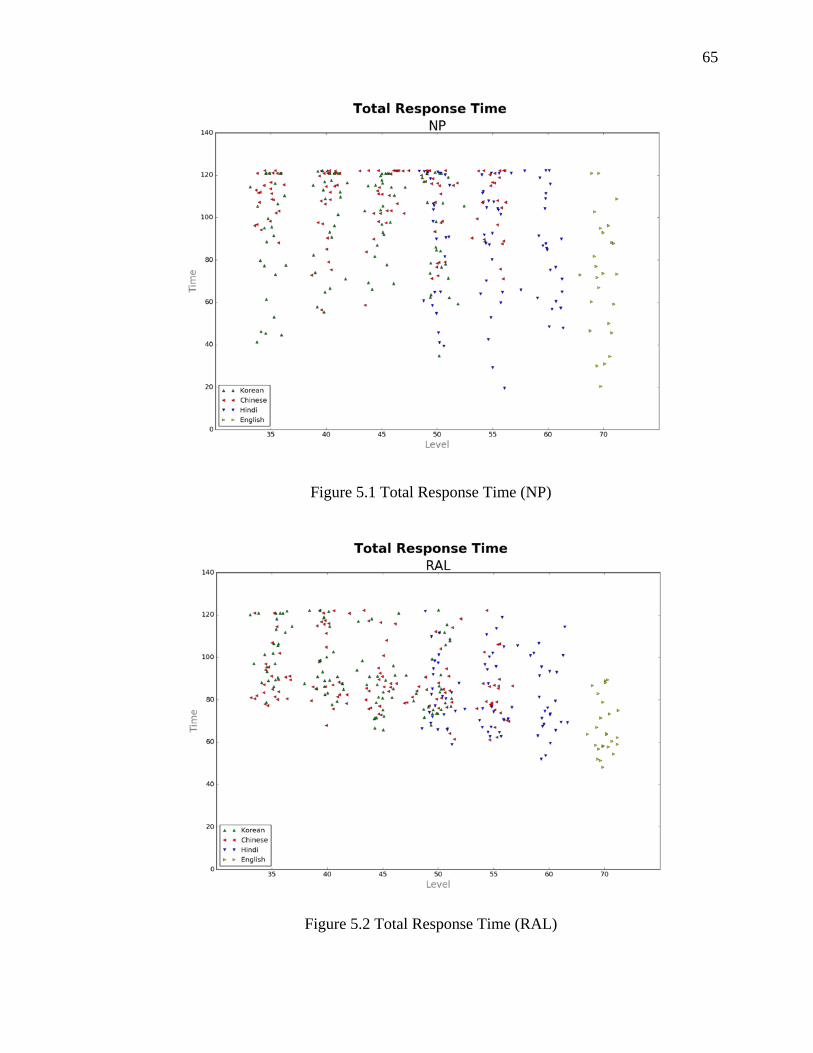
65
Figure 5.1 Total Response Time (NP)
Figure 5.2 Total Response Time (RAL)
66
Table 5.2 Total Response Time (NP)
level language count mean std min 0.25 0.50 0.75 max 35 Korean 25 89.12 27.62 41.29 73.16 95.12 114.50 120.87 35 Chinese 25 110.43 9.92 88.12 103.06 112.03 120.87 122.16 40 Korean 25 99.73 22.76 55.50 82.38 109.72 117.50 122.19 40 Chinese 25 105.81 18.97 56.41 97.09 114.75 120.87 122.19 45 Korean 25 102.01 18.07 66.18 92.16 105.41 116.31 120.91 45 Chinese 25 108.97 15.39 58.72 101.91 111.25 122.06 122.19 50 Korean 25 91.76 25.27 34.88 73.75 86.03 118.78 121.41 50 Chinese 25 104.45 18.18 71.34 93.31 115.03 118.41 122.19 50 Hindi 25 91.12 29.09 39.37 64.69 98.12 120.05 121.80 55 Chinese 25 105.65 15.70 71.06 90.31 107.47 120.31 122.19 55 Hindi 25 87.13 29.51 19.59 64.69 92.61 107.88 120.91 60 Hindi 25 85.51 24.56 47.81 64.97 85.50 109.03 122.19 70 English 25 72.37 28.07 20.41 50.16 73.41 92.86 120.87
Table 5.3 Total Response Time (RAL)
level language count mean std min 0.25 0.50 0.75 max 35 Korean 25 104.44 13.39 78.87 93.44 105.60 118.28 121.81 35 Chinese 25 91.35 12.77 77.31 81.50 89.41 95.43 120.91 40 Korean 25 97.75 15.04 77.84 86.28 90.98 114.75 122.19 40 Chinese 25 97.98 17.95 67.97 82.38 88.37 115.94 122.19 45 Korean 25 85.67 13.78 65.84 75.22 85.25 91.62 120.87 45 Chinese 25 90.48 14.77 72.91 78.75 86.03 94.91 122.19 50 Korean 25 87.24 15.89 68.09 75.37 80.72 99.27 122.32 50 Chinese 25 87.03 15.10 61.34 78.87 84.34 91.22 118.16 50 Hindi 25 83.98 16.00 58.84 73.03 81.55 94.62 121.67 55 Chinese 25 82.86 14.36 61.06 75.25 79.12 86.81 122.16 55 Hindi 25 84.17 18.17 62.62 70.35 76.37 100.19 118.78 60 Hindi 25 79.80 17.19 51.97 68.34 74.59 93.31 114.43 70 English 25 66.81 12.73 48.22 58.06 63.66 74.97 89.41
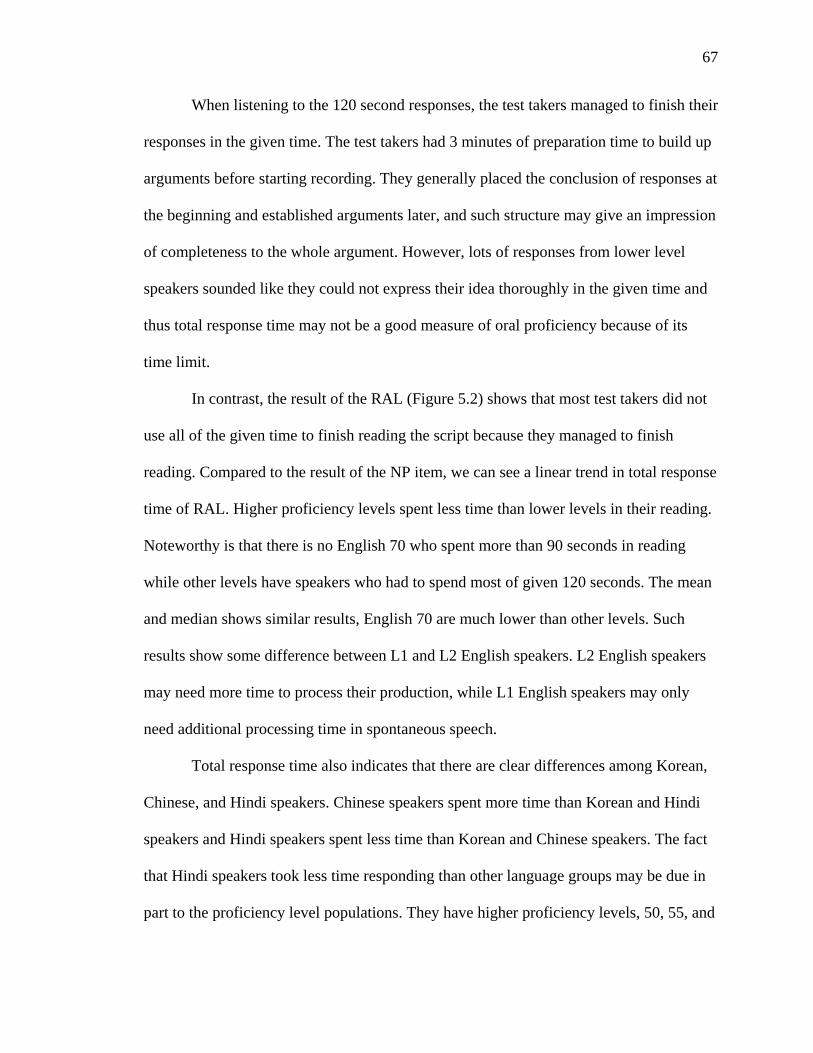
67
When listening to the 120 second responses, the test takers managed to finish their
responses in the given time. The test takers had 3 minutes of preparation time to build up
arguments before starting recording. They generally placed the conclusion of responses at
the beginning and established arguments later, and such structure may give an impression
of completeness to the whole argument. However, lots of responses from lower level
speakers sounded like they could not express their idea thoroughly in the given time and
thus total response time may not be a good measure of oral proficiency because of its
time limit.
In contrast, the result of the RAL (Figure 5.2) shows that most test takers did not
use all of the given time to finish reading the script because they managed to finish
reading. Compared to the result of the NP item, we can see a linear trend in total response
time of RAL. Higher proficiency levels spent less time than lower levels in their reading.
Noteworthy is that there is no English 70 who spent more than 90 seconds in reading
while other levels have speakers who had to spend most of given 120 seconds. The mean
and median shows similar results, English 70 are much lower than other levels. Such
results show some difference between L1 and L2 English speakers. L2 English speakers
may need more time to process their production, while L1 English speakers may only
need additional processing time in spontaneous speech.
Total response time also indicates that there are clear differences among Korean,
Chinese, and Hindi speakers. Chinese speakers spent more time than Korean and Hindi
speakers and Hindi speakers spent less time than Korean and Chinese speakers. The fact
that Hindi speakers took less time responding than other language groups may be due in
part to the proficiency level populations. They have higher proficiency levels, 50, 55, and
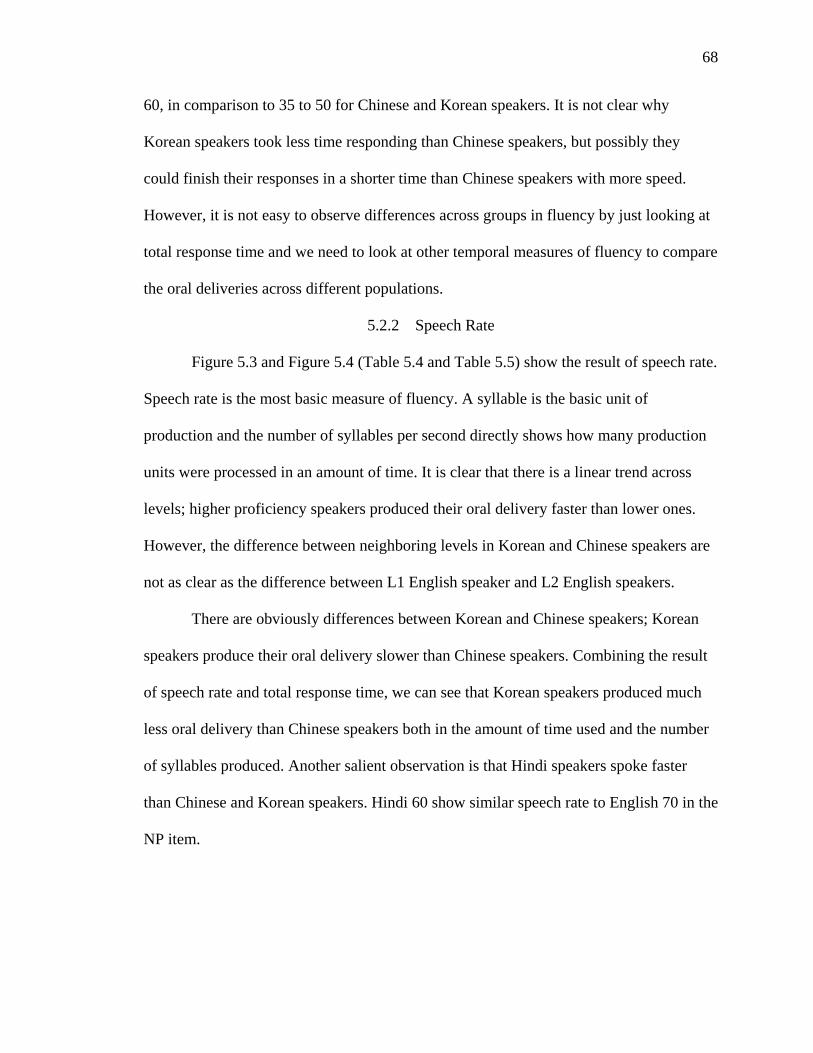
68
60, in comparison to 35 to 50 for Chinese and Korean speakers. It is not clear why
Korean speakers took less time responding than Chinese speakers, but possibly they
could finish their responses in a shorter time than Chinese speakers with more speed.
However, it is not easy to observe differences across groups in fluency by just looking at
total response time and we need to look at other temporal measures of fluency to compare
the oral deliveries across different populations.
5.2.2 Speech Rate
Figure 5.3 and Figure 5.4 (Table 5.4 and Table 5.5) show the result of speech rate.
Speech rate is the most basic measure of fluency. A syllable is the basic unit of
production and the number of syllables per second directly shows how many production
units were processed in an amount of time. It is clear that there is a linear trend across
levels; higher proficiency speakers produced their oral delivery faster than lower ones.
However, the difference between neighboring levels in Korean and Chinese speakers are
not as clear as the difference between L1 English speaker and L2 English speakers.
There are obviously differences between Korean and Chinese speakers; Korean
speakers produce their oral delivery slower than Chinese speakers. Combining the result
of speech rate and total response time, we can see that Korean speakers produced much
less oral delivery than Chinese speakers both in the amount of time used and the number
of syllables produced. Another salient observation is that Hindi speakers spoke faster
than Chinese and Korean speakers. Hindi 60 show similar speech rate to English 70 in the
NP item.
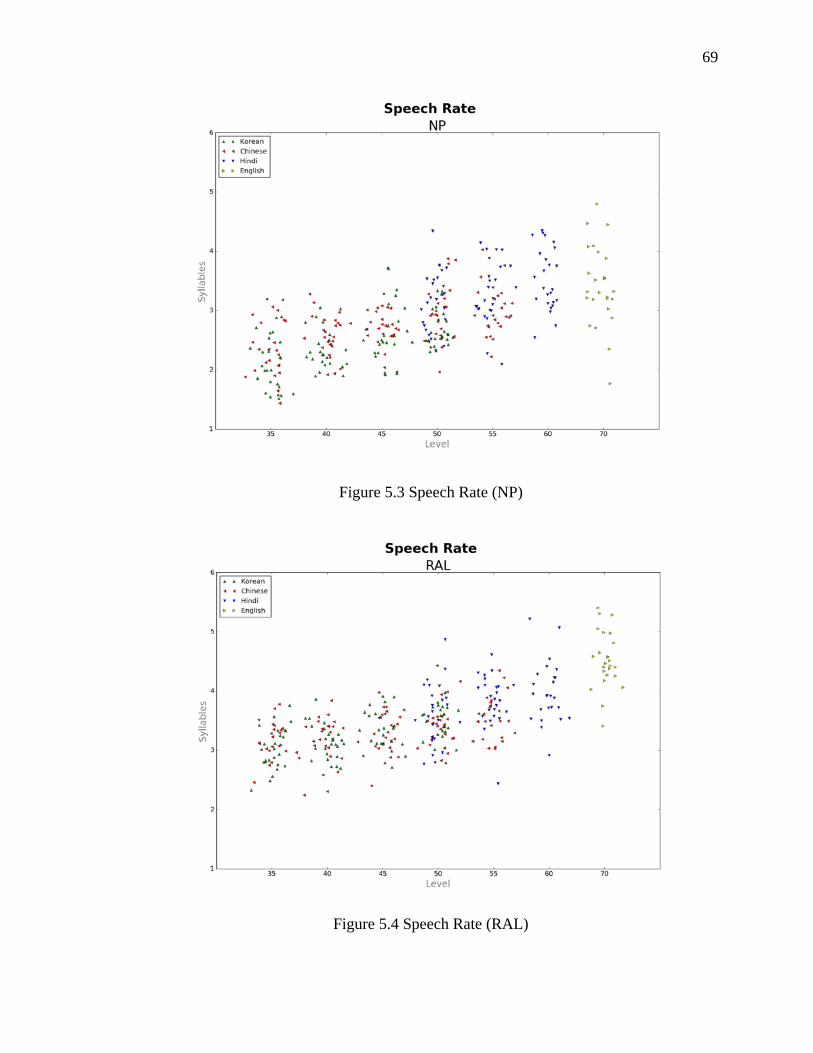
69
Figure 5.3 Speech Rate (NP)
Figure 5.4 Speech Rate (RAL)
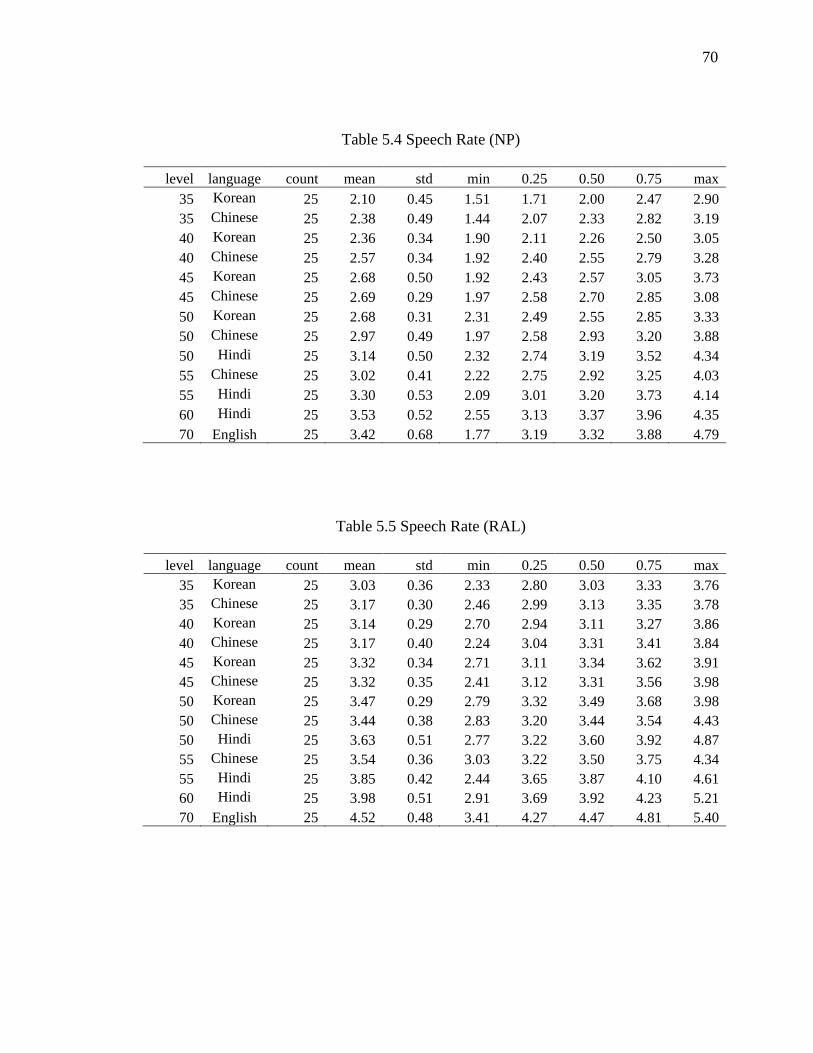
70
Table 5.4 Speech Rate (NP)
level language count mean std min 0.25 0.50 0.75 max 35 Korean 25 2.10 0.45 1.51 1.71 2.00 2.47 2.90 35 Chinese 25 2.38 0.49 1.44 2.07 2.33 2.82 3.19 40 Korean 25 2.36 0.34 1.90 2.11 2.26 2.50 3.05 40 Chinese 25 2.57 0.34 1.92 2.40 2.55 2.79 3.28 45 Korean 25 2.68 0.50 1.92 2.43 2.57 3.05 3.73 45 Chinese 25 2.69 0.29 1.97 2.58 2.70 2.85 3.08 50 Korean 25 2.68 0.31 2.31 2.49 2.55 2.85 3.33 50 Chinese 25 2.97 0.49 1.97 2.58 2.93 3.20 3.88 50 Hindi 25 3.14 0.50 2.32 2.74 3.19 3.52 4.34 55 Chinese 25 3.02 0.41 2.22 2.75 2.92 3.25 4.03 55 Hindi 25 3.30 0.53 2.09 3.01 3.20 3.73 4.14 60 Hindi 25 3.53 0.52 2.55 3.13 3.37 3.96 4.35 70 English 25 3.42 0.68 1.77 3.19 3.32 3.88 4.79
Table 5.5 Speech Rate (RAL)
level language count mean std min 0.25 0.50 0.75 max 35 Korean 25 3.03 0.36 2.33 2.80 3.03 3.33 3.76 35 Chinese 25 3.17 0.30 2.46 2.99 3.13 3.35 3.78 40 Korean 25 3.14 0.29 2.70 2.94 3.11 3.27 3.86 40 Chinese 25 3.17 0.40 2.24 3.04 3.31 3.41 3.84 45 Korean 25 3.32 0.34 2.71 3.11 3.34 3.62 3.91 45 Chinese 25 3.32 0.35 2.41 3.12 3.31 3.56 3.98 50 Korean 25 3.47 0.29 2.79 3.32 3.49 3.68 3.98 50 Chinese 25 3.44 0.38 2.83 3.20 3.44 3.54 4.43 50 Hindi 25 3.63 0.51 2.77 3.22 3.60 3.92 4.87 55 Chinese 25 3.54 0.36 3.03 3.22 3.50 3.75 4.34 55 Hindi 25 3.85 0.42 2.44 3.65 3.87 4.10 4.61 60 Hindi 25 3.98 0.51 2.91 3.69 3.92 4.23 5.21 70 English 25 4.52 0.48 3.41 4.27 4.47 4.81 5.40
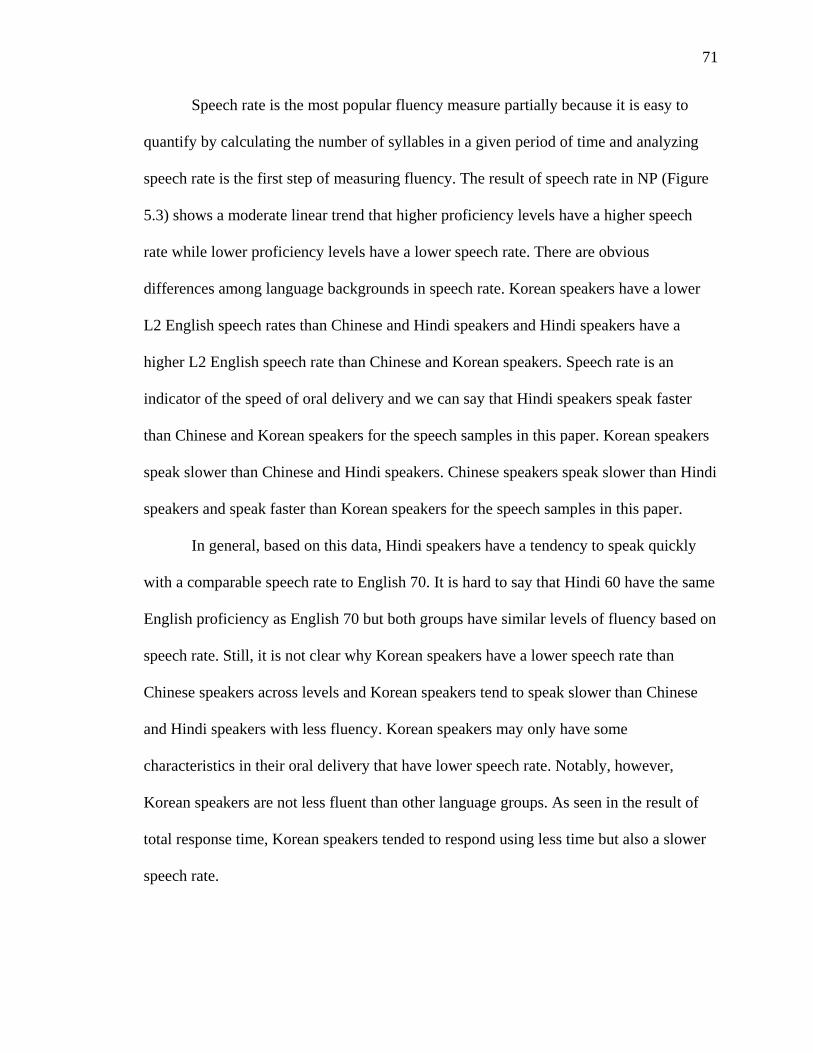
71
Speech rate is the most popular fluency measure partially because it is easy to
quantify by calculating the number of syllables in a given period of time and analyzing
speech rate is the first step of measuring fluency. The result of speech rate in NP (Figure
5.3) shows a moderate linear trend that higher proficiency levels have a higher speech
rate while lower proficiency levels have a lower speech rate. There are obvious
differences among language backgrounds in speech rate. Korean speakers have a lower
L2 English speech rates than Chinese and Hindi speakers and Hindi speakers have a
higher L2 English speech rate than Chinese and Korean speakers. Speech rate is an
indicator of the speed of oral delivery and we can say that Hindi speakers speak faster
than Chinese and Korean speakers for the speech samples in this paper. Korean speakers
speak slower than Chinese and Hindi speakers. Chinese speakers speak slower than Hindi
speakers and speak faster than Korean speakers for the speech samples in this paper.
In general, based on this data, Hindi speakers have a tendency to speak quickly
with a comparable speech rate to English 70. It is hard to say that Hindi 60 have the same
English proficiency as English 70 but both groups have similar levels of fluency based on
speech rate. Still, it is not clear why Korean speakers have a lower speech rate than
Chinese speakers across levels and Korean speakers tend to speak slower than Chinese
and Hindi speakers with less fluency. Korean speakers may only have some
characteristics in their oral delivery that have lower speech rate. Notably, however,
Korean speakers are not less fluent than other language groups. As seen in the result of
total response time, Korean speakers tended to respond using less time but also a slower
speech rate.
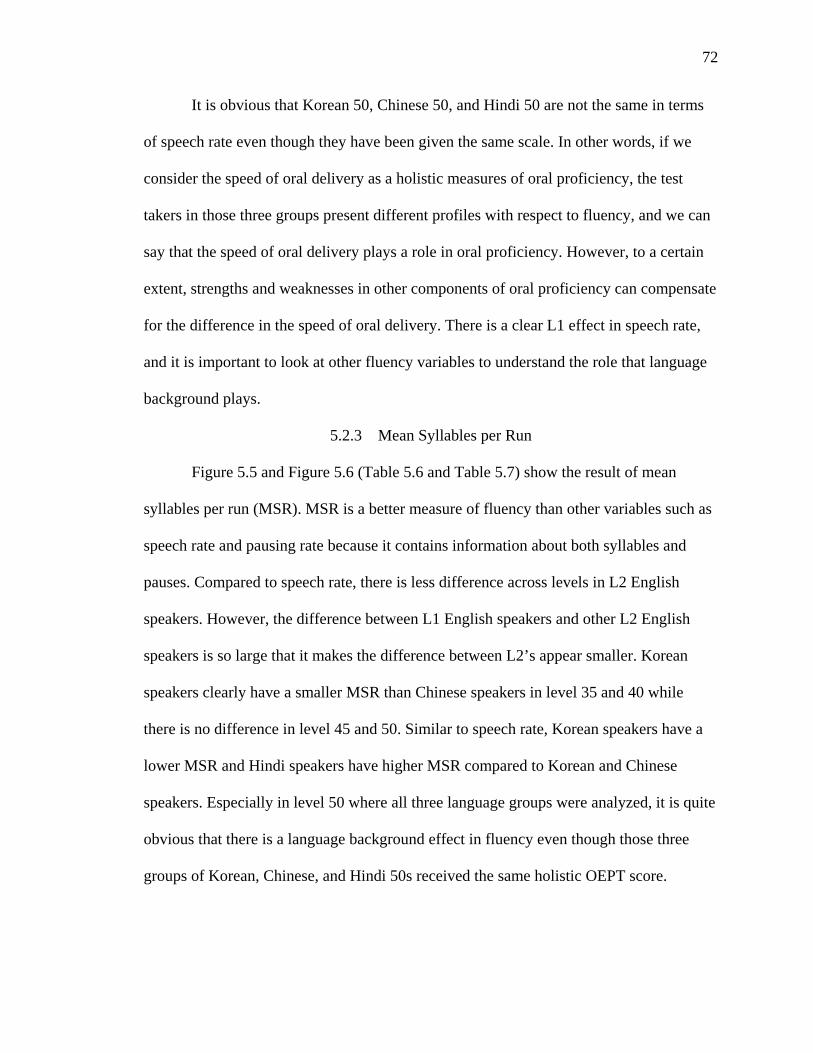
72
It is obvious that Korean 50, Chinese 50, and Hindi 50 are not the same in terms
of speech rate even though they have been given the same scale. In other words, if we
consider the speed of oral delivery as a holistic measures of oral proficiency, the test
takers in those three groups present different profiles with respect to fluency, and we can
say that the speed of oral delivery plays a role in oral proficiency. However, to a certain
extent, strengths and weaknesses in other components of oral proficiency can compensate
for the difference in the speed of oral delivery. There is a clear L1 effect in speech rate,
and it is important to look at other fluency variables to understand the role that language
background plays.
5.2.3 Mean Syllables per Run
Figure 5.5 and Figure 5.6 (Table 5.6 and Table 5.7) show the result of mean
syllables per run (MSR). MSR is a better measure of fluency than other variables such as
speech rate and pausing rate because it contains information about both syllables and
pauses. Compared to speech rate, there is less difference across levels in L2 English
speakers. However, the difference between L1 English speakers and other L2 English
speakers is so large that it makes the difference between L2’s appear smaller. Korean
speakers clearly have a smaller MSR than Chinese speakers in level 35 and 40 while
there is no difference in level 45 and 50. Similar to speech rate, Korean speakers have a
lower MSR and Hindi speakers have higher MSR compared to Korean and Chinese
speakers. Especially in level 50 where all three language groups were analyzed, it is quite
obvious that there is a language background effect in fluency even though those three
groups of Korean, Chinese, and Hindi 50s received the same holistic OEPT score.
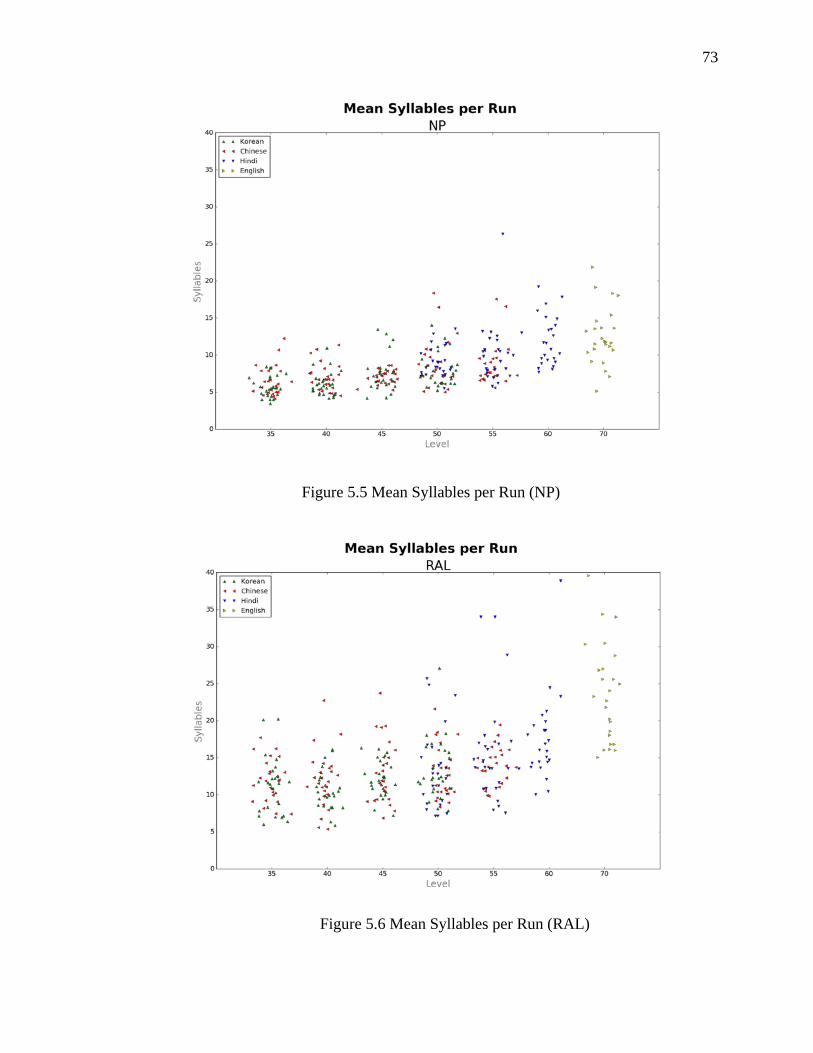
73
Figure 5.5 Mean Syllables per Run (NP)
Figure 5.6 Mean Syllables per Run (RAL)
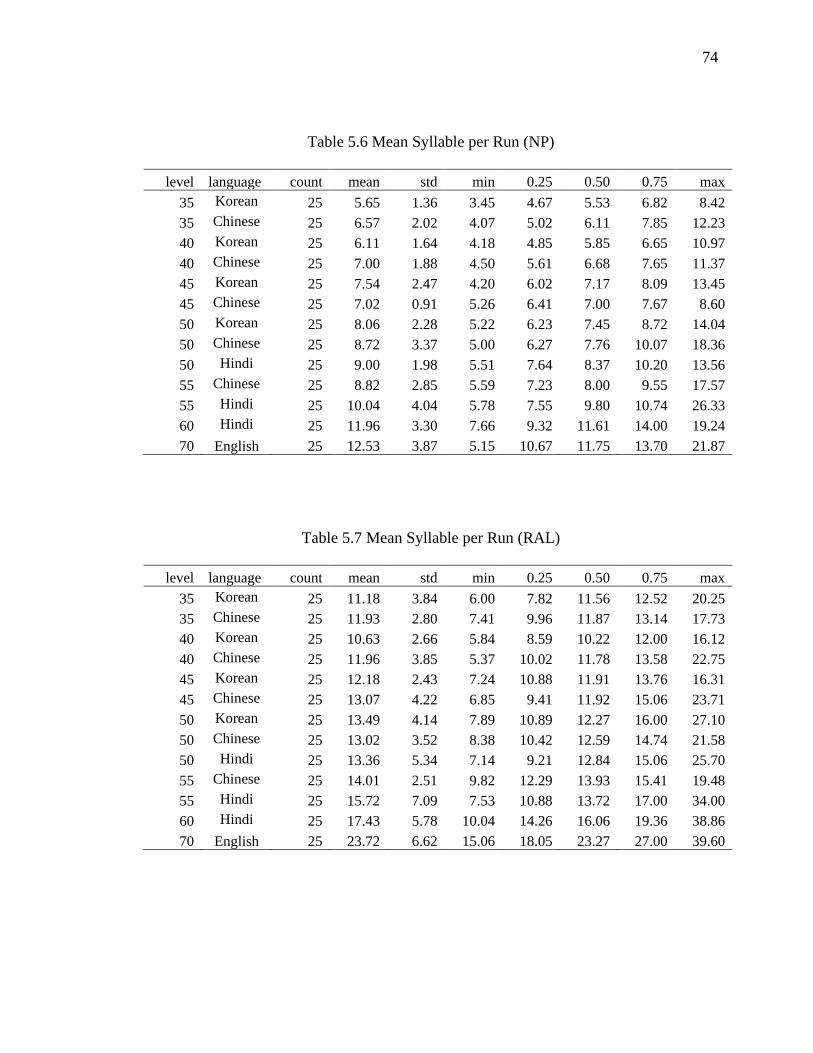
74
Table 5.6 Mean Syllable per Run (NP)
level language count mean std min 0.25 0.50 0.75 max 35 Korean 25 5.65 1.36 3.45 4.67 5.53 6.82 8.42 35 Chinese 25 6.57 2.02 4.07 5.02 6.11 7.85 12.23 40 Korean 25 6.11 1.64 4.18 4.85 5.85 6.65 10.97 40 Chinese 25 7.00 1.88 4.50 5.61 6.68 7.65 11.37 45 Korean 25 7.54 2.47 4.20 6.02 7.17 8.09 13.45 45 Chinese 25 7.02 0.91 5.26 6.41 7.00 7.67 8.60 50 Korean 25 8.06 2.28 5.22 6.23 7.45 8.72 14.04 50 Chinese 25 8.72 3.37 5.00 6.27 7.76 10.07 18.36 50 Hindi 25 9.00 1.98 5.51 7.64 8.37 10.20 13.56 55 Chinese 25 8.82 2.85 5.59 7.23 8.00 9.55 17.57 55 Hindi 25 10.04 4.04 5.78 7.55 9.80 10.74 26.33 60 Hindi 25 11.96 3.30 7.66 9.32 11.61 14.00 19.24 70 English 25 12.53 3.87 5.15 10.67 11.75 13.70 21.87
Table 5.7 Mean Syllable per Run (RAL)
level language count mean std min 0.25 0.50 0.75 max 35 Korean 25 11.18 3.84 6.00 7.82 11.56 12.52 20.25 35 Chinese 25 11.93 2.80 7.41 9.96 11.87 13.14 17.73 40 Korean 25 10.63 2.66 5.84 8.59 10.22 12.00 16.12 40 Chinese 25 11.96 3.85 5.37 10.02 11.78 13.58 22.75 45 Korean 25 12.18 2.43 7.24 10.88 11.91 13.76 16.31 45 Chinese 25 13.07 4.22 6.85 9.41 11.92 15.06 23.71 50 Korean 25 13.49 4.14 7.89 10.89 12.27 16.00 27.10 50 Chinese 25 13.02 3.52 8.38 10.42 12.59 14.74 21.58 50 Hindi 25 13.36 5.34 7.14 9.21 12.84 15.06 25.70 55 Chinese 25 14.01 2.51 9.82 12.29 13.93 15.41 19.48 55 Hindi 25 15.72 7.09 7.53 10.88 13.72 17.00 34.00 60 Hindi 25 17.43 5.78 10.04 14.26 16.06 19.36 38.86 70 English 25 23.72 6.62 15.06 18.05 23.27 27.00 39.60
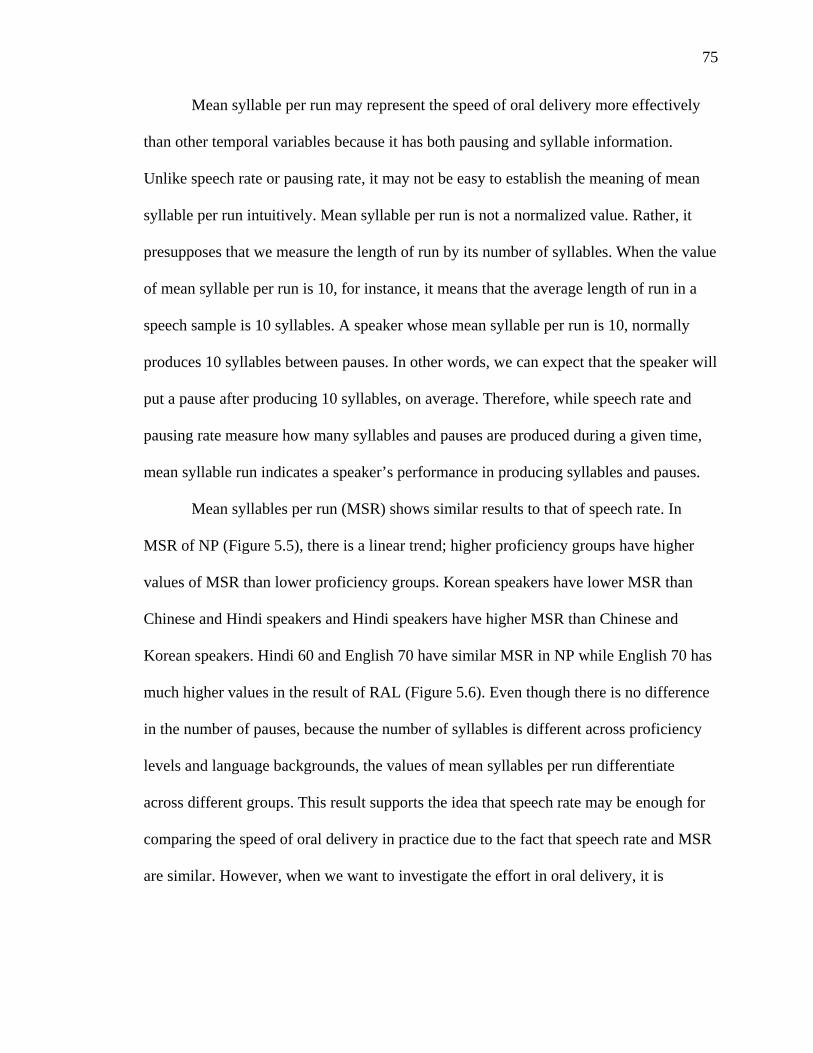
75
Mean syllable per run may represent the speed of oral delivery more effectively
than other temporal variables because it has both pausing and syllable information.
Unlike speech rate or pausing rate, it may not be easy to establish the meaning of mean
syllable per run intuitively. Mean syllable per run is not a normalized value. Rather, it
presupposes that we measure the length of run by its number of syllables. When the value
of mean syllable per run is 10, for instance, it means that the average length of run in a
speech sample is 10 syllables. A speaker whose mean syllable per run is 10, normally
produces 10 syllables between pauses. In other words, we can expect that the speaker will
put a pause after producing 10 syllables, on average. Therefore, while speech rate and
pausing rate measure how many syllables and pauses are produced during a given time,
mean syllable run indicates a speaker’s performance in producing syllables and pauses.
Mean syllables per run (MSR) shows similar results to that of speech rate. In
MSR of NP (Figure 5.5), there is a linear trend; higher proficiency groups have higher
values of MSR than lower proficiency groups. Korean speakers have lower MSR than
Chinese and Hindi speakers and Hindi speakers have higher MSR than Chinese and
Korean speakers. Hindi 60 and English 70 have similar MSR in NP while English 70 has
much higher values in the result of RAL (Figure 5.6). Even though there is no difference
in the number of pauses, because the number of syllables is different across proficiency
levels and language backgrounds, the values of mean syllables per run differentiate
across different groups. This result supports the idea that speech rate may be enough for
comparing the speed of oral delivery in practice due to the fact that speech rate and MSR
are similar. However, when we want to investigate the effort in oral delivery, it is
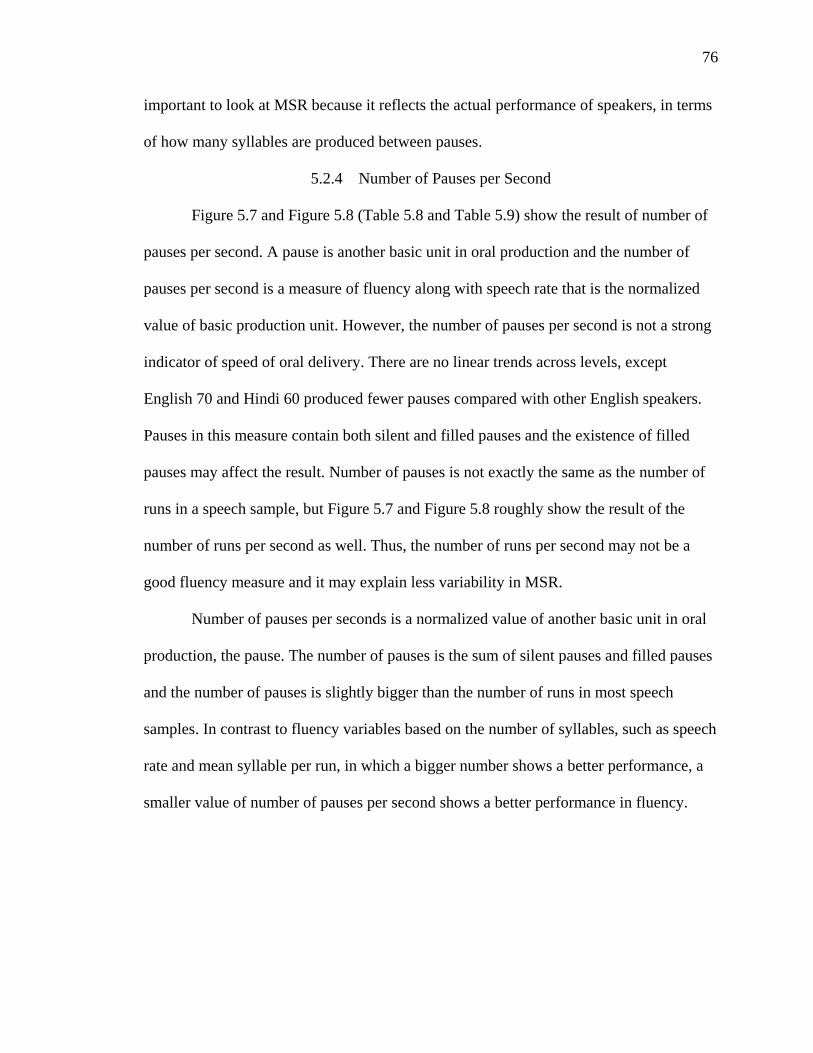
76
important to look at MSR because it reflects the actual performance of speakers, in terms
of how many syllables are produced between pauses.
5.2.4 Number of Pauses per Second
Figure 5.7 and Figure 5.8 (Table 5.8 and Table 5.9) show the result of number of
pauses per second. A pause is another basic unit in oral production and the number of
pauses per second is a measure of fluency along with speech rate that is the normalized
value of basic production unit. However, the number of pauses per second is not a strong
indicator of speed of oral delivery. There are no linear trends across levels, except
English 70 and Hindi 60 produced fewer pauses compared with other English speakers.
Pauses in this measure contain both silent and filled pauses and the existence of filled
pauses may affect the result. Number of pauses is not exactly the same as the number of
runs in a speech sample, but Figure 5.7 and Figure 5.8 roughly show the result of the
number of runs per second as well. Thus, the number of runs per second may not be a
good fluency measure and it may explain less variability in MSR.
Number of pauses per seconds is a normalized value of another basic unit in oral
production, the pause. The number of pauses is the sum of silent pauses and filled pauses
and the number of pauses is slightly bigger than the number of runs in most speech
samples. In contrast to fluency variables based on the number of syllables, such as speech
rate and mean syllable per run, in which a bigger number shows a better performance, a
smaller value of number of pauses per second shows a better performance in fluency.
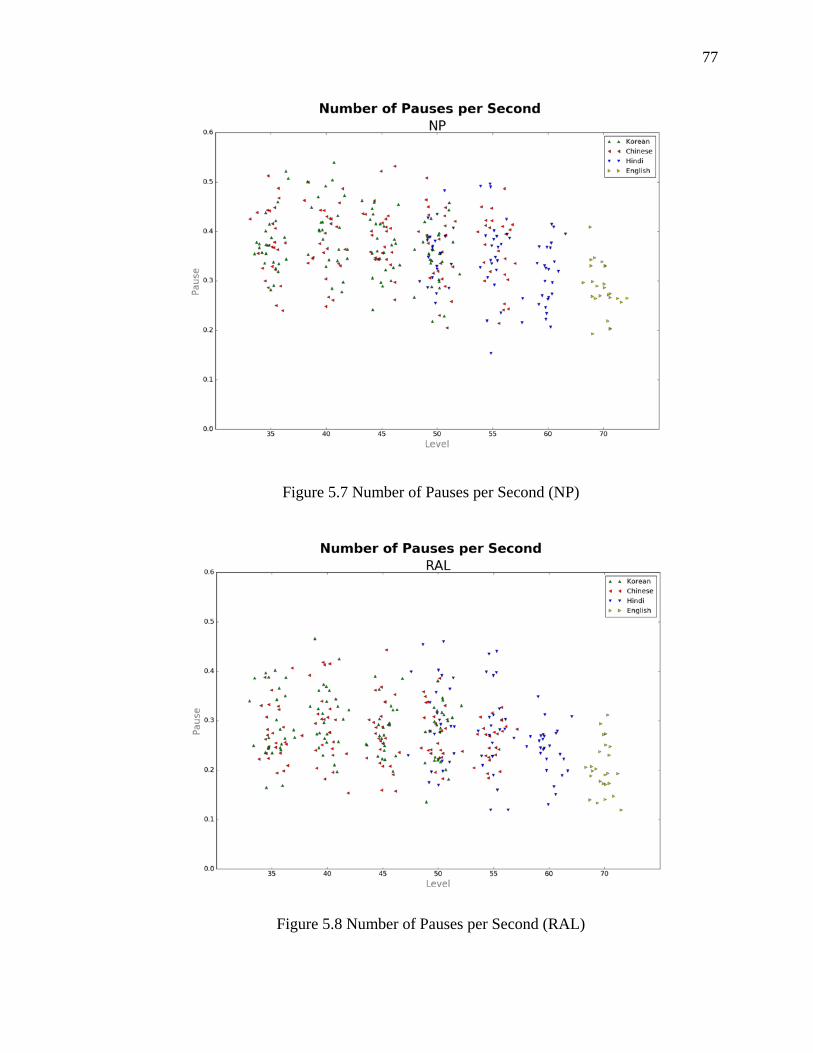
77
Figure 5.7 Number of Pauses per Second (NP)
Figure 5.8 Number of Pauses per Second (RAL)
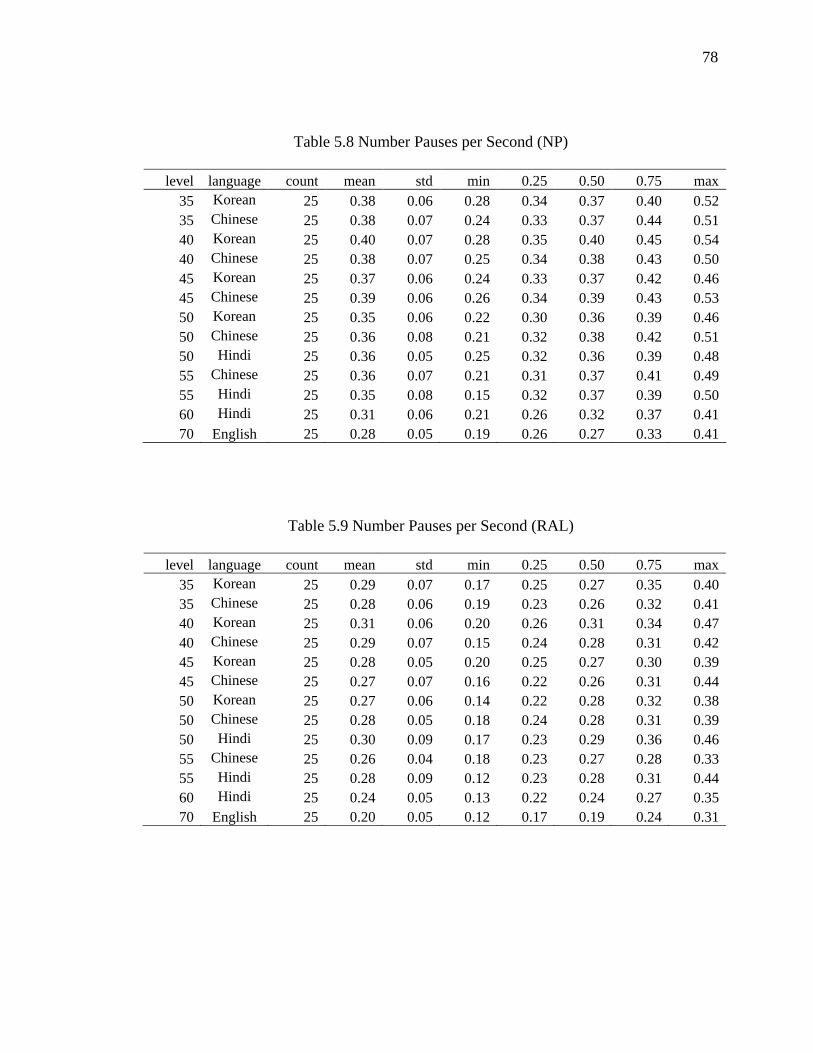
78
Table 5.8 Number Pauses per Second (NP)
level language count mean std min 0.25 0.50 0.75 max 35 Korean 25 0.38 0.06 0.28 0.34 0.37 0.40 0.52 35 Chinese 25 0.38 0.07 0.24 0.33 0.37 0.44 0.51 40 Korean 25 0.40 0.07 0.28 0.35 0.40 0.45 0.54 40 Chinese 25 0.38 0.07 0.25 0.34 0.38 0.43 0.50 45 Korean 25 0.37 0.06 0.24 0.33 0.37 0.42 0.46 45 Chinese 25 0.39 0.06 0.26 0.34 0.39 0.43 0.53 50 Korean 25 0.35 0.06 0.22 0.30 0.36 0.39 0.46 50 Chinese 25 0.36 0.08 0.21 0.32 0.38 0.42 0.51 50 Hindi 25 0.36 0.05 0.25 0.32 0.36 0.39 0.48 55 Chinese 25 0.36 0.07 0.21 0.31 0.37 0.41 0.49 55 Hindi 25 0.35 0.08 0.15 0.32 0.37 0.39 0.50 60 Hindi 25 0.31 0.06 0.21 0.26 0.32 0.37 0.41 70 English 25 0.28 0.05 0.19 0.26 0.27 0.33 0.41
Table 5.9 Number Pauses per Second (RAL)
level language count mean std min 0.25 0.50 0.75 max 35 Korean 25 0.29 0.07 0.17 0.25 0.27 0.35 0.40 35 Chinese 25 0.28 0.06 0.19 0.23 0.26 0.32 0.41 40 Korean 25 0.31 0.06 0.20 0.26 0.31 0.34 0.47 40 Chinese 25 0.29 0.07 0.15 0.24 0.28 0.31 0.42 45 Korean 25 0.28 0.05 0.20 0.25 0.27 0.30 0.39 45 Chinese 25 0.27 0.07 0.16 0.22 0.26 0.31 0.44 50 Korean 25 0.27 0.06 0.14 0.22 0.28 0.32 0.38 50 Chinese 25 0.28 0.05 0.18 0.24 0.28 0.31 0.39 50 Hindi 25 0.30 0.09 0.17 0.23 0.29 0.36 0.46 55 Chinese 25 0.26 0.04 0.18 0.23 0.27 0.28 0.33 55 Hindi 25 0.28 0.09 0.12 0.23 0.28 0.31 0.44 60 Hindi 25 0.24 0.05 0.13 0.22 0.24 0.27 0.35 70 English 25 0.20 0.05 0.12 0.17 0.19 0.24 0.31
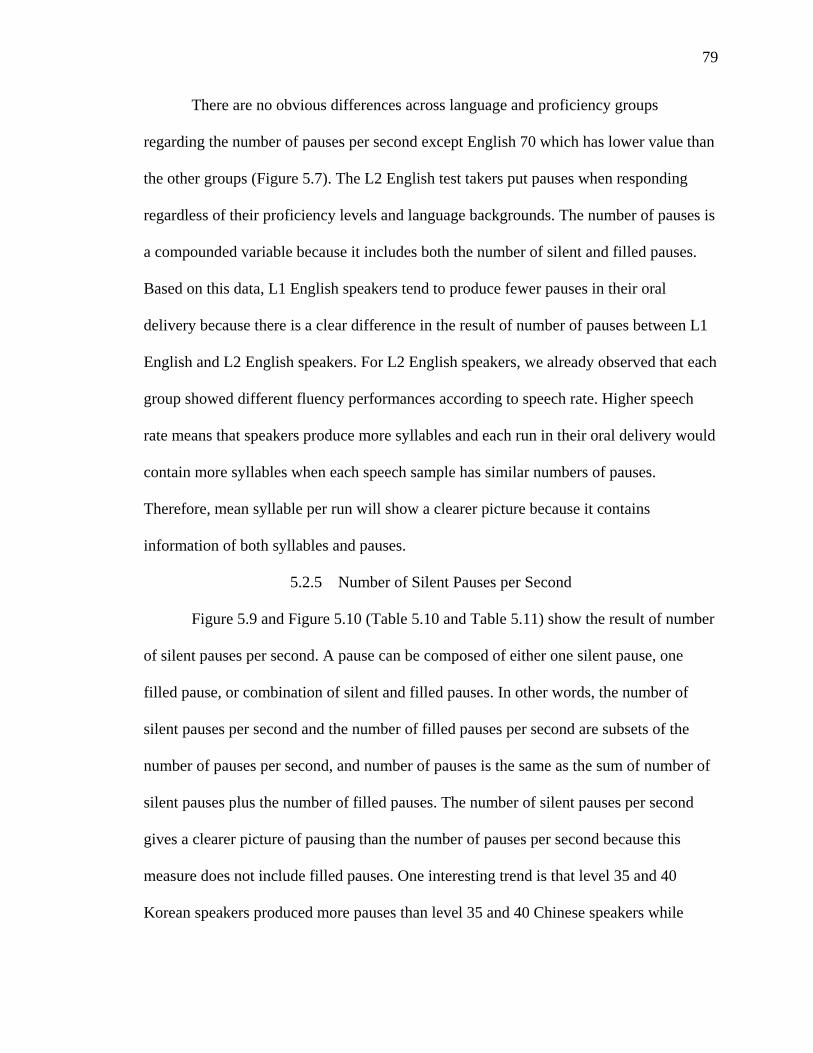
79
There are no obvious differences across language and proficiency groups
regarding the number of pauses per second except English 70 which has lower value than
the other groups (Figure 5.7). The L2 English test takers put pauses when responding
regardless of their proficiency levels and language backgrounds. The number of pauses is
a compounded variable because it includes both the number of silent and filled pauses.
Based on this data, L1 English speakers tend to produce fewer pauses in their oral
delivery because there is a clear difference in the result of number of pauses between L1
English and L2 English speakers. For L2 English speakers, we already observed that each
group showed different fluency performances according to speech rate. Higher speech
rate means that speakers produce more syllables and each run in their oral delivery would
contain more syllables when each speech sample has similar numbers of pauses.
Therefore, mean syllable per run will show a clearer picture because it contains
information of both syllables and pauses.
5.2.5 Number of Silent Pauses per Second
Figure 5.9 and Figure 5.10 (Table 5.10 and Table 5.11) show the result of number
of silent pauses per second. A pause can be composed of either one silent pause, one
filled pause, or combination of silent and filled pauses. In other words, the number of
silent pauses per second and the number of filled pauses per second are subsets of the
number of pauses per second, and number of pauses is the same as the sum of number of
silent pauses plus the number of filled pauses. The number of silent pauses per second
gives a clearer picture of pausing than the number of pauses per second because this
measure does not include filled pauses. One interesting trend is that level 35 and 40
Korean speakers produced more pauses than level 35 and 40 Chinese speakers while
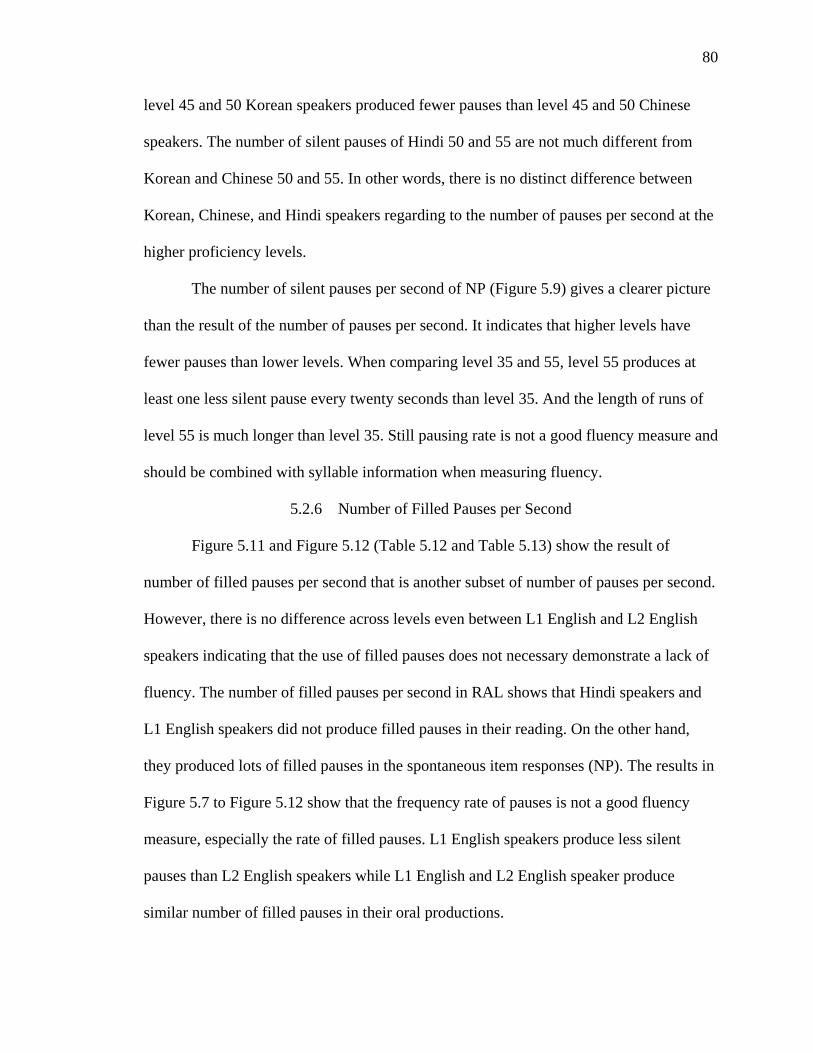
80
level 45 and 50 Korean speakers produced fewer pauses than level 45 and 50 Chinese
speakers. The number of silent pauses of Hindi 50 and 55 are not much different from
Korean and Chinese 50 and 55. In other words, there is no distinct difference between
Korean, Chinese, and Hindi speakers regarding to the number of pauses per second at the
higher proficiency levels.
The number of silent pauses per second of NP (Figure 5.9) gives a clearer picture
than the result of the number of pauses per second. It indicates that higher levels have
fewer pauses than lower levels. When comparing level 35 and 55, level 55 produces at
least one less silent pause every twenty seconds than level 35. And the length of runs of
level 55 is much longer than level 35. Still pausing rate is not a good fluency measure and
should be combined with syllable information when measuring fluency.
5.2.6 Number of Filled Pauses per Second
Figure 5.11 and Figure 5.12 (Table 5.12 and Table 5.13) show the result of
number of filled pauses per second that is another subset of number of pauses per second.
However, there is no difference across levels even between L1 English and L2 English
speakers indicating that the use of filled pauses does not necessary demonstrate a lack of
fluency. The number of filled pauses per second in RAL shows that Hindi speakers and
L1 English speakers did not produce filled pauses in their reading. On the other hand,
they produced lots of filled pauses in the spontaneous item responses (NP). The results in
Figure 5.7 to Figure 5.12 show that the frequency rate of pauses is not a good fluency
measure, especially the rate of filled pauses. L1 English speakers produce less silent
pauses than L2 English speakers while L1 English and L2 English speaker produce
similar number of filled pauses in their oral productions.
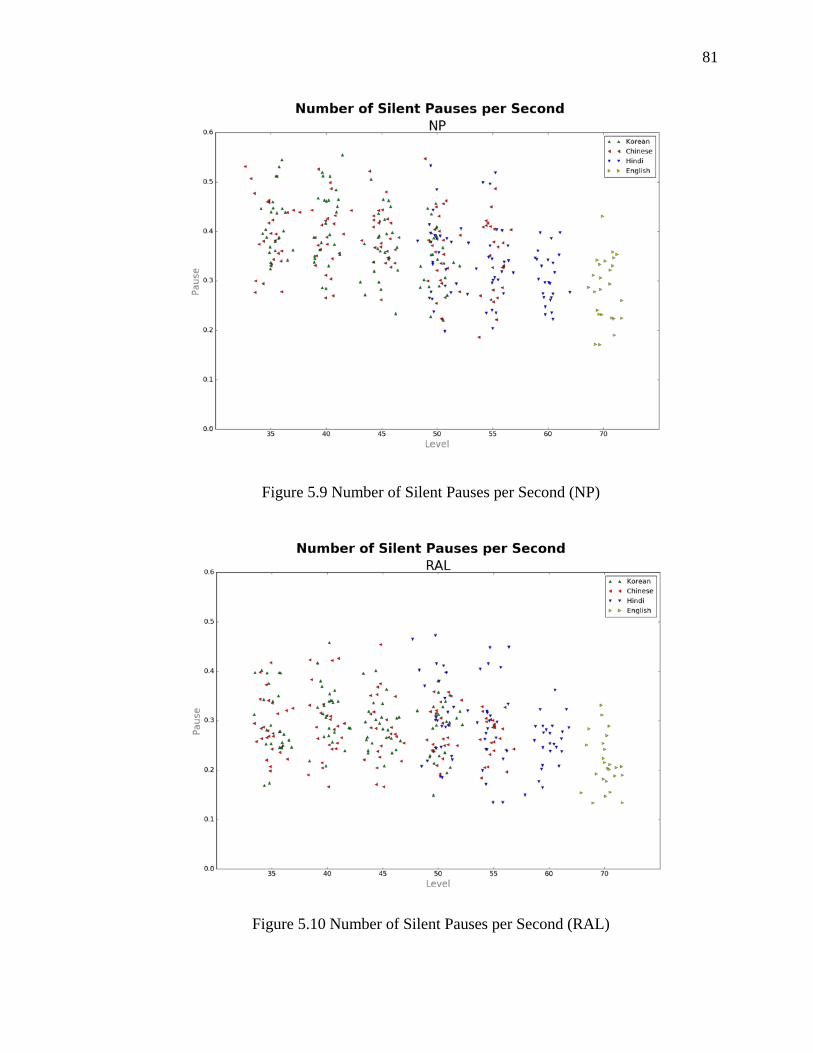
81
Figure 5.9 Number of Silent Pauses per Second (NP)
Figure 5.10 Number of Silent Pauses per Second (RAL)
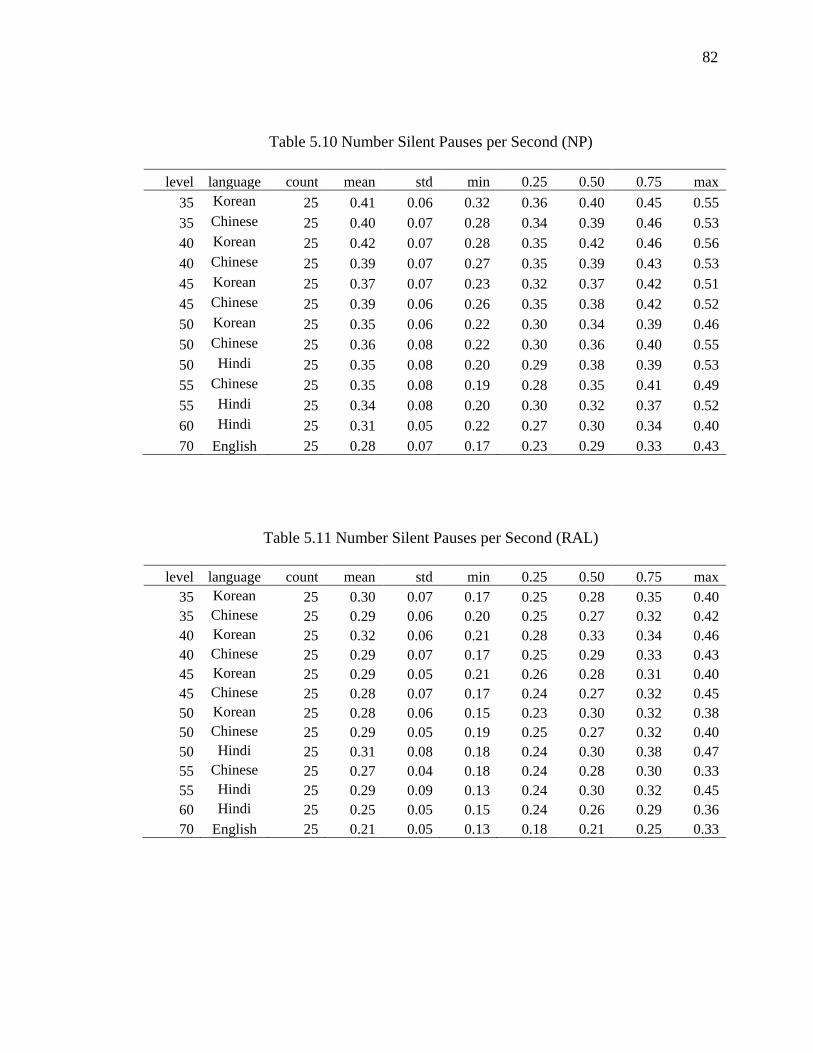
82
Table 5.10 Number Silent Pauses per Second (NP)
level language count mean std min 0.25 0.50 0.75 max 35 Korean 25 0.41 0.06 0.32 0.36 0.40 0.45 0.55 35 Chinese 25 0.40 0.07 0.28 0.34 0.39 0.46 0.53 40 Korean 25 0.42 0.07 0.28 0.35 0.42 0.46 0.56 40 Chinese 25 0.39 0.07 0.27 0.35 0.39 0.43 0.53 45 Korean 25 0.37 0.07 0.23 0.32 0.37 0.42 0.51 45 Chinese 25 0.39 0.06 0.26 0.35 0.38 0.42 0.52 50 Korean 25 0.35 0.06 0.22 0.30 0.34 0.39 0.46 50 Chinese 25 0.36 0.08 0.22 0.30 0.36 0.40 0.55 50 Hindi 25 0.35 0.08 0.20 0.29 0.38 0.39 0.53 55 Chinese 25 0.35 0.08 0.19 0.28 0.35 0.41 0.49 55 Hindi 25 0.34 0.08 0.20 0.30 0.32 0.37 0.52 60 Hindi 25 0.31 0.05 0.22 0.27 0.30 0.34 0.40 70 English 25 0.28 0.07 0.17 0.23 0.29 0.33 0.43
Table 5.11 Number Silent Pauses per Second (RAL)
level language count mean std min 0.25 0.50 0.75 max 35 Korean 25 0.30 0.07 0.17 0.25 0.28 0.35 0.40 35 Chinese 25 0.29 0.06 0.20 0.25 0.27 0.32 0.42 40 Korean 25 0.32 0.06 0.21 0.28 0.33 0.34 0.46 40 Chinese 25 0.29 0.07 0.17 0.25 0.29 0.33 0.43 45 Korean 25 0.29 0.05 0.21 0.26 0.28 0.31 0.40 45 Chinese 25 0.28 0.07 0.17 0.24 0.27 0.32 0.45 50 Korean 25 0.28 0.06 0.15 0.23 0.30 0.32 0.38 50 Chinese 25 0.29 0.05 0.19 0.25 0.27 0.32 0.40 50 Hindi 25 0.31 0.08 0.18 0.24 0.30 0.38 0.47 55 Chinese 25 0.27 0.04 0.18 0.24 0.28 0.30 0.33 55 Hindi 25 0.29 0.09 0.13 0.24 0.30 0.32 0.45 60 Hindi 25 0.25 0.05 0.15 0.24 0.26 0.29 0.36 70 English 25 0.21 0.05 0.13 0.18 0.21 0.25 0.33
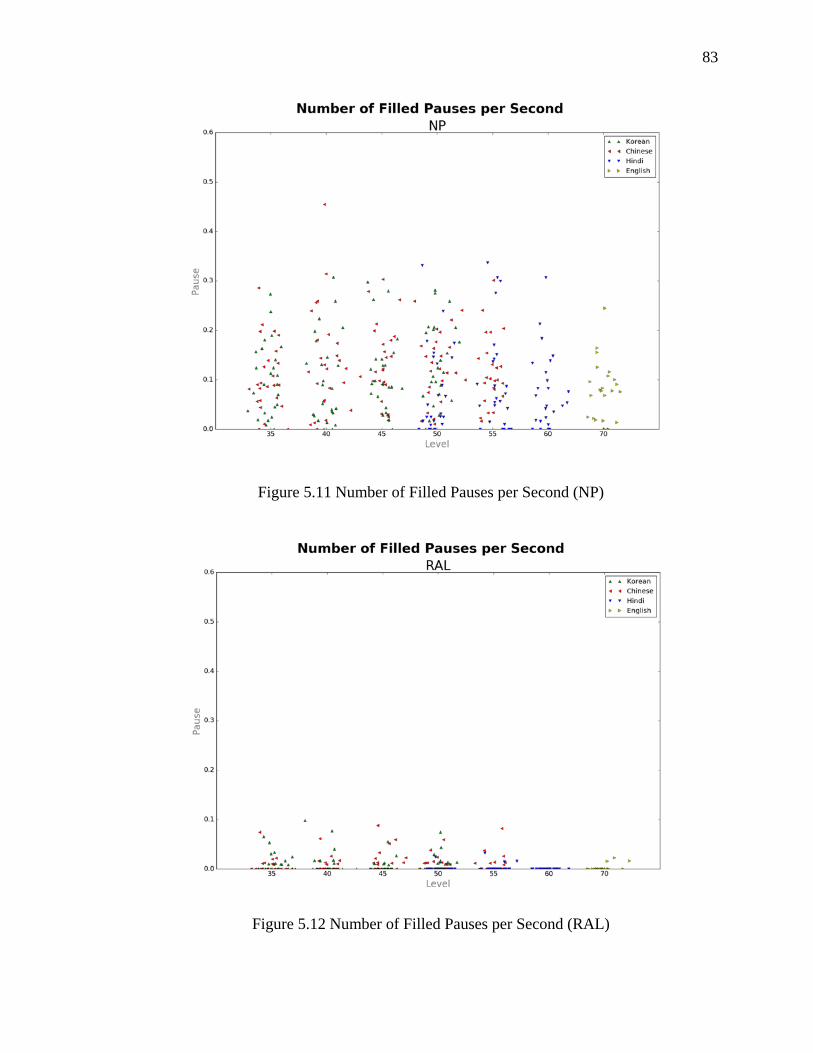
83
Figure 5.11 Number of Filled Pauses per Second (NP)
Figure 5.12 Number of Filled Pauses per Second (RAL)
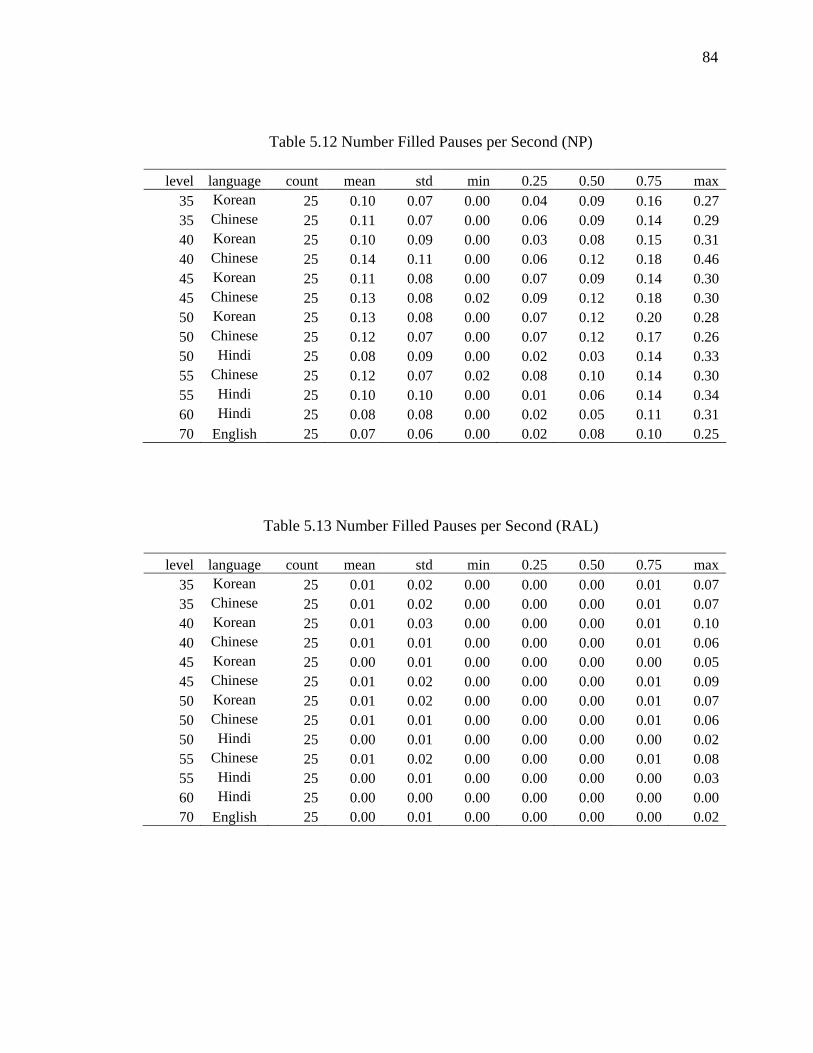
84
Table 5.12 Number Filled Pauses per Second (NP)
level language count mean std min 0.25 0.50 0.75 max 35 Korean 25 0.10 0.07 0.00 0.04 0.09 0.16 0.27 35 Chinese 25 0.11 0.07 0.00 0.06 0.09 0.14 0.29 40 Korean 25 0.10 0.09 0.00 0.03 0.08 0.15 0.31 40 Chinese 25 0.14 0.11 0.00 0.06 0.12 0.18 0.46 45 Korean 25 0.11 0.08 0.00 0.07 0.09 0.14 0.30 45 Chinese 25 0.13 0.08 0.02 0.09 0.12 0.18 0.30 50 Korean 25 0.13 0.08 0.00 0.07 0.12 0.20 0.28 50 Chinese 25 0.12 0.07 0.00 0.07 0.12 0.17 0.26 50 Hindi 25 0.08 0.09 0.00 0.02 0.03 0.14 0.33 55 Chinese 25 0.12 0.07 0.02 0.08 0.10 0.14 0.30 55 Hindi 25 0.10 0.10 0.00 0.01 0.06 0.14 0.34 60 Hindi 25 0.08 0.08 0.00 0.02 0.05 0.11 0.31 70 English 25 0.07 0.06 0.00 0.02 0.08 0.10 0.25
Table 5.13 Number Filled Pauses per Second (RAL)
level language count mean std min 0.25 0.50 0.75 max 35 Korean 25 0.01 0.02 0.00 0.00 0.00 0.01 0.07 35 Chinese 25 0.01 0.02 0.00 0.00 0.00 0.01 0.07 40 Korean 25 0.01 0.03 0.00 0.00 0.00 0.01 0.10 40 Chinese 25 0.01 0.01 0.00 0.00 0.00 0.01 0.06 45 Korean 25 0.00 0.01 0.00 0.00 0.00 0.00 0.05 45 Chinese 25 0.01 0.02 0.00 0.00 0.00 0.01 0.09 50 Korean 25 0.01 0.02 0.00 0.00 0.00 0.01 0.07 50 Chinese 25 0.01 0.01 0.00 0.00 0.00 0.01 0.06 50 Hindi 25 0.00 0.01 0.00 0.00 0.00 0.00 0.02 55 Chinese 25 0.01 0.02 0.00 0.00 0.00 0.01 0.08 55 Hindi 25 0.00 0.01 0.00 0.00 0.00 0.00 0.03 60 Hindi 25 0.00 0.00 0.00 0.00 0.00 0.00 0.00 70 English 25 0.00 0.01 0.00 0.00 0.00 0.00 0.02
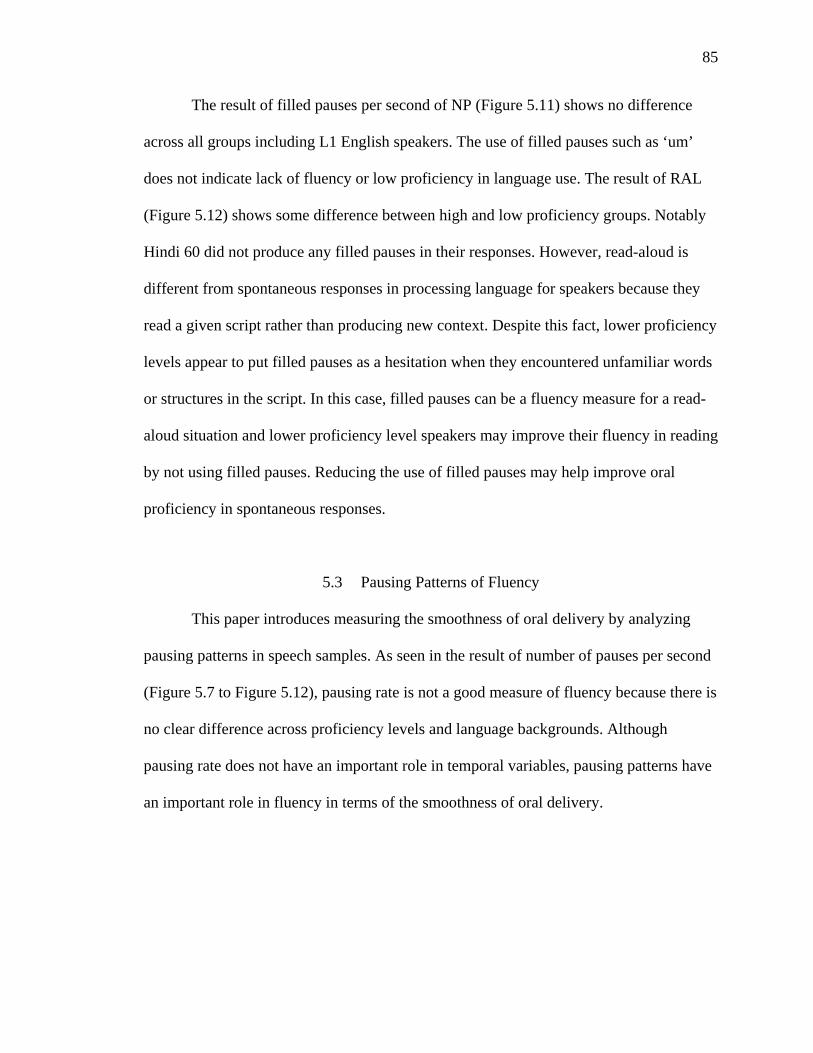
85
The result of filled pauses per second of NP (Figure 5.11) shows no difference
across all groups including L1 English speakers. The use of filled pauses such as ‘um’
does not indicate lack of fluency or low proficiency in language use. The result of RAL
(Figure 5.12) shows some difference between high and low proficiency groups. Notably
Hindi 60 did not produce any filled pauses in their responses. However, read-aloud is
different from spontaneous responses in processing language for speakers because they
read a given script rather than producing new context. Despite this fact, lower proficiency
levels appear to put filled pauses as a hesitation when they encountered unfamiliar words
or structures in the script. In this case, filled pauses can be a fluency measure for a read-
aloud situation and lower proficiency level speakers may improve their fluency in reading
by not using filled pauses. Reducing the use of filled pauses may help improve oral
proficiency in spontaneous responses.
5.3 Pausing Patterns of Fluency
This paper introduces measuring the smoothness of oral delivery by analyzing
pausing patterns in speech samples. As seen in the result of number of pauses per second
(Figure 5.7 to Figure 5.12), pausing rate is not a good measure of fluency because there is
no clear difference across proficiency levels and language backgrounds. Although
pausing rate does not have an important role in temporal variables, pausing patterns have
an important role in fluency in terms of the smoothness of oral delivery.
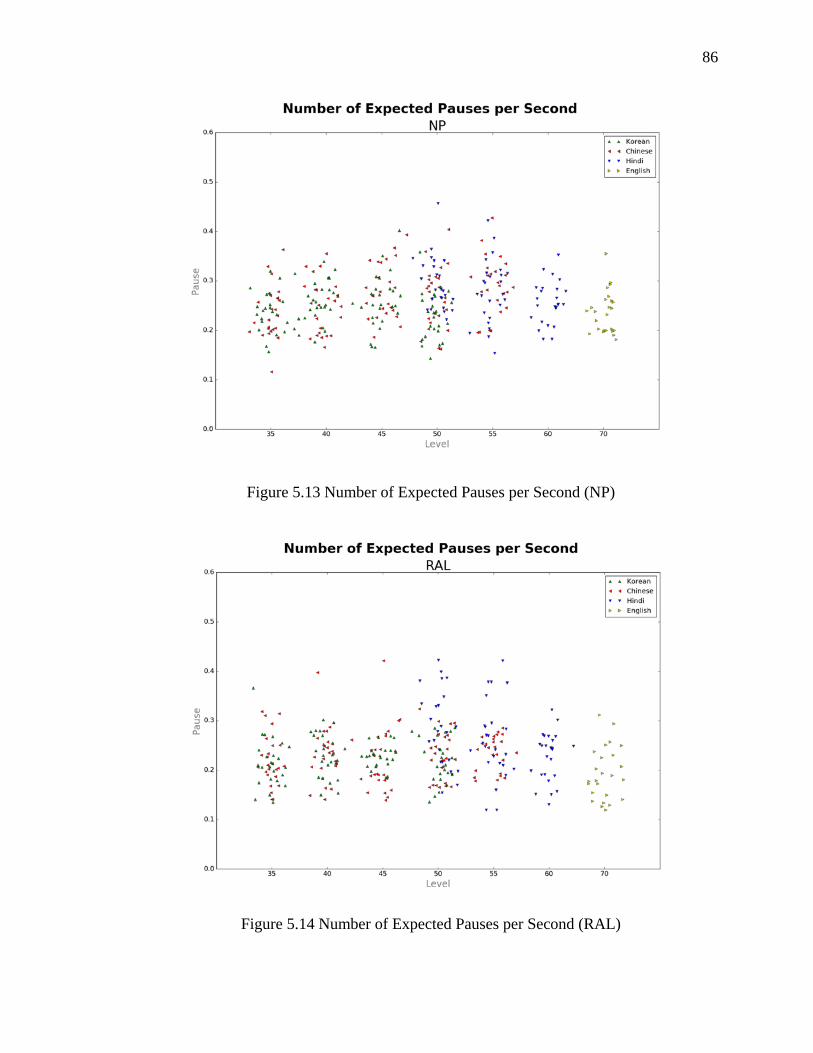
86
Figure 5.13 Number of Expected Pauses per Second (NP)
Figure 5.14 Number of Expected Pauses per Second (RAL)

87
Table 5.14 Number of Expected Pauses per Second (NP)
level language count mean std min 0.25 0.50 0.75 max 35 Korean 25 0.24 0.04 0.16 0.20 0.24 0.26 0.32 35 Chinese 25 0.24 0.05 0.12 0.20 0.23 0.27 0.36 40 Korean 25 0.26 0.04 0.18 0.24 0.26 0.28 0.34 40 Chinese 25 0.25 0.05 0.17 0.20 0.25 0.29 0.36 45 Korean 25 0.26 0.06 0.17 0.23 0.25 0.28 0.40 45 Chinese 25 0.28 0.05 0.19 0.24 0.27 0.34 0.39 50 Korean 25 0.23 0.05 0.14 0.20 0.24 0.26 0.36 50 Chinese 25 0.27 0.06 0.16 0.22 0.28 0.31 0.40 50 Hindi 25 0.30 0.05 0.22 0.26 0.28 0.33 0.46 55 Chinese 25 0.29 0.06 0.20 0.26 0.29 0.32 0.43 55 Hindi 25 0.28 0.06 0.15 0.24 0.27 0.32 0.42 60 Hindi 25 0.26 0.04 0.18 0.23 0.25 0.28 0.35 70 English 25 0.24 0.04 0.18 0.20 0.24 0.26 0.36
Table 5.15 Number of Expected Pauses per Second (RAL)
level language count mean std min 0.25 0.50 0.75 max 35 Korean 25 0.22 0.05 0.14 0.18 0.21 0.24 0.37 35 Chinese 25 0.22 0.05 0.14 0.19 0.21 0.25 0.32 40 Korean 25 0.23 0.04 0.15 0.21 0.23 0.27 0.30 40 Chinese 25 0.23 0.05 0.14 0.21 0.23 0.26 0.40 45 Korean 25 0.23 0.02 0.18 0.21 0.23 0.24 0.27 45 Chinese 25 0.22 0.06 0.14 0.18 0.19 0.27 0.42 50 Korean 25 0.22 0.05 0.14 0.19 0.21 0.27 0.29 50 Chinese 25 0.23 0.05 0.16 0.17 0.22 0.27 0.32 50 Hindi 25 0.28 0.08 0.15 0.22 0.28 0.33 0.42 55 Chinese 25 0.24 0.03 0.18 0.20 0.25 0.26 0.28 55 Hindi 25 0.26 0.08 0.12 0.21 0.25 0.29 0.42 60 Hindi 25 0.23 0.05 0.13 0.19 0.24 0.26 0.32 70 English 25 0.19 0.05 0.12 0.15 0.18 0.23 0.31
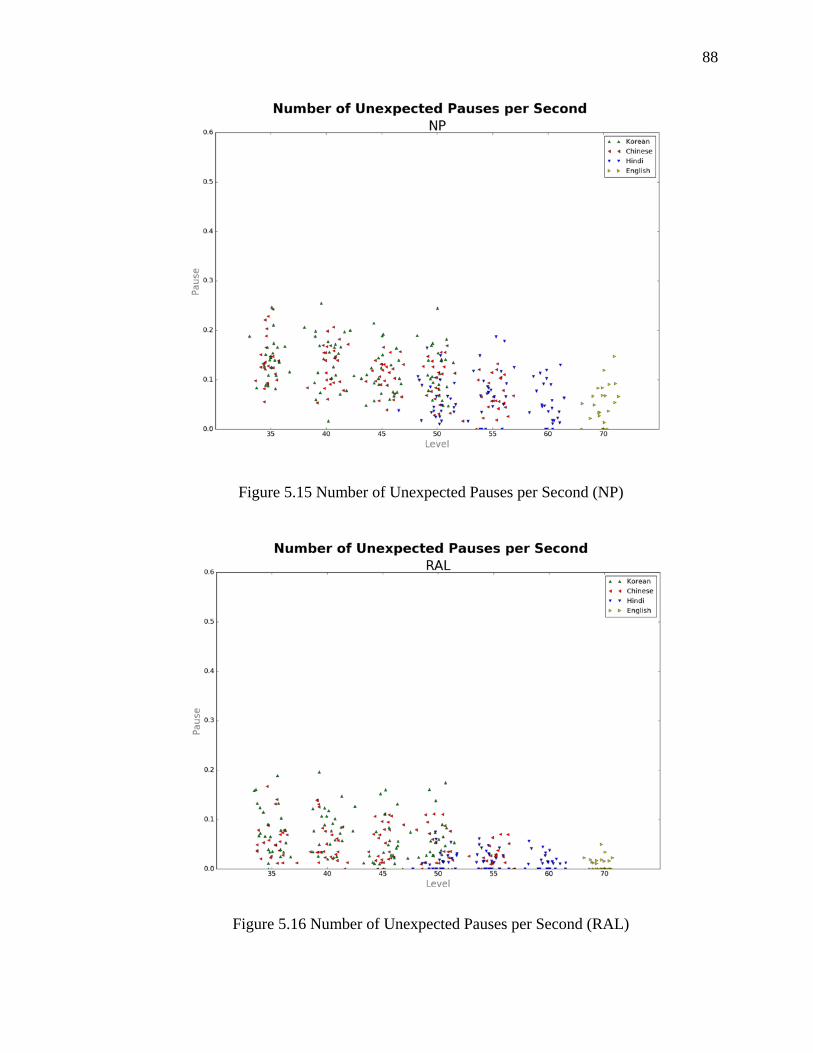
88
Figure 5.15 Number of Unexpected Pauses per Second (NP)
Figure 5.16 Number of Unexpected Pauses per Second (RAL)
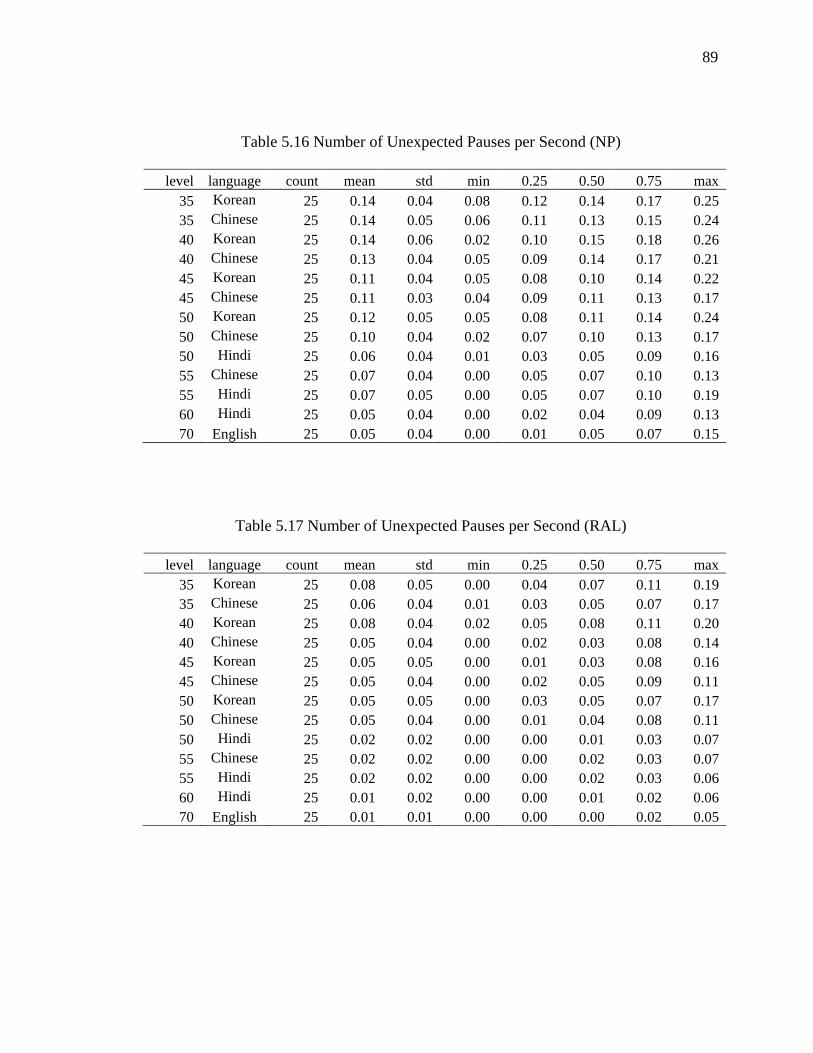
89
Table 5.16 Number of Unexpected Pauses per Second (NP)
level language count mean std min 0.25 0.50 0.75 max 35 Korean 25 0.14 0.04 0.08 0.12 0.14 0.17 0.25 35 Chinese 25 0.14 0.05 0.06 0.11 0.13 0.15 0.24 40 Korean 25 0.14 0.06 0.02 0.10 0.15 0.18 0.26 40 Chinese 25 0.13 0.04 0.05 0.09 0.14 0.17 0.21 45 Korean 25 0.11 0.04 0.05 0.08 0.10 0.14 0.22 45 Chinese 25 0.11 0.03 0.04 0.09 0.11 0.13 0.17 50 Korean 25 0.12 0.05 0.05 0.08 0.11 0.14 0.24 50 Chinese 25 0.10 0.04 0.02 0.07 0.10 0.13 0.17 50 Hindi 25 0.06 0.04 0.01 0.03 0.05 0.09 0.16 55 Chinese 25 0.07 0.04 0.00 0.05 0.07 0.10 0.13 55 Hindi 25 0.07 0.05 0.00 0.05 0.07 0.10 0.19 60 Hindi 25 0.05 0.04 0.00 0.02 0.04 0.09 0.13 70 English 25 0.05 0.04 0.00 0.01 0.05 0.07 0.15
Table 5.17 Number of Unexpected Pauses per Second (RAL)
level language count mean std min 0.25 0.50 0.75 max 35 Korean 25 0.08 0.05 0.00 0.04 0.07 0.11 0.19 35 Chinese 25 0.06 0.04 0.01 0.03 0.05 0.07 0.17 40 Korean 25 0.08 0.04 0.02 0.05 0.08 0.11 0.20 40 Chinese 25 0.05 0.04 0.00 0.02 0.03 0.08 0.14 45 Korean 25 0.05 0.05 0.00 0.01 0.03 0.08 0.16 45 Chinese 25 0.05 0.04 0.00 0.02 0.05 0.09 0.11 50 Korean 25 0.05 0.05 0.00 0.03 0.05 0.07 0.17 50 Chinese 25 0.05 0.04 0.00 0.01 0.04 0.08 0.11 50 Hindi 25 0.02 0.02 0.00 0.00 0.01 0.03 0.07 55 Chinese 25 0.02 0.02 0.00 0.00 0.02 0.03 0.07 55 Hindi 25 0.02 0.02 0.00 0.00 0.02 0.03 0.06 60 Hindi 25 0.01 0.02 0.00 0.00 0.01 0.02 0.06 70 English 25 0.01 0.01 0.00 0.00 0.00 0.02 0.05
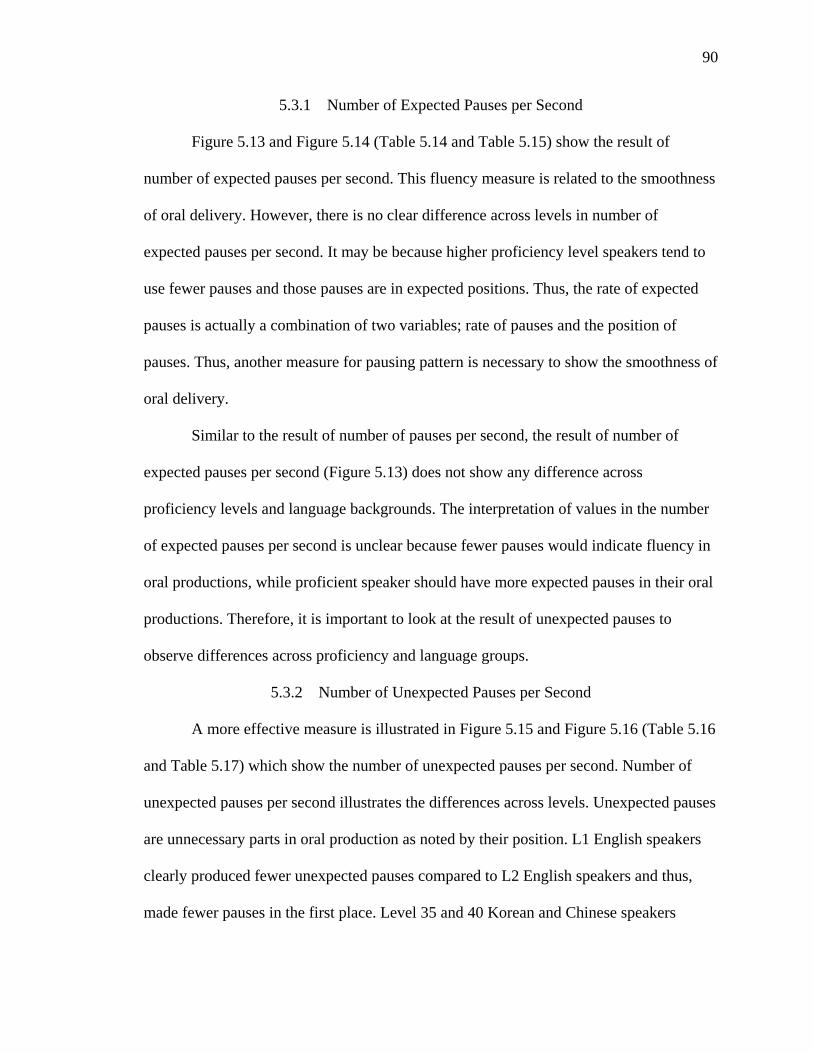
90
5.3.1 Number of Expected Pauses per Second
Figure 5.13 and Figure 5.14 (Table 5.14 and Table 5.15) show the result of
number of expected pauses per second. This fluency measure is related to the smoothness
of oral delivery. However, there is no clear difference across levels in number of
expected pauses per second. It may be because higher proficiency level speakers tend to
use fewer pauses and those pauses are in expected positions. Thus, the rate of expected
pauses is actually a combination of two variables; rate of pauses and the position of
pauses. Thus, another measure for pausing pattern is necessary to show the smoothness of
oral delivery.
Similar to the result of number of pauses per second, the result of number of
expected pauses per second (Figure 5.13) does not show any difference across
proficiency levels and language backgrounds. The interpretation of values in the number
of expected pauses per second is unclear because fewer pauses would indicate fluency in
oral productions, while proficient speaker should have more expected pauses in their oral
productions. Therefore, it is important to look at the result of unexpected pauses to
observe differences across proficiency and language groups.
5.3.2 Number of Unexpected Pauses per Second
A more effective measure is illustrated in Figure 5.15 and Figure 5.16 (Table 5.16
and Table 5.17) which show the number of unexpected pauses per second. Number of
unexpected pauses per second illustrates the differences across levels. Unexpected pauses
are unnecessary parts in oral production as noted by their position. L1 English speakers
clearly produced fewer unexpected pauses compared to L2 English speakers and thus,
made fewer pauses in the first place. Level 35 and 40 Korean and Chinese speakers
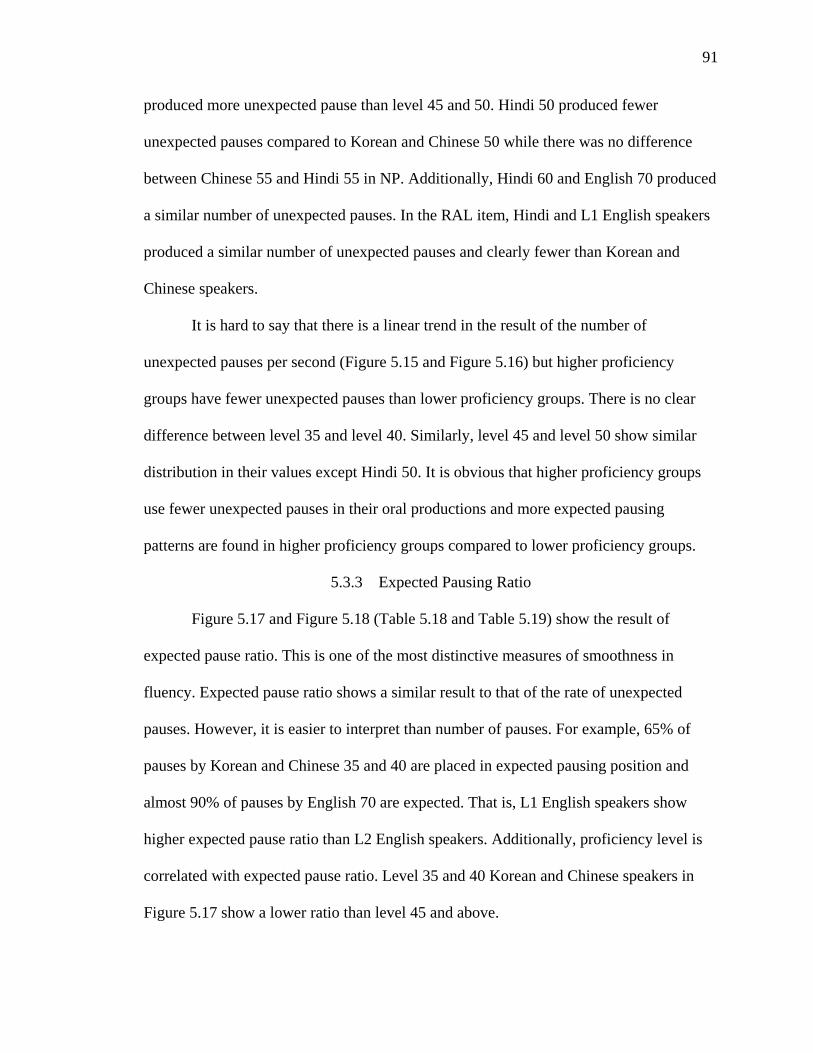
91
produced more unexpected pause than level 45 and 50. Hindi 50 produced fewer
unexpected pauses compared to Korean and Chinese 50 while there was no difference
between Chinese 55 and Hindi 55 in NP. Additionally, Hindi 60 and English 70 produced
a similar number of unexpected pauses. In the RAL item, Hindi and L1 English speakers
produced a similar number of unexpected pauses and clearly fewer than Korean and
Chinese speakers.
It is hard to say that there is a linear trend in the result of the number of
unexpected pauses per second (Figure 5.15 and Figure 5.16) but higher proficiency
groups have fewer unexpected pauses than lower proficiency groups. There is no clear
difference between level 35 and level 40. Similarly, level 45 and level 50 show similar
distribution in their values except Hindi 50. It is obvious that higher proficiency groups
use fewer unexpected pauses in their oral productions and more expected pausing
patterns are found in higher proficiency groups compared to lower proficiency groups.
5.3.3 Expected Pausing Ratio
Figure 5.17 and Figure 5.18 (Table 5.18 and Table 5.19) show the result of
expected pause ratio. This is one of the most distinctive measures of smoothness in
fluency. Expected pause ratio shows a similar result to that of the rate of unexpected
pauses. However, it is easier to interpret than number of pauses. For example, 65% of
pauses by Korean and Chinese 35 and 40 are placed in expected pausing position and
almost 90% of pauses by English 70 are expected. That is, L1 English speakers show
higher expected pause ratio than L2 English speakers. Additionally, proficiency level is
correlated with expected pause ratio. Level 35 and 40 Korean and Chinese speakers in
Figure 5.17 show a lower ratio than level 45 and above.
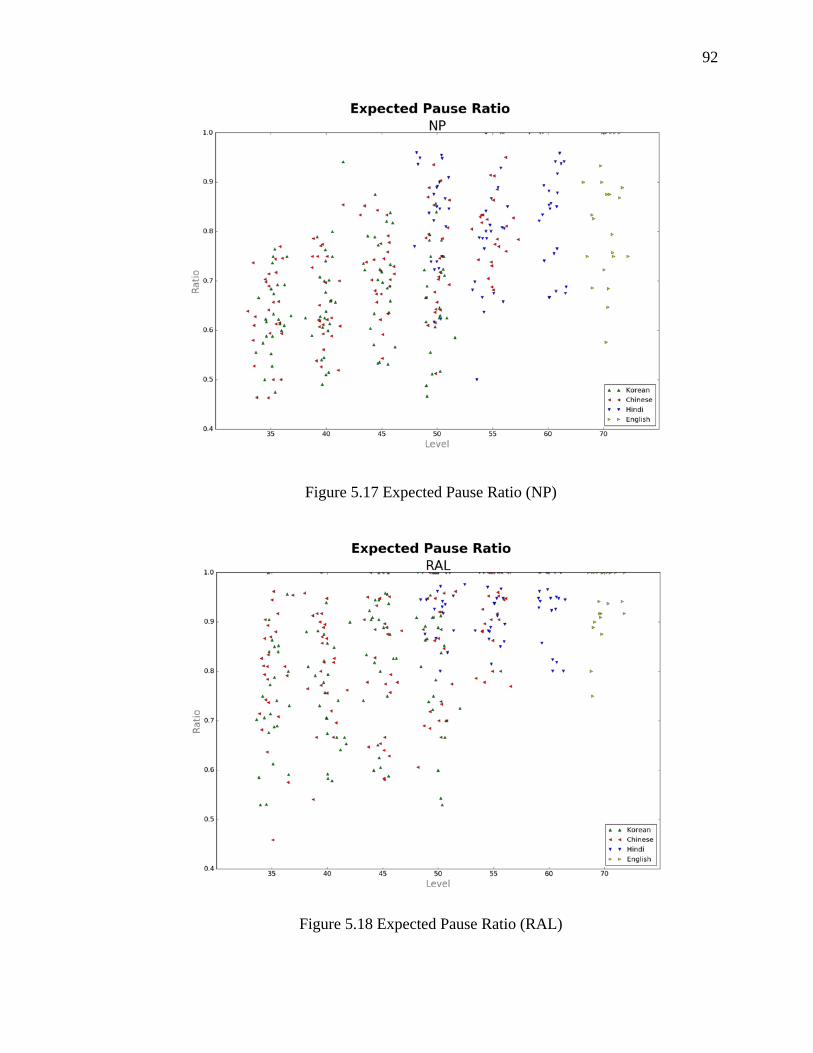
92
Figure 5.17 Expected Pause Ratio (NP)
Figure 5.18 Expected Pause Ratio (RAL)
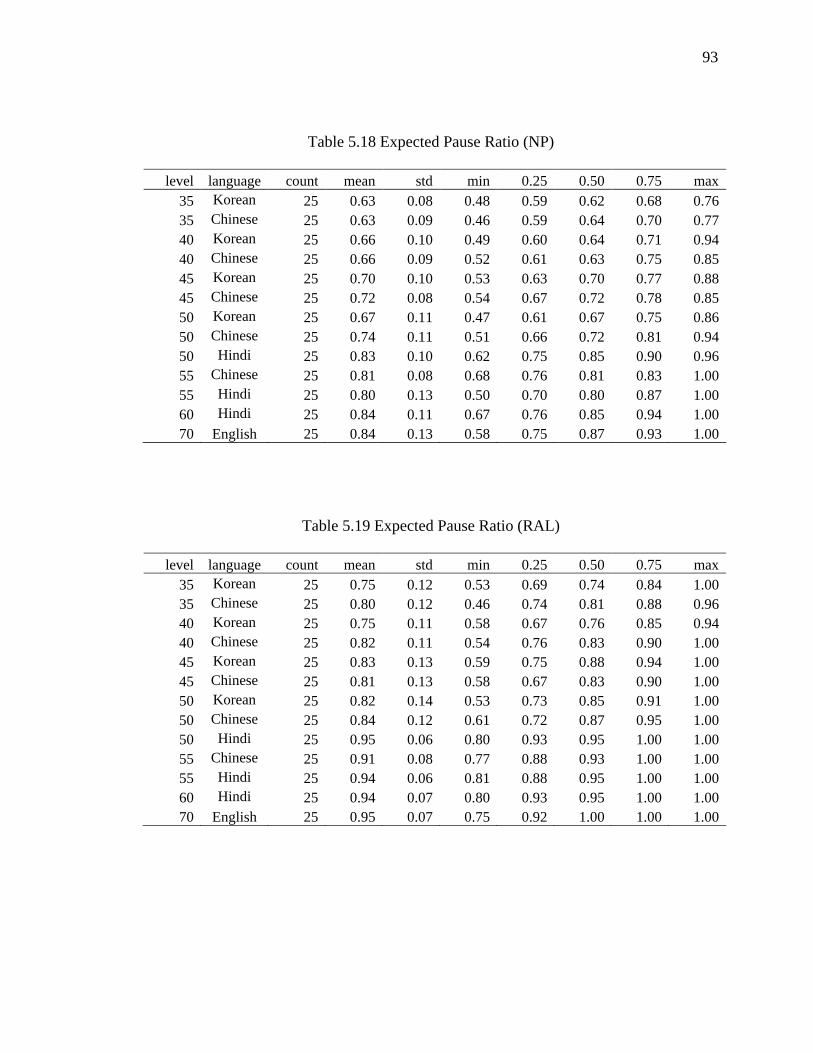
93
Table 5.18 Expected Pause Ratio (NP)
level language count mean std min 0.25 0.50 0.75 max 35 Korean 25 0.63 0.08 0.48 0.59 0.62 0.68 0.76 35 Chinese 25 0.63 0.09 0.46 0.59 0.64 0.70 0.77 40 Korean 25 0.66 0.10 0.49 0.60 0.64 0.71 0.94 40 Chinese 25 0.66 0.09 0.52 0.61 0.63 0.75 0.85 45 Korean 25 0.70 0.10 0.53 0.63 0.70 0.77 0.88 45 Chinese 25 0.72 0.08 0.54 0.67 0.72 0.78 0.85 50 Korean 25 0.67 0.11 0.47 0.61 0.67 0.75 0.86 50 Chinese 25 0.74 0.11 0.51 0.66 0.72 0.81 0.94 50 Hindi 25 0.83 0.10 0.62 0.75 0.85 0.90 0.96 55 Chinese 25 0.81 0.08 0.68 0.76 0.81 0.83 1.00 55 Hindi 25 0.80 0.13 0.50 0.70 0.80 0.87 1.00 60 Hindi 25 0.84 0.11 0.67 0.76 0.85 0.94 1.00 70 English 25 0.84 0.13 0.58 0.75 0.87 0.93 1.00
Table 5.19 Expected Pause Ratio (RAL)
level language count mean std min 0.25 0.50 0.75 max 35 Korean 25 0.75 0.12 0.53 0.69 0.74 0.84 1.00 35 Chinese 25 0.80 0.12 0.46 0.74 0.81 0.88 0.96 40 Korean 25 0.75 0.11 0.58 0.67 0.76 0.85 0.94 40 Chinese 25 0.82 0.11 0.54 0.76 0.83 0.90 1.00 45 Korean 25 0.83 0.13 0.59 0.75 0.88 0.94 1.00 45 Chinese 25 0.81 0.13 0.58 0.67 0.83 0.90 1.00 50 Korean 25 0.82 0.14 0.53 0.73 0.85 0.91 1.00 50 Chinese 25 0.84 0.12 0.61 0.72 0.87 0.95 1.00 50 Hindi 25 0.95 0.06 0.80 0.93 0.95 1.00 1.00 55 Chinese 25 0.91 0.08 0.77 0.88 0.93 1.00 1.00 55 Hindi 25 0.94 0.06 0.81 0.88 0.95 1.00 1.00 60 Hindi 25 0.94 0.07 0.80 0.93 0.95 1.00 1.00 70 English 25 0.95 0.07 0.75 0.92 1.00 1.00 1.00
94
There is no difference between Korean and Chinese 35 and 40 in pausing patterns
in NP. However, Korean speakers show lower rates than Chinese speakers which is
similar to speech rate. In lower levels like 35 and 40, Korean speakers produce not only
slower oral delivery than Chinese speakers but also put pauses in unexpected positions. In
higher levels like 45, 50, and 55, there is no difference between Korean and Chinese
speakers while Hindi speakers speak faster and follow expected pausing patterns.
The result of expected pausing ratio (Figure 5.17 and Figure 5.18) is similar to the
number of unexpected pauses per second. However, expected pausing ratio is easier to
compare across proficiency levels and language backgrounds because the values of
expected pausing ratio indicate the frequency of pauses placed in expected positions. For
example, lower proficiency groups such as level 35 and level 40 placed 60% of their
pauses in expected positions while higher proficiency groups placed 90% of their pauses
in expected positions. Only 10% of pauses produced by higher proficiency groups are
unexpected, while 40% of pauses were unexpected from lower proficiency groups. These
differences contribute to vastly different levels of smoothness in oral delivery.
5.4 Correlation of Variables
Figure 5.19 and Figure 5.20 (Table 5.20 and Table 5.21) show correlation scatter
plots of variables such as speech rate (SR), mean syllables per run (MSR), number of
pauses per second (PR), number of silent pauses per second (SPR), number of filled
pauses per second (FPR, number of expected pauses per second (ER), number of
unexpected pauses per second (UR), and expected pause ratio (EPR). Mean syllables per
runs is highly correlated to other variables because it contains the information of pauses.
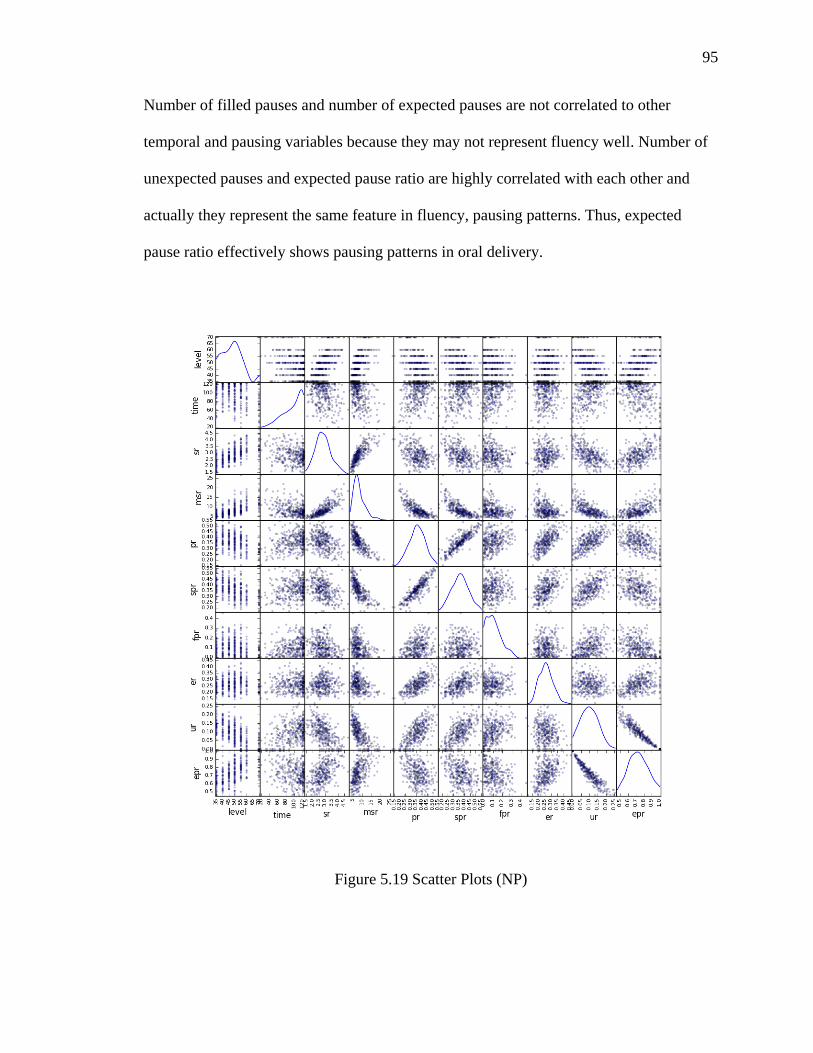
95
Number of filled pauses and number of expected pauses are not correlated to other
temporal and pausing variables because they may not represent fluency well. Number of
unexpected pauses and expected pause ratio are highly correlated with each other and
actually they represent the same feature in fluency, pausing patterns. Thus, expected
pause ratio effectively shows pausing patterns in oral delivery.
Figure 5.19 Scatter Plots (NP)
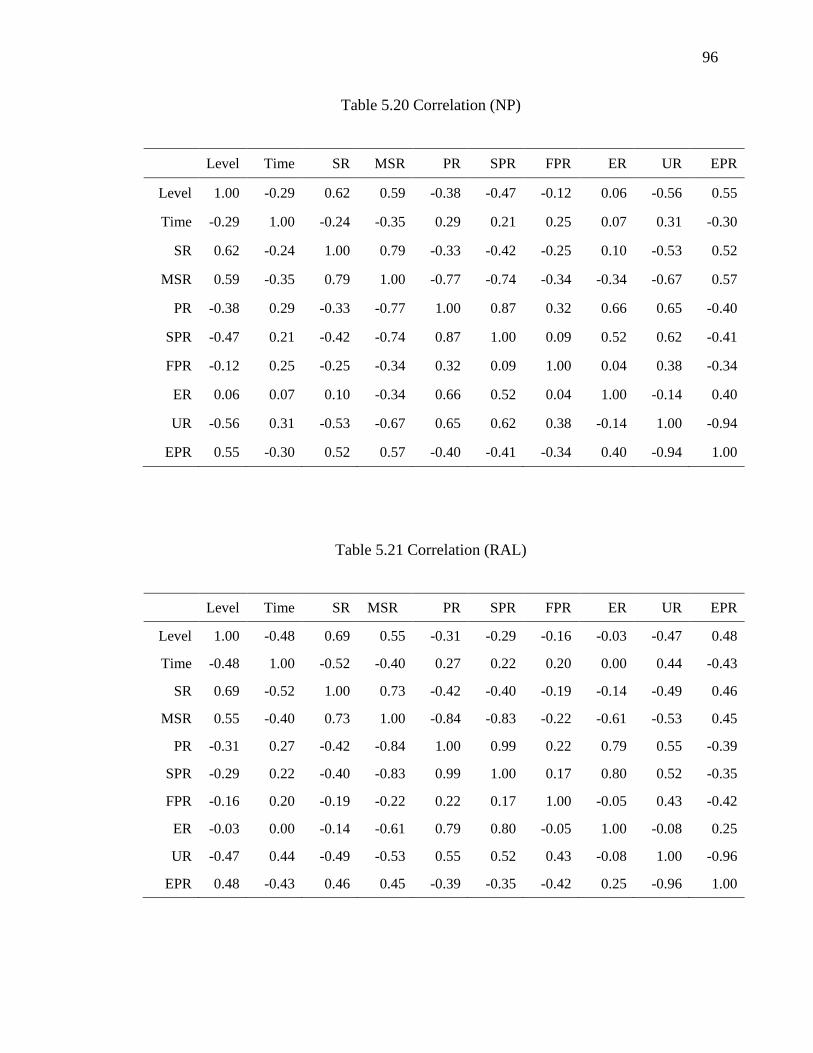
96
Table 5.20 Correlation (NP)
Level Time SR MSR PR SPR FPR ER UR EPR
Level 1.00 -0.29 0.62 0.59 -0.38 -0.47 -0.12 0.06 -0.56 0.55
Time -0.29 1.00 -0.24 -0.35 0.29 0.21 0.25 0.07 0.31 -0.30
SR 0.62 -0.24 1.00 0.79 -0.33 -0.42 -0.25 0.10 -0.53 0.52
MSR 0.59 -0.35 0.79 1.00 -0.77 -0.74 -0.34 -0.34 -0.67 0.57
PR -0.38 0.29 -0.33 -0.77 1.00 0.87 0.32 0.66 0.65 -0.40
SPR -0.47 0.21 -0.42 -0.74 0.87 1.00 0.09 0.52 0.62 -0.41
FPR -0.12 0.25 -0.25 -0.34 0.32 0.09 1.00 0.04 0.38 -0.34
ER 0.06 0.07 0.10 -0.34 0.66 0.52 0.04 1.00 -0.14 0.40
UR -0.56 0.31 -0.53 -0.67 0.65 0.62 0.38 -0.14 1.00 -0.94
EPR 0.55 -0.30 0.52 0.57 -0.40 -0.41 -0.34 0.40 -0.94 1.00
Table 5.21 Correlation (RAL)
Level Time SR MSR PR SPR FPR ER UR EPR
Level 1.00 -0.48 0.69 0.55 -0.31 -0.29 -0.16 -0.03 -0.47 0.48
Time -0.48 1.00 -0.52 -0.40 0.27 0.22 0.20 0.00 0.44 -0.43
SR 0.69 -0.52 1.00 0.73 -0.42 -0.40 -0.19 -0.14 -0.49 0.46
MSR 0.55 -0.40 0.73 1.00 -0.84 -0.83 -0.22 -0.61 -0.53 0.45
PR -0.31 0.27 -0.42 -0.84 1.00 0.99 0.22 0.79 0.55 -0.39
SPR -0.29 0.22 -0.40 -0.83 0.99 1.00 0.17 0.80 0.52 -0.35
FPR -0.16 0.20 -0.19 -0.22 0.22 0.17 1.00 -0.05 0.43 -0.42
ER -0.03 0.00 -0.14 -0.61 0.79 0.80 -0.05 1.00 -0.08 0.25
UR -0.47 0.44 -0.49 -0.53 0.55 0.52 0.43 -0.08 1.00 -0.96
EPR 0.48 -0.43 0.46 0.45 -0.39 -0.35 -0.42 0.25 -0.96 1.00
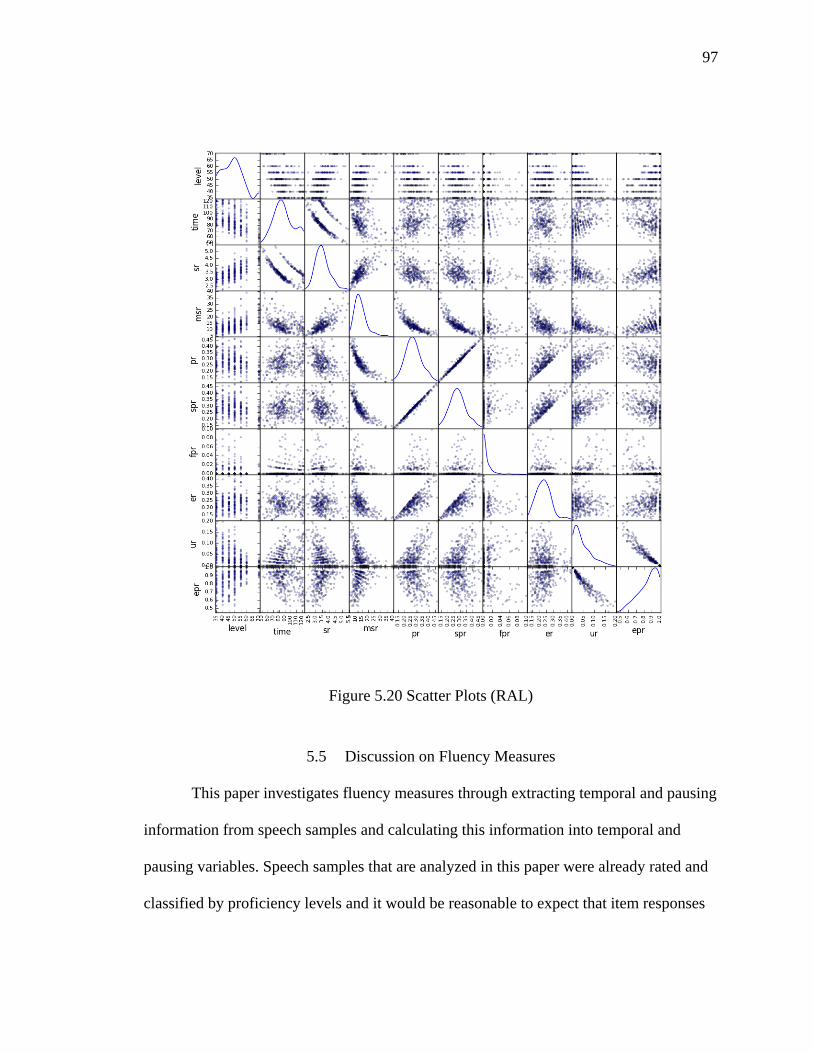
97
Figure 5.20 Scatter Plots (RAL)
5.5 Discussion on Fluency Measures
This paper investigates fluency measures through extracting temporal and pausing
information from speech samples and calculating this information into temporal and
pausing variables. Speech samples that are analyzed in this paper were already rated and
classified by proficiency levels and it would be reasonable to expect that item responses
98
from high proficiency levels would be more fluent than item responses from low
proficiency levels. As shown in the results, temporal variables such as speech rate and
mean syllable run showed linear trends across proficiency levels. Pausing patterns also,
even though not as clearly as temporal variables, show that there are some obvious trends
in pausing patterns in speech samples from high proficiency levels.
In addition, this paper analyzed s large data set to show quantified fluency values
in speech samples. Calculating fluency variables from temporal and pausing information
is made simpler through appropriate data analysis tool; however, transcribing speech
samples to extract temporal and pausing variables from speech samples is time and labor
intensive work that cannot be done easily. The methodology of analyzing speech samples
in measuring fluency includes transcribing oral productions, extracting fluency
information, and calculating fluency variables. This first step of analyzing speech
samples to get fluency information is important methodological aspect of this paper.
5.5.1 Methodology of Measuring Fluency
5.5.1.1 Fluency variables
Fluency is clearly an important component in oral proficiency and effectively
represents overall language proficiency. Previous research on fluency such as Kormos &
Denes (2004) and Ginther et al. (2010) measured fluency by calculating temporal
variables in speech samples. This paper extended the method of measuring fluency by
finding pausing patterns in addition to calculating temporal variables. This paper
categorized fluency variables into temporal and pausing variables. Temporal variables are
99
the measure of the speed of oral delivery and pausing variables are related to the
smoothness of oral delivery.
Measuring fluency can be done by calculating temporal and pausing variables. In
other words, calculated temporal and pausing variables are the measures of fluency that
can represent overall oral proficiency. Thus, it is important to select which temporal and
pausing variables to calculate for fluency measures. This paper selected speech rate and
mean syllable per run for temporal variables, as discussed in the methodology section of
this paper. For the pausing variables, this paper provided the normalized values of
number of various pauses such as silent, filled, expected, and unexpected pauses, as well
as expected pausing ratio. Those variables are highly correlated to each other. However,
expected pausing ratio is the one variable that represents smoothness of oral delivery.
Pausing variables are calculated by pausing patterns in speech samples and finding
pausing patterns is worth thorough discussion.
5.5.1.2 Pausing patterns: expected and unexpected pausing positions
Pauses basically comprise of silent and filled pauses. In addition, pauses can be
categorized by their length. For example, a pause of 0.5 second and a pause of 1 second
may have different characteristics in terms of hesitation phenomena. Longer pauses
indicate more serious hesitation that needs some redundant processing time in oral
production. This paper introduces another classification of pauses regarding pausing
placement in speech samples. In some cases, the use of pauses indicate lack of fluency
because pauses indeed reduce the speed of oral delivery. However, if pauses are placed in
100
expected pausing positions, those pauses do not reduce the smoothness of oral delivery
and may aid in interlocutor processing to compensate for a slower speed in oral delivery.
Pauses are, whether expected or unexpected, additional breaks between utterances
and do not need to be produced in the first place. With this perspective, expected pauses
are unexpected because pauses are a hesitation phenomenon and evidence of non-fluency.
The term ‘expected’ denotes that it would be effective if a pause is placed in the position,
but does not indicate that a pause should necessarily be put in that position. The
following examples are from the RAL scripts to show possible pausing placements.
(1) All parking on campus is regulated and available only for a fee.
(2) All parking (pause) on campus (pause) is regulated (pause) and available
(pause) only for a fee.
(3) All parking on campus (pause) is regulated and available only for a fee.
(4) All persons operating motor vehicles within the boundaries of the campus
shall observe and obey all applicable state laws and shall hold valid driver's
licenses.
(5) All persons operating motor vehicles within the boundaries of the campus
shall observe and obey all applicable state laws (pause) and shall hold valid
driver's licenses.
(6) All persons operating motor vehicles within the boundaries of the campus
shall observe (pause) and obey all applicable state laws (pause) and shall hold
valid driver's licenses.
101
(7) All persons operating motor vehicles within the (pause) boundaries of the
campus shall observe and obey all applicable (pause) state laws and shall hold
valid driver's licenses.
The sentence in (1) is short and there is no need to put a pause in the middle of the
sentence at all when producing it. Production of this sentence may contain pauses like (2)
where all pauses are placed in expected positions. It would sound very non-fluent if
someone actually produced sentence (2) because there are too many hesitations even
though they are placed in expected positions. On the contrary, the sentence production
like (3) with one pause in the middle of the sentence may sound much better than (2).
However, the pause in (3) is still redundant and somewhat reduces the fluency of speaker
who is producing the sentence. Sentence (4) is relatively long and may have pauses in the
middle of the sentence like (5) or (6), not like (7). The pauses in expected position like
(5) and (6) do not reduce the fluency of speaker greatly while the pauses in unexpected
positions like (7) may be strong evidence of lower proficiency.
More importantly, categorizing pausing positions only focuses on a target pause
in its place and surrounding words, and does not consider any of the next or previous
pauses and words or expressions.
(1) All parking on campus (pause) is regulated and available only for a fee.
(2) All parking (pause) on campus is regulated (pause) and available only for a
fee.
(3) All parking (pause) on campus (pause) is regulated (pause) and available
only for a fee.
102
(4) All persons operating motor vehicles (pause) within the boundaries of the
campus shall observe and obey all applicable state laws and (pause) shall
hold valid driver's licenses.
For example, the pause in (1) is placed after a subject noun phrase and before a
verb phrase and can be unarguably regarded as an expected pause. On the contrary, the
pauses in (2) are placed in not so expected positions because they are placed within a
subject clause and a verb clause while there is no pause between the subject and verb
clauses like (1). However, both of the pauses in (2) are categorized as expected pauses
even though there is no pause placed in the more expected position like (3). Considering
the pause position between the surrounding words, the pausing position follows the
convention of an expected pausing placement before a preposition phrase. The sentence
in (4) is relatively long and it sounds natural to put some pauses during the production of
sentence, and the pauses in (3) look better than pauses in (2).
We may categorize expected pausing positions into different categories such as
more expected and less expected positions. For example, placing a pause between
sentences is much more expected than other places such as phrase and clause boundaries.
Similarly, pausing before phrase boundaries would be more expected than pausing before
clause boundaries. However, pausing patterns are not always related to the syntactic
structure of utterances. Rather, pause placement, or hesitation may be related to various
factors in oral production such as prosody, style, and vocabulary use.
(1) Campus visitors must use metered parking areas or the visitor garage, or
must purchase a daily visitor permit (pause) from the visitor information
center.
103
(2) Campus visitors (pause) must use metered parking areas or the visitor
garage, or must purchase a daily visitor permit from the visitor information
center.
(3) Campus visitors must use metered parking areas or the visitor garage, or
must purchase a daily visitor permit from (pause) the visitor information
center.
(4) Campus visitors must (pause) use metered parking areas or the visitor
garage, or must purchase a daily visitor permit from the visitor information
center.
The pause in (1) is placed near at the end of sentence, and we cannot say that it
would be better to put a pause, for instance, at the comma because placing a pause in that
place is more expected. Similarly, the pause in (2) occurred rather early in the sentence
but we cannot say that it would be better to wait until the clause boundary. The
production of sentence (1) is better than (3) and the production of sentence in (2) is better
than (4), in terms of pause placement.
Pauses that occur before dysfluency phenomena such as repetition, self-repairs,
and false-starts are categorized as unexpected pauses because dysfluency markers are
unexpected in the first place. Dysfluency markers usually come with silent or filled
pauses because there usually is hesitation when making those errors, and such hesitations
are therefore unexpected. Sometimes there is no silent or filled pauses before or after
dysfluency markers and such occasion is not considered when counting expected and
unexpected pauses because it does not involve pause placement.
104
5.5.1.3 Transcribing tool
Temporal and pausing variables are calculated from several basic units in speech
samples such as total response time, number of syllables, number of pauses/runs, and
number of silent/expected/unexpected pauses. If there are transcribed speech samples
with time, syllable, and pause information, it is possible to extract temporal and pausing
information and calculate temporal and pausing variables to measure fluency. A
transcribed speech sample denotes that sound data is turned into text data that contains
annotated information including boundaries of pauses/runs and types of pauses.
Transcribing speech samples with temporal and pausing information is the first step of
measuring fluency.
The transcribing tool used in this paper is explained in detail in the methodology
section. The purpose of developing the computer-assisted annotation tool is mainly
establishing efficient procedures for the fluency research in this paper. The functions of
the tool are limited to annotating information of pauses and runs to count number of
syllables and pauses, and categorize types of pauses. The tool can also calculate fluency
variables such as speech rates, pausing rates, mean syllables per run, and expected
pausing ratio from fluency information.
Currently, the tool is only able to handle information of runs and pauses and
cannot process other information such as marking words or phonemes in speech samples.
However, analyzing those different types of linguistic features are not the main target of
this paper, and therefore the tool does not have functions to process such additional
linguistic information. Because the tool only has functions for fluency research in this
paper, there is no need for additional functions because analyzing speech samples using
105
the tool is focused on the target research. In other words, the design and implementation
of the tool is targeted at the steps in processing fluency variables (Figure 4.1) in this
paper. The limited functions of this tools is not a disadvantage when using the tool for
fluency research; actually the limitation is one of advantages because of its ease of use.
For additional fluency research with an extended list of fluency variables, it is
possible to add new features to the tool or expand its functions. For example, currently
the tool only separates oral productions into runs and pauses, but another tier can be
added to store additional fluency information such as boundaries of multi-word units.
Expanding the annotation tool can be done by updating the current codes or
implementing a new tool based on the design of current one.
The development of this annotation tool is one of main parts of this paper because
the tool essential in the methodology of fluency research. Data collection for fluency
research takes time, especially when the size of speech sample is large. Having a
transcribing tool targeted for specific analysis has a great advantage in reducing this.
5.5.2 Fluency Measures
Analyzing speech samples to calculate fluency variables allow us to see how
fluency measures represent overall oral proficiency. It is important to evaluate the results
of fluency variables as a whole to discuss the relationship between fluency measures and
proficiency levels. Fluency measures are categorized into the speed and smoothness of
oral delivery by the definition of fluency (Lennon 1990, 2000).
106
5.5.2.1 The speed of oral delivery
Temporal variables show an expected result. Higher proficiency groups speak
faster than lower proficiency groups. For example, English 70 is the fastest group while
Chinese 35 and Korean 35 have the slowest performances. This applies to other groups,
for instance, level 50 speak faster than level 45. However, there is no clear difference
between neighboring groups such as between level 35 and level 40, and between level 50
and level 55.
The old OEPT had four score levels of 30, 40, 50, and 60. The current version of
OEPT has six levels 35, 40, 45, 50, 55, and 60. For the old OEPT, level 30 and 40 were
regarded as an intermediate proficiency group and level 50 and 60 as a high proficiency
group. Actually test takers who scored 30 or 40 failed the test and had to take an oral
English course. For the new OEPT, level 35, 40, and 45 are an intermediate proficiency
group and level 50, 55, and 60 are a high proficiency group. Therefore, it may be possible
that differences in proficiency between score levels are narrowed in the new six level
rating system compared to the four level rating system, especially among the intermediate
levels of 35, 40, and 45, and among the higher levels of 50, 55, and 60.
Even though there is no clear difference between neighboring groups, the
difference between the intermediate proficiency groups and the higher proficiency groups
is obvious. For example, the values of temporal variables from level 35 and level 50 are
quite different. Proficiency level is not decided by only one factor such as fluency and
there are many other components in oral proficiency such as accuracy, vocabulary use,
and coherence. Even though two speech samples from level 35 and level 40 have the
107
same rate of fluency, another component such as accuracy likely made the difference
between the two groups.
Another noticeable result is that Hindi speakers generally speak faster than other
language groups and even some temporal variables of Hindi 60 are similar to English 70.
In other words, Hindi speakers with higher English proficiency spoke as fast as native
speakers of English. Hindi 50 spoke faster than Chinese 50 and Korean 50, and Hindi 55
spoke faster than Chinese 55. Korean speakers spoke slower than other language groups
especially in lower groups. Korean 35 and 40 show a slower speech rate compared to
Chinese 35 and 40. The results of differences between language groups imply that just
speaking faster does not necessarily improve overall oral proficiency.
Speech samples from the native speakers of English are included in analysis as
English 70 to compare L2 English speech samples with L1 English speech samples. It is
obvious that English 70 spoke faster than other proficiency groups. However, English 70
did not just speak as fast as they could when they produced their speech samples, and
there are some ranges of production values in terms of the speed of oral delivery. For
example, from Table 5.4 and Table 5.7, the average value of speech rate of English 70 is
around 3.5 syllables per second, and the average value of mean syllables per run is 12.5
syllables per run. Therefore, when L2 English speaker produce their speech samples close
to these values such as producing 12 syllables per run, it may be possible to say that they
say fluently as the native speaker of English in terms of the speed of oral delivery.
There are some ranges, or threshold values for the speed of oral delivery in oral
productions from high proficiency speakers, but speaking fast or slow within this range
rather depends on individual preferences. In other words, some L1 speakers speak slower
108
than L2 speakers but still fluent, and some lower proficiency level speakers speak fast
regardless of their overall proficiency; that is why the speed of oral delivery is not
enough to measure fluency and measuring the smoothness of oral delivery is another
important task.
5.5.2.2 The smoothness of oral delivery
This paper suggests that smoothness of oral delivery can be measured by
analyzing pausing patterns. Analysis of pausing patterns add an important level of
complexity to research on fluency and the use of temporal measures to represent fluency.
Differences across proficiency levels and language backgrounds indicate that pause
frequency is not a strong measure of fluency. However, the result of expected pausing
ratio shows that lower proficiency speakers frequently placed pauses in unexpected
places and possibly contribution to their lower holistic score. Higher proficiency
speakers’ pauses, on the other hand, are generally placed in expected positions. Even
though not every response from English 70 contains only expected pause placements, the
ideal value of expected pause ratio would be 1. In other words, high proficiency speakers
are expected put pauses only in expected positions.
Fluency may be the most important component in oral proficiency. However
fluent speech is not always proficient speech because other components in oral
proficiency such as accuracy, vocabulary use, and coherence also need to be considered.
Unlike temporal variables, pausing patterns depend on the content of speech. Pause
positions are closely related to neighboring words and expressions around pauses. For
example, if a pause is placed between a subject phrase and a verb phrase, the pause is
109
placed in an expected pausing place. However, whether placing a pause before a verb or
not has nothing to do with the actual meaning or the accurate use of the verb. The pauses
in the sentence (1) and (2) are still in an expected pausing place even though the
sentences are not grammatically accurate.
(1) *Faculty members (pause) receives inquiries from prospective students about
Purdue University.
(2) *All parking on campus (pause) are regulated and available only for a fee.
110
CHAPTER 6. CONCLUSION AND FUTURE RESEARCH
This paper investigates measuring fluency by analyzing pausing patterns as the
smoothness of oral delivery and temporal variables as the speed of oral delivery. Based
on the discussion of methodology in measuring fluency, large amounts of speech samples
from the OEPT were analyzed to observe fluency measures across different L2 English
proficiency levels and language backgrounds. A computer-assisted annotation tool was
developed for this study and the speech samples were transcribed and tagged by using the
annotation tool. The result of fluency variables shows that higher proficiency level
speakers have better performances in temporal measures of fluency than lower
proficiency level speakers, and placed pauses following expected pausing patterns.
Therefore, the differences across proficiency levels show that fluency can represent
overall oral proficiency well.
So far this paper has analyzed how to measure fluency that can represent overall
oral proficiency by measuring the speed and smoothness of oral delivery. However, we
can only say that fluent speakers produce their oral delivery fast and smooth, but it is not
clear to say ‘how fast’ and ‘how smooth’. Based on the result in this study, we may
suggest some ranges of fluency measures to define fluent oral delivery. For example, we
can say that producing 12 syllables per run with 0.8 expected pause ratio is fluent enough
for highly proficient L2 speakers.

111
However, we need more data samples and analysis to figure out what would be
the ideal values of fluency measures in terms of overall oral proficiency. This paper
analyzed relatively large number of speech samples across various proficiency levels and
language backgrounds, but it is not likely to say that all the subjects in these groups are
randomly chosen to generalize the results. For example, this study could not include
speech samples from Korean 60 and Chinese 60 simply because there were not enough
number of L2 English speakers with high proficiency among international students.
Therefore, it is important to gather more data to analyze fluency measures through the
methodology introduced in this paper to get more reliable results. Besides, the results in
this study show some implications that there are differences among language
backgrounds especially in low proficiency levels; further analysis with more reliable data
sets will show whether the language backgrounds of L2 English speakers indeed have a
significant role in their oral productions.
In addition to the results of basic statistic and scatter plots to see the overall
distributions of fluency variables, more analysis results from larger speech samples will
make it possible to do further statistical analysis to see the level of statistical significance
by hypothesis testing. Besides, this paper only analyzed the rates of production such as
speech rate and mean syllables per run, but it would be necessary to analyze the quantity
of production such as length of pauses and length of vocal productions to add more
reliable results in measuring fluency. The quantity of production can be extracted from
the transcribed data using the annotation tool in this study. Transcribing speech samples
begins with finding the boundaries of pauses and runs (i.e., the beginning and end of
pauses and runs), and the length between boundaries are the quantities of production.
112
The data set in this study are composed of different oral proficiency levels and we
can compare the results across levels to see different characteristics in fluency. The
speech samples were collected from various L2 English speakers and we may predict that
the oral proficiency of low level speakers would be improved and have the characteristics
of high proficiency level speakers. For example, low level speakers will achieve high
proficiency level by speaking more fluently, producing oral delivery faster and smoother.
However, the results in this paper show that there were high proficiency level speakers
with low fluency values. In other words, some test takers in OEPT were rated as high
proficiency levels (e.g., level 60 and 70) even though they responded with not so fast and
smooth oral productions. Or it would be possible that some high proficiency level
speakers spoke relatively slow but rather smooth to compensate their fluency. Thus, we
need to analyze individual differences among different components in fluency to see
which fluency variables affects more on overall oral proficiency.
The data sets for this study are already categorized by OEPT ratings in the ranges
from 35 to 60. The purpose of this study is not extended to see if the rating system of
OEPT is good enough to classify test takers by their respective oral proficiency. The
results show that there must be a clear difference between, for instance, level 35 and level
50 because their proficiency levels are far enough to have distinct fluency values.
However, sometimes it is not clear whether the fluency values of adjacent levels clearly
differ from each other, especially between level 35 and 40, and level 40 and 45. Those
lower levels were incorporated into two groups of 30 and 40 in the old OEPT; the current
OEPT separated them into three levels rather than two levels. In the next version of
OEPT, those proficiency levels may be set differently, either separated into two levels or
113
three levels. Different values in fluency measures may separate proficiency levels, and
the further analysis of fluency measures would support a new and better rating system for
the new OEPT.
A longitudinal study can be conducted to see improvements over time in fluency.
For example, students in an ESL (English as a Second Language) course, who took
OEPT at the beginning of semester, may take the OEPT again at the end of semester to
show their improvement. The OEPT rating would be changed for the students who have
practiced English throughout the course, and fluency measures from their OEPT
responses would show different results how the speed and smoothness of oral delivery
are changed over time. The longitudinal analysis of fluency measures can give an idea to
pedagogical considerations in ESL courses such as practicing speed and smoothness in
oral production to improve overall oral proficiency. For example, not only speaking fast
helps improving oral proficiency but speaking smoothly by placing pauses in expected
positions is also important in effective oral production.
Measuring fluency is the first step of measuring oral proficiency, and selecting
other components in oral proficiency to quantify and measure is possible as well.
Measuring vocabulary use is possible by using transcriptions of oral productions from
analyzing the speech samples to calculate fluency variables. For example, vocabulary use
can be measured by lexical diversity in oral delivery, and the basic measurement of
lexical diversity is the total number of words used in oral delivery (i.e., tokens) and the
number of different words in oral delivery (i.e., types). Measuring accuracy in oral
delivery is possible by providing a list of accurate language use and counting the number
114
of inaccurate language use in oral production such as counting grammatical errors, as
well as errors in pronunciation and intonation.
Furthermore, it is possible to conduct an experiment for measuring fluency
variables to predict fluency levels of L2 English speakers. In addition, establishing
methodology to measure each component in oral proficiency will make it possible to
measure oral proficiency as a whole and eventually evaluation of oral proficiency in L2
speech samples may be automatic.

115
REFERENCES
115
REFERENCES
Beattie, G. & Butterworth, B. (1979). Contextual probability and word frequency as
determinations of pauses and errors in spontaneous speech. Language and speech,
22, 201-211.
Beckman. M. E. (1996). The parsing of prosody. Language and cognitive processes, 11,
17-67.
Blake, C. G. (2009). The potential of text-based internet chats for improving ESL oral
proficiency. The modern language journal, 93, ii, 227-240.
Boomer, D. S. (1965). Hesitation and grammatical encoding, Language and speech, 8,
148-158.
Butterworth, B. (1975). Hesitation and semantic planning in speech. Journal of
psycholinguistic research, 4(1), 75-87.
Canale, M. & Swain, M. (1980). Theoretical bases of communicative approaches to
second language teaching and testing. Applied Linguistics, 1, 1-47.
Chambers, F. (1997). What do we mean by fluency? System, 25, 535-544.
Chomsky, N. (1965). Aspect of theory of syntax. Cambridge, MA: MIT Press.
Clark, H. H. & Fox Tree, J. E. (2002). Using uh and um in spontaneous speaking.
Cognition, 84, 73-111.
116
Council of Europe. (2001). Common European Framework of Reference for Languages:
Learning, teaching, assessment. Cambridge: Cambridge University Press.
Cucchiarini, C., Strik, H., & Boves, L. (2002). Quantitative assessment of second
language learners’ fluency: comparison between read and spontaneous speech.
Journal of the acoustical society of America, 107(2), 989-999.
De Jong, N., & Wempe, T. (2009). Praat script to detect syllable nuclei and measure
speech rate automatically. Behavior Research Methods, 41, 385-390.
ETS. (2008). TOEFL iBT Test Integrated Speaking Rubrics (Scoring Standards).
Retrieved from http://www.ets.org/toefl/institutions/scores/interpret/
Ferreira, F. (1993). Creation of prosody during sentence production. Psychological
review, 100(2), 233-253.
Fillmore, C. J. (1979). On fluency. In D. Kempler & W.S.Y. Wang (Eds.), Individual
differences in language ability and language behavior (pp. 85–102). New York:
Academic Press.
Fordor, J. D. (2002). Psycholinguistics cannot escape prosody. Proceedings of speech
prosody 2002, 83-90.
Fulcher, G. (1996). Does thick description lead to smart tests? A data-based approach to
rating scale construction. Language Testing, 13(2), 208-238.
Ginther, A. (2003). International teaching assistant testing: policies and methods. In D.
Douglas (Ed.), English language testing in U.S. colleges and universities (pp. 57-
84). Washington D.C.: NAFSA: Association of International Educators.
117
Ginther, A., Dimova, S., & Yang, R. (2010). Conceptual and empirical relationship
between temporal measures of fluency and oral English proficiency with
implications for automated scoring. Language Testing, 27, 379-399.
Goldman-Eisler, F. (1958). Speech production and the predictability of words in context.
Quarterly journal of experimental psychology, 10, 96-106.
Goldman-Eisler, F. (1968). Psycholinguistics: experiments in spontaneous speech.
London: Academic Press.
Harley, T. A. (2008). The psychology of language: from data to theory. Psychology
press.
Hasselgreen, A. (2004). Testing the spoken English of young Norwegians: a study of test
validity and the rold of ‘smallwords’ in contributing to pupils’ fluency.
Cambridge University Press.
Hawkins, P. R. (1971). The syntactic location of hesitation pauses. Language and speech,
14, 277-288.
Houghton Mifflin Harcourt. (2012). The American heritage dictionary, fifth edition. New
York: Dell.
Huber, J. E., Darling, M., Franscis, E. J., & Zhang, D. (2012). Impact of typical aging and
Parkinson’s disease on the relationship among breath pausing, syntax, and
punctuation. Am J Speech Lang Pathol 2012;21. 368-379.
Koponen, M., & Riggenbach, H. (2000). Overview: varying perspectives on fluency. In
H. Riggenbach (Ed.), Perspectives on fluency (pp. 5-24). Ann Arbor: The
University of Michigan Press.
118
Kormos, J., & Denes, M. (2004). Exploring measures and perceptions of fluency in the
speech of second language learners. System, 32, 145-164.
Lennon, P. (1990). Investigating fluency in EFL: a quantitative approach. Language
Learning, 40, 387-417.
Lennon, P. (2000). The lexical element in spoken second language fluency. In H.
Riggenbach (Ed.), Perspectives on fluency (pp. 25-42). University of Michigan
Press.
Levelt, W. J. M. (1989). Speaking: From Intention to Articulation. MA: MIT Press.
Levelt, W. J. M. (1999). A blueprint of the speaker. In C. Brown & P. Hagoort (Eds.),
The neurocognition of language (pp. 84-122). Oxford Press.
Malvern, D. & Richards, B. (1997). A new measure of lexical diversity. In A. Ryan & A.
Wray (Eds.), Evolving models of language (pp. 58-71). Multilingual matters.
Möhle, D. (1984). A comparison of the second language speech production of different
native speakers. In H.W. Dechert, D. Möhle, & M. Raupach, (Eds.), Second
language production. (pp. 26–49). Tübingen: Günter Narr.
Oller, J. W. Jr. (1983). Evidence for a general language proficiency factor: an expectancy
grammar. In J. W. Oller Jr. (Ed.), Issues in language testing research (pp. 3-10).
Rowley, MA: Newbury House.
Pawley, A. & Syder, F. H. (1983). Two puzzles for linguistic theory: native like selection
and native like fluency. In J. C. Richards & R. W. Schmidt, (Eds.), Language and
communication, (pp. 191-226). New York: Longman.
Petrie, H. (1987). The psycholinguistics of speaking. New horizons in linguistics, 2, 336-
366.
119
Price, P. J., Ostendorf, M., Shattuck-Hufnagel, S., & Fong, C. (1991). The use of prosody
in syntactic disambiguation. Acoustical society of America, 90(6), 2956-2970.
Riggenbach, H. (1991). Towards an understanding of fluency: a microanalysis of
nonnative speaker conversation. Discourse Processes, 14, 423–441.
Shohamy, E. (1994). The Validity of Direct versus Semi-Direct Oral Tests. Language
Testing, 11, 99-123.
Stanfield, C. W., & Kenyou, D. M. (1992). Research on the comparability of the Oral
Proficiency Interview and the Simulated Oral Proficiency Interview. System, 20,
347-364.
Steinhauser, K. (2002). Electrophysiological correlates of prosody and punctuation. Brain
and language, 86, 142-164.
Tavakoli, P. (2010). Pausing patterns: differences between L2 learners and native
speakers. ELT journal, 65(1), 71-79.
Towell, R., Hawkins, R., & Bazergui, N. (1996). The development of fluency in
advanced learners of French. Applied Linguistics, 17, 84–119.
Warren, P. (1996). Prosody and parsing: an introduction. Language and cognitive
processes, 11(1/2), 1-16.
Wood, D. (2004). An empirical investigation into the facilitating role of automatized
lexical phrases in second language fluency development. Journal of language and
learning, 2(1), 27-50.

13
VITA
120
VITA
Education
Purdue University West Lafayette, Indiana
Ph.D, Linguistics May 2016
Dissertation: Measuring Fluency - Temporal Variables and Pausing Patterns in L2
English Speech
Advisor: Dr. April Ginther
Sogang University Seoul, Korea
M.E. Computer Science February 2001
Sogang University Seoul, Korea
B.S. Computer Science February 1999
B.S. Korean Language and Literature February 1997
Research Interest & Skills
Research interest
Applied Linguistics, Second language acquisition, Language testing, Computer assisted
language learning & testing, Quantitative methodology in linguistic research, Fluency
Skills
Quantitative analysis of language data
Web (HTML5) programming
Python programming
121
Work Experience
NLP Laboratory, DaumSoft; Researcher January 2001 – September 2004
Developed and modified the machine readable dictionaries (MRD) for NLP (Natural
Language Processing) engines
Designed and constructed a word sense classification system in Korean
Made a proposal of the project for Korean culture & contents agency
Participated in the ISP (Information Strategy Planning) of the integrated government
portal system project
Research Experience
Research Assistant August 2006 – May 2016
Researched and developed language learning tools at TELL (Technology Enhanced
Language Leaning)
Participated in developing Speak Everywhere, a computer-assisted language learning and
testing tool for foreign language classrooms (http://speak-everywhere.com)
Developed a web-based version of Speak Everywhere
Developed a mobile version of Speak Everywhere
Managed Speak Everywhere for foreign language courses
Developed course materials using Speak Everywhere for foreign language courses
Developed an associative vocabulary learning tool (web-based application)
Developed the interface of foreign language placement examination at SLC (School of
Language and Culture)
Research Assistant August 2006 – May 2007
Analyzed speech samples from OEPT (Oral English Proficiency Test) using Praat for the
fluency project in OEPP (Oral English Proficiency Program)
Research Assistant May 2007 – August 2007
Participated in the OEPT2 project
Developed transcribing manual using Praat for OEPP
122
Research Assistant December 2011 – January 2012
Participated in the survey project in OEPP: A comparative investigation into
understanding and uses of English language proficiency scores in the U.S. and Australia
Presentation
Automatic measurement of temporal variables in Oral English Proficiency Test.
Presented at the Purdue Linguistics Association symposium 2009
Temporal measures of fluency: automatic and manual extraction of temporal
variables. Presented at the 11th annual meeting of Midwest Association of Language
Testers (MwALT 2009)
Oral Proficiency and Vocabulary Use in L2 English Speech. Presented at the 12th
annual meeting of Midwest Association of Language Testers (MwALT 2010)
Oral proficiency and pausing pattern in English L2 speech. Presented at the Purdue
Linguistics Association symposium 2011
Temporal Measures of Fluency as Explications of Holistic Scores on a Semi-Direct
Exam of Oral English Proficiency. Presented at Georgetown University Round Table
on Languages and Linguistics 2012 (GURT 2012)
Measuring fluency: temporal variables and pausing patterns in L2 English speech.
Presented at the 1st Purdue Language and Culture Conference (PLCC 2016)
References
Dr. April Ginther, Professor of English, director of OEPP, [email protected]
Dr. Atsushi Fukada, Professor of SLC, director of TELL, [email protected]