Varuna Uranus Stimulation Initiation Evolution Liberation Emanation Kundalini Yoga

1
MEASURING RADON, THORON AND ACTINON EMANATION FROM CONCRETE AND GRANITE WITH CONTINUOUS RADON MONITORS AND E-PERM’s®
Bill Brodhead
WPB Enterprises, Inc., 2844 Slifer Valley Rd., Riegelsville, PA USA [email protected] www.wpb-radon.com
Abstract The author investigated the use of commercially available continuous radon monitors (CRM’s) and S-Chamber E-PERM’s® using short term electrets to measure the 222 radon and 220 thoron emanation from concrete and granite counter tops. The performance of CRM’s and E-PERM’s® placed in 3 to 23 liters metal accumulator chambers sealed to a building material were compared to the total emanation rate of the building material when the material was placed in a sealed 122 liter chamber. Concrete slabs were constructed that had radon only versus 222 radon and 220 thoron and 219 action to determine the test equipment response to these isotopes. A thoron chamber was constructed to test the detectors response to thoron and the reduction in response to thoron when the detectors were placed in diffusion barriers. Accumulator and sealed chamber tests on three different granites found significant variation in emanation rates depending on what side of the granite was tested. Elevated Indoor Radon Levels due to Building Materials The author investigated a 200 unit seven story tall condominium unit that had elevated radon levels in the hallway and individual units on every floor. This building had two levels of ventilated parking garage under most of the building that precluded ground base soil gas as the source. The building was constructed with post stressed concrete floors and ceilings and concrete support columns. All other walls except those adjacent to stairwells were metal stud and drywall construction. Ventilation measurements indicated the units were typically getting less than 0.1 air changes per hour (ACH). A simple method was used to measure the concrete emanation rate by placing single EPERM’s® inside 3 liter stainless mixing bowls that were sealed against exposed concrete floors, ceilings and walls. The total ingrowth inside the bowl was determined by doubling the E-PERM® average after first subtracting the back ground radon when the unit was first sealed. This total ingrowth is then divided by the hours of exposure and multiplied times the volume of the accumulator and divided by the square feet of exposed concrete to obtain the emanation rate of the concrete. The exposures were approximately 24 hours long to minimize the effect of ingrowth decay. These emanation measurements made on every floor of the condominium indicated that the concrete along with the low ventilation rate was the likely source of the elevated radon. The research presented in this paper was conducted to determine if an accumulator method using continuous radon monitors (CRM’s) or E-

2
PERM’s® with ingrowth correction factors would provide a simple method with reasonable accuracy to determine the emanation rate of any building material. Testing Equipment Set Up The author has two AB5 Pylons® with passive radon detector heads (PRD) and a RAD7® radon monitor. These units were cross compared with two similar AB5 Pylons with newer CPRD heads supplied by Pennsylvania DEP Radon Division. In addition the following CRM’s were generously loaned from the manufacturer/suppliers; two Femto-Tech 510’s®, Sun Nuclear 1029®, Rad Elec Scout®, RadonAway RS500® , RadonAway RS800® and the RTCA On Guard. Metal test chambers were constructed varying in size from 38 liters to 129 liter size by using commercially available metal trash cans with removable lids. Each of the cans had all interior seems sealed with urethane caulking and then covered with 17 mil aluminum tape. A power cord was installed in each chamber with the cord penetration carefully sealed in a similar manner. Sampling ports were installed in each of the chambers by mechanically attaching 3/8” ball valves through the side of each chamber and carefully sealing the penetration. See picture in Figure 10. The removable lid for each chamber had pliable plumbers putty placed around the edge. A ball valve would be left open and the lid pressed down on the chamber, compressing the putty and forming an air tight chamber when the ball valve was closed. The tightness of the chamber was tested by flowing radon into a chamber with two CRMs and then closing all the valves to allow the radon to decay. The radon decayed with a normal radon decay rate indicating that there was no radon leakage out of the chamber. See the decay rate chart below in Figure 1.
0
50
100
150
200
250
300
350
1 5 9 13 17 21 25 29 33 37 41 45 49 53 57
Mathematical decay
Pylon 352
Pylon 269
114 Liter Chamber Decay Test
Hours
pCi/L
Two AB5 Pylons
Straight line is Mathematical Decay
13 kBq/m3
Figure 1 Chamber Tightness test

3
The author has several radon, thoron and actinon sources that were used to test the performance of the different CRM’s and E-PERMs®. One of the sources is soil. During an investigation of a home in need of a radon mitigation system a suction point was located where a 300 uR/hr gamma reading was obtained at the slab. The soil excavated from this home produces 0.75 pCi/oz/minute (1.6 Bq/gm/hour). This soil was dried and placed in three 6” by 60” long metal ducts that were carefully sealed and constructed with sampling ports on either end. Initial sniff measurements made of the soil indicated it had a low 220thoron content. Some of this soil was mixed into a concrete test slab to increase it’s emanation rate. A more careful grab sample of the soil source was then made with a Pylon AB5® and scintillation cell with the counter set to 20 second count interval. The tubing length from the soil source to the cell was less than a foot long and the air flow was set at 4 lpm flow with a 0.8 u filter. See the graph in Figure 2 below. The last 20 second cell count while sampling was 661 counts. As soon as the pump was turned off the next 20 second count fell to 328. The next 20 second count dropped to 117. The counts then fell off more gradually, dropping to 91 and then a minute latter to 70 and then a minute or two later to around 55. The sample was aged and counted latter indicating about 140 pCi/l (5,180 Bq/m3) of 222 radon at 4 lpm flow rate. This extreme drop in counts indicates the soil is producing significantly more 219 actinon which has a 4 second half life than 222 radon. The decay also indicates there is some 220 thoron in the soil but it is difficult to measure because of the very high level of actinon in the soil.
0
100
200
300
400
500
600
700
800
1 3 5 7 9 11 13 15 17 19 21 23 25 27 29 31 33 35 37 39 41 43
Soil Source sampled with scintilation cell20 second count intervalPylon Counts
Pump on
Pump off Note: cell inlet includes0.8 u filter
Radon levels approxiamately 140 pCi/L
Actinon gone Remaining Thoron decay
4 liter per minute flow
20 second intervals
1 min intervals
Figure 2 Soil Source Checked for Thoron & Actinon

4
Once it was determined that there was significant thoron and actinon being produced by the soil source, a 75 liter decay chamber was constructed that delayed the airflow into the final test chamber by 15 minutes (75 liters / 5 lpm flow) to ensure that both thoron and actinon were decayed out. A 47 millimeter 1 u filter was installed inline before the final test chamber to collect most decay products produced by the actinon, thoron or radon. 1 to 5 lpm of air was pushed through the soil sources using a small aquarium pump. Dwyer flow gauges were installed before and after the test chamber to monitor the flow rate and ensure there was no leakage out of the chamber. The chamber exhaust air is vented to the outside. A typical flow through chamber set up is illustrated in Figure 3 below. Note that the test chamber had internal power outlets and a small mixing fan to create uniform levels inside the chamber.
Ingrowth Comparison The CRM’s and E-PERM’s response to ingrowth of radon was tested by sealing the detectors in a 122 liter chamber with a small radium source placed at the inlet to the interior mixing fan. The volume of the fans, CRM’s and chargers placed in the chamber was subtracted from the empty chamber volume. The CRM volume was determined by measuring the components of each unit rather than the outside dimensions to factor in the free air area inside the CRM’s. Figure 4 below
Figure 3 Soil Source Test Chamber

5
gives the volume size used for each CRM. The source of the radon is an antique toy that was manufactured in the 1920’s by the same company in Pittsburgh that produced the gram of radium that was gifted to Marie Curie. The source produces no measurable 220 thoron. The radon levels would then ingrow depending upon the open volume of the chamber and the length of time the chamber was left sealed.
RS 800 Scout EPerms SN 1029 0.76 liters 0.56 liters 0.123 liters 0.66 liters
Pylon AB5 PRD RS 500 Femto 510 RTCA OnGuard
2.5 liters 0.70 liters 0.61 liters 0.81 liters The results of an ingrowth test using the RAD7 to determine the actual ingrowth indicated that the other CRM units had a delayed response to the ingrowth that reduced their calculated ingrowth. A second test was performed using a dozen Pylon scintillation cells that were first measured for background count and then filled with a known radon concentration and then counted at least four hours later in order to calibrate their individual efficiency. The two Pylon AB5’s and other CRM’s were then placed in a sealed chamber with 109 liters of free air and a radium source.
0102030405060708090100110120130140150160170
1 3 5 7 9 11 13 15 17 19 21 23 25 27 29 31 33 35
Pylon 269Pylon 352Pylon math ingrowthGrab sampleGrab math ingrowth
Radium ingrowth into109 liter chamber
Pylon Ingrowth440 pCi/hr
16,280 Bq/hr
Grab sample Ingrowth510 pCi/hr
18,870 Bq/hr
Grab Sample Ingrowth 16% greater than Pylon
Hours
pCi/l
13 Grab Samples
Pylon 269 & 352
6.3 kB/m3
Figure 5 CRM In-growth versus Grab sample measurements
Figure 4 CRM In-growth versus Grab sample measurements

6
There were five small mixing fans inside the chamber during the 36 hour exposure. Single grab samples using the calibrated scintillation cells were taken every 2 to 4 hours during the exposure. The plotted ingrowth and the mathematical calculated ingrowth is shown in Figure 5 above along with the Pylon response and it’s mathematical ingrowth line. Note that the grab sample ingrowth of 510 pCi/hr (18,870 Bq/hr) is 16% greater ingrowth than the Pylon ingrowth of 440 pCi/hr (16,280 Bq/hr). This difference is most likely due to the delay in response to changing radon levels that each CRM experiences. The table in Figure 6 below gives the average amount of additional ingrowth each CRM would require to match the RAD7 and grab sample results. The RadonAway RS800 and FemtoTech data is based only on the RAD7 data because of monitor results during the grab samples were significantly off.
Unit Pylon RTCA Scout SN1029 RS500 RS800 F-510 Correction % +15% +14% +9% +9% +6% +1% +10%
Although Figure 7 is a crowded graph some general CRM performance differences can be seen that repeated in other similar exposures. In general the Pylon AB5 and the RAD7 produced the smoothest line that makes determining ingrowth rate more accurate. The RadonAway RS800 had the next smoothest ingrowth line although the unit tended to under report the radon level increase
0
20
40
60
80
100
120
140
160
1 2 3 4 5 6 7 8 9 10 11 12 13 14 15 16 17 18 19 20 21 22 23 24 25 26 27 28 29 30 31
Rad7
Femto 510
SN1029
RS800
RS500
Scout
Pylon
CRM's inside 114 LiterSealed Chamber
with Radium Source
Rad7
Scout
SN1029
RS800
Femto 510
RS500
pCi/l
Hours
Pylon
6 kBq/m3
Figure 7 CRM In-growth Performance
Figure 6 Correction factor for CRM in-growth delay
7
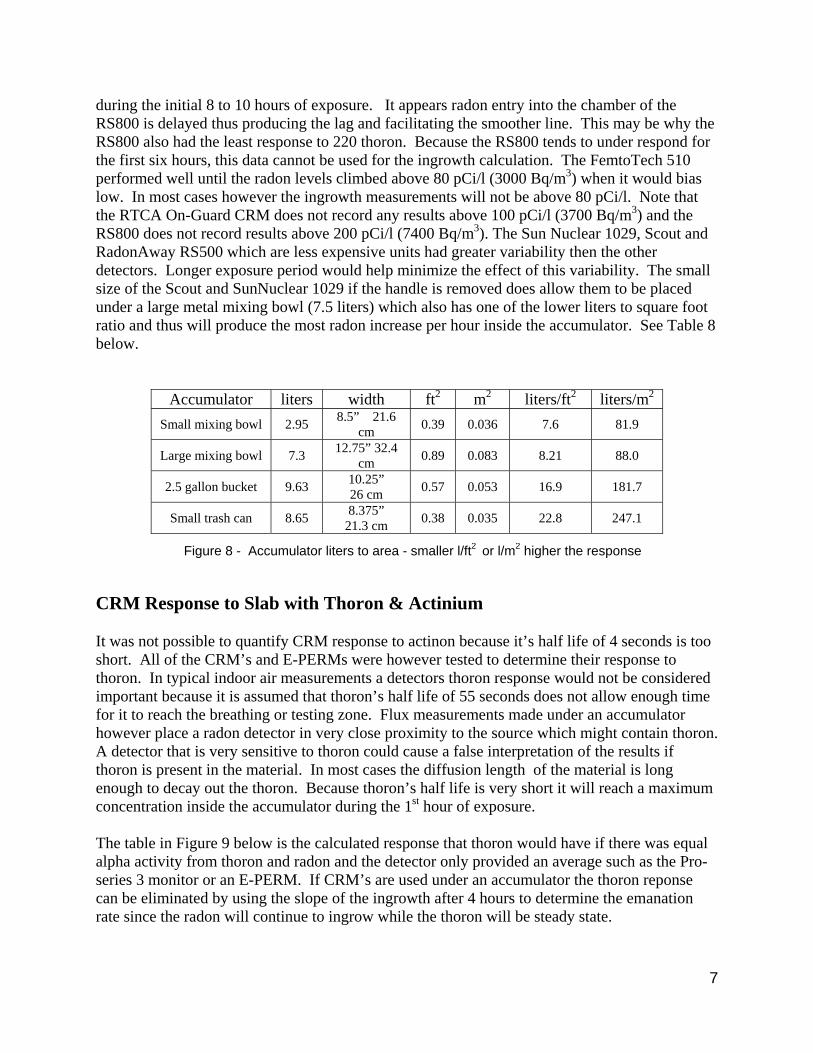
during the initial 8 to 10 hours of exposure. It appears radon entry into the chamber of the RS800 is delayed thus producing the lag and facilitating the smoother line. This may be why the RS800 also had the least response to 220 thoron. Because the RS800 tends to under respond for the first six hours, this data cannot be used for the ingrowth calculation. The FemtoTech 510 performed well until the radon levels climbed above 80 pCi/l (3000 Bq/m3) when it would bias low. In most cases however the ingrowth measurements will not be above 80 pCi/l. Note that the RTCA On-Guard CRM does not record any results above 100 pCi/l (3700 Bq/m3) and the RS800 does not record results above 200 pCi/l (7400 Bq/m3). The Sun Nuclear 1029, Scout and RadonAway RS500 which are less expensive units had greater variability then the other detectors. Longer exposure period would help minimize the effect of this variability. The small size of the Scout and SunNuclear 1029 if the handle is removed does allow them to be placed under a large metal mixing bowl (7.5 liters) which also has one of the lower liters to square foot ratio and thus will produce the most radon increase per hour inside the accumulator. See Table 8 below.
Accumulator liters width ft2 m2 liters/ft2 liters/m2 Small mixing bowl 2.95 8.5” 21.6
cm 0.39 0.036 7.6 81.9
Large mixing bowl 7.3 12.75” 32.4 cm 0.89 0.083 8.21 88.0
2.5 gallon bucket 9.63 10.25” 26 cm 0.57 0.053 16.9 181.7
Small trash can 8.65 8.375” 21.3 cm 0.38 0.035 22.8 247.1
CRM Response to Slab with Thoron & Actinium
It was not possible to quantify CRM response to actinon because it’s half life of 4 seconds is too short. All of the CRM’s and E-PERMs were however tested to determine their response to thoron. In typical indoor air measurements a detectors thoron response would not be considered important because it is assumed that thoron’s half life of 55 seconds does not allow enough time for it to reach the breathing or testing zone. Flux measurements made under an accumulator however place a radon detector in very close proximity to the source which might contain thoron. A detector that is very sensitive to thoron could cause a false interpretation of the results if thoron is present in the material. In most cases the diffusion length of the material is long enough to decay out the thoron. Because thoron’s half life is very short it will reach a maximum concentration inside the accumulator during the 1st hour of exposure. The table in Figure 9 below is the calculated response that thoron would have if there was equal alpha activity from thoron and radon and the detector only provided an average such as the Pro-series 3 monitor or an E-PERM. If CRM’s are used under an accumulator the thoron reponse can be eliminated by using the slope of the ingrowth after 4 hours to determine the emanation rate since the radon will continue to ingrow while the thoron will be steady state.
Figure 8 - Accumulator liters to area - smaller l/ft2 or l/m2 higher the response

8
If only average is used
for this exposure length
E-PERM bias if equal Thoron & Radon
Pro-Series 3 bias if equal Thoron & radon
12 hours + 0.8% 24 hours + 0.4% 48 hours + 0.2% + 1.0%
All of the CRM’s and E-PERMs were tested to determine their response to thoron. A 114 liter chamber was constructed with two computer type fans installed 1/3 up from the bottom of the chamber and two additional computer type fans 2/3 of the way up. The four fans created a counter clockwise air flow with a velocity of 1.3 meters per second or approximately 1 revolution around the chamber per second. Each fan had thoron emanating Aladdin mantiles suspended in the fan’s airflow. See photo below in Figure 10. Two sampling ports in the walls of the chamber were used to flow air through a RAD7 that is capable of measuring thoron concentrations. The CRM’s and E-PERMs were exposed in the sealed chamber for 18 to 48 hours. The 4 to 12 aladdin mantiles produced enough thoron to maintain the chamber at 200 to 600 pCi/l of thoron as measured by the RAD7. The thoron concentration was measured by averaging 30 minutes of sampling data taken during two periods during the exposure length. The RAD7, which was located outside the chamber, was set up with short tubing and the small desiccant holder to minimize thoron decay loss. Figure 10 - 114 liter Thoron Chamber using Aladdin mantiles & fans
Figure 9 Effect of thoron on average of detector results

9
In each exposure outdoor air was blown into the chamber prior to sealing the chamber to minimize radon levels. Any activity above background radon levels that the detectors recorded above the chamber radon background was assumed to be caused by thoron. In the table in Figure 12 below the response to thoron was dramatically different between the CRM monitors. The RadonAway RS800 had very little response to thoron. When the RS800 was exposed to 550 pCi/L (20,300 Bq/m3) of thoron it only displayed an average of 3.4 pCi/l (126 Bq/m3). The RadonAway RS500 which has a very similar metal case however responded dramatically to thoron concentrations. It also had an increasing response which may have been due to a response to the decay products of thoron inside the chamber. See Figure 11 below. This increasing response would bias the results if there was significant thoron in the material being flux tested. The Femto-Tech 510 also responded to thoron but did not have an increasing concentration over the exposure. The Scout, Sun Nuclear 1029 and Pylon AB5 PRD had some limited response. The inexpensive Pro-Series 3 radon monitor also responds significantly to thoron. E-PERM S-Chambers with short term electrets had an average response to thoron of 4%.
0
50
100
150
200
250
1 3 5 7 9 11 13 15 17 19 21
Detector Response to 260 pCi/l of 220 Thoron( 9620 Bq/m3 )
Pylon
RS500
Hrs
Note: the climbing concentration possibly from thoron decay product activity
pCi/l
Femto 510's
ScoutSN1029
RS800 actual exposed to 550 pCi/l of thoron
Figure 11 - Detector response to steady state 220 Thoron

10
RS 800 Scout EPerms SN 1029 On-Guard 0.5% 6.4% 4.0% 5.5% 10.9%
Pylon AB5 PRD RS 500 Femto 510 Pro-Series 3
2.8% 67% 17% 22%
Reducing Thoron Response Any lengthening of the time it takes for thoron to reach the detectors sensors will reduce the detectors response to thoron. Radon, thoron and actinon will pass through but be slowed down by thin plastic depending on the plastic density and molecular structure. If one is trying to use the E-PERM thoron chambers to measure thoron it is important to know the background radon without having the detector respond to the thoron. Readily available zip lock food storage bags were tested to determine if they could reduce entry of thoron. The data in Figure 13 below was obtained by exposing different configurations of S-Chamber E-PERMs in the thoron chamber at two different concentrations and once to only an ingrowth of radon. In each thoron test all the EPERMs were suspended in the center of the chamber to allow free circulation of thoron enriched air around them. Three different diffusion barriers were tested, tyvek envelope, Ziploc brand vegetable bag that has pin holes in the plastic every centimeter (3/8”) and double Hefty One Zip brand bags. In order to induce a longer travel path for the thoron an E-PERM was placed inside an open Hefty bag and both were then placed inside a second open Hefty bag. E-PERMs without any bag covering were also exposed.
E-PERM setup
550 pCi/l 20.3 kBq/m3 220 thoron
191 pCi/l 7 kBq/m3
220 thoron
Just 222 radon
No covering 3.6% 4.0% 100.0% Inside Tyvek bag N/A 3.7% 100.0%
Inside Vegetable bag 1.7% 2.8% 97.5% Inside 2 zip-loc bags 0.6% 1.5% 85.0 %
Building Materials Two concrete slabs were hand mixed and poured in forms. Sakrete 5000 plus concrete mix was purchased locally from a building supplier and used for both slabs. This higher strength concrete was used to closer mimic commercial post stressed concrete. Each slab was carefully mixed using the water to concrete ratio specified by the manufacturer. The drying time of the slabs was reduced by keeping the slabs covered and occasional misting them with water for 14 days. The
Figure 12 - Detector Response to 220 Thoron
Figure 13 – Thoron & Radon Reduction from plastic bags

11
slabs were allowed to dry for at least 60 days before any testing was done on the slabs. One of the slabs referred to hereafter as the “mixed slab” had 9 ounces of high radon/thoron/action soil thoroughly mixed in with the cement to raise the radon emanation rates. The mixed slab is 17” by 17” by 3.5” thick (43x43x8.9 cm) (36.7 kg). The 3.5” edge around the perimeter of the slab was covered with 17 mil aluminum tape to allow radon emanation from only the two flat surfaces for a total area of 4 square feet (0.37 m2). See photo o fthis slab in Figure 19 below. The second slab referred hereafter as the “cold slab” is 16” round by 4.5” thick (40 cm round x 11.4 cm thick)(31.7 kg). The 4.5” perimeter of this slab is also covered with aluminum tape. This slab has 2.8 square feet (0.26 m2) of exposed slab.
Testing Cold & Mixed Slab with Ingrowth & Flow through The radon emanation rate for both slabs was determined by placing them individually inside a sealed metal chamber and measuring the ingrowth that takes place. To test the ingrowth method the mixed slab emanation rate was also measured by a flow through method. The cold slab did not have a high enough emanation rate to allow a flow through test. The flow through method eliminates the need to know the exact volume inside the chamber and the determination of the emanation rate is a straight forward calculation but the exact flow rate through the chamber must be known and the radon levels of the inflowing air must also be know. The flow rate was
Figure 14 – Slab Flow through Measurement Chamber

12
determined by using a Dwyer airflow gauge that was cross compared to a lab research bubble film flow gauge. Note that the authors six flow gauges vary from 8% high to 5% low compared to the cross calibrated unit. Any radon in the inflowing air will bias the reading. Even outdoor air can often exceed 1 pCi/l (37 bq/m3) at night. In order to eliminate the need to measure the radon levels of the inflowing air a radon filtering method was tested. A 3” PVC pipe, 10 feet long (3.6 cm X 3 meters) was filled with 0.5 cubic feet (14 liters) of granular activated coconut carbon (GAC). To test the effectiveness of the carbon filter, one lpm of desiccant dried air containing 150 pCi/l (5500 Bq/m3) was pushed through the carbon. It took eight days and six hours of continuous steady flow rate of 1 lpm before radon broke through the carbon. This carbon was then replaced with fresh carbon. The GAC filled PVC pipe makes an excellent pre-filter to eliminate any need to subtract background radon from the measured radon levels produced inside the chambers. The air entering the carbon tubes should be dried with a desicant to maintain maximum radon reduction. Figure 14 above illustrates how a flow through chamber for testing building materials can be set up. The mixed slab was tested with a modified flow through setup by adding a second chamber that the CRM’s were placed in to allow thoron to decay out and minimize their influence on the CRM’s. The following two charts show good correlation between the flow through method (194.4 pCi/ft2/hr – 1291 Bq/m2/min) versus the ingrowth measurement (198 pCi/ft2/hr – 1314 Bq/m2/min). Note that the ingrowth emanation rate is determined by using the formula in Figure 17 below.
0
2
4
6
8
10
12
14
16
18
1 2 3 4 5 6 7 8 9 10 11 12 13 14 15 16
Pylon 269
Pylon 352
Mixed Slab flow through testpCi/L
Hours
In flowing air 0.0 pCi/l
14.4 pCi/l average at 0.83 lpm flow slab 0.37 m2 by 8.9 cm thick
14.4 pCi/l times 0.83 lpm12.96 pCi/minute times 60 minutes
778 pCi/hr divided by 4 ft2equals 179.4 pCi/ft2/hr
71.4 kBq/m2/hr784 Bq/kg/hr
666 Bq/m3
slab 4 ft2 by 3.5" thick
slab weighs 36.7 kg
Figure 15 – Slab Flow through Measurement Chamber

13
The ingrowth of radon into a sealed chamber or accumulator in Figure 16 below is compared to the mathematical ingrowth using the formula in Figure 17. Using this formula allows any exposure duration to be used and the initial radon in the chamber to be subtracted from the ingrowth created by the building material. Unless carbon filtered air is used it will be necessary in most cases to approximate this initial radon concentration based on ambient radon measurements or make a grab sample measurement. The mathematical ingrowth needs to incorporate the free air volume of the accumulator (accumulator volume minus the volume of the detector(s) & building material), the area of the slab that is exposed and the initial radon levels when the detector is sealed in the accumulator.
The following formula, which can be entered into a spreadsheet program, is repeated each hour to obtain the mathematical radon concentration at each hour during the exposure:
SR = Starting Radon under the accumulator HR = Exposure hour AR = Area accumulator covers in square feet (this can be m2 if source strength is changed to Bq/m2/hr) VOL = Free air volume inside accumulator in liters
X = Multiplication addition & subtraction symbols CAV = Constant Adjustment Value
SS = Source Strength in pCi/sq ft/hr (this can be Bq/m2/hr if area is changed to m2 and Bq units are used)
0
20
40
60
80
100
120
140
160
180
1 2 3 4 5 6 7 8 9 10 11 12 13 14 15 16 17 18 19 20 21 22 23
Pylon 269
Pylon 352
Mathematical
Mixed Slab ingrowth test
pCi/L
Hours
Constant adjustment value 10 pCi/l
slab 4 ft2 by 3.5" thick
Mathematical ingrowth is 200 pCi/ft2/hr
ingrowth 79.7 kBq/m2/hr
666 Bq/m3
0.37 m2 by 8.9 cm
806 Bq/kg/hr
slab weighs 36.7 kg
Figure 16 – Slab In-Growth Measurement Chamber

14
(SR X (exp(-0.1813 X (HR / 24))))
+ ((((SS X AR) X 24) / (VOL X 0.1814)) X (1 – (exp(-0.1814 X (HR / 24))))) – CAV
Note that the first part of the formula is used to subtract out the diminishing effect of radon trapped under the accumulator at the start of the exposure. The second formula includes a Constant Value Adjustment (CAV) which is used to adjust the mathematical ingrowth line so that it lines up with the CRM data. The CAV must be a constant value throughout the exposure so that it does not affect the slope of the mathematical ingrowth. The need to adjust the mathematical ingrowth could be due to CRM response delay, thoron, or different detector starting times versus chamber sealing. The CRM data and mathematical ingrowth value from the accumulator formula are both plotted in a spreadsheet. The Source Strength value and Constant Value Adjustment (CAV) of the accumulator formula are varied until the slope of the mathematical ingrowth matches the slope of the CRM data. Flux Testing the Slabs with Accumlator Chambers The emanation rate of both slabs was tested by sealing a metal chamber (accumulator) on top of the slabs with a CRM installed inside. In each case the slab was elevated off the floor to allow open air circulation. The accumulator, which should be made of metal or glass to avoid any diffusion of radon out of the chamber, can be a metal mixing bowl or metal bucket. All seams in the accumulator must be caulked or foil taped diffusion tight. The accumulator should be just large enough for the CRM to fit inside to maximize the radon ingrowth. The volume of the accumulator in liters needs to be obtained by carefully measuring the interior dimensions or by filling the accumulator up with a known quantity of water. The material volume of the CRM or E-PERM needs to be known and subtracted out of the accumulator volume The volume of each CRM was measured and the approximate values are given in the table in Figure 18 below. Note that the CRM volume is not based on the outside dimensions but the approximate mass volume of all the components of the CRM.
RS 800 Scout EPerms SN 1029 0.76 liters 0.56 liters 0.123 liters 0.66 liters
Pylon AB5 PRD RS 500 Femto 510 RTCA OnGuard
2.5 liters 0.70 liters 0.61 liters 0.81 liters
Figure 18 – Liter volume of different detectors
Figure 17 – CRM Accumulator Source Strength (SS) Formula

15
Flexible plumbers putty was used to seal the accumulator with the CRM inside to the slab. The area of exposure needs to include one half of the area the putty covers. Most putty’s have some oil content and will leave a stain if the surface is porous. See photo in Figure 19 below of the RS800 and a 2.5 gallon (9.6 liter) metal bucket. All seams inside the bucket were sealed. The CRM’s need to be left under the accumulator for 12 to 48 hours. The data is input into a spreadsheet graph and the source strength value of the mathematical ingrowth formula and the Constant Adjustment Value (CRV) are adjusted until the mathematical ingrowth matches the actual CRM ingrowth. The source strength value is the emanation rate of the material in pCi/ft2/hr or Bq/m2/hr.
0
20
40
60
80
100
120
140
160
1 2 3 4 5 6 7 8 9 10 11 12 13 14
RS800
SN1029
Femto 510
RS500
Math ingrowth
CRM Mixed Slab Ingrowth using Metal Accumulator
Femto 510150 pCi/ft2/hr
RS 500165 pCi/ft2/hr SN 1029
150 pCi/ft2/hr
Math Ingrowth150 pCi/Ft2/hr59.7 Bq/m2/hr
RS 800190 pCi/ft2/hr
Hours
pCi/l5.9 kBq/m3
Figure 19 – RS800 sealed under 9.6 Liter Accumulator for Mixed Slab
Figure 20 – CRM’s sealed under Accumulator over Mixed Slab
16
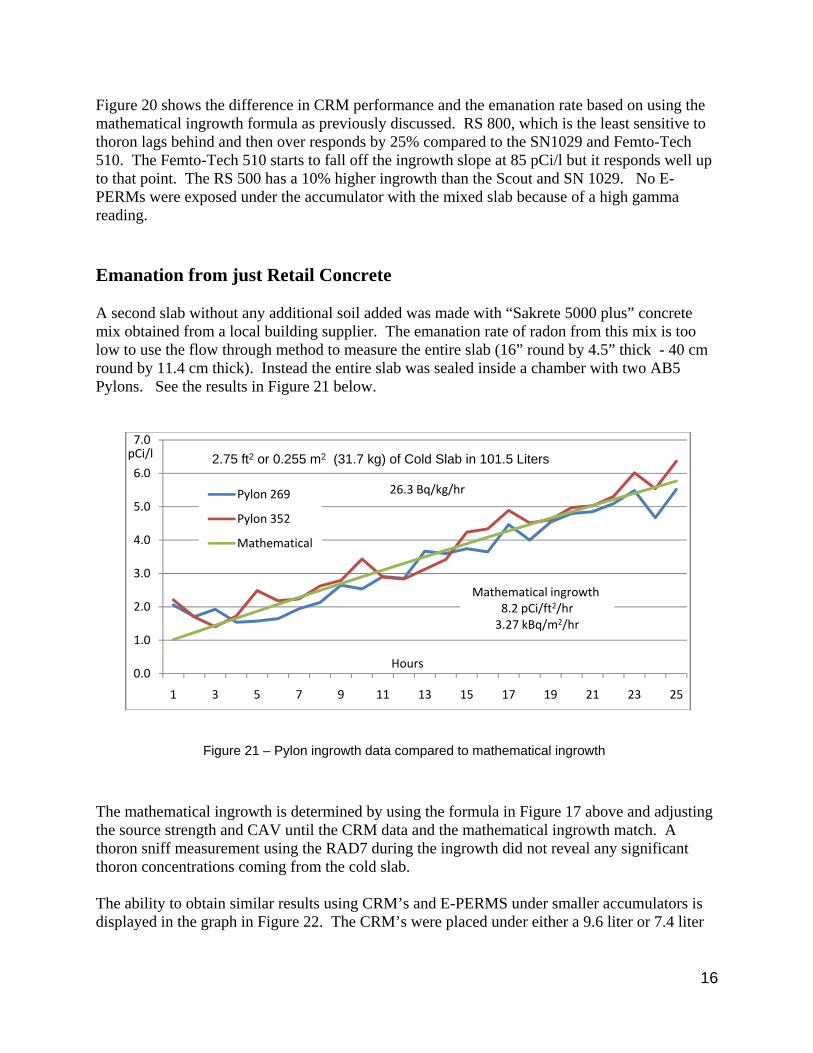
Figure 20 shows the difference in CRM performance and the emanation rate based on using the mathematical ingrowth formula as previously discussed. RS 800, which is the least sensitive to thoron lags behind and then over responds by 25% compared to the SN1029 and Femto-Tech 510. The Femto-Tech 510 starts to fall off the ingrowth slope at 85 pCi/l but it responds well up to that point. The RS 500 has a 10% higher ingrowth than the Scout and SN 1029. No E-PERMs were exposed under the accumulator with the mixed slab because of a high gamma reading. Emanation from just Retail Concrete A second slab without any additional soil added was made with “Sakrete 5000 plus” concrete mix obtained from a local building supplier. The emanation rate of radon from this mix is too low to use the flow through method to measure the entire slab (16” round by 4.5” thick - 40 cm round by 11.4 cm thick). Instead the entire slab was sealed inside a chamber with two AB5 Pylons. See the results in Figure 21 below.
The mathematical ingrowth is determined by using the formula in Figure 17 above and adjusting the source strength and CAV until the CRM data and the mathematical ingrowth match. A thoron sniff measurement using the RAD7 during the ingrowth did not reveal any significant thoron concentrations coming from the cold slab. The ability to obtain similar results using CRM’s and E-PERMS under smaller accumulators is displayed in the graph in Figure 22. The CRM’s were placed under either a 9.6 liter or 7.4 liter
0.0
1.0
2.0
3.0
4.0
5.0
6.0
7.0
1 3 5 7 9 11 13 15 17 19 21 23 25
Pylon 269
Pylon 352
Mathematical
2.75 ft2 or 0.255 m2 (31.7 kg) of Cold Slab in 101.5 Liters
Mathematical ingrowth 8.2 pCi/ft2/hr3.27 kBq/m2/hr
Hours
pCi/l
26.3 Bq/kg/hr
Figure 21 – Pylon ingrowth data compared to mathematical ingrowth

17
metal bucket that was sealed on top of the slab. Note the variation in measurements when using a less precise Scout, SN1029 or RS500. These monitors need to be exposed for longer periods to improve accuracy. The full slab test in Figure 21 indicated an emanation rate of 8.2 pCi/ft2/hr (28.2 Bq/m2/hr). The SN1029 and RS 500 are within 10% of the total slab measurement while the RS 800 was 27% lower and the FemtoTech 510 is 39% lower.
E-PERM’s were also exposed a number of times under accumulators. For E-PERM
measurements it is important to know the initial radon levels at the start of the measurement and the gamma emanation which might be elevated in some cases above background from the building material. Gamma measurements can be made with a properly calibrated gamma survey instrument or more accurate measurements can be obtained by using 2 mR gamma dosimeters obtainable from Rad Elec Inc that are exposed over a one to two day period and then re-charged with a portable charger. See photo in Figure 23.
The ambient radon in air concentration trapped inside the accumulator that is
decaying during the exposure period needs to factored out of the ingrowth measurement. A less precise method is to approximate the initial radon measurement based on average radon in air
0
2
4
6
8
10
12
14
16
18
20
1 3 5 7 9 11 13 15 17 19 21 23 25 27 29 31 33 35 37 39 41 43 45
RS 800
SN1029
RS 500
FemtoTech 510
Scout
0.66 ft2 of exposure to Cold Slab in 9 Liter Bucket RS800 & Math ingrowth 6.0 pCi/ft2/hr
Hours
pCi/l
SN10297.5 pCi/ft2/hr
FemtoTech 5105.0 pCi/ft2/hr
Scout ingrowth 7.0 pCi/ft2/hr2786 Bq/m3/hr
RS5007.5 pCi/ft2/hr
Figure 22 – CRM compared to mathematical ingrowth
Figure 23 – 2 mR Gamma Dosimeter & re-charger

18
measurements made in the same location and then use the first part of the formula in Figure 24 to determine the Starting Radon Influence (SRI). A more precise method if the initial radon concentration is not known is to seal an E-PERM in a glass jar at the beginning of the measurement. The average radon concentration of the E-PERM in the jar is the SRI value. The SRI value is subtracted from the radon measurement obtained under the accumulator (RUA). The formula for obtaining this measurement is given in Figure 24. Note that the lower the emanation rate the more critical it is to measure the starting radon concentration. If the E-PERM is immediately closed up at the end of the accumulator exposure the E-PERM’s response delay to the in-growing radon will bias the average reading low. This effect is more pronounce for an in-growth exposure of increasing radon concentration than a steady state exposure because the highest radon concentration happens at the end of the exposure. One method of compensating for the final out-gassingy of radon in the chamber after the exposure and the final decay of the radon short lived decay products left in the E-PERM chamber is to leave the E-PERM open an additional 3 hours in a low radon environment. This would be in-practical in most cases because of the availability of a low radon environment and the time constraint of waiting three hours. To test the amount of bias at the end of an ingrowth exposure, 12 E-PERMs were exposed to a radon ingrowth inside a sealed chamber. Six of the E-PERMs were read immediately and 6 were left open in a lower radon environment (outside mid-afternoon) and read three hours later. The difference equaled about 10% higher emanation rate which is added to the formula in Figure 24. This is similar to the CRM bias. If the influence of the starting radon concentration is not measured using the E-PERM sealed in a jar method then the starting radon influence (SRI) is determined by the first formula given below which can be entered into a spreadsheet. The SRI is then included in the second formula to determine the emanation rate.
RUA = E-PERM average radon under accumulator measured by an E-PERM ARL = Approximate ambient radon level when E-PERM is sealed SRI = Starting Radon influence
(use either E-PERM average in sealed jar or 1st part of formula in Figure 24) EXD = Exposure Days AR = Area accumulator covers in square feet
(this can be m2 if source strength is changed to Bq/m2/hr) VOL = Free air volume inside accumulator in liters
X = Multiplication symbol
SS = Source strength in pCi/sq ft/hr (this can be Bq/m2/hr if area is changed to m2)
SRI = (ARL X (1- exp(-(0.1813 X EXD))) / (0.1814 X EXD))
SS = ((((RUA-SRI) X VOL X 0.1814) / AR) / (1-((1- exp(-0.1814 X EXD)) / (0.1814 X EXD))) / 24) X 1.1
Figure 24 – E-PERM Accumulator Source Strength (SS) Formula

19
Note that the first calculation (SRI) determines the diminishing effect of radon trapped under the accumulator at the start of the exposure. Single S-Chamber E-PERM’s were exposed under an accumulator sealed on top of the cold slab.
Pylon average E-PERM - 1 E-PERM - 2 8.2 pCi/ft2/hr 8.0 pCi/ft2/hr 8.2 pCi/ft2/hr
Ingrowth correction Final decay correction Final decay correction 1.15 1.1 1.1
9.4 pCi/ft2/hr 8.8 pCi/ft2/hr 9.0 pCi/ft2/hr 3.7 kBq/m2/hr 3.5 kBq/m2/hr 3.6 kBq/m2/hr
Measuring Granite Tiles & Countertops Granite often contains 238 uranium and 226 radium which decays into 222radon. Most commonly used granites do not produce a significant elevation in indoor radon levels because of typical indoor ventilation rates, the amount of granite in the building and the circulation of air throughout the dwelling. There is concern, however, that air tight small homes with limited ventilation between rooms and granite that has unusual levels of radium there could be a significant increase in the radon levels. Several pieces of granite were obtained that had higher than average emanation rates of radon in order to test the ability to measure the emanation rate using the accumulator method. These pieces of granite were first measured by placing them in a sealed chamber with one or two AB5 Pylons. The graph of 1.25” (3 cm) thick granite in Figure 26 is was the highest emanating slab that was tested. Granite emanation is figured in units of square feet or square meters of one side but is actually the emanation from both sides of the material.
Figure 25 – E-PERM under accumulator versus Pylons with cold slab ingrowth
0
50
100
150
200
250
1 3 5 7 9 11 13 15 17 19
Sun Nuclear 1028
Mathematical ingrowth
500 pCi/ft2/hour199.1 kBq/m2/hr
2.625 ft2 (0.23 M2) of NS Granitein 113.5 liter chamber
Hours
pCi/L
Figure 26 – Granite Emanation Rate in a sealed Chamber

20
The accumulator method was used to measure the emanation rate of the granite samples by sealing a metal trash can (7 to 8 liter size) with a CRM’s inside to either side of the granite. The volume of the CRM is subtracted from the volume of the accumulator to determine the actual free air. It was determined that the granite area the accumulator covered needed to include half the width of the putty placed around the accumulator as additional area emanating into the chamber.
The Table in Figure 28 below depicts the significant difference between emanation rates of the polished side versus the un-polished side. The JB granite had a plastic fiber re-enforced coating that is apparently stopping 98% of the radon emanation out of the un-polished side. The CB granite was the reverse with almost 8 times more radon emanation from the un-polished side versus the polished side. The NG granite had 40% more emanation from the un-polished side versus the polished side. The difference between emanation rates is due to the increased surface area of the un-polished side and the different sealing methods used on the polished side. Polished granite typically has fillers installed to fill the small indentations in the granite before it is final polished. These results indicate the need to measure both sides of a granite counter top to avoid significant errors. It may be possible to test the underside of a granite kitchen slab by removing a cabinet drawer to gain access for the accumulator. The last two columns in Figure 28 gives the emanation rate determined by measuring the entire piece in a sealed chamber. The sum of the accumulator measurements versus the total emanation
0
2
4
6
8
10
12
1 3 5 7 9 11 13 15 17 19 21 23
Polished side
Polished math ingrowth
Unpolished
unpolished math ingrowth
unpolished side7.8 pCi/ft2/hr3.1 kBq/m2/hr
Femto 510's sealed in 6.65 liter containersover 0.44 ft2 (0.04 m2) of
2.54 cm - 1" thick CB Granite Tile
Hours
pCi/L
Polished side1.0 pCi/ft2/hr398 Bq/m2/hr
444 Bq/m3
Figure 27 – Granite Emanation Rate Variation

21
does match for two of the granites. Variation between measuring the total granite piece and individual sides could be due to variations in emanation across the surface of the granite. The likely variation across the granite surface and the difference in emanation rate between the polished and un-polished side can easily produce a significant bias in a single accumulator test of only one side of a granite slab or tile. This study did not make measurements of the reduction in emanation if granite tiles are sealed to a concrete slab or tile setting material. The gamma rates of the three granite pieces were measured with a Bicron micro rem gamma meter that had been recently calibrated as well as with the Rad Elec 2 mR/hr gamma dosimeters. See picture of this unit in Figure 23 above and the table in Figure 29 below. The average of the background gamma was subtracted from three gamma dosimeters placed on top of the granite pieces. Although this is a very small sample of only three granite pieces, the variation in gamma emanation versus radon emanation rate may provide a reasonable method for determining if granite is likely to raise the radon levels in a residence a significant amount. . Calculating Radon Increase from Building Material Emanation Rates Determining the increase in radon levels from a building material is difficult even if the building material has a uniform emanation rate. Radon emanation from concrete may be reduced by the materials placed over the concrete such as vinyl flooring or ceramic tile although drywall, paint, texture coatings or carpeting may provide very little reduction in emanation rate.
Granite type Polished
emanation pCi/ft2/hr
Unpolished emanation pCi/ft2/hr
Total emanation pCi/ft2/hr
Total emanation pCi/m2/hr
Total emanation kBq/m2/hr
NG granite 240 345 490 5274 195.2 JB granite 120 2 125 1345 49.8 CB granite 1.0 7.8 8.6 92.6 3.4
Granite type Gamma uR/hr
above background
Total emanation pCi/ft2/hr
pCi/ft2/hr per uR/hr
above background NG granite 99.3 490 4.9 JB granite 12.7 125 9.8 CB granite 3.4 8.6 2.5
Figure 28 – Granite Emanation Rate Variation
Figure 29 – Gamma emanation rate versus radon emanation

22
This total emanation rate per hour from the material is divided by the liters of outdoor air moving into the structure or room every hour to obtain the radon level increase. The amount of outdoor air entering a building can obviously change hour by hour depending upon wind load, temperature difference inside to outside, exhaust fan operation and window and door position. Any change to this ventilation rate will have a linear effect on the radon levels since the emanation rate from building materials is likely to be fairly consistent. The introduction of outdoor air into the dwelling will likely be well mixed if the unit has an air handling system that is operating. If there is no air handling system or it is not operating then the increased radon in air from the building material will vary from room to room depending on the room’s volume versus exposure to the building material and the natural mixing taking place from room to room. If some assumptions are made one can calculate the contribution of increased radon in a small home that is very air tight. An air tight home would be most influenced by building material emanation rate. The condominiums the author worked on had air change per hour (ACH) rates less than 0.1 ACH. If we use 0.1 ACH with a 1250 ft2 (116 m2) condominium the ventilation rate would be 28,316 liters per hour. If 40 ft2 (3.72 m2) of granite was installed in this size dwelling assuming even mixing of the air by an operating air handling system the radon levels would be increased by the amounts given in the table in Figure 30 below. If the condominium floors and ceilings were constructed of concrete, as they typically are, there would be 2500 ft2 of concrete exposure. If the emanation rate of the cold slab (9.4 pCi/ft2/hr) is used, the radon increase will be around 0.8 pCi/l. The cold slab was however only 3.5 inches thick (8.9 cm) while a typical condominium slab is 7 to 8 inches thick (18 to 20 cm). The “diffusion length” of concrete (point where only 37% of the element is escaping) has been measured by other researchers to be around 10 cm (4”). The double thickness of the actual slab versus the tested cold slab will increase the surface radon emanation but it would likely not be linear. Note however that the concrete even using the cold slab emanation rate increases the radon levels a greater amount than the granite having an unusually high emanation rate.
CB Granite JB Granite NG Granite Concrete 0.1 pCi/l 0.2 pCi/l 0.7 pCi/l 0.8 pCi/l 4 Bq/m3 7 Bq/m3 26 Bq/m3 30 Bq/m3
Summary In most cases it will not be possible to take a sample of a building material and place it inside a sealed chamber with a radon monitor to measure the emanation rate. This study has demonstrated that placing a continuous radon monitor or E-PERM inside a metal or glass accumulator that is sealed to the emanating material surface is a reasonably reliable method for determining the emanation rate assuming the emanation rate is consistent across the surface of the material. It appears from the small number of granite samples tested that granite can have significant variation in emanation rates between surfaces . Concrete slabs however are likely to have significantly more uniform emanation rates assuming the material came from the same source and there has been no coatings applied to one side of the concrete. To obtain emanation rates it is necessary to know the exact volume of the accumulator, the amount of free space taken
Figure 30 – Radon increase in 1250 ft2 (116 m2) dwelling with 0.1 ACH from 40 ft2 (3.7m2) granite or 2500 ft2 (232m2)concrete at 9.4 pCi/ft2/hr emanation

23
up by the detector and the area the accumulator is covering. The detector should be in place from 24 to 48 hours. Materials with low emanation rates should have 48 hour exposures. The emanation rate in pCi/sq ft/hr or Bq/M2/hr can be determined by using the formulas given in this paper. The CRM ingrowth rate will need to be matched to a mathematical ingrowth rate obtained from the formulas and adjusted until it matches the ingrowth of the CRM data to determine the emanation rate. This emanation rate times the area of the material exposed inside the dwelling divided by the ventilation rate will give the expected radon increase provided by the material. Changes in the radon concentration will therefore be directly related to the ventilation rate of the dwelling. Acknowledgements This study would not have been possible without the very generous donation of equipment from Rad-Elec, Femto-Tech, RadonAway, Sun Nuclear, RTCA and Pennsylvania DEP Radon Department. In addition the author is very indebted to the following individuals for much needed advice and help: Mike Kitto, Paul Kotrappa, Dan Steck, Phil Jenkins, Al Gerhart. References Ackers J.G., Den Boer J.F., DeLong P., Wolschrijin R.A., Radioactivity and radon exhalation rates of building materials in the Netherlands. Sci.Total Environ. 45: 151-156; 1985 Chao C., Tung T., Chan D., Burnett J.. Determination of radon emanation and back diffusion characteristics of building materials in small chamber tests. Building and Environ. 32:355-362; 1997 Chyi L.L.. Radon testing of various countertop materials final report. University of Akron, May 2008 Cozmuta I., Van der Graaf E.R.. Methods for measuring diffusion coeffients of radon in building materials. Sci. Total Environ. 272: 323-335; 2001 Cozmuta I., Van der Graaf E.R., Meijer R.J.. Moisture dependence of radon transport in concrete: measurements and modeling. Health Phys. 85: 438-456; 2003 Folkerts K.H., Keller G., Muth H.. An experimental study on diffusion and exhalation of 222Rn and 220Rn from building materials. Rad. Prot. Dosim. 9: 27-34; 1984 Gadd M.S., Borak T.B.. In-situ determination of the diffusion coefficient of 222Rn in concrete. Health Phys. 68: 817-822; 1995 Janga M., Kanga C.S., Moonb J.H.. Estimation of 222Rn release from the phosphogypsum board used in housing panels. J. Envirn. Radioact. 80: 153-160; 2005

24
Keller G., Hoffman B., Feigenspan T.. Radon permeability and radon exhalation of building materials. Sci.Total Environ. 272:85-89; 2001 Kitto, M., Green J.. Emanation from granite countertops. Proceedings of AARST International Radon Conference; 2005 Kotrappa P., Stieff L.R.. NIST traceable radon calibration system for calibrating true integrating radon monitors – E-PERM . Proceedings of AARST International Radon Conference; 1993 Kotrappa P., Stieff L.R. Volkovitsky P.. Radon monitor calibration using NIST radon emanation standards: steady flow method. Journ. Rad. Protection Dosimetry; 2005 Kovler K.. Radon exhalation of hardening concrete: monitoring cement hydration and prediction of radon concentration in construction site. Journ. Environ. Radioactivity 86: 354-366; 2006 Llope W.J.. Radiation and radon from natural stone. Rice University, 5/7/2008 Misdaq, M.A., Amghar A.. Radon and thoron emanation from various marble materials: impact on the workers. Radiat. Meas. 39: 421-430; 2005 Pavilidou S., Koroneos A., Papastefanou C., Christofides G., Stoulos S., Vavelides M.. Natural radioactivity of granites used as building materials. Journ. Environ. Radioactivity 89: 48-60; 2006 Righi S., Bruzzi L.. Natural radioactivity and radon exhalation in building materials used in Italian dwellings. Journ. Environ. Radioactivity 88: 158-170; 2006 Roelofs L.M.M., Scholten L.C.. The effect of aging, humidity, and fly ash additive on the radon exhalation from concrete. Health Phys. 67: 225-230; 1991a Rogers V.C., Nielson K.K., Holt R.B.. Radon diffusion coefficients for residential concretes. Health Phys. 67:261-265; 1994 Rogers V.C., Nielson K.K., Holt R.B.. Radon diffusion coefficients for aged residential concretes. Health Phys. 68:832-834; 1995 Sahoo B.K., Nathwani D., Eappen K.P., Ramachandran T.V., Gaware J.J., Mayya Y.S.. Estimation of radon emanation in Indian building materials. ScienceDirect 42:1422-1425; 2007 Stoulos S., Manolopoulou M., Papastefanou C.. Assessment of natural radiation exposure and radon exhalation from building materials in Greece. J. Environ. Radioact. 69:225-240; 2003
25
Stoulos S., Manolopoulou M., Papastefanou C.. Measurement of radon emanation factor from granular samples: effects exposure and radon exhalation from building materials in Greece. J. Environ. Radioact. 69:225-240; 2004 Sun H., Furbish D.J.. Moisture effect on radon emanation in porous media. J. Contam Hydrol 18:239-255; 1995 Yu K.N., Chan T.F., Young E.C.M.. The variation of radon exhalation rates from building materials of different ages. Health Phys. 68:716-718; 1995