
Measuring DEA efficiency in cable television network facilities: what are appropriate criteria for...
15
Socio-Economic Planning Sciences 37 (2003) 29–43 Measuring DEA efficiency in cable television network facilities: what are appropriate criteria for determining the amounts of governmental subsidies? Toshiya Jitsuzumi a, *, Akihiro Nakamura b a Faculty of Economics, Nagasaki University, Katafuchi, Nagasaki 850-8506, Japan b Institute for Posts and Telecommunications Policy, Azabudai, Tokyo 107-0052, Japan Received 26 February 2001; received in revised form 8 July 2001 Abstract Recent technological developments have transformed the cable television industry (CATV) from a simple re-transmitter of terrestrial broadcasting to a provider of a broader-band information infrastructure. With cable operators facing an undesirable market situation while operating a fiber optics network vital to the creation of an information-based society within Japan, the Japanese Government has introduced several supportive measures for the industry. Such governmental intervention should desirably be justified not only from a political viewpoint but also from an economic one; otherwise such measures may distort economic efficiency. In this article, using Data Envelopment Analysis (DEA), the authors identify the deficiencies of an accounting-based intervention scheme and propose an alternative framework with no disincentive side effects. r 2002 Elsevier Science Ltd. All rights reserved. Keywords: Data Envelopment Analysis; Cable television; Yardstick competition 1. Introduction Due to rapid progress in fiber optic and digitalization technologies, the cable television business has evolved from a simple re-transmitter of terrestrial broadcasting—when introduced in Japan almost a half-century ago, the industry sought mainly to improve household TV reception—to a promising provider of state-of-the-art broader-band interactive network facilities which support various information technology (IT) applications. In fact, 226 operators had been granted licenses for telecommunications services as of the end of December 2000. These operators are currently *Corresponding author. Tel.:/fax: +81-95-820-6396. E-mail addresses: [email protected] (T. Jitsuzumi), [email protected] (A. Nakamura). 0038-0121/02/$ - see front matter r 2002 Elsevier Science Ltd. All rights reserved. PII:S0038-0121(02)00005-8
-
Upload
toshiya-jitsuzumi -
Category
Documents
-
view
212 -
download
0
Transcript of Measuring DEA efficiency in cable television network facilities: what are appropriate criteria for...

Socio-Economic Planning Sciences 37 (2003) 29–43
Measuring DEA efficiency in cable television network facilities:what are appropriate criteria for determining the amounts of
governmental subsidies?
Toshiya Jitsuzumia,*, Akihiro Nakamurab
aFaculty of Economics, Nagasaki University, Katafuchi, Nagasaki 850-8506, Japanb Institute for Posts and Telecommunications Policy, Azabudai, Tokyo 107-0052, Japan
Received 26 February 2001; received in revised form 8 July 2001
Abstract
Recent technological developments have transformed the cable television industry (CATV) from a simplere-transmitter of terrestrial broadcasting to a provider of a broader-band information infrastructure. Withcable operators facing an undesirable market situation while operating a fiber optics network vital to thecreation of an information-based society within Japan, the Japanese Government has introduced severalsupportive measures for the industry. Such governmental intervention should desirably be justified not onlyfrom a political viewpoint but also from an economic one; otherwise such measures may distort economicefficiency. In this article, using Data Envelopment Analysis (DEA), the authors identify the deficiencies ofan accounting-based intervention scheme and propose an alternative framework with no disincentive sideeffects.r 2002 Elsevier Science Ltd. All rights reserved.
Keywords: Data Envelopment Analysis; Cable television; Yardstick competition
1. Introduction
Due to rapid progress in fiber optic and digitalization technologies, the cable television businesshas evolved from a simple re-transmitter of terrestrial broadcasting—when introduced in Japanalmost a half-century ago, the industry sought mainly to improve household TV reception—to apromising provider of state-of-the-art broader-band interactive network facilities which supportvarious information technology (IT) applications. In fact, 226 operators had been granted licensesfor telecommunications services as of the end of December 2000. These operators are currently
*Corresponding author. Tel.:/fax: +81-95-820-6396.
E-mail addresses: [email protected] (T. Jitsuzumi), [email protected] (A. Nakamura).
0038-0121/02/$ - see front matter r 2002 Elsevier Science Ltd. All rights reserved.
PII: S 0 0 3 8 - 0 1 2 1 ( 0 2 ) 0 0 0 0 5 - 8

providing—or plan to provide—so-called ‘‘full service,’’ including broadcasting, communications,and Internet connections. Their broader-band network is widely viewed as one of the mostimportant elements of socio-economic infrastructure in the Information Age. In addition,inasmuch as Nippon Telegraph and Telephone Corporation (NTT), the largest telecommunica-tions carrier in Japan, dominates the telecommunications market, the government expects theseinteractive CATV networks to apply competitive pressure to NTT and to fuel competition in thismarket segment.In response to the current situation, the Japanese government has deregulated the existing legal
frameworks to support the CATV industry. For example, the Ministry of Posts andTelecommunications (MPT)1 has dramatically reduced market barriers for new entrants byestablishing a standard application procedure for permission to install CATV facilities in 1994. Inthis regard, it published a ‘‘Manual for Market Entry into the Cable TV Business’’ in 1996, andsubsequently removed constraints on foreign investments in 1999.Nevertheless, many of Japan’s CATV businesses are currently suffering heavy financial losses.
Due to factors such as low market penetration,2 large depreciation burdens, insufficient growth inviewing hours [1] and channel repertoire (i.e., the set of channels watched regularly by anindividual or household) [2], competition with terrestrial or satellite broadcasters, and generaleconomic trends in Japan, only 63% of operators ended the fiscal year (1999) with a bottom-lineprofit, and 3% with a cumulative surplus3 [3]. As this situation may jeopardize Japan’scompetition and IT policies, and may further induce political concerns about uneveninfrastructure development among local communities, the Japanese government has implementedseveral supportive measures that include subsidies and tax reductions.Such governmental measures should be preferably justified not only from a political viewpoint
but also from an economic one. When verifying economic justifications for given interventions,regulators need to take the following steps:
* First, to examine whether some form of market failure exists, such as economies of scale orexternalities; otherwise, the interventions will likely harm the Pareto optimum.
* Next, to design an appropriate support mechanism that determines which firms are qualifiedfor support and in what amount, in order not to harm firms’ incentives for rationalization.
In this article, we focus our efforts on the second area in seeking to identify an appropriatemechanism for optimal intervention. Currently, most governmental supports seem to be designedto help CATV firms because they are financially damaged. The government assumes that suchfirms cannot afford to provide sufficient network capacity for households (hereafter, referred to as‘‘accounting-based schemes’’). However, in the following sections, by showing that firms withfinancial hardship are equally or more efficient in supplying network capacity than other firmsthat are more profitable, we show that an accounting-based mechanism will not motivate CATVfirms to efficiently provide network facilities. To overcome this deficiency of accounting-based
1In 2001, MPT was integrated with two other governmental bodies and reorganized into the Ministry of Public
Management, Home Affairs, Posts and Telecommunications.2As of March 2000, the number of subscriber households in Japan had reached 9.47 million (up 19.3% from the
previous year), yet market penetration remained in the 20% range.3The average firm suffered 21.4 billion yen of operating loss and 17.5 billion yen of ordinary loss, up 77% and 2%
from the previous year’s figures, respectively.
T. Jitsuzumi, A. Nakamura / Socio-Economic Planning Sciences 37 (2003) 29–4330
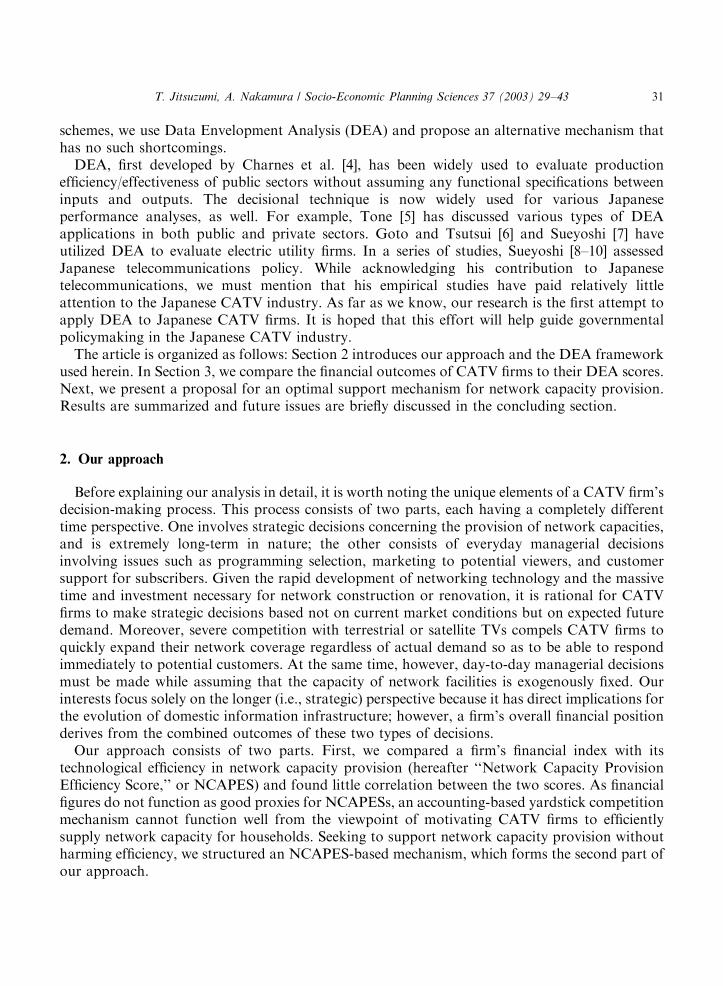
schemes, we use Data Envelopment Analysis (DEA) and propose an alternative mechanism thathas no such shortcomings.DEA, first developed by Charnes et al. [4], has been widely used to evaluate production
efficiency/effectiveness of public sectors without assuming any functional specifications betweeninputs and outputs. The decisional technique is now widely used for various Japaneseperformance analyses, as well. For example, Tone [5] has discussed various types of DEAapplications in both public and private sectors. Goto and Tsutsui [6] and Sueyoshi [7] haveutilized DEA to evaluate electric utility firms. In a series of studies, Sueyoshi [8–10] assessedJapanese telecommunications policy. While acknowledging his contribution to Japanesetelecommunications, we must mention that his empirical studies have paid relatively littleattention to the Japanese CATV industry. As far as we know, our research is the first attempt toapply DEA to Japanese CATV firms. It is hoped that this effort will help guide governmentalpolicymaking in the Japanese CATV industry.The article is organized as follows: Section 2 introduces our approach and the DEA framework
used herein. In Section 3, we compare the financial outcomes of CATV firms to their DEA scores.Next, we present a proposal for an optimal support mechanism for network capacity provision.Results are summarized and future issues are briefly discussed in the concluding section.
2. Our approach
Before explaining our analysis in detail, it is worth noting the unique elements of a CATV firm’sdecision-making process. This process consists of two parts, each having a completely differenttime perspective. One involves strategic decisions concerning the provision of network capacities,and is extremely long-term in nature; the other consists of everyday managerial decisionsinvolving issues such as programming selection, marketing to potential viewers, and customersupport for subscribers. Given the rapid development of networking technology and the massivetime and investment necessary for network construction or renovation, it is rational for CATVfirms to make strategic decisions based not on current market conditions but on expected futuredemand. Moreover, severe competition with terrestrial or satellite TVs compels CATV firms toquickly expand their network coverage regardless of actual demand so as to be able to respondimmediately to potential customers. At the same time, however, day-to-day managerial decisionsmust be made while assuming that the capacity of network facilities is exogenously fixed. Ourinterests focus solely on the longer (i.e., strategic) perspective because it has direct implications forthe evolution of domestic information infrastructure; however, a firm’s overall financial positionderives from the combined outcomes of these two types of decisions.Our approach consists of two parts. First, we compared a firm’s financial index with its
technological efficiency in network capacity provision (hereafter ‘‘Network Capacity ProvisionEfficiency Score,’’ or NCAPES) and found little correlation between the two scores. As financialfigures do not function as good proxies for NCAPESs, an accounting-based yardstick competitionmechanism cannot function well from the viewpoint of motivating CATV firms to efficientlysupply network capacity for households. Seeking to support network capacity provision withoutharming efficiency, we structured an NCAPES-based mechanism, which forms the second part ofour approach.
T. Jitsuzumi, A. Nakamura / Socio-Economic Planning Sciences 37 (2003) 29–43 31
The yardstick competition, which is a basis of our proposal, was originally introduced to regulateregional monopolists. Its essential idea is to compare the performance of one regional monopolisticfirm with that of others operating under similar conditions, in order to reduce informationasymmetries between the regulator and the regulated. Working from such comparisons, theregulator can minimize the efficiency deterioration inevitable in any monopolistic situation byawarding a bonus to better-performing firms. (For details, see Armstrong et al. [11])Although the yardstick competition was originally introduced to regulate lucrative regional
monopolies, its basic concept can also be applied to structure subsidies for unprofitable regionalmonopolists, such as those in Japan’s CATV industry. This concept suggests that, when anindustry has to be maintained for certain reasons and currently no (or only a few) firms generate aprofit, regulators should subsidize all firms within the industry by an amount equal to theaveraged loss of firms that achieve sufficient efficiency. This is designed to motivate less efficientfirms to follow best practices. When applying this concept, it is very important to find anappropriate index that accurately reflects certain aspects of the industry in question. With theCATV industry, therefore, performance comparisons should be between NCAPES figures, notfinancial outcomes—unless the firms’ financial figures are perfect proxies for NCAPES.Moreover, in the real world, as no two firms operate under the same exogenous conditions, aperformance index free of such exogeneity must be prepared. As Japanese CATV operators aresubject to entry regulations, the exogeneity exists in area selection. It is thus not fair to includearea-related impacts in performance comparisons; if such factors are included, seriousdisincentives will likely affect environmentally advantaged firms.
2.1. The DEA model
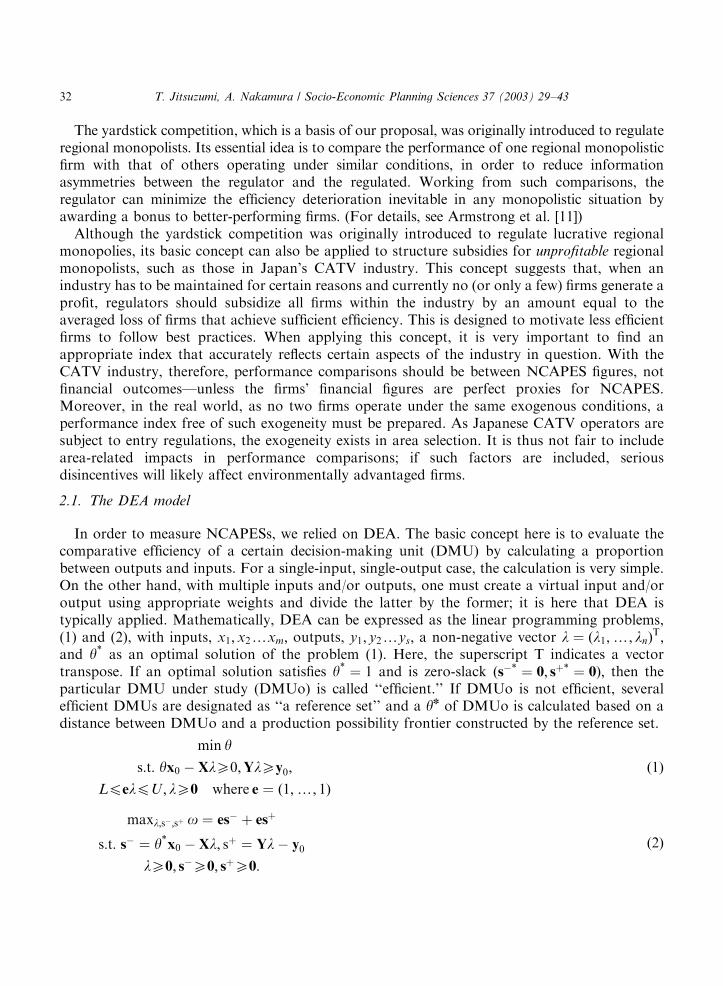
In order to measure NCAPESs, we relied on DEA. The basic concept here is to evaluate thecomparative efficiency of a certain decision-making unit (DMU) by calculating a proportionbetween outputs and inputs. For a single-input, single-output case, the calculation is very simple.On the other hand, with multiple inputs and/or outputs, one must create a virtual input and/oroutput using appropriate weights and divide the latter by the former; it is here that DEA istypically applied. Mathematically, DEA can be expressed as the linear programming problems,(1) and (2), with inputs, x1;x2yxm; outputs, y1; y2yys; a non-negative vector l ¼ ðl1;y; lnÞ
T;and y� as an optimal solution of the problem (1). Here, the superscript T indicates a vectortranspose. If an optimal solution satisfies y� ¼ 1 and is zero-slack ðs�� ¼ 0; sþ� ¼ 0Þ; then theparticular DMU under study (DMUo) is called ‘‘efficient.’’ If DMUo is not efficient, severalefficient DMUs are designated as ‘‘a reference set’’ and a yn of DMUo is calculated based on adistance between DMUo and a production possibility frontier constructed by the reference set.
min y
s:t: yx0 � XlX0;YlXy0;
LpelpU ; lX0 where e ¼ ð1;y; 1Þ
ð1Þ
maxl;s�;sþ o ¼ es� þ esþ
s:t: s� ¼ y�x0 � Xl; sþ ¼ Yl� y0
lX0; s�X0; sþX0:
ð2Þ
T. Jitsuzumi, A. Nakamura / Socio-Economic Planning Sciences 37 (2003) 29–4332

DEA has several variations. By setting L ¼ 0;U ¼ N; a CCR-I (input-oriented Charnes–Cooper–Rhodes [4]) model assumes a constant returns to scale; meanwhile, when L ¼ U ¼ 1; aBCC-I (input-oriented Banker–Charnes–Cooper [12]) model assumes variable returns to scale. Bymodifying the model in order to take uncontrollable variables into account, an input-orientednon-controllable variable model under a constant returns-to-scale assumption (NCN-I-C) model,or an input-oriented non-controllable variable model under a variable returns-to-scaleassumption (NCN-I-V) model, is obtained. Since the theoretical distribution of the efficiencyscore in DEA is usually unknown, in order to compare efficiencies between two types of DMUs,Brockett and Golany [13] proposed using the Mann–Whitney rank test that is nonparametric innature. (For further details, please refer to Cooper et al. [14])Considering a CATV firm as an infrastructure provider, we constructed the following models.
(For reference, we constructed models in which a CATV firm is considered a simple broadcastingoperator; model frameworks and results are provided in Appendix A.)
Infrastructure Model (I-Model):Inputs (5): Monetary value of broadcasting equipment.4
Capacity of trunk network (MHz*km).Capacity of distribution lines (MHz*km).Number of staff members necessary for maintenance and technical support.Number of staff members necessary for program production and editing.
Outputs (2): Total number of channels that subscribers can view (CH*households).Network capacity available for interactive services (MHz*households).
5
Reduced Infrastructure Model (RI-Model):Inputs (3): Monetary value of broadcasting equipment.
Capacity of network (MHz*km).Number of staff members for maintenance and technical support, production,and editing.
Outputs (2): Total number of channels that subscribers can view (CH*households).Network capacity available for interactive services (MHz*households).
It is worth stressing that technical efficiency as measured in the following sections relates to thelonger-term component of the CATV decision-making process and is merely a prerequisite for afirm’s overall financial success. In order to improve financial outcomes, a firm’s management hasto achieve sufficient overall efficiency, which, within the DEA framework, can be divided intotechnical efficiency and allocative efficiency. The relationship between these efficiency concepts is
4The related figures are summed using depreciation, opportunity cost of capital, lease fees and other associated costs,
each measured in constant 1990 prices.5 In the mid-1990s, a group of technological breakthroughs enabled CATV providers to construct network facilities
that provided interactive services with far greater efficiency. This new method is called ‘‘hybrid fiber and coaxial
(HFC)’’ and delivers approximately five times more interactive capacity than the previous standard; however, HFC
costs much more. In our analysis, we took this technological difference among CATV firms into account when
quantifying the ‘‘network capacity available for interactive services’’ of each operator.
T. Jitsuzumi, A. Nakamura / Socio-Economic Planning Sciences 37 (2003) 29–43 33

depicted in Fig. 1, where overall efficiency is equal to OR/OP, i.e., is a product of technicalefficiency (OQ/OP) and allocative efficiency (OR/OQ). In this article, we assume that a CATVfirm’s technical efficiency can be further subdivided into two components: one that relates to thelonger-term strategic decision on network construction, and the other for daily management.NCAPES, as obtained by the above models, measures the former.The primary reason we focused on the technical efficiency of CATV network construction is
that it is crucial information for practicing yardstick competition in terms of providing broadbandnetwork infrastructure for the Information Age. In addition, considering that CATV network-related decisions are future-oriented, as mentioned before, in order to measure related allocativeor overall efficiency, we need future price information that is highly uncertain. Policyrecommendations based on such information are far from reliable and thus impractical; this isanother reason for our focus on measuring technical efficiency.In the next section, we compare the CCR-I- and BCC-I-based NCAPESs with each firm’s
financial strength using the Mann–Whitney rank test. In the fourth section, we calculate NCN-I-C- and NCN-I-V-based NCAPESs and propose a mechanism for subsidies following a yardstickcompetition principle.
3. Financial health and construction efficiency scores
In the course of preparing a data set, we combined two data sources: CATV firms’ financialstatements submitted to MPT as stipulated by the Cable Television Broadcast Law, and aquestionnaire distributed in 1998.6 In addition, we conducted interviews with some CATV firmsas well as with manufacturers of network equipment in order to supplement the managerial (orqualitative) aspect. Table 1 shows summary statistics for all data obtained through thequestionnaire.
OInput x1
P
C
Input x2
Isoquant line (an efficient frontier)
Isocost line (p1x1+p2 x2)
R
Q
Fig. 1. Technical, allocative, and overall efficiency. Solid lines are segments of an isoquant that represents
technologically efficient combinations of inputs (x1; x2) for a prescribed amount of output. Dotted lines are isocost
lines assuming pi is the price of xi: P and Q are DMUo, and its projection on the efficient frontier, respectively, while
DMU C shows the cost-minimizing combination of inputs.
6The authors conducted a questionnaire analysis in November 1998. Questionnaire sheets were mailed to 418
operators; 351 operators (84%) responded.
T. Jitsuzumi, A. Nakamura / Socio-Economic Planning Sciences 37 (2003) 29–4334

Our interview revealed that there have been rapid advances in related information andcommunication technology. However, due to heavy installation and/or replacement costs forcable networks, cable operators have been slow to adopt state-of-the-art technology. Indeed, themajority of cables laid are of the 450MHz bandwidth first introduced in the early 1980s (Table 2);only 9% of our sample firms have adopted the new ‘‘hybrid fiber and coaxial’’ (HFC) systemintroduced in the mid-1990s. This situation agrees neatly with our analytical framework, whichassumes that a CATV firm’s decision-making consists of two mutually independent components:(a) a long-term strategic decision concerning network provisions, and (b) everyday managerialdecision-making; and that, when making decisions of the latter type, CATV firms must treat theformer type as exogenously fixed.Each firm provided at most three data points, as of FY95, FY96, and FY97. In the following
analysis, we treated each data point as independent of the others and employed data only fromfirms with more than three years of history, in order to avoid the disturbance effects of unstablestart-up firms—another finding from our interviews. Also, since a CATV business needs massiveinitial investment, in order to avoid a negative bias against young firms with comparatively largedepreciation burdens, we used ‘‘Earnings Before Interest, Tax, Depreciation, and Amortization toTurnover7 ratio’’ (EBITDA/T) as an index of financial performance. Considering the datarequirements for DEA (I-Model and RI-Model), we used 141 DMUs for further analysis.
Table 1
Summary statistics of sample firms (N ¼ 351)
FY 95 FY 96 FY 97 3 years total
Number of channels offered 27.45Ch 29.22 31.62 29.54
Number of independently produced channels 7.38Ch 7.73 7.98 7.72
Number of employees 19.26 21.13 22.85 21.16
Household coverage of network ðaÞ 56.62% 57.49 59.15 57.84
Household penetration ratio ðbÞ 19.82% 20.97 21.93 20.98
Occupancy of network ðb=aÞ 33.56% 34.71 35.75 34.75
Revenue share of broadcasting service 93.14% 93.30 93.81 93.44
Revenue share of telecommunication service 0.65% 0.65 0.78 0.70
Table 2
Length of cables laid
In the trunk network In the distribution network
Optical fiber cable 50,172 km (N ¼ 143) 55,047 km (N ¼ 21)
Coaxial cable, 770MHz bandwidths 664 km (N ¼ 13) 1156 km (N ¼ 11)
Coaxial cable, 750MHz bandwidths 6196 km (N ¼ 37) 362,634 km (N ¼ 30)
Coaxial cable, 550MHz bandwidths 194,155 km (N ¼ 17) 389,250 km (N ¼ 16)
Coaxial cable, 450MHz bandwidths 538,262 km (N ¼ 126) 2,289,883 km (N ¼ 108)
Coaxial cable, 350MHz bandwidths 1210 km (N ¼ 10) 1754 km (N ¼ 9)
Coaxial cable, 300MHz bandwidths 62,380 km (N ¼ 33) 9874 km (N ¼ 23)
Coaxial cable, 250MHz bandwidths 428 km (N ¼ 11) 901 km (N ¼ 9)
7 ‘‘Turnover’’ is the British term for what Americans refer to as ‘‘Sales.’’
T. Jitsuzumi, A. Nakamura / Socio-Economic Planning Sciences 37 (2003) 29–43 35

To simplify the analysis, we divided the DMUs into four groups according to EBITDA/T: Thefirst consisted of firms with the highest ratios; conversely, all members of the fourth group hadnegative ratios. Table 3 shows summary statistics for the subgroups. (We treated firms in thefourth group, which had negative EBITDAs, as outliers and omitted them from further analysis.)We statistically tested the degree of coincidence between the EBITDA/T-based orders and theDEAs y�-based orders (NCAPES-based orders) using the Mann–Whitney rank test. The resultswere contrary to our ex ante expectations: in the CCR-based analysis, the first (most profitable)group’s NCAPESs were significantly lower than those of the others; indeed, the second group hadthe highest NCAPESs (Table 4). In terms of the BCC framework, most of the differences betweensubgroups were insignificant (Table 5).These results indicate that the financial performance of a CATV operator does not move
together with its NCAPES. One possible reason for these discrepancies is that NCAPES, which
Table 3
Summary statistics of subgroups
Number of sample firms First group Second Third Fourth
33 33 32 43
EBITDA/T 35.0% 19.5 8.4 �35.7
Market environment
Area 211.2/km2 194.1 199.4 173.3
Population 150,816 188,382 110,058 180,118
Number of households 53,336 71,279 38,737 67,218
Population density 989.7/km2 2070.5 1153.3 2713.4
Household density 339.9/km2 848.8 415.7 1075.3
Population per household 3.0 2.8 3.0 2.8
Population density area ratio 12.7% 25.1 10.4 28.9
Taxable income per household 4,339,282 yen 4,359,350 4,302,815 3,978,887
Number of terrestrial TV channels in the Area 5.9 9.2 7.4 8.1
Business operation
Household coverage of network 63.9% 68.6 67.1 55.3
Household penetration ratio 34.3% 21.5 25.9 11.9
Occupancy of network 50.1% 32.1 41.3 21.2
Operating period 13.2 years 9.8 8.8 8.8
Number of channels offered 27 29 27 28
Table 4
Result of Mann–Whitney rank test of CCR-based NCAPESs
I-Model First grouposecond group (**) First groupothird group (*)
Second group>third group (**)
RI-Model First grouposecond group (**) First group=third group
Second group>third group (**)
*indicates po0:1 and **po0:05:
T. Jitsuzumi, A. Nakamura / Socio-Economic Planning Sciences 37 (2003) 29–4336

measures longer-term technical efficiency, is no more than a necessary condition for achievingoverall efficiency (which relates to financial performance). High overall efficiency (i.e., greaterprofit) cannot be attained without a shorter-term-related technical efficiency accompanied with anallocative efficiency, as described in the preceding section.It may be worth mentioning that the difference between CCR- and BCC-based results reflects
uneven scale-distribution between subgroups. To confirm this point (see Appendix B), wecalculate Banker’s Most Productive Scale Size (MPSS) for NCAPES [15], and show that the ratioof firms in MPSS is not related to accounting-based order among subgroups; and moreconcretely, that the share of DMUs that corresponds to MPSS is smaller in the first and thirdgroups than in the second. This helps explain why the first and third groups record comparativelybetter efficiency from the BCC model than those from the CCR model. This also identifies selectedfeatures of a scale economy for CATV operations; however, as scale is not controllable forindividual firms under the current regulatory framework, we make no further inquiry in thisregard.8
A key implication of these results is that any yardstick-competition-based interventionusing an accounting-based scheme cannot work as expected because financial indexes cannotact as an effective proxy for NCAPES. In order to improve the performance of such anintervention, an alternative mechanism relying on NCAPES itself, rather than imperfect proxies,is required.
4. Exogeneity-free network capacity provision efficiency scores (NCAPESs) and an optimal support
mechanism
As mentioned earlier, in order to establish an optimal support mechanism based on yardstickcompetition principles, it is necessary to construct NCAPESs free of exogenous factors. Throughour interviews, we identified the two most important exogenous factors in network construction:household density and number of households in the area. Using these two factors asuncontrollable variables for NCN-I-C and NCN-I-V models, we calculated exogeneity-freeNCAPESs, and conducted a Mann–Whitney rank test among the EBITDA/T-based subgroups.Tables 6 and 7 show the results, which indicate that most of the tendencies of the CCR and BCCmodels’ results (shown inTables 4 and 5) still prevail.
Table 5
Result of Mann–Whitney rank test of BCC-based NCAPESs
I-Model First group=second group First group=third group
Second group>third group (**)
RI-Model First grouposecond group (*) First group=third group
Second group=third group
*indicates po0:1 and **po0:05:
8 It should be stressed that this remains an important task for future research.
T. Jitsuzumi, A. Nakamura / Socio-Economic Planning Sciences 37 (2003) 29–43 37

Our primary purpose here is to construct optimal support mechanisms for CATV operators. Asexplained previously, the idea of yardstick competition is to compare the performance of firmsunder similar conditions and to offer some form of reward to better-performing firms, if needed.Under such a principle, one concludes that when an NCN-based NCAPES is unity (i.e., the firm isamong the most efficient after its circumstances are taken into account), the firm is qualified toreceive sufficient governmental support to cover its financial losses.Governmental support for inefficient firms, on the other hand, is more debatable. The yardstick
rule suggests that the optimal amount of subsidy for such inefficient firms is equal to the mostefficient firm’s loss under the same circumstances. However, in a regional monopolistic settingwhere no two firms are operating in the same area, we have to assume a ‘‘synthesized efficiententity’’ that has the same exogenous conditions as the DMUo and then calculate its ‘‘optimalloss’’. The simplest way to obtain such a ‘‘synthesized efficient entity’’ is to project the DMUoonto the efficient frontier, maintaining the exogenous conditions unchanged. The next step is toestimate the ‘‘optimal loss’’ that such a ‘‘synthesized efficient entity’’ suffers. Although there mightbe numerous ways to calculate such an ‘‘optimal loss’’, we again propose a simple concept:namely, the loss is assumed to be the weighted average of losses suffered by firms that belong tothe DMUo’s reference set. We concede that our proposal may seem na.ıve in its simplicity;however, such simplicity guarantees practicability—highly desirable for real-world policyrecommendations.Fig. 2 shows how our proposal works: A is an inefficient DMU (DMUo) and Firms B and C
compose the reference set for A. By projecting A towards the efficient frontier with theuncontrollable variables (measured along the horizontal axis) unchanged, we can find a‘‘synthesized efficient entity’’, D. (For simplicity, we assume that the scale of each firm isidentical.) If Firm A suffers a loss of $1 million, B of $0.5 million, and C of $0.2 million; and if the
Table 7
Result of Mann–Whitney rank test of NCN-I-V-based NCAPESs
I-Model First group=second group First group=third group
Second group=third group
RI-Model First grouposecond group (*) First groupothird group (*)
Second group=third group
*indicates po0:1.
Table 6
Result of Mann–Whitney rank test of NCN-I-C-based NCAPESs
I-Model First grouposecond group (**) First groupothird group (**)
Second group=third group
RI-Model First grouposecond group (**) First groupothird group (**)
Second group=third group
**indicates po0:05:
T. Jitsuzumi, A. Nakamura / Socio-Economic Planning Sciences 37 (2003) 29–4338
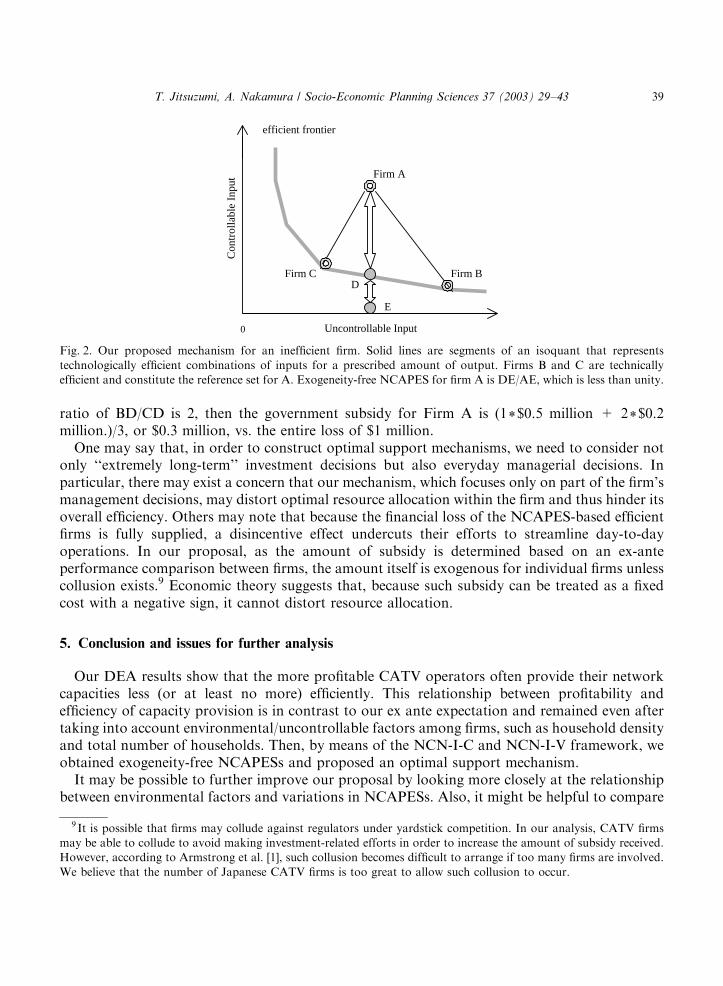
ratio of BD/CD is 2, then the government subsidy for Firm A is (1*$0.5 million + 2*$0.2million.)/3, or $0.3 million, vs. the entire loss of $1 million.One may say that, in order to construct optimal support mechanisms, we need to consider not
only ‘‘extremely long-term’’ investment decisions but also everyday managerial decisions. Inparticular, there may exist a concern that our mechanism, which focuses only on part of the firm’smanagement decisions, may distort optimal resource allocation within the firm and thus hinder itsoverall efficiency. Others may note that because the financial loss of the NCAPES-based efficientfirms is fully supplied, a disincentive effect undercuts their efforts to streamline day-to-dayoperations. In our proposal, as the amount of subsidy is determined based on an ex-anteperformance comparison between firms, the amount itself is exogenous for individual firms unlesscollusion exists.9 Economic theory suggests that, because such subsidy can be treated as a fixedcost with a negative sign, it cannot distort resource allocation.
5. Conclusion and issues for further analysis
Our DEA results show that the more profitable CATV operators often provide their networkcapacities less (or at least no more) efficiently. This relationship between profitability andefficiency of capacity provision is in contrast to our ex ante expectation and remained even aftertaking into account environmental/uncontrollable factors among firms, such as household densityand total number of households. Then, by means of the NCN-I-C and NCN-I-V framework, weobtained exogeneity-free NCAPESs and proposed an optimal support mechanism.It may be possible to further improve our proposal by looking more closely at the relationship
between environmental factors and variations in NCAPESs. Also, it might be helpful to compare
Uncontrollable Input
Firm A
0
Firm B Firm C
Con
trol
labl
e In
put
efficient frontier
D
E
Fig. 2. Our proposed mechanism for an inefficient firm. Solid lines are segments of an isoquant that represents
technologically efficient combinations of inputs for a prescribed amount of output. Firms B and C are technically
efficient and constitute the reference set for A. Exogeneity-free NCAPES for firm A is DE/AE, which is less than unity.
9 It is possible that firms may collude against regulators under yardstick competition. In our analysis, CATV firms
may be able to collude to avoid making investment-related efforts in order to increase the amount of subsidy received.
However, according to Armstrong et al. [1], such collusion becomes difficult to arrange if too many firms are involved.
We believe that the number of Japanese CATV firms is too great to allow such collusion to occur.
T. Jitsuzumi, A. Nakamura / Socio-Economic Planning Sciences 37 (2003) 29–43 39

our DEA-based NCAPESs with other efficiency indexes. Although limited by the assumption that noallocative inefficiency exists, total factor productivity (TFP) could be a candidate for such an index.Needless to say, our results have to be interpreted relative to the inputs and outputs included in
our DEA calculation. Using alternative inputs and outputs would have resulted in entirelydifferent NCAPESs, while other uncontrollable variables would generate another set ofexogeneity-free NCAPESs. Assumptions about scale economies also affect the outcome. As wecould not determine the degree of scale economies of CATV networks based on the available dataset, we used two types of assumptions (constant returns-to-scale and variable returns-to-scale) andshowed outcomes for both; we found that 38–49% of the DMUs in a reference set were differentbetween the two settings. (This reflects the uneven distribution of scales among subgroups, aspreviously discussed.) Considering the primary objective of our research, these limitations shouldnot be particularly critical to our analysis; however, they must be addressed in any future efforts.Moreover, Sueyoshi questioned a straightforward application of Mann–Whitney rank-order
statistics on DEA scores, especially when there are many efficient DMUs. As an alternative, heproposed an index number approach [16]. Since this paper’s primary interest is to show a DEA-based framework for governmental decision-making, such an approach was not pursued.However, we note that Sueyoshi’s methodology may be well suited to future research efforts wemight undertake.Some of the practical aspects of model selection should be noted here; in particular, how to
determine the optimal number of inputs and outputs. A larger model that has more inputs andoutputs can be expected to generate NCAPESs that reflect each DMU’s features more accuratelyand thus allow the user to make closer observations. However, a larger model requires more timeand cost to apply. In the real world, sometimes the only option is to employ aggregated data,which costs less but offers less accuracy. Given this tradeoff between accuracy and cost, it isimportant to identify an appropriate balance, depending on user needs. For example, from thestandpoint of regulators considering supportive intervention, the cost of data gathering is not aprimary issue; the most important is to find the right reference set and an accurate ratio amongreferenced DMUs. Here, a larger model is preferred. On the other hand, from a manager’s orconsultant’s viewpoint, as long as the model can specify an appropriate reference set, costminimization becomes the first priority. This is the case since managerial recommendationsusually take the form of mimicking the better practices of other firms and are likely less concernedwith the accurate amount of ‘‘optimal loss’’. In this case, a simpler model is more acceptable. Inorder to show how much model size affects the accuracy with which the ‘‘best’’ DMUs areidentified in a reference set, we compared results from the larger I-Model (5 inputs and 2 outputs)and the smaller RI-Model (3 inputs and 2 outputs). The rate of coincidence of DMUs in a givenreference set was 71–76%, indicating that when the number of inputs and outputs was reduced by29%, the model’s accuracy declined by 24–49%.Finally, it is hoped that this research will make a meaningful contribution to the field of applied
DEA, and assist policymakers in guiding governmental efforts within the private sector.
Acknowledgements
The authors would like to thank Professor Kaoru Tone of National Graduate Institute forPolicy Studies for his valuable advice as well as his generosity in allowing his computer program
T. Jitsuzumi, A. Nakamura / Socio-Economic Planning Sciences 37 (2003) 29–4340

to be used for our DEA measurements. Detailed comments from the referees and the Editor-in-Chief led to notable improvements in the paper. We also appreciate Professor Toshiyuki Sueyoshiat New Mexico Institute of Technology (USA) for his constructive comments. Support for thisresearch from the Institute for Posts and Telecommunications Policy and the Daiwa Institute ofResearch is gratefully acknowledged.
Appendix A. Broadcasting models
For reference, we set up the following two models, B-Model and RB-Model, which treat aCATV operator as a simple broadcasting service provider, and then applied the Mann–Whitneytest. Results of the test are summarized in Tables 8 and 9.
Broadcasting Model (B-Model):Inputs (5): Monetary value of broadcasting equipment.
Capacity of trunk network (MHz*km).Capacity of distribution lines (MHz*km).Number of staff members necessary for maintenance and technical support.Number of staff members necessary for program production and editing.
Output (1): Total number of channels that subscribers can view (CH*households).
Reduced Broadcasting Model (RB-Model):Inputs (3): Monetary value of broadcasting equipment.
Capacity of network (MHz*km).Number of staff for maintenance and technical support, production, and editing.
Output (1): Total number of channels that subscribers can view (CH*households).
Table 8
Result of Mann–Whitney rank test of CCR-based NCAPESs
B-Model First grouposecond group (**) First groupothird group (*)
Second group>third group (**)
RB-Model First grouposecond group (**) First group=third group
Second group>third group (**)
*indicates po0:1 and **po0:05:
Table 9
Result of Mann–Whitney rank test of BCC-based NCAPESs
B-Model First group=second group First group=third group
Second group>third group (**)
RB-Model First group=second group First group=third group
Second group=third group
**indicates po0:05:
T. Jitsuzumi, A. Nakamura / Socio-Economic Planning Sciences 37 (2003) 29–43 41
Appendix B. Most productive scale size (MPSS)
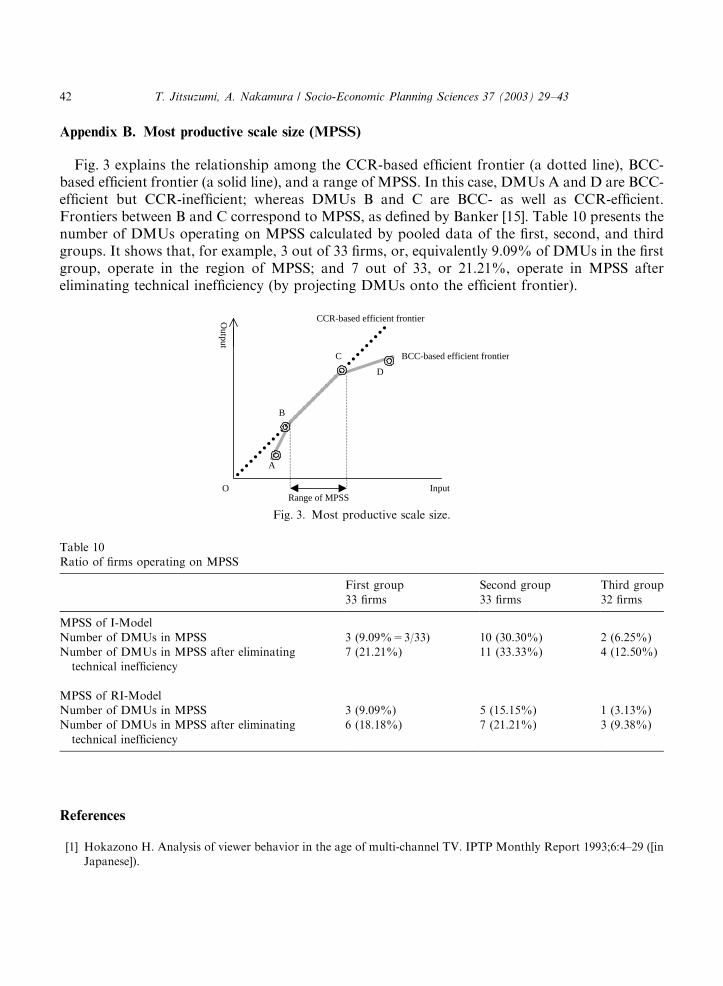
Fig. 3 explains the relationship among the CCR-based efficient frontier (a dotted line), BCC-based efficient frontier (a solid line), and a range of MPSS. In this case, DMUs A and D are BCC-efficient but CCR-inefficient; whereas DMUs B and C are BCC- as well as CCR-efficient.Frontiers between B and C correspond to MPSS, as defined by Banker [15]. Table 10 presents thenumber of DMUs operating on MPSS calculated by pooled data of the first, second, and thirdgroups. It shows that, for example, 3 out of 33 firms, or, equivalently 9.09% of DMUs in the firstgroup, operate in the region of MPSS; and 7 out of 33, or 21.21%, operate in MPSS aftereliminating technical inefficiency (by projecting DMUs onto the efficient frontier).
References
[1] Hokazono H. Analysis of viewer behavior in the age of multi-channel TV. IPTP Monthly Report 1993;6:4–29 ([in
Japanese]).
Input
C
Output
CCR-based efficient frontier
A
B
BCC-based efficient frontier
D
ORange of MPSS
Fig. 3. Most productive scale size.
Table 10
Ratio of firms operating on MPSS
First group Second group Third group
33 firms 33 firms 32 firms
MPSS of I-Model
Number of DMUs in MPSS 3 (9.09%=3/33) 10 (30.30%) 2 (6.25%)
Number of DMUs in MPSS after eliminating
technical inefficiency
7 (21.21%) 11 (33.33%) 4 (12.50%)
MPSS of RI-Model
Number of DMUs in MPSS 3 (9.09%) 5 (15.15%) 1 (3.13%)
Number of DMUs in MPSS after eliminating
technical inefficiency
6 (18.18%) 7 (21.21%) 3 (9.38%)
T. Jitsuzumi, A. Nakamura / Socio-Economic Planning Sciences 37 (2003) 29–4342

[2] Oto Y, Sato T. Issues on a program rating survey system and a trend towards multi-channel environment: An
analysis based on a survey of CATV subscribers. Keiei-Shikiho (Quarterly Communications of the National
Association of Commercial Broadcasters in Japan) 1993. p. 8–11 [in Japanese].
[3] Ministry of Posts and Telecommunications. Recent Trends in Cable Television. URL: http://info.mpt.go.jp/eng
(2000).
[4] Charnes A, Cooper WW, Rhodes E. Measuring the efficiency of decision making units. European Journal of
Operational Research 1978;2:429–44.
[5] Tone K. Data envelopment analysis. Tokyo, Japan: Nikkagiren, 1993 [in Japanese].
[6] Goto M, Tsutsui M. Comparison of productive and cost efficiencies among Japanese and US electrical utilities.
Omega 1998;26:177–94.
[7] Sueyoshi T. Tariff structure of Japanese electric power companies: an empirical analysis using DEA. European
Journal of Operational Research 1999;118:350–74.
[8] Sueyoshi T. Divesture of Nippon Telegraph and Telephone. Management Science 1996;42:1326–51.
[9] Sueyoshi T. Measuring efficiencies and returns to scale of Nippon Telegraph and Telephone in production and cost
analysis. Management Science 1997;43:779–96.
[10] Sueyoshi T. Privatization of Nippon Telegraph and Telephone: was it a good policy decision? European Journal of
Operational Research 1998;107:45–61.
[11] Armstrong M, Cowan S, Vickers J. Regulatory reform: economic analysis and British experience. Cambridge, MA:
MIT Press, 1994.
[12] Banker RD, Charnes A, Cooper WW. Some models for estimating technical and scale inefficiencies in data
envelopment analysis. Management Science 1984;30:1078–92.
[13] Brockett PL, Golany B. Using rank statistics for determining programmatic efficiency differences in data
envelopment analysis. Management Science 1996;42:466–72.
[14] Cooper WW, Seiford LM, Tone K. Data envelopment analysis: a comprehensive text with models, applications,
references and DEA-solver software. Boston, MA: Kluwer Academic Publishers, 1999.
[15] Banker RD. Estimating most productive scale size using data envelopment analysis. European Journal of
Operational Research 1984;17:35–44.
[16] Sueyoshi T. DEA non-parametric ranking test and index measurement slack-adjusted DEA and an application to
Japanese agriculture cooperatives. Omega 1999;27:315–26.
T. Jitsuzumi, A. Nakamura / Socio-Economic Planning Sciences 37 (2003) 29–43 43