MEASURING CMB POLARIZATION WITH QUIET: THE Q/U...
10
May 31, 2010 18:55 WSPC - Proceedings Trim Size: 9.75in x 6.5in main 1 MEASURING CMB POLARIZATION WITH QUIET: THE Q/U IMAGING EXPERIMENT LAURA NEWBURGH FOR THE QUIET COLLABORATION Columbia University, 550 W 120th St., New York, NY 10027, USA [email protected] Phase I of the Q/U Imaging ExperimenT (QUIET) measures the Cosmic Microwave Background polarization anisotropy spectrum at angular scales 25 ℓ 1000. QUIET has deployed two independent receiver arrays. The 40-GHz array took data between Oc- tober 2008 and June 2009. The 90-GHz array was deployed in June 2009 and observations are ongoing. Described in this proceeding are the instrument, analysis procedures, and expected science reach for the QUIET Phase I arrays. We also briefly discuss the science forecasts for QUIET Phase II in which arrays roughly an order-of-magnitude larger will be deployed. Keywords : telescopes, cosmic microwave background, gravitational waves, millimeter wave, cosmology: observations, cosmology: inflation, instrumentation:polarimeters 1. Science Motivation Anisotropies present in the polarized Cosmic Microwave Background (CMB) can be used to constrain models describing the physics in the very early Universe. Maps of the polarized CMB can be decomposed into E-mode (curl-free) and B-mode (divergence-free) components. Measurements of the E-mode anisotropy spectrum will break degeneracies between cosmological parameters when used in conjunction with the CMB temperature anisotropy spectrum. Many inflation models predict that gravity waves generated during inflation will leave a unique signature in the B-mode polarization spectrum near angular scales of ℓ ≃ 100. In those models, measurement of the ratio, r , of the amplitude of the B- to E-mode spectrum will yield the energy-scale of inflation. Placing upper limits of r <0.01 can rule out large classes of inflationary models. 2. QUIET Instrument and Observations 2.1. QUIET Instrument The QUIET instrument consists of two independent receivers. Each receiver com- prises a hexagonal array of High Electron Mobility Transistor (HEMT)-based po- larimeters: one array operates at 40 GHz (Q band) with 19 polarimeters and the other at 90 GHz (W band) with 90 polarimeters. The Q-band receiver dedicates one pair of polarimeters (hereafter: TT channels) to the observation of the CMB temperature anisotropy spectrum. The W-band receiver has three pairs of TT chan- nels. The external optics are a 1.4-m Cross-Dragone reflector design with FWHM beamwidth of 27 arcmin at Q-band and 12 arcmin at W-band. Salient characteristics of QUIET Phase I are shown in Table 1. As shown in a cut-away view of the W-band cryostat (Fig. 1), light enters the
Transcript of MEASURING CMB POLARIZATION WITH QUIET: THE Q/U...

May 31, 2010 18:55 WSPC - Proceedings Trim Size: 9.75in x 6.5in main
1
MEASURING CMB POLARIZATION WITH QUIET:
THE Q/U IMAGING EXPERIMENT
LAURA NEWBURGH FOR THE QUIET COLLABORATION
Columbia University, 550 W 120th St., New York, NY 10027, [email protected]
Phase I of the Q/U Imaging ExperimenT (QUIET) measures the Cosmic MicrowaveBackground polarization anisotropy spectrum at angular scales 25 . ℓ . 1000. QUIEThas deployed two independent receiver arrays. The 40-GHz array took data between Oc-tober 2008 and June 2009. The 90-GHz array was deployed in June 2009 and observationsare ongoing. Described in this proceeding are the instrument, analysis procedures, andexpected science reach for the QUIET Phase I arrays. We also briefly discuss the scienceforecasts for QUIET Phase II in which arrays roughly an order-of-magnitude larger willbe deployed.
Keywords: telescopes, cosmic microwave background, gravitational waves, millimeterwave, cosmology: observations, cosmology: inflation, instrumentation:polarimeters
1. Science Motivation
Anisotropies present in the polarized Cosmic Microwave Background (CMB) can
be used to constrain models describing the physics in the very early Universe. Maps
of the polarized CMB can be decomposed into E-mode (curl-free) and B-mode
(divergence-free) components. Measurements of the E-mode anisotropy spectrum
will break degeneracies between cosmological parameters when used in conjunction
with the CMB temperature anisotropy spectrum. Many inflation models predict
that gravity waves generated during inflation will leave a unique signature in the
B-mode polarization spectrum near angular scales of ℓ ≃ 100. In those models,
measurement of the ratio, r , of the amplitude of the B- to E-mode spectrum will
yield the energy-scale of inflation. Placing upper limits of r <0.01 can rule out large
classes of inflationary models.
2. QUIET Instrument and Observations
2.1. QUIET Instrument
The QUIET instrument consists of two independent receivers. Each receiver com-
prises a hexagonal array of High Electron Mobility Transistor (HEMT)-based po-
larimeters: one array operates at 40 GHz (Q band) with 19 polarimeters and the
other at 90 GHz (W band) with 90 polarimeters. The Q-band receiver dedicates
one pair of polarimeters (hereafter: TT channels) to the observation of the CMB
temperature anisotropy spectrum. The W-band receiver has three pairs of TT chan-
nels. The external optics are a 1.4-m Cross-Dragone reflector design with FWHM
beamwidth of 27 arcmin at Q-band and 12 arcmin at W-band. Salient characteristics
of QUIET Phase I are shown in Table 1.
As shown in a cut-away view of the W-band cryostat (Fig. 1), light enters the

May 31, 2010 18:55 WSPC - Proceedings Trim Size: 9.75in x 6.5in main
2
Fig. 1. Cut-away of the original design of the W-band cryostat, internal components are labeledaccordingly. The vacuum window is an anti-reflection coated polyethylene sheet. The W-bandcryostat has a diameter of 71 cm and length of 66 cm. The Q-band cryostat has the same diameterand length of 71 cm.
cryostat through an expanded-Teflon coated high-density polyethylene window and
impinges upon a set of corrugated feedhorns. The feedhorn arrays are constructed
from a series of thick, corrugated plates machined and diffusion bonded together.
Detailed measurements of the return loss and beam characteristics of these horns
show that they perform well in comparison to a electroformed horn of the same
design, while the combined cost of machining and diffusion bonding these arrays is
at least an order of magnitude less than the cost of producing the same number of
electroformed feedhorns. After the feedhorns, the light is then directed into septum
polarizer OMTs, which separate radiation into left- and right-circularly polarized
components (Ref. 1), and is guided into the two input legs of a QUIET polarimeter.
The signal is amplified, phase-modulated, and read out in each QUIET polarime-
ter (discussed below). The active components inside each polarimeter are biased
by electronics housed in a thermally-regulated enclosure. Receiver and telescope
encoder data are read at 100 Hz, the housekeeping and weather data at 1 Hz.
Table 1. QUIET Phase I instrument and observations.
Frequencies 40 / 90 GHz# of Detectors 17 Polarization and 2 TT / 84 Polarization and 6 TTTelescope Cross-DragoneAngular Resolution 27 arcmin / 12 arcminField Centers 181◦/-39◦, 78◦/-39◦, 12◦/-48◦, 341◦/-36◦ (J2000 RA/Dec)Field Size 15◦ × 15◦
Instrument Sensitivity 64µK√
s / 57µK√
s
WMAP, DASI, CBI, and CAPMAP (Refs. 2, 3, 4, 5) used HEMT-based po-
larimeters, but QUIET employs a revolutionary compact-profile design (Ref. 6)
suitable for arrays. The QUIET polarimeter design replaces waveguide-block com-
ponents and connections with strip-line coupled devices, producing modules with a

May 31, 2010 18:55 WSPC - Proceedings Trim Size: 9.75in x 6.5in main
3
(a) (b)
(c)
Fig. 2. a: Schematic of signal processing components in a QUIET polarimeter. b: Internal com-ponents of a Q-band polarimeter. c: W-band array of polarimeters.
footprint of 2.5cm×2.5cm (W-band) and 5cm×5cm (Q-band). A schematic of the
signal processing in a single QUIET polarimeter is shown in Fig. 2(a) and a pho-
tograph of a Q-band polarimeter is shown in Fig. 2(b) with relevant components
labeled. Radiation from the septum polarizers is incident on a set of waveguide
probes, one on each leg of the polarimeter. The signal on each leg is amplified in-
dependently through three low-noise amplification stages, and is separately phase
switched: one leg at 4 kHz, the other at 50 Hz. The signals enter a 180◦ hybrid
coupler and the outputs from the coupler are split. One half of each leg is measured
in a “Q” detector diode, while the other half continues into a 90◦ hybrid coupler
and is detected in a “U” detector diode.
Each diode is differenced at the phase-switching rate. Differencing the signal
measured on the “Q” detector diodes at 4 kHz corresponds to measuring the Stokes
±Q polarization parameters. The ±U polarization parameters are found by differ-
encing the second pair of detector diodes. Summing instead of differencing yields
a measurement of total intensity. High frequency differencing limits contributions
from more slowly varying noise and offsets, resulting in data power spectra with
1/f knees considerably below the telescope scan frequencies (≃ 0.1 Hz). QUIET
employs an additional differencing at 50 Hz to remove systematic contamination

May 31, 2010 18:55 WSPC - Proceedings Trim Size: 9.75in x 6.5in main
4
arising from, for example, transmission imbalances between the polarimeter legs
and is accomplished without loss of signal. Electronic phase modulation has helped
to keep the optical chain simple and QUIET free from systematics resulting from
polarization modulation via optical components. The W-band array is pictured in
Fig. 2(c) - with 90 polarimeters, it is the largest HEMT-based array yet deployed.
2.2. QUIET Observations
QUIET observations are performed from the Chajnantor Test Facility (CTF). The
CTF is located at an altitude of 5080m in the Atacama Desert in northern Chile.
Between July and September 2008, the Q-band receiver was deployed to the CTF
and calibration and commissioning observations were performed. Science data were
collected between October 2008 and June 2009. The Q-band receiver was removed
and replaced by the W-band receiver in June 2009 and observations are currently
underway. We logged over 3000 hours of CMB data during the Q-band observing
season. We have collected more than 3000 hours of W-band data and anticipate
collecting 4500 additional hours by the end of December 2010.
The telescope mount can rotate in three independent axes (azimuth, elevation,
and boresight, or ‘deck’, rotation). QUIET observes at deck angles {30◦, 75◦, 120◦,
165◦} over the season; stepping the deck angle by 45◦ rotates the Stokes Q into
Stokes U parameters.
We scan four CMB patches (2a, 4a, 6a, 7b) and two Galactic patches (Gb, Gc),
each covering 15◦ × 15◦. The QUIET patch coordinates are given in Table 1 and
shown in Fig. 3. QUIET patches were selected for their low synchrotron emission as
measured by WMAP and because they remain at least 30◦ from the Sun and Moon
throughout the year, allowing uninterrupted observations throughout the season.
We employ a fixed-elevation, azimuth-scanning technique: a patch is scanned
in azimuth as it drifts through the beam, which generally takes ≃1.5 hours. The
telescope then re-tracks the patch and begins another scan. By scanning at constant
elevation for each patch scan, we observe through a constant column density of
atmosphere and ensure a stable atmospheric contribution (during periods of good
Fig. 3. QUIET sky patches (circles), plotted overthe WMAP Q-band temperature map (Ref. 10), rangefrom 0 to 2 mK.
Fig. 4. The Fourier transform of atypical QUIET scan for a single detec-tor diode of one polarimeter.

May 31, 2010 18:55 WSPC - Proceedings Trim Size: 9.75in x 6.5in main
5
weather) to a given observation.
A Fourier transform of a typical data stream from one diode during a 1.5-hour
scan of patch 6a is shown in Fig. 4. High-pass and low-pass filters are applied
during data analysis, so the high frequency noise and 1/f contributions to the noise
spectrum are removed. QUIET operates the telescope at its maximum slew rate of
6◦/sec, resulting in scan frequencies ≃ 0.1 Hz. These are significantly higher than
typical instrument knee frequencies (≃0.02 Hz), such that we scan in the white-noise
regime of the detectors.
2.3. Calibration and Pointing
We dedicate ≃10% of our observing time to calibration measurements. The calibra-
tion sources are described below, and the Q-band calibration scheme is summarized
in Table 2.• Tau A Tau A is one of our primary absolute calibrators. The polarized flux of
Tau A is measured at Q-band by WMAP within ±2.7% (Ref. 7). Extrapolating
to our polarimeter central frequencies gives absolute reponsivity within 7% for
any measurement.
• The Moon We use the Moon both as an absolute and relative calibrator. Using
a model of polarized emission from the Moon, we can determine the absolute po-
larimeter angles within ±2◦. These full-array scans also provide a measurement
of relative responsivities between the central polarimter (which has frequent ab-
solute responsivity measured from Tau A) and the other polarimeters.
• Mini Sky-dips We perform mini sky-dips once per patch scan (once per ≃1.5
hours). Each mini sky-dip consists of nodding the telescope in elevation by a few
degrees causing the instrument to look through different air masses. The inten-
sity channels of the polarimeters will measure the resulting change in atmospheric
temperature. Using the statistical power from the large number of mini-sky-dips
performed throughout the season we can investigate a variety of instrument char-
acteristics, including the variation of reponsivity with respect to amplifier-bias
board temperature.
• Wire grid polarizer At the end of the Q-band season, we performed one mea-
surement with a wire-grid polarizer, which polarizes incoming radiation and re-
sults in a polarized signal of a few Kelvin. We placed the polarizer on the front
face of the cryostat and rotated the grid around the boresight, the modulated po-
larized signal is then measured by the polarimeters. In addition, bias voltages for
the W-band array were optimized for signal-to-noise using this polarized signal.
• Jupiter, RCW38, and Venus Jupiter, RCW38, and Venus are used as calibra-
tors for the TT channels. We cannot use Jupiter as a polarization calibrator due
to a combination of its low polarization flux, our beam size, and our sensitivity.
We use Moon and Patch Gc observations with all polarimeters and Jupiter measure-
ments with the TT channels for pointing. The Jupiter observations are particularly
useful for pointing because Jupiter is not extended at our resolution, and because
the TT channels are located ≃ 4◦ away from the boresight, providing a larger lever
May 31, 2010 18:55 WSPC - Proceedings Trim Size: 9.75in x 6.5in main
6
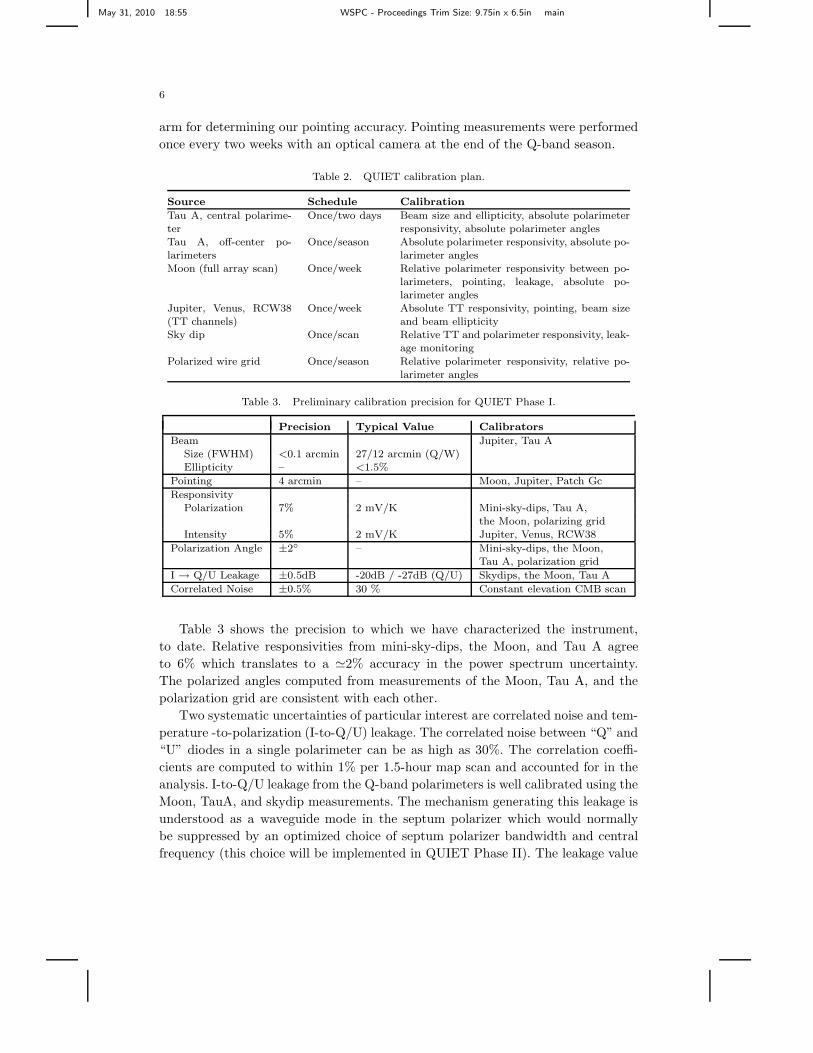
arm for determining our pointing accuracy. Pointing measurements were performed
once every two weeks with an optical camera at the end of the Q-band season.
Table 2. QUIET calibration plan.
Source Schedule Calibration
Tau A, central polarime-ter
Once/two days Beam size and ellipticity, absolute polarimeterresponsivity, absolute polarimeter angles
Tau A, off-center po-larimeters
Once/season Absolute polarimeter responsivity, absolute po-larimeter angles
Moon (full array scan) Once/week Relative polarimeter responsivity between po-larimeters, pointing, leakage, absolute po-larimeter angles
Jupiter, Venus, RCW38(TT channels)
Once/week Absolute TT responsivity, pointing, beam sizeand beam ellipticity
Sky dip Once/scan Relative TT and polarimeter responsivity, leak-age monitoring
Polarized wire grid Once/season Relative polarimeter responsivity, relative po-larimeter angles
Table 3. Preliminary calibration precision for QUIET Phase I.
Precision Typical Value Calibrators
Beam Jupiter, Tau ASize (FWHM) <0.1 arcmin 27/12 arcmin (Q/W)Ellipticity – <1.5%
Pointing 4 arcmin – Moon, Jupiter, Patch Gc
ResponsivityPolarization 7% 2 mV/K Mini-sky-dips, Tau A,
the Moon, polarizing gridIntensity 5% 2 mV/K Jupiter, Venus, RCW38
Polarization Angle ±2◦ – Mini-sky-dips, the Moon,Tau A, polarization grid
I → Q/U Leakage ±0.5dB -20dB / -27dB (Q/U) Skydips, the Moon, Tau A
Correlated Noise ±0.5% 30 % Constant elevation CMB scan
Table 3 shows the precision to which we have characterized the instrument,
to date. Relative responsivities from mini-sky-dips, the Moon, and Tau A agree
to 6% which translates to a ≃2% accuracy in the power spectrum uncertainty.
The polarized angles computed from measurements of the Moon, Tau A, and the
polarization grid are consistent with each other.
Two systematic uncertainties of particular interest are correlated noise and tem-
perature -to-polarization (I-to-Q/U) leakage. The correlated noise between “Q” and
“U” diodes in a single polarimeter can be as high as 30%. The correlation coeffi-
cients are computed to within 1% per 1.5-hour map scan and accounted for in the
analysis. I-to-Q/U leakage from the Q-band polarimeters is well calibrated using the
Moon, TauA, and skydip measurements. The mechanism generating this leakage is
understood as a waveguide mode in the septum polarizer which would normally
be suppressed by an optimized choice of septum polarizer bandwidth and central
frequency (this choice will be implemented in QUIET Phase II). The leakage value

May 31, 2010 18:55 WSPC - Proceedings Trim Size: 9.75in x 6.5in main
7
is constant through the season and suppressed by our scan strategy, which includes
sky rotations and deck rotations. We have demonstrated effective removal of this
leakage in our map-making stage, and its impact on the phase I science goals is negli-
gible (discussed in future papers, in preparation). Simulations of cross-polar leakage
from optics show this to be constrained to <0.3%. All instrument characteristics
are consistent with the phase I science goals for the Q-band array.
3. QUIET Data Analysis and Science Prospects
Data reduction and analysis are performed on each patch using two independent
pipelines, one employing maximum-likelihood map-making and power spectrum es-
timation (Ref. 11), and one a Pseudo-Cℓ estimator (Ref. 12).
3.1. Data Selection
We evaluate the quality of our data to decide which parts can be used for science
analysis. The baseline data selection (removing dead detector diodes, engineering
tests during the season, and glitching) is common between the two pipelines, but
each pipeline has developed independent criteria based on analysis of the time-
ordered data stream, spectral information, and map-based tests. We have found
the percentage of data kept is similar between the two pipelines and preliminary
data selection indicates an acceptance efficiency of ≃60%. Studies are ongoing for
additional cuts, including analyzing null-test results, discussed in the next section.
3.2. Null Tests
After preliminary data selection, the resulting data set is subjected to a set of null
tests. In a null test, the pipeline divides the data in half, makes a map of each half,
subtracts one map from the other, and computes the resulting map and its power
spectrum. The null test is successful if the signal has been fully removed and the
spectrum computed is null within noise. A non-null result indicates the presence of
signal in the resulting map, which could be from instrumental systematic errors or
poor quality data (weather, etc).
We currently have a suite of over 40 null tests which we categorize as temporal
(eg. first/second halves of the season, night vs day), telescope (eg. various deck
angles and elevation values against others, sidelobe elevation), and receiver (eg.
inner polarimeters vs outer polarimeters, high vs low temperature-to-polarization
leakage polarimeters), each designed to explore immunity to a certain systematic
error. Both pipelines are using a blind analysis technique such that each set in
the the suite of null tests must be consistent with no systematic effects before the
power spectrum of the signal is computed. Each of the ∼40 null tests contains ten
EE- and ten BB-power-spectrum points, giving a total of 800 points that should be
consistent with zero.
3.3. Preliminary Map of a Galactic Patch
A WMAP map of QUIET Patch Gb with 5 years of data is shown in Fig. 5(a)
(this represents ≃ 1% of their sky coverage), and a map of the same patch with

May 31, 2010 18:55 WSPC - Proceedings Trim Size: 9.75in x 6.5in main
8
≃100 hours of QUIET Q-band data generated by the maximum-likelihood mapping
algorithm is shown in Fig. 5(b). The QUIET map is shown with pixel size adjusted
to maintain constant noise across the map, and the pixelization was maintained for
ease of comparison for the WMAP map. The source in the center of the QUIET
maps is also present in the WMAP map, but with much greater signal to noise in
the QUIET map.
(a)
(b)
Fig. 5. (a) WMAP polarized map of QUIET Patch Gb. (b) Same patch, with QUIET Q-banddata. Left panel is Stokes Q, right panel is Stokes U parameters. Units are in µK.
3.4. Science Prospects
On-sky measurements of sensitivity give values of 64±8 µK√
s for the Q-band ar-
ray, and 57±14 µK√
s for the W-band array. The projected E-mode polarization
anisotropy spectrum for each array is shown in Fig. 6, with the measurements from
BICEP and QUaD (Refs. 8, 9). Over the range 50 < ℓ < 1000, we will significantly

May 31, 2010 18:55 WSPC - Proceedings Trim Size: 9.75in x 6.5in main
9
improve measurement of the EE polarization power spectrum. Further, QUIET will
make the most sensitive maps of synchrotron emission in a relatively foreground-free
region of the sky (Ref. 13).
Fig. 6. Upper Forecast precision of QUIET Phase I measurements assuming ≃3000 hours of Q-band data and ≃4500 hours of W-band data compared with results from BICEP (Ref. 8) andQUaD (Ref. 9). Lower Same for smaller range of ℓ <250.
4. QUIET Phase II
QUIET Phase II will consist of three separate telescopes with four cryostats. Three
cryostats will house identical W-band arrays of 499 polarimeters at 90 GHz, 36
polarimeters in each array will be dedicated TT assemblies. The fourth cryostat
will be a hybrid of 61 Q-band polarimeters at 40 GHz and 18 Ka-band polarimeters
at 32 GHz, with six and two polarimeters dedicated to TT assemblies, respectively.
The increased sensitivity of Phase II and larger primary mirror (2 m diame-
ter mirrors compared to 1.4 m) will allow measurements of the CMB polarization
anisotropy spectrum to significantly higher resolution. The projected EE- and BB-
polarization anisotropy power spectra for Phase II are shown in Fig. 7. QUIET
Phase II expects to constrain the tensor-to-scalar ratio r to 0.01.
5. Conclusion
QUIET has successfully fielded two HEMT-based arrays for its Phase I stage. Ob-
serving has been completed with the Q-band array and is ongoing for the W-band
array. Data analysis is underway and the data quality is good. We expect to place
constraints on the tensor-to-scalar ratio which are competitive with the current
limits. The planned QUIET Phase II, with over 1600 QUIET polarimeters, will be
capable of constraining the tensor-to-scalar ratio to r ≃ 0.01.

May 31, 2010 18:55 WSPC - Proceedings Trim Size: 9.75in x 6.5in main
10
Fig. 7. Left Projected EE spectrum of QUIET Phase II W- band arrays.Right Projected BB limits for QUIET Phase II W-band arrays, the inset shows the expectedsensitivity near ℓ ≃ 100 compared to a spectrum with tensor-to-scalar ratio of r =0.05.
Acknowledgments
Support for the QUIET instrument and operations comes through the NSF cooper-
ative agreement AST-0506648. Support also provided by AST-04-49809, DE-AC02-
05CH11231, JSPS KAKENHI (A) 20244041, and by the Strategic Alliance for the
Implementation of New Technologies (SAINT). Some work presented was performed
on the Joint Fermilab - KICP Supercomputing Cluster, supported by grants from
Fermilab, Kavli Institute for Cosmological Physics, and the University of Chicago.
We are particularly indebted to the engineers who maintained and operated the
telescope: J. Cortes, C. Jara, F. Munoz, and C. Verdugo.
References
1. Bornemann, J., & Labay, V. A. Ridge waveguide polarizer with finite and stepped-
thickness septum, IEEE Trans. MTT, 43, 95 (1995).2. Jarosik, N. et al., ApJS, 145: 413 (2003).3. Leitch, E. et al., Nature, 420:763-771 (2002).4. Padin, S. et al., PASP, 114: 83-97 (2002).5. Barkats, D. et al., astro-ph/0503329v1.6. Lawrence, Gaier and Seiffert, Proceedings of the SPIE, 5498, pp. 220–331, eds. J.
Zmuidzinas, W. S. Holland and S. Withington (2004).7. Weiland, J. et al., astro-ph/1001.4731v1.8. Chiang, H. C. et al., ApJ., 711:1123-1140 (2010), astro-ph/0906.1181.9. Brown, M. L. et al., ApJ., 705: 978-999 (2009), astro-ph/0906.1003.
10. Hinshaw, G. et al., ApJS., 180: 225–245 (2009).11. Eriksen, H. K. et al., ApJ., 676:10 (2008), astro-ph/0709.1058.12. Smith, K. M. and Zaldarriaga, M. Phys.Rev.D76: 043001 (2007) astro-ph/0610059.13. Dunkley, J. et al., AIP Conf. Proc. 1141:222-264 (2009), astro-ph/0811.3915v2.


![Chapter1 arXiv:1501.02963v1 [gr-qc] 13 Jan 20151501.02963v1 [gr-qc] 13 Jan 2015 14 de enero de 2015 1:20 World Scientific Review Volume - 9.75in x 6.5in Fernando-Alejandro-Master](https://static.fdocuments.in/doc/165x107/5ada6c8f7f8b9aee348cc5be/chapter1-arxiv150102963v1-gr-qc-13-jan-2015-150102963v1-gr-qc-13-jan-2015.jpg)