Measuring Cache and TLB Performance and Their...
22
Measuring Cache and TLB Performance and Their Effect on Benchmark Run Times ²§ Rafael H. Saavedra ‡ Alan Jay Smith ‡‡ ABSTRACT In previous research, we have developed and presented a model for measuring machines and analyzing programs, and for accurately predicting the running time of any analyzed program on any measured machine. That work is extended here by: (a) developing a high level program to measure the design and performance of the cache and TLB for any machine; (b) using those measurements, along with published miss ratio data, to improve the accuracy of our run time predictions; (c) using our analysis tools and measurements to study and compare the design of several machines, with par- ticular reference to their cache and TLB performance. As part of this work, we describe the design and performance of the cache and TLB for ten machines. The work presented in this paper extends a powerful technique for the evaluation and analysis of both computer systems and their workloads; this methodology is valuable both to com- puter users and computer system designers. 1. Introduction The performance of a computer system is a function of the speed of the individual functional units, such as the integer, branch, and floating-point units, caches, bus, memory system, and I/O units, and of the workload presented to the system. In our previous research [Saav89, 90, 92b, 92c], described below, we have measured the performance of the parts of the CPU on corresponding portions of various work- loads, but this work has not explicitly considered the behavior and performance of the cache memory. It is well known (see e.g. [Smit82]) that caches are a critical component of any high performance computer system, and that access time to the cache and the misses from the cache are frequently the single factor most constraining performance. In this paper we extend our work on machine characterization and per- formance prediction to include the effect of cache memories and cache memory misses. Our research in the area of performance evaluation has focused on developing a uniprocessor machine-independent model (the Abstract Machine Model) of program execution to characterize machine and application performance, and the effectiveness of compiler optimization. In previous papers we have shown that we can measure the performance of a CPU on various abstract operations, and can separately measure the frequency of these operations in various workloads. By combining these separate ² The material presented here is based on research supported principally by NASA under grant NCC2-550, and also in part by the National Science Foundation under grants MIP-8713274, MIP-9116578 and CCR-9117028, by the State of Califor- nia under the MICRO program, and by Sun Microsystems, Mitsubishi Electric Research Laboratories, Philips Laboratories/Signetics, Apple Computer Corporation, Intel Corporation, Digital Equipment Corporation. and IBM. § This paper has been issued as technical report USC-CS-93-546 of the Computer Science Department at USC and techni- cal report UCB-CSD-93-767 of the Computer Science Division, UC Berkeley, July 19, 1993. ‡ Computer Science Department, Henry Salvatori Computer Science Center, University of Southern California, Los Angeles, California 90089-0781 (e-mail: [email protected]). ‡‡ Computer Science Division, EECS Department, University of California, Berkeley, California 94720.
Transcript of Measuring Cache and TLB Performance and Their...
Measuring Cache and TLB Performance and Their Effecton Benchmark Run Times†§
Rafael H. Saavedra‡
Alan Jay Smith‡‡
ABSTRACT
In previous research, we have developed and presented a model for measuringmachines and analyzing programs, and for accurately predicting the running time of anyanalyzed program on any measured machine. That work is extended here by: (a)developing a high level program to measure the design and performance of the cacheand TLB for any machine; (b) using those measurements, along with published missratio data, to improve the accuracy of our run time predictions; (c) using our analysistools and measurements to study and compare the design of several machines, with par-ticular reference to their cache and TLB performance. As part of this work, we describethe design and performance of the cache and TLB for ten machines. The workpresented in this paper extends a powerful technique for the evaluation and analysis ofboth computer systems and their workloads; this methodology is valuable both to com-puter users and computer system designers.
1. Introduction
The performance of a computer system is a function of the speed of the individual functional units,such as the integer, branch, and floating-point units, caches, bus, memory system, and I/O units, and ofthe workload presented to the system. In our previous research [Saav89, 90, 92b, 92c], described below,we have measured the performance of the parts of the CPU on corresponding portions of various work-loads, but this work has not explicitly considered the behavior and performance of the cache memory. Itis well known (see e.g. [Smit82]) that caches are a critical component of any high performance computersystem, and that access time to the cache and the misses from the cache are frequently the single factormost constraining performance. In this paper we extend our work on machine characterization and per-formance prediction to include the effect of cache memories and cache memory misses.
Our research in the area of performance evaluation has focused on developing a uniprocessormachine-independent model (the Abstract Machine Model) of program execution to characterize machineand application performance, and the effectiveness of compiler optimization. In previous papers we haveshown that we can measure the performance of a CPU on various abstract operations, and can separatelymeasure the frequency of these operations in various workloads. By combining these separatehhhhhhhhhhhhhhhhhh† The material presented here is based on research supported principally by NASA under grant NCC2-550, and also in partby the National Science Foundation under grants MIP-8713274, MIP-9116578 and CCR-9117028, by the State of Califor-nia under the MICRO program, and by Sun Microsystems, Mitsubishi Electric Research Laboratories, PhilipsLaboratories/Signetics, Apple Computer Corporation, Intel Corporation, Digital Equipment Corporation. and IBM.§ This paper has been issued as technical report USC-CS-93-546 of the Computer Science Department at USC and techni-cal report UCB-CSD-93-767 of the Computer Science Division, UC Berkeley, July 19, 1993.‡ Computer Science Department, Henry Salvatori Computer Science Center, University of Southern California, LosAngeles, California 90089-0781 (e-mail: [email protected]).‡‡ Computer Science Division, EECS Department, University of California, Berkeley, California 94720.
2
measurements, we can make fairly accurate estimates of execution times for arbitrary machine/programcombinations [Saav89, Saav92]. Our technique allows us to identify those operations, either on themachine or in the programs, which dominate the benchmark results. This information helps designers toimprove the performance of future machines, and users to tune their applications to better utilize the per-formance of existing machines. Recently, the abstract machine concept was used by Culler et al. toevaluate the mechanisms for fine-grained parallelisms in the J-machine and CM-5 [Sper93].
The model presented in the previous papers omitted any consideration of TLB and cache misses, i.e.of program locality. Our measurement technique involves the timing of operations executed repeatedlywithin small loops; in such cases, few cache and TLB misses are encountered. Thus for workloads withhigh miss ratios, that technique will underestimate run times. Our results on the SPEC and Perfect bench-marks in reported in [Saav92] do not show large errors because the locality on most of these programs isrelatively high [Pnev90, GeeJ91].
In this paper we deal with the issue of locality and incorporate this factor in our performance model.Here we show that our basic model can be easily extended to include a term which accounts for the timedelay experienced by a program as a result of bringing data to the processor from different levels of thememory hierarchy. We focus on characterizing cache and TLB units by running experiments whichmeasure their most important parameters, such as cache and TLB size, miss penalty, associativity and line(page) size. We present cache and TLB measurements for a variety of computers. We then combinethese measurements with results obtained by other studies of the cache and TLB miss ratios for the SPECbenchmarks to compute the delay experienced by these programs as a result of the cache and TLB misses.These new results are then used to evaluate how much our execution time predictions for the SPECbenchmarks improve when we incorporate these memory delays. We show that the prediction errorsdecrease in most of the programs, although the improvement is modest. We also consider the SPECbenchmarks as being part of a single workload and use them to evaluate the impact of memory delay inthe overall performance of different machines.
Finally, we discuss in some detail the performance differences between the caches and TLBs of fourmachines based on the same family of processors. We show that the SPEC benchmark results on thesemachines can be explained by the differences in their memory systems.
This paper is organized as follows: Section 2 contains a brief discussion of the Abstract MachinePerformance Model. Section 3 presents our approach to characterizing the memory hierarchy and theexperimental methodology followed throughout the paper. The experimental results are presented in Sec-tion 4. The effect of locality in the SPEC benchmarks is contained in Section 5, followed by a discussionof the results in Section 6. A small conclusion section ends this paper.
2. Background Material
We have developed a performance model based on the concept of the abstract machine that allowsus to characterize the performance of the CPU, predict the execution time of uniprocessor applications,and evaluate the effectiveness of compiler optimizations. In this section we briefly discuss and explainthis model.
2.1. The Abstract Machine Performance Model
We call the approach we have used for performance evaluation the abstract machine performancemodel. The idea is that every machine is modeled as and is considered to be a high level languagemachine that executes the primitive operations of Fortran. We have used Fortran for three reasons: (a)Most standard benchmarks and large scientific programs are written in Fortran; (b) Fortran is relativelysimple to work with; (c) Our work is funded by NASA, which is principally concerned with the perfor-mance of high end machines running large scientific programs written in Fortran. Our methodologycould be straightforwardly used for other similar high level languages such as C and Pascal.
3
There are three basic parts to our methodology. In the first part, we analyze each physical machineby measuring the execution time of each primitive Fortran operation on that machine. Primitive opera-tions include things like add-real-single-precision, store-single-precision, etc; the full set of operations ispresented in [Saav89, 92a]. Measurements are made by using timing loops with and without the opera-tion to be measured. Such measurements are complicated by the fact that some operations are not separ-able from other operations (e.g. store), and that it is very difficult to get precise values in the prescence ofnoise (e.g. cache misses, task switching) and low resolution clocks [Saav89, 92a]. We have also calledthis machine analysis phase narrow spectrum benchmarking. This approach, of using the abstractmachine model, is extremely powerful, since it saves us from considering the peculiarities of eachmachine, as would be done in an analysis at the machine instruction level [Peut77].
The second part of our methodology is to analyze Fortran programs. This analysis has two parts. Inthe first, we do a static parsing of the source program and count the number of primitive operations perline. In the second, we execute the program and count the number of times each line is executed. Fromthose two sets of measurements, we can determine the number of times each primitive operation is exe-cuted in an execution of the entire program.
The third part of our methodology is to combine the operation times and the operation frequenciesto predict the running time of a given program on a given machine without having run that program onthat machine. As part of this process, we can determine which operations account for most of the runningtime, which parts of the program account for most of the running time, etc. In general, we have found ourrun time predictions to be remarkably accurate [Saav92a, 92b]. We can also easily estimate the perfor-mance of hypothetical machines (or modifications of existing machines) on a variety of real or proposedworkloads.
It is very important to note and explain that we separately measure machines and programs, andthen combine the two as a linear model. We do not do any curve fitting to improve our predictions. Thefeedback between prediction errors and model improvements is limited to improvements in the accuracyof measurements of specific parameters, and to the creation of new parameters when the lumping of dif-ferent operations as one parameter were found to cause unacceptable errors. The curve fitting approachhas been used and has been observed to be of limited accuracy [Pond90]. The main problems withcurve-fitting is that the parameters produced by the fit have no relation to the machine and programcharacteristics, and they tend to vary widely with changes in the input data.
In [Saav89] we presented a CPU Fortran abstract machine model consisting of approximately 100abstract operations and showed that it was possible to use it to characterize the raw performance of a widerange of machines ranging from workstations to supercomputers. These abstract operations were alsocombined into a set of reduced parameters, each of which was associated with the performance of aspecific CPU functional unit. The use of such reduced parameters permitted straightforward machine tomachine comparisons.
In [Saav92a, 92b] we studied the characteristics of the SPEC and Perfect Club benchmarks usingthe same abstract machine model and showed that it is possible to predict the execution time of arbitraryprograms on a large number of machines. Our results were successful in accurately predicting ‘incon-sistent’ machine performance, i.e. that machine A is faster than B for program x, but slower for programy. Both of these studies assumed that programs were compiled and executed without optimization.
In [Saav92c] we extended our model to include the effect of (scalar) compiler optimization. It isvery difficult to predict which optimizations will be performed by a compiler and also to predict their per-formance impact. We found, however, that we could model the performance improvement due to optimi-zation as an improvement in the implementation of the abstract machine (an ‘‘optimized’’ machine) whileassuming that the behavior of the program remains unchanged. We showed that it is possible to accu-rately predict the execution time of optimized programs in the large majority of cases.
4
2.2. Adding Locality to the Abstract Machine Model
The variations in execution time due to changes in locality are not captured by our performancemodel, which ignores how the stream of references affects the content of both the cache and the TLB.This is a direct consequence of using a linear model, and it is clearly expressed in the following equation
TA , M =i = 1Σn
Ci , A Pi , M (1)
where TA , M is the total execution time of the program, Ci , A is the number of times operation i is exe-cuted by program A , and Pi , M is the execution time of parameter i on machine M .
Equation (1) does not include a term to account for cache and TLB misses. Never the less, we havefound that with a few exceptions (e.g. MATRIX300 without use of a blocking preprocessor), our predic-tions have been quite good. This has been the case because most of the programs that have been analyzed(almost all of which are standard benchmarks) have relatively low miss ratios.
It is straightforward to extend equation (1) to include cache and TLB misses (and/or misses at anyother level of the memory hierarchy):
TA , M =i = 1Σn
Ci , A Pi , M +i = 1Σm
Fi , A Di , M , (2)
where Fi A (faults)is the number of misses at the level i of the memory hierarchy, and Di , M (delay) is thepenalty paid by the respective miss. How many levels of the memory hierarchy exist varies betweenmachines, but in most machines there are one or two levels of caches, a TLB, main memory, and disk1.In order to use equation (2) we need: 1) to measure the number of misses at each level of hierarchy, or atleast on those levels which significantly affect the execution time, and 2) to measure the set of penaltiesdue to different types of misses.
Measurement of the number of misses by a given program for a given memory hierarchy can bedone either by trace driven simulation (see e.g. [Smit82, 85]) or by hardware measurement. The formercan be extremely time consuming for any but the shortest programs ([Borg90, GeeJ91]), and the latterrequires both measurement tools (a hardware monitor or logical analyzer) and access to the necessaryelectrical signals. This measurement of miss ratios, however, is beyond the scope of this paper; we areprincipally concerned here with analysis of the memory hierarchy and performance prediction. We relyon measurements taken by others [GeeJ91] for the miss ratios used in this paper.
3. Characterizing the Performance of the Cache and TLB
We have written a set of experiments (narrow spectrum benchmarks or micro benchmarks) to meas-ure the physical and performance characteristics of the memory hierarchy in uniprocessors, in particular,the primary and secondary caches and the TLB. Each experiment measures the average time per iterationrequired to read, modify, and write a subset of the elements belonging to an array of a known size. Thenumber of misses will be a function of the size of the array and the stride between consecutive addressesreferenced. From the number of misses and the number of references, as we vary the stride and arraysize, we can compute the relevant memory hierarchy parameters, including the size of the cache and theTLB, the size of a cache line and the granularity of a TLB entry, the time needed to satisfy a cache orTLB miss, the cache and TLB associativity, and the performance effect of write buffers. Other parame-ters such as the number of sets in the cache or entries in the TLB are obtained easily from the abovehhhhhhhhhhhhhhhh
1 The TLB is not a level in the memory hierarchy, but it is a high-speed buffer which maintains recentlyused virtual and real memory address pairs [Smit82]. However, to simplify our discussion in the rest of thepaper we refer to it as part of the memory hierarchy. Doing this does not affect in any way our methodologyor conclusions.
5
parameters.
At least one previous study used a similar technique to measure the cache miss penalty, although themeasurement was made at the machine instruction level, not using a high level language program. Peutoand Shustek [Peut77] wrote an assembly language loop which generated a predictable number of cachemisses; from this, they were able to calculate the cache miss penalty for the IBM 3033 and the Amdahl470V/6. They also determined the effectiveness of the write buffers in the 3033. For both machines,however, they knew the cache design parameters (e.g. cache size) and so didn’t need to deduce them.
3.1. Experimental Methodology
We explain how we measure cache parameters by assuming that there is only one level of thememory hierarchy to measure; to the extent that the characteristics of two levels (e.g. cache and TLB) aresufficiently different, it is straightforward to calculate the parameters of each from these measurements.In what follows we assume the existence of separate instruction and data caches, although this is doneonly to simplify the discussion; the instruction loop that we use is so small that the measurements are vir-tually identical for a unified cache. Assume that a machine has a cache capable of holding C 4-bytewords, a line size of b words, and an associativity a . The number of sets in the cache is given by C /ab .We also assume that the replacement algorithm is LRU, and that the lowest available address bits areused to select the cache set.
Each of our experiments consists of computing a simple floating-point function on each of a subsetof elements taken from a one-dimensional array of N 4-byte elements. We run each experiment severaltimes to eliminate experimental noise [Saav89]. The reason for the (arbitrary) floating point computationis to avoid having a measurement loop which actually does nothing and is therefore eliminated by thecompiler optimizer from the program. This subset is given by the following sequence: 1, s + 1, 2s + 1, ...,N − s + 1. Thus, each experiment is characterized by a particular value of N and s . The stride s allows usto change the rate at which misses are generated by controlling the number of consecutive accesses to thesame cache line, page, etc. The magnitude of s varies from 1 to N /2 in powers of two.
Computing a new value on a particular element involves first reading the element into the CPU,computing the new value using a simple recursive equation, and writing the result back into the cache.Thus, on each iteration the cache gets two consecutive requests, one read and one write, both having thesame address. Of these two requests only the read can generate a cache miss, and it is the time needed tofetch the value for the read that our experiments measure.
Depending on the values of N and s and the size of the cache (C ), the line size (b ), and the associa-tivity (a ), there are four possible regimes of operations; each of these is characterized by the rate at whichmisses occur in the cache. A summary of the characteristics of the four regimes is given in table 1.
iiiiiiiiiiiiiiiiiiiiiiiiiiiiiiiiiiiiiiiiiiiiiiiiiiiiiiiiiiiiiiiiiiiiiiiiiiiiiiiiRegime Size of Array Stride Frequency of Misses Time per Iterationiiiiiiiiiiiiiiiiiiiiiiiiiiiiiiiiiiiiiiiiiiiiiiiiiiiiiiiiiiiiiiiiiiiiiiiiiiiiiiiiiiiiiiiiiiiiiiiiiiiiiiiiiiiiiiiiiiiiiiiiiiiiiiiiiiiiiiiiiiiiiiiiiiiiiiiiiiiiiiii
1 1 ≤ N ≤ C 1 ≤ s ≤ N /2 no misses Tno −missiiiiiiiiiiiiiiiiiiiiiiiiiiiiiiiiiiiiiiiiiiiiiiiiiiiiiiiiiiiiiiiiiiiiiiiiiiiiiiii2.a C < N 1 ≤ s ≤ b one miss every b /s elements Tno −miss + Ms /b2.b C < N b ≤ s < N /a one miss every element Tno −miss + M2.c C < N N /a ≤ s ≤ N /2 no misses Tno −missiiiiiiiiiiiiiiiiiiiiiiiiiiiiiiiiiiiiiiiiiiiiiiiiiiiiiiiiiiiiiiiiiiiiiiiiiiiiiiiic
cccccc
ccccccc
ccccccc
ccccccc
ccccccc
ccccccc
Table 1: Cache miss patterns as a function of N and s. No misses are generated when N ≤ D . When N > D , therate of misses is determined by the stride between consecutive elements. M is the miss penalty.
Regime 1: N ≤ C .The complete array fits into the cache and thus, for all values of the stride s , once the array isloaded for the first time, there are no more misses. The execution time per iteration (Tno −misses )includes the time to read one element from the cache, compute its new value, and store the resultback into the cache. Note that in a cache where the update policy is write-through, Tno −miss may
6
also include the time that the processor is forced to wait if the write buffer backs up.
Regime 2.a: N > C and 1 ≤ s < b .The array is bigger than the cache, and there are b /s consecutive accesses to the same cache line.The first access to the line always generates a miss, because every cache line is displaced from thecache before it can be re-used in subsequent computations of the function. This follows from condi-tion N > C . Therefore, the execution time per iteration is Tno −miss + Ms /b , where M is the misspenalty and represents the time that it takes to read the data from main memory and resume execu-tion.
Regime 2.b: N > C and b ≤ s < N /a .The array is bigger than the cache and there is a cache miss every iteration, as each element of thearray maps to a different line. Again, every cache line is displaced from the cache before it can bere-used. The execution time per iteration is Tno −miss + M .
Regime 2.c: N > C and N /a ≤ s ≤ N /2.The array is bigger than the cache, but the number of addresses mapping to a single set is less thanthe set associativity; thus, once the array is loaded, there are no more misses. Even when the arrayhas N elements, only N /s < a of these are touched by the experiment, and all of them can fit in asingle set. This follows from the fact that N /a ≤ s . The execution time per iteration is Tno −miss .
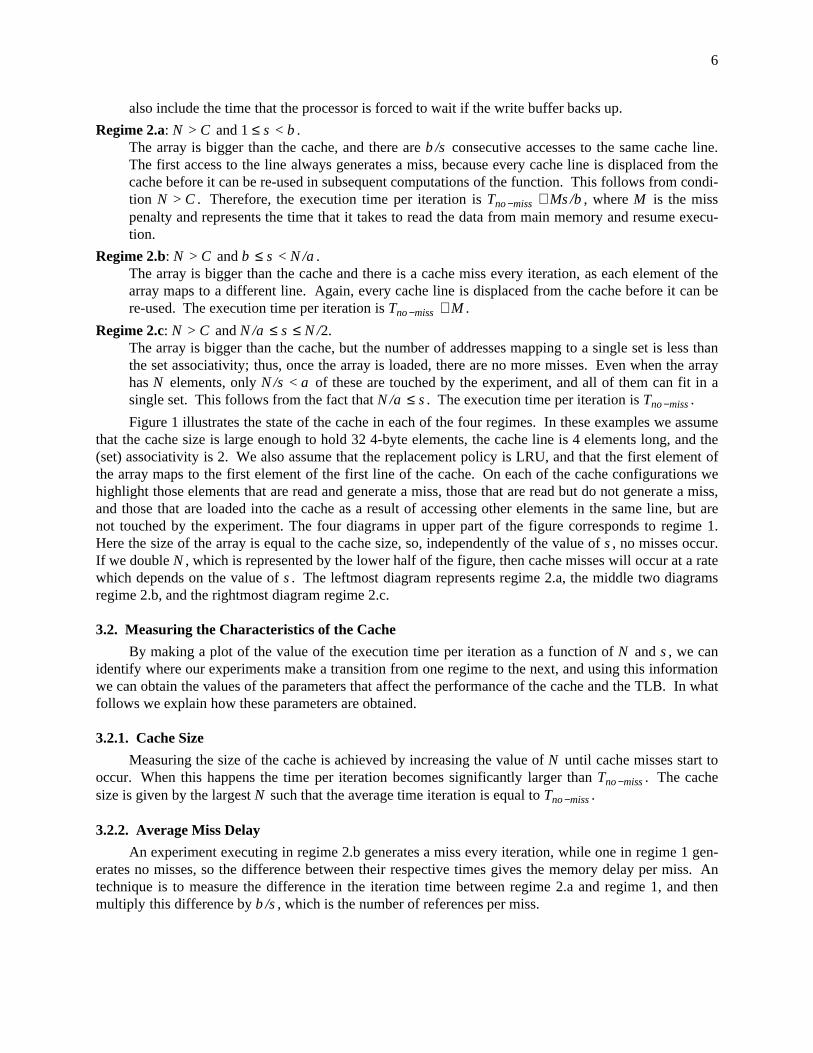
Figure 1 illustrates the state of the cache in each of the four regimes. In these examples we assumethat the cache size is large enough to hold 32 4-byte elements, the cache line is 4 elements long, and the(set) associativity is 2. We also assume that the replacement policy is LRU, and that the first element ofthe array maps to the first element of the first line of the cache. On each of the cache configurations wehighlight those elements that are read and generate a miss, those that are read but do not generate a miss,and those that are loaded into the cache as a result of accessing other elements in the same line, but arenot touched by the experiment. The four diagrams in upper part of the figure corresponds to regime 1.Here the size of the array is equal to the cache size, so, independently of the value of s , no misses occur.If we double N , which is represented by the lower half of the figure, then cache misses will occur at a ratewhich depends on the value of s . The leftmost diagram represents regime 2.a, the middle two diagramsregime 2.b, and the rightmost diagram regime 2.c.
3.2. Measuring the Characteristics of the Cache
By making a plot of the value of the execution time per iteration as a function of N and s , we canidentify where our experiments make a transition from one regime to the next, and using this informationwe can obtain the values of the parameters that affect the performance of the cache and the TLB. In whatfollows we explain how these parameters are obtained.
3.2.1. Cache Size
Measuring the size of the cache is achieved by increasing the value of N until cache misses start tooccur. When this happens the time per iteration becomes significantly larger than Tno −miss . The cachesize is given by the largest N such that the average time iteration is equal to Tno −miss .
3.2.2. Average Miss Delay
An experiment executing in regime 2.b generates a miss every iteration, while one in regime 1 gen-erates no misses, so the difference between their respective times gives the memory delay per miss. Antechnique is to measure the difference in the iteration time between regime 2.a and regime 1, and thenmultiply this difference by b /s , which is the number of references per miss.

7
272625
24232221
201918
32313029
28
17
16151413
1211109
8765
4321
272625
24232221
201918
32313029
28
17
16151413
1211109
8765
4321
52515049
44434241
1 2 3 4
9 10 11 12
17 18 19 20
272625 2857 58 59 60
432133 34 35 36
33 34 35 36
s = 32
C = 32 x 4 bytes b = 4 x 4 bytesa = 2N = 64
s = 8s = 4s = 2
272625
201918
28
17
1211109
4321 1 2 3 4
17 18 19 20
X X X X
X X X X
XXXX
XXXX
X X X X
X X X X
XXXX
XXXX
X X X X
X X X X
XXXX
XXXX
X X X X
X X X X
XXXX
XXXX
X X X X
X X X X
XXXX
XXXX
s = 8s = 4s = 2 s = 16
a = 2b = 4 x 4 bytesC = 32 x 4 bytes
N = 32
no misses
1 miss every 2 elements
no misses
1 miss every element
no misses
1 miss every element
no misses
no misses
no readread & no missread & miss
272625
24232221
201918
32313029
28
17
16151413
1211109
8765
432133 34 35 36
37 38 39 40
41 42 43 44
45 46 47 48
49 50 51 52
53 54 55 56
57 58 59 60
61 62 63 64
272625
24232221
201918
32313029
28
17
16151413
1211109
8765
432133 34 35 36
37 38 39 40
41 42 43 44
45 46 47 48
49 50 51 52
53 54 55 56
57 58 59 60
61 62 63 64
set 0
set 1
set 2
set 3
set 0
set 1
set 2
set 3
set 0
set 1
set 2
set 3
set 3
set 2
set 1
set 0
Figure 1: The figure illustrates the four different regimes of cache accesses produce by a particular combination ofN and s . Each diagram shows the mapping of elements to cache entries, assuming that the first element ofthe array maps to the first entry of the first cache line in the cache. The replacement policy is LRU. Thefour diagrams on the upper part of the figure correspond to regime 1. For the diagram in the lower half ofthe figure, the leftmost diagram corresponds to regime 2.a, the two in the middle to regime 2.b, and the right-most to regime 2.c. The sequence of elements reference by an experiment is: 1, s + 1, 2s + 1, ... , N − s + 1.
3.2.3. Cache Line Size
In regime 2.a, the rate at which misses occur is one every b /s iterations. This rate increases with s ,and achieves its maximum when s ≥ b , when there is a miss on every iteration (regime 2.b). The value ofs when the transition between regimes 2.a and 2.b happens gives the cache line size.
3.2.4. Associativity
The associativity of the cache (for a ≥ 2) is given by the value N /s , which is the number of dif-ferent elements referenced by the experiments, if it is the case that there is a transition from regime 2.b toregime 2.c. As we mentioned before, if N /a ≤ s , then a ≥ N /s , which means that this regime is easilyidentified because the time per iteration drops from Tno −miss + M to Tno −miss . In a direct-mapped cache,however, there is no transition because the maximum value of s for our experiments is N /2, which
8
corresponds to an associativity of 2. However, we can identify a direct-mapped cache when we observethat the time per iteration does not decrease when s equals N /2.
3.2.5. Write Buffers
A cache, in which the update policy is write-through, normally contains a small buffer of pendingwrites which are sent to main memory only when the memory bus is not being used to satisfy fetches.The existence of a write buffer allows giving priority to reads over writes. This helps in reducing theamount of time that the CPU has to stall waiting for writes to complete. Furthermore, if the processorneeds a datum which is still in the write buffer, it can in some designs (e.g. the IBM 3033 [Smit82]) beread immediately from there without waiting for the write to occur. In order to guarantee uniprocessorsequential consistency, it is necessary that in a machine with write buffers, on a read, the read addressmust either be compared with the addresses of pending writes, or the pending writes must be allowed tocomplete before the read is performed. The existence of write buffers and their effectiveness can bedetected by observing how the time per iteration changes as s gets closer to N /2.
We know that the number of different elements touched by a particular experiment is N /s . Thisnumber decreases as s increases, which means that the time between two accesses to the same elementalso decreases. In a cache with a write buffer it may happen that if s is very close to N /2, then the timefrom the moment an element is written until it is read again can become smaller than the time it takes forthe write to occur, so the fetch can be retrieved from the buffer, provided that the write buffers providethat facility. When this occurs the time per iteration will decrease by the difference in time between fetch-ing the data from the write buffer and fetching it from memory.
3.3. Measuring Parameters of the TLB
The phenomena we observe when we consider the TLB are the same as for the cache; the onlydifference is in the particular values of N and s where the changes in behavior occur. The measurementswe present in the next section show the behavior of both the cache and the TLB when both are active, andin some regions their effects overlap. In all cases, however, it is relatively straightforward to isolate theeffects of one from the other.
4. Experimental Results for Caches and TLBs
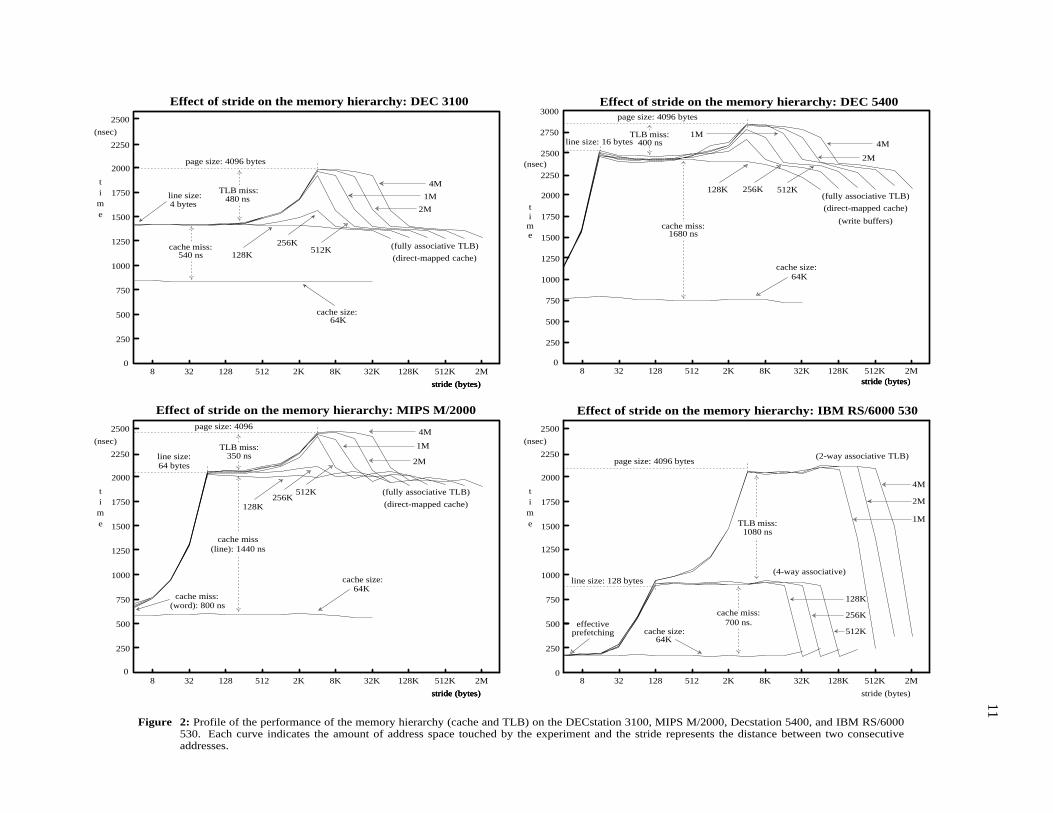
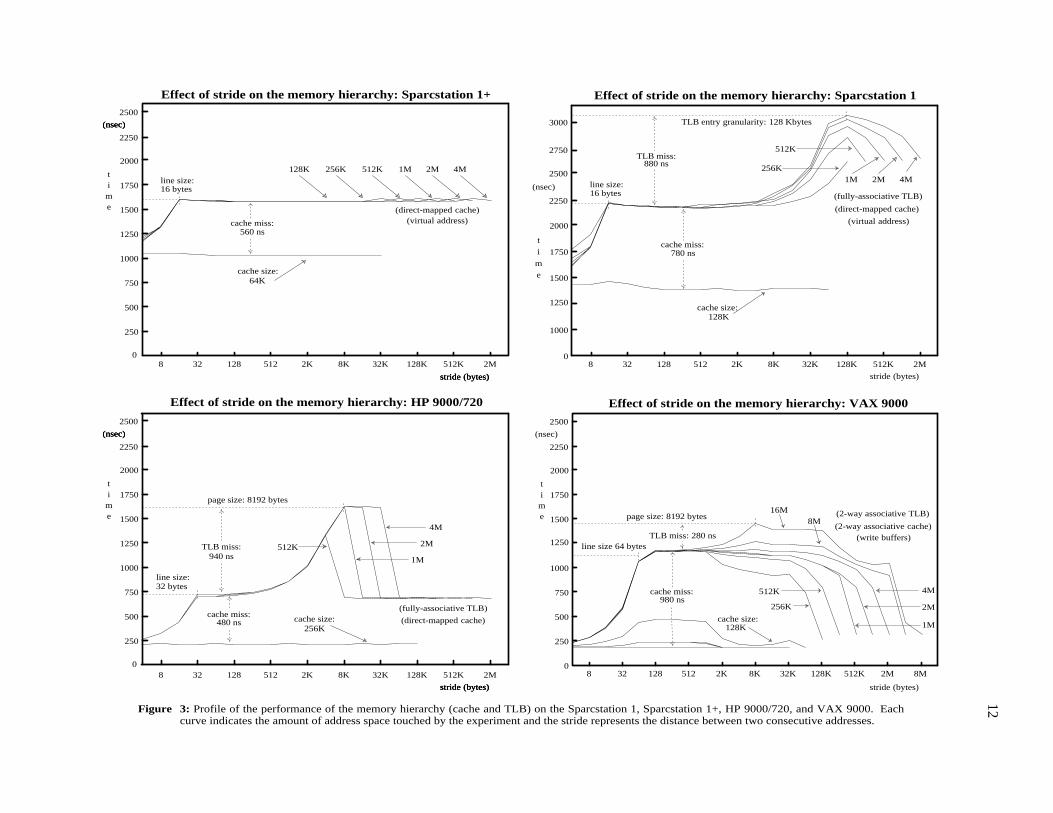
We ran our cache evaluation benchmark on several computers, and we show the results in figures2-4 and in table 2. The graphs shown in the figures show the average time per iteration as a function ofthe size of the array and the stride, while table 2 summarizes the cache and TLB parameters extractedfrom the profiles. The units used in the graphs are: bytes for measures of size, and nanoseconds for timerelated magnitudes. Each curve on each of the graphs correspond to a particular array size (N ), while thehorizontal axis represents different stride values (s ). We only shown curves for array sizes that aregreater or equal to the size of the cache.
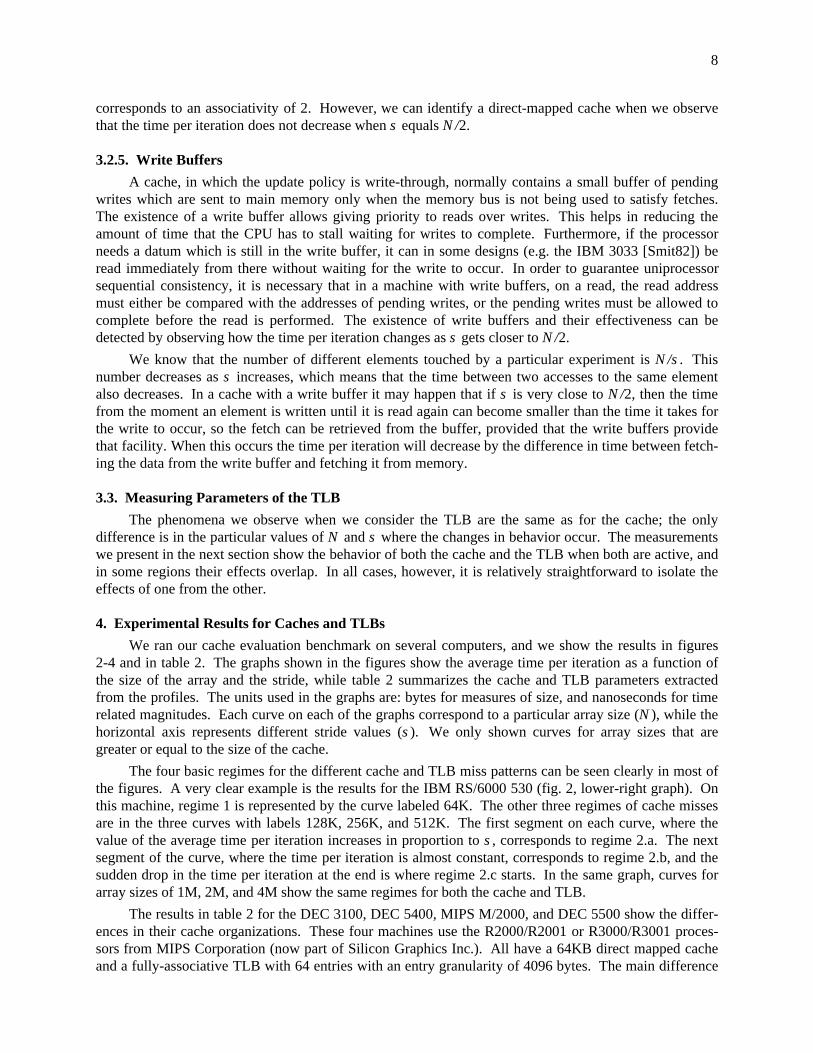
The four basic regimes for the different cache and TLB miss patterns can be seen clearly in most ofthe figures. A very clear example is the results for the IBM RS/6000 530 (fig. 2, lower-right graph). Onthis machine, regime 1 is represented by the curve labeled 64K. The other three regimes of cache missesare in the three curves with labels 128K, 256K, and 512K. The first segment on each curve, where thevalue of the average time per iteration increases in proportion to s , corresponds to regime 2.a. The nextsegment of the curve, where the time per iteration is almost constant, corresponds to regime 2.b, and thesudden drop in the time per iteration at the end is where regime 2.c starts. In the same graph, curves forarray sizes of 1M, 2M, and 4M show the same regimes for both the cache and TLB.
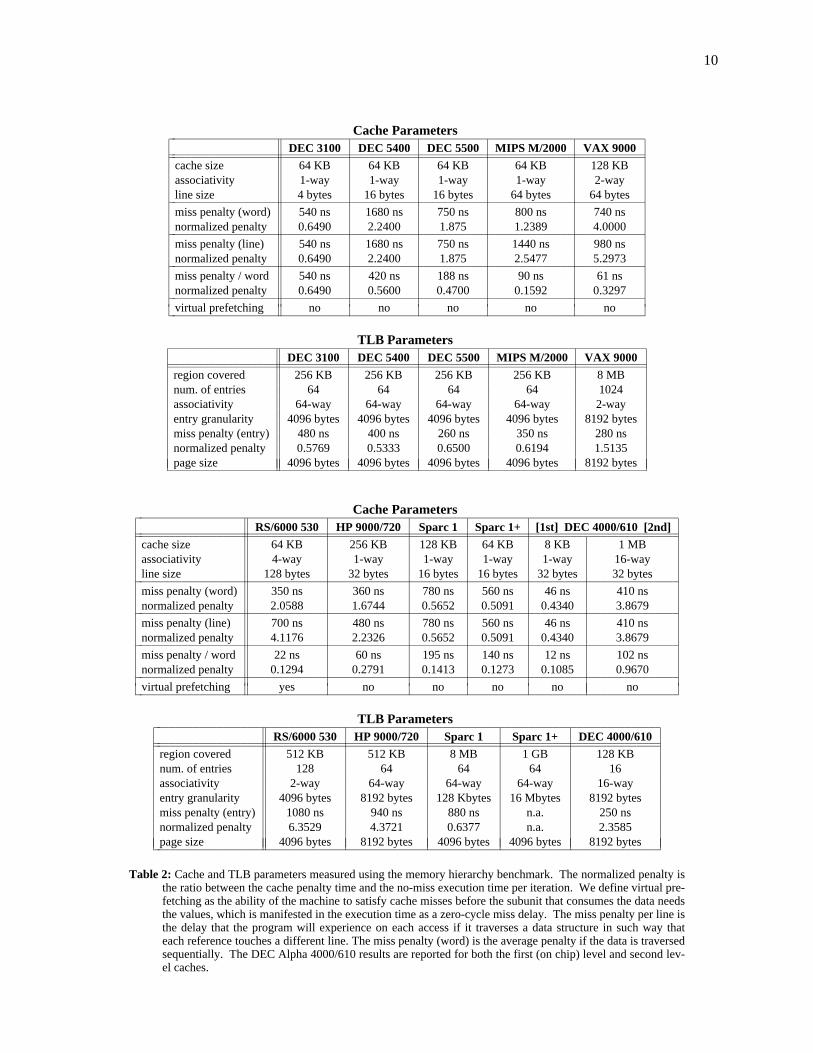
The results in table 2 for the DEC 3100, DEC 5400, MIPS M/2000, and DEC 5500 show the differ-ences in their cache organizations. These four machines use the R2000/R2001 or R3000/R3001 proces-sors from MIPS Corporation (now part of Silicon Graphics Inc.). All have a 64KB direct mapped cacheand a fully-associative TLB with 64 entries with an entry granularity of 4096 bytes. The main difference
9
between their respective caches are the line size and the miss penalty. The DEC 3100 has the smallestline size having only 4 bytes [Furl90]; the DEC 5400 and 5500 have line sizes of 16 bytes, and the MIPSM/2000 has the largest line size of 64 bytes. The miss penalty per line also shows a wide range of values,from 540 ns for the DEC 3100 to 1680 ns for the DEC 5400.
It is interesting to compare the ratios between the cache and TLB penalty misses and the executiontime of a single iteration with no misses, which are given in table 2. Although the no-miss time of thetest is not a good measure of the true speed of the processor, it at least gives an indication of the basicfloating-point performance (add and multiply) and helps to put in perspective the miss penalties. Theresults show a large variation in the ratio of the cache penalty to the no-miss iteration time, ranging from0.51 on the Sparcstation 1+ to 4.00 on the VAX 9000. In the VAX 9000, loading a cache line takes fourtimes longer than the no-miss iteration time. With respect to TLB misses the range of values goes from0.53 to 6.35, with the highest value corresponding to the IBM RS/6000 530.
Note that a high miss penalty does not necessarily reflect a bad cache design. The miss penalty maybe high as a tradeoff for a low miss ratio, as the result of cost/performance tradeoffs, as the result of anoptimization for low miss ratio workloads, or as a result of a deliberate slowing down of a design in orderto hit a specific product price/performance point, as discussed below in section 6.
4.1. Effective Prefetching
An interesting characteristic of the IBM RS/6000 which can be observed in our measurements iswhat we call effective prefetching. The cache does not have hardware support to do prefetching[O’Bri90], but it can produce the same effect, that is, fetching cache lines before they are needed by thecomputation, thus preventing the processor from stalling. This is accomplished in the RS/6000 by itsindependent integer, branch, and floating-point units. In this respect the IBM RS/6000 behaves like adecoupled architecture [Smit84, Good85, Wulf88]. The integer and branch unit can execute severalinstructions ahead of the floating-point unit in floating-point intensive code and generate loads to thecache that even in the presence of misses arrive before the floating-point unit requires the values[O’Bri90]. Because the execution time of our test is dominated by floating-point operations, the illusionof prefetching is present in our measurements. This is evident on the left side of the RS/6000 curves(regime 2.a), independent of the address space region; as long as the stride is less or equal to 16 bytes (4words), there is no miss penalty.
4.2. TLB Entries with Multiple Granularities
The results for the Sparcstation 1 and 1+ show that their respective TLB entry granularities are 128Kbytes and more than 2 Mbytes. The reason for these large numbers is that the TLB entries can mapmemory regions using four different levels of granularity. Furthermore, entries with different granulari-ties can coexist in the TLB. The page table for these machines have four levels [Cypr90]. At each level,there can be either a page table entry (PTE) or a page table pointer (PTP) which points to another pagetable. A PTE can thus point to a region of 4GB (level 0), 16MB (level 1), 256KB (level 2) or 4KB (level3). Each PTE in the TLB is tagged to indicate the size of the region it covers, and translation is doneaccordingly. The operating system determines the coverage of a PTE at the time the region is mapped.The availability of variable granularity PTEs has a number of advantages; in particular, it allows verylarge memories to be referenced by small TLBs.
5. The Effect of Locality in the SPEC Benchmarks
In this section we combine the experimental cache and TLB results obtained in the last section withthe cache and TLB miss ratios for the Fortran SPEC benchmarks to compute the memory delay caused bymisses. We then use these results to evaluate: 1) whether our execution time predictions improve whenwe incorporate the memory delay experience by the programs; and 2) how much impact does each cacheand TLB configuration have on the overall performance of their respective machines.
10
Cache ParametersiiiiiiiiiiiiiiiiiiiiiiiiiiiiiiiiiiiiiiiiiiiiiiiiiiiiiiiiiiiiiiiiiiiiiiiiiiiiiiiiDEC 3100 DEC 5400 DEC 5500 MIPS M/2000 VAX 9000iiiiiiiiiiiiiiiiiiiiiiiiiiiiiiiiiiiiiiiiiiiiiiiiiiiiiiiiiiiiiiiiiiiiiiiiiiiiiiiiiiiiiiiiiiiiiiiiiiiiiiiiiiiiiiiiiiiiiiiiiiiiiiiiiiiiiiiiiiiiiiiiiiiiiiiiiiiiiiii
cache size 64 KB 64 KB 64 KB 64 KB 128 KBassociativity 1-way 1-way 1-way 1-way 2-wayline size 4 bytes 16 bytes 16 bytes 64 bytes 64 bytesiiiiiiiiiiiiiiiiiiiiiiiiiiiiiiiiiiiiiiiiiiiiiiiiiiiiiiiiiiiiiiiiiiiiiiiiiiiiiiiimiss penalty (word) 540 ns 1680 ns 750 ns 800 ns 740 nsnormalized penalty 0.6490 2.2400 1.875 1.2389 4.0000iiiiiiiiiiiiiiiiiiiiiiiiiiiiiiiiiiiiiiiiiiiiiiiiiiiiiiiiiiiiiiiiiiiiiiiiiiiiiiiimiss penalty (line) 540 ns 1680 ns 750 ns 1440 ns 980 nsnormalized penalty 0.6490 2.2400 1.875 2.5477 5.2973iiiiiiiiiiiiiiiiiiiiiiiiiiiiiiiiiiiiiiiiiiiiiiiiiiiiiiiiiiiiiiiiiiiiiiiiiiiiiiiimiss penalty / word 540 ns 420 ns 188 ns 90 ns 61 nsnormalized penalty 0.6490 0.5600 0.4700 0.1592 0.3297iiiiiiiiiiiiiiiiiiiiiiiiiiiiiiiiiiiiiiiiiiiiiiiiiiiiiiiiiiiiiiiiiiiiiiiiiiiiiiiivirtual prefetching no no no no noiiiiiiiiiiiiiiiiiiiiiiiiiiiiiiiiiiiiiiiiiiiiiiiiiiiiiiiiiiiiiiiiiiiiiiiiiiiiiiiiccccccccccccccc
ccccccccccccccc
ccccccccccccccc
ccccccccccccccc
ccccccccccccccc
ccccccccccccccc
ccccccccccccccc
ccccccccccccccc
TLB ParametersiiiiiiiiiiiiiiiiiiiiiiiiiiiiiiiiiiiiiiiiiiiiiiiiiiiiiiiiiiiiiiiiiiiiiiiiiiiiiiiiDEC 3100 DEC 5400 DEC 5500 MIPS M/2000 VAX 9000iiiiiiiiiiiiiiiiiiiiiiiiiiiiiiiiiiiiiiiiiiiiiiiiiiiiiiiiiiiiiiiiiiiiiiiiiiiiiiiiiiiiiiiiiiiiiiiiiiiiiiiiiiiiiiiiiiiiiiiiiiiiiiiiiiiiiiiiiiiiiiiiiiiiiiiiiiiiiiii
region covered 256 KB 256 KB 256 KB 256 KB 8 MBnum. of entries 64 64 64 64 1024associativity 64-way 64-way 64-way 64-way 2-wayentry granularity 4096 bytes 4096 bytes 4096 bytes 4096 bytes 8192 bytesmiss penalty (entry) 480 ns 400 ns 260 ns 350 ns 280 nsnormalized penalty 0.5769 0.5333 0.6500 0.6194 1.5135page size 4096 bytes 4096 bytes 4096 bytes 4096 bytes 8192 bytesiiiiiiiiiiiiiiiiiiiiiiiiiiiiiiiiiiiiiiiiiiiiiiiiiiiiiiiiiiiiiiiiiiiiiiiiiiiiiiiiccccccccccc
ccccccccccc
ccccccccccc
ccccccccccc
ccccccccccc
ccccccccccc
ccccccccccc
ccccccccccc
Cache ParametersiiiiiiiiiiiiiiiiiiiiiiiiiiiiiiiiiiiiiiiiiiiiiiiiiiiiiiiiiiiiiiiiiiiiiiiiiiiiiiiiiiiiiiiiiiiRS/6000 530 HP 9000/720 Sparc 1 Sparc 1+ [1st] DEC 4000/610 [2nd]iiiiiiiiiiiiiiiiiiiiiiiiiiiiiiiiiiiiiiiiiiiiiiiiiiiiiiiiiiiiiiiiiiiiiiiiiiiiiiiiiiiiiiiiiiiiiiiiiiiiiiiiiiiiiiiiiiiiiiiiiiiiiiiiiiiiiiiiiiiiiiiiiiiiiiiiiiiiiiiiiiiiiiiiiiiiiiiiiiiiii
cache size 64 KB 256 KB 128 KB 64 KB 8 KB 1 MBassociativity 4-way 1-way 1-way 1-way 1-way 16-wayline size 128 bytes 32 bytes 16 bytes 16 bytes 32 bytes 32 bytesiiiiiiiiiiiiiiiiiiiiiiiiiiiiiiiiiiiiiiiiiiiiiiiiiiiiiiiiiiiiiiiiiiiiiiiiiiiiiiiiiiiiiiiiiiimiss penalty (word) 350 ns 360 ns 780 ns 560 ns 46 ns 410 nsnormalized penalty 2.0588 1.6744 0.5652 0.5091 0.4340 3.8679iiiiiiiiiiiiiiiiiiiiiiiiiiiiiiiiiiiiiiiiiiiiiiiiiiiiiiiiiiiiiiiiiiiiiiiiiiiiiiiiiiiiiiiiiiimiss penalty (line) 700 ns 480 ns 780 ns 560 ns 46 ns 410 nsnormalized penalty 4.1176 2.2326 0.5652 0.5091 0.4340 3.8679iiiiiiiiiiiiiiiiiiiiiiiiiiiiiiiiiiiiiiiiiiiiiiiiiiiiiiiiiiiiiiiiiiiiiiiiiiiiiiiiiiiiiiiiiiimiss penalty / word 22 ns 60 ns 195 ns 140 ns 12 ns 102 nsnormalized penalty 0.1294 0.2791 0.1413 0.1273 0.1085 0.9670iiiiiiiiiiiiiiiiiiiiiiiiiiiiiiiiiiiiiiiiiiiiiiiiiiiiiiiiiiiiiiiiiiiiiiiiiiiiiiiiiiiiiiiiiiivirtual prefetching yes no no no no noiiiiiiiiiiiiiiiiiiiiiiiiiiiiiiiiiiiiiiiiiiiiiiiiiiiiiiiiiiiiiiiiiiiiiiiiiiiiiiiiiiiiiiiiiiiccccccccccccccc
ccccccccccccccc
ccccccccccccccc
ccccccccccccccc
ccccccccccccccc
ccccccccccccccc
ccccccccccccccc
cccccccccccccc
ccccccccccccccc
TLB ParametersiiiiiiiiiiiiiiiiiiiiiiiiiiiiiiiiiiiiiiiiiiiiiiiiiiiiiiiiiiiiiiiiiiiiiiiiiiiiiiiiiiiiiRS/6000 530 HP 9000/720 Sparc 1 Sparc 1+ DEC 4000/610iiiiiiiiiiiiiiiiiiiiiiiiiiiiiiiiiiiiiiiiiiiiiiiiiiiiiiiiiiiiiiiiiiiiiiiiiiiiiiiiiiiiiiiiiiiiiiiiiiiiiiiiiiiiiiiiiiiiiiiiiiiiiiiiiiiiiiiiiiiiiiiiiiiiiiiiiiiiiiiiiiiiiiiiii
region covered 512 KB 512 KB 8 MB 1 GB 128 KBnum. of entries 128 64 64 64 16associativity 2-way 64-way 64-way 64-way 16-wayentry granularity 4096 bytes 8192 bytes 128 Kbytes 16 Mbytes 8192 bytesmiss penalty (entry) 1080 ns 940 ns 880 ns n.a. 250 nsnormalized penalty 6.3529 4.3721 0.6377 n.a. 2.3585page size 4096 bytes 8192 bytes 4096 bytes 4096 bytes 8192 bytesiiiiiiiiiiiiiiiiiiiiiiiiiiiiiiiiiiiiiiiiiiiiiiiiiiiiiiiiiiiiiiiiiiiiiiiiiiiiiiiiiiiiiccccccccccc
ccccccccccc
ccccccccccc
ccccccccccc
ccccccccccc
ccccccccccc
ccccccccccc
ccccccccccc
Table 2: Cache and TLB parameters measured using the memory hierarchy benchmark. The normalized penalty isthe ratio between the cache penalty time and the no-miss execution time per iteration. We define virtual pre-fetching as the ability of the machine to satisfy cache misses before the subunit that consumes the data needsthe values, which is manifested in the execution time as a zero-cycle miss delay. The miss penalty per line isthe delay that the program will experience on each access if it traverses a data structure in such way thateach reference touches a different line. The miss penalty (word) is the average penalty if the data is traversedsequentially. The DEC Alpha 4000/610 results are reported for both the first (on chip) level and second lev-el caches.
11
Effect of stride on the memory hierarchy: DEC 3100
0
2500
2250
(nsec)
1000
2000
1750
1500
1250
750
500
250
e
it
m1M
512K256K
128K
4M
2M
64K
stride (bytes)stride (bytes)
128K32K 2M512K8K2K512128328
stride (bytes)
cache miss:540 ns
line size:4 bytes
page size: 4096 bytes
TLB miss:480 ns
stride (bytes)stride (bytes)128K32K 2M512K8K2K512128328
stride (bytes)
0
2500
2250(nsec)
1000
2000
1750
1500
1250
750
500
250
e
it
m
64K
4M
2M
1M
512K256K128K
2750
3000
line size: 16 bytes
page size: 4096 bytes
cache size:
cache miss:1680 ns
Effect of stride on the memory hierarchy: DEC 5400
Effect of stride on the memory hierarchy: MIPS M/2000
64K
4M
2M
1M
512K256K
128K
stride (bytes)
0
stride (bytes)
128K32K 2M512K8K2K512128328
2500
2250
(nsec)
1000
2000
1750
1500
1250
750
500
250
e
it
m
stride (bytes)
1250
2500
2250
(nsec)
1000
2000
1750
1500
750
500
250
0
prefetching
Effect of stride on the memory hierarchy: IBM RS/6000 530
emit
stride (bytes)
64K
128K32K 2M512K8K
128K
256K
512K
1M
2M
4M
2K512128328
page size: 4096 bytes
line size: 128 bytes
cache miss:700 ns.
TLB miss:1080 ns
effective
page size: 4096
line size:64 bytes
cache miss(line): 1440 ns
TLB miss:350 ns
cache miss:(word): 800 ns
cache size:
(direct-mapped cache)
(fully associative TLB)
(direct-mapped cache)
(fully associative TLB)
(direct-mapped cache)
(fully associative TLB)
(write buffers)
(4-way associative)
(2-way associative TLB)
400 nsTLB miss:
cache size:
cache size:
Figure 2: Profile of the performance of the memory hierarchy (cache and TLB) on the DECstation 3100, MIPS M/2000, Decstation 5400, and IBM RS/6000530. Each curve indicates the amount of address space touched by the experiment and the stride represents the distance between two consecutiveaddresses.
12
0
2500
2250
1000
2000
1750
1500
1250
750
500
250
e
it
stride (bytes)stride (bytes)
128K32K 2M512K8K2K512128328
stride (bytes)
64Kcache size:
(nsec)
m
(nsec)(nsec)
4M2M1M512K256K128K
(direct-mapped cache)(virtual address)cache miss:
560 ns
line size:16 bytes
Effect of stride on the memory hierarchy: Sparcstation 1+ Effect of stride on the memory hierarchy: Sparcstation 1
3000
2750
ti
me
0
1500
1750
2000
1000
(nsec)
2250
2500
1250
8 32 128 512 2K 8K 512K 2M32K 128K
stride (bytes)
4M2M1M
512K
256K
cache miss:780 ns
line size:16 bytes
TLB entry granularity: 128 Kbytes
TLB miss:880 ns
(direct-mapped cache)
(virtual address)
(fully-associative TLB)
stride (bytes)stride (bytes)
128K32K 2M512K8K2K512128328
stride (bytes)
0
2500
2250
1000
2000
1750
1500
1250
750
500
250
e
it
(nsec)
m
(nsec)(nsec)
line size:32 bytes
page size: 8192 bytes
cache miss:480 ns
TLB miss:940 ns
cache size:256K
4M
2M
1M
512K
(fully-associative TLB)
(direct-mapped cache)
Effect of stride on the memory hierarchy: HP 9000/720
stride (bytes)
128K32K 2M512K8K2K512128328
1250
2500
2250
(nsec)
1000
2000
1750
1500
750
500
250
0
emit
Effect of stride on the memory hierarchy: VAX 9000
cache miss:
256K
512K
1M
2M
4M
128K
16M8M
line size 64 bytes
980 ns
page size: 8192 bytes
TLB miss: 280 ns
8M
(2-way associative TLB)
(2-way associative cache)(write buffers)
cache size:128K
cache size:
Figure 3: Profile of the performance of the memory hierarchy (cache and TLB) on the Sparcstation 1, Sparcstation 1+, HP 9000/720, and VAX 9000. Eachcurve indicates the amount of address space touched by the experiment and the stride represents the distance between two consecutive addresses.
13
460 nsno-miss time:
Effect of stride on the memory hierarchy: DEC 5500
260 ns
750 ns
16 bytes
(nsec)
2250
2500
250
500
750
1250
1500
1750
2000
1000
80
m
ti
eline size:
page size: 4096
TLB miss:
128K256K 512K (fully associative TLB)
(direct-mapped cache)
1M2M
4M
cache size:64K
cache miss
32 128 512 2K 8K 512K 2M32K 128Kstride (bytes)
512K
2M
16M
4M
8M
8M
Effect of stride on the memory hierarchy: DEC ALPHA
0
1250
1125
(nsec)
500
1000
875
750
675
375
250
125
e
it
m
128K32K 2M512K8K2K512128328stride (bytes)
TLB miss:
(fully associative TLB)
cache size: 8K1st-level1st-level cache
page size: 8192 bytes
2nd-level cachemiss penalty: 410 ns
miss penalty: 46 ns
250 ns
2nd-levelcache size: 1M
(direct-mapped 1st-level cache)(16-way associative 2nd-level cache)
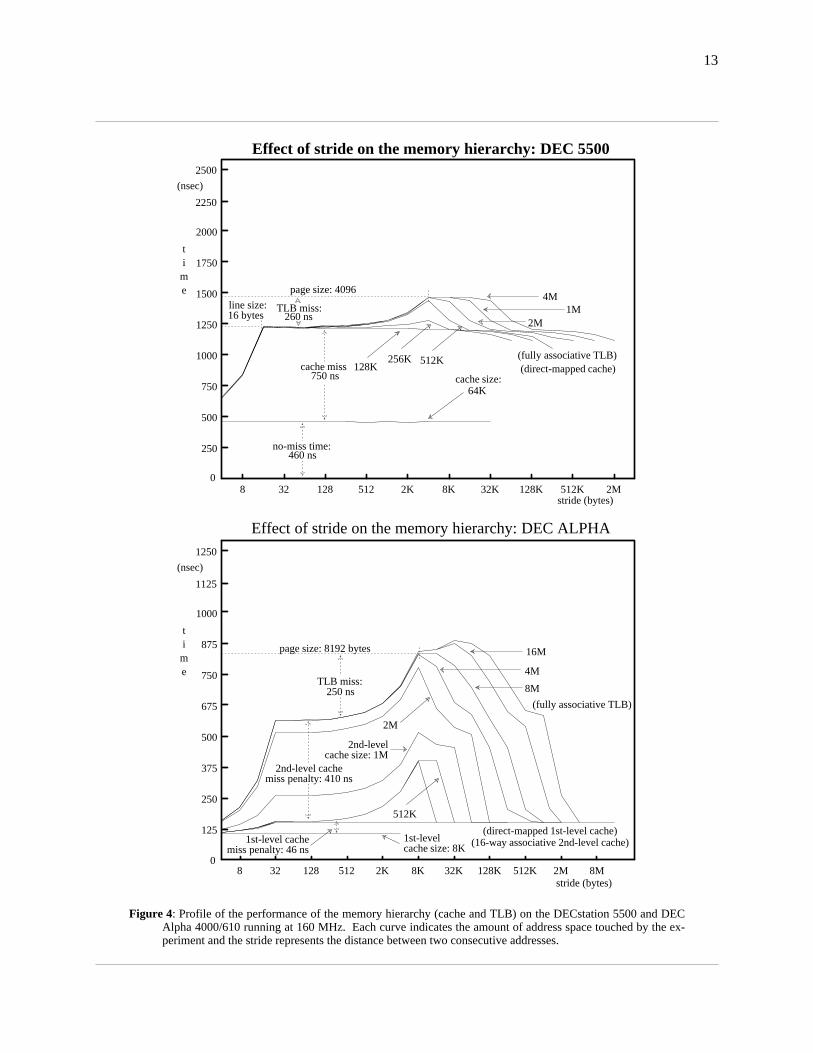
Figure 4: Profile of the performance of the memory hierarchy (cache and TLB) on the DECstation 5500 and DECAlpha 4000/610 running at 160 MHz. Each curve indicates the amount of address space touched by the ex-periment and the stride represents the distance between two consecutive addresses.
14
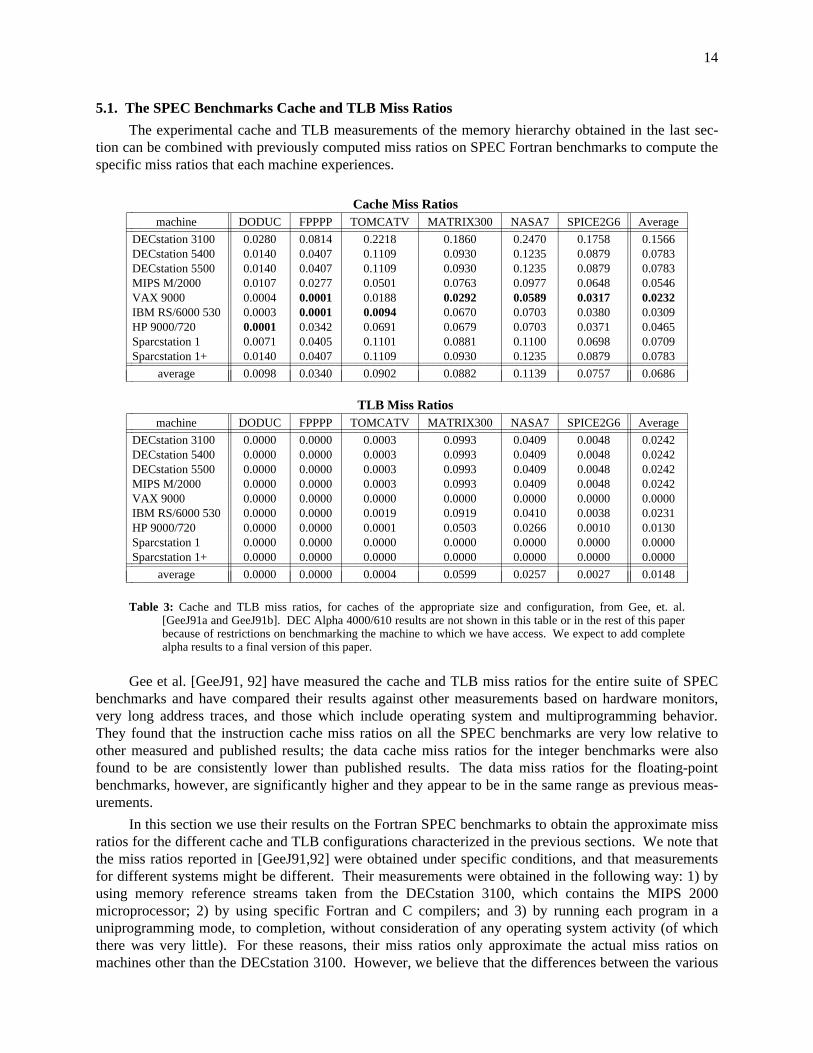
5.1. The SPEC Benchmarks Cache and TLB Miss Ratios
The experimental cache and TLB measurements of the memory hierarchy obtained in the last sec-tion can be combined with previously computed miss ratios on SPEC Fortran benchmarks to compute thespecific miss ratios that each machine experiences.
Cache Miss Ratiosiiiiiiiiiiiiiiiiiiiiiiiiiiiiiiiiiiiiiiiiiiiiiiiiiiiiiiiiiiiiiiiiiiiiiiiiiiiiiiiiiiiiiiiiiiiiiimachine DODUC FPPPP TOMCATV MATRIX300 NASA7 SPICE2G6 Averageiiiiiiiiiiiiiiiiiiiiiiiiiiiiiiiiiiiiiiiiiiiiiiiiiiiiiiiiiiiiiiiiiiiiiiiiiiiiiiiiiiiiiiiiiiiiiiiiiiiiiiiiiiiiiiiiiiiiiiiiiiiiiiiiiiiiiiiiiiiiiiiiiiiiiiiiiiiiiiiiiiiiiiiiiiiiiiiiiiiiiiiiiiii
DECstation 3100 0.0280 0.0814 0.2218 0.1860 0.2470 0.1758 0.1566DECstation 5400 0.0140 0.0407 0.1109 0.0930 0.1235 0.0879 0.0783DECstation 5500 0.0140 0.0407 0.1109 0.0930 0.1235 0.0879 0.0783MIPS M/2000 0.0107 0.0277 0.0501 0.0763 0.0977 0.0648 0.0546VAX 9000 0.0004 0.0001 0.0188 0.0292 0.0589 0.0317 0.0232IBM RS/6000 530 0.0003 0.0001 0.0094 0.0670 0.0703 0.0380 0.0309HP 9000/720 0.0001 0.0342 0.0691 0.0679 0.0703 0.0371 0.0465Sparcstation 1 0.0071 0.0405 0.1101 0.0881 0.1100 0.0698 0.0709Sparcstation 1+ 0.0140 0.0407 0.1109 0.0930 0.1235 0.0879 0.0783iiiiiiiiiiiiiiiiiiiiiiiiiiiiiiiiiiiiiiiiiiiiiiiiiiiiiiiiiiiiiiiiiiiiiiiiiiiiiiiiiiiiiiiiiiiiiiiiiiiiiiiiiiiiiiiiiiiiiiiiiiiiiiiiiiiiiiiiiiiiiiiiiiiiiiiiiiiiiiiiiiiiiiiiiiiiiiiiiiiiiiiiiiiiccccccccccccccc
average ccccccccccccccc
ccccccccccccccc
0.0098 ccccccccccccccc
0.0340 ccccccccccccccc
0.0902 ccccccccccccccc
0.0882 ccccccccccccccc
0.1139 ccccccccccccccc
0.0757 ccccccccccccccc
ccccccccccccccc
0.0686 ccccccccccccccc
iiiiiiiiiiiiiiiiiiiiiiiiiiiiiiiiiiiiiiiiiiiiiiiiiiiiiiiiiiiiiiiiiiiiiiiiiiiiiiiiiiiiiiiiiiiiii
TLB Miss Ratiosiiiiiiiiiiiiiiiiiiiiiiiiiiiiiiiiiiiiiiiiiiiiiiiiiiiiiiiiiiiiiiiiiiiiiiiiiiiiiiiiiiiiiiiiiiiiiimachine DODUC FPPPP TOMCATV MATRIX300 NASA7 SPICE2G6 Averageiiiiiiiiiiiiiiiiiiiiiiiiiiiiiiiiiiiiiiiiiiiiiiiiiiiiiiiiiiiiiiiiiiiiiiiiiiiiiiiiiiiiiiiiiiiiiiiiiiiiiiiiiiiiiiiiiiiiiiiiiiiiiiiiiiiiiiiiiiiiiiiiiiiiiiiiiiiiiiiiiiiiiiiiiiiiiiiiiiiiiiiiiiii
DECstation 3100 0.0000 0.0000 0.0003 0.0993 0.0409 0.0048 0.0242DECstation 5400 0.0000 0.0000 0.0003 0.0993 0.0409 0.0048 0.0242DECstation 5500 0.0000 0.0000 0.0003 0.0993 0.0409 0.0048 0.0242MIPS M/2000 0.0000 0.0000 0.0003 0.0993 0.0409 0.0048 0.0242VAX 9000 0.0000 0.0000 0.0000 0.0000 0.0000 0.0000 0.0000IBM RS/6000 530 0.0000 0.0000 0.0019 0.0919 0.0410 0.0038 0.0231HP 9000/720 0.0000 0.0000 0.0001 0.0503 0.0266 0.0010 0.0130Sparcstation 1 0.0000 0.0000 0.0000 0.0000 0.0000 0.0000 0.0000Sparcstation 1+ 0.0000 0.0000 0.0000 0.0000 0.0000 0.0000 0.0000iiiiiiiiiiiiiiiiiiiiiiiiiiiiiiiiiiiiiiiiiiiiiiiiiiiiiiiiiiiiiiiiiiiiiiiiiiiiiiiiiiiiiiiiiiiiiiiiiiiiiiiiiiiiiiiiiiiiiiiiiiiiiiiiiiiiiiiiiiiiiiiiiiiiiiiiiiiiiiiiiiiiiiiiiiiiiiiiiiiiiiiiiiii
average 0.0000 0.0000 0.0004 0.0599 0.0257 0.0027 0.0148iiiiiiiiiiiiiiiiiiiiiiiiiiiiiiiiiiiiiiiiiiiiiiiiiiiiiiiiiiiiiiiiiiiiiiiiiiiiiiiiiiiiiiiiiiiiiiccccccccccccccc
ccccccccccccccc
ccccccccccccccc
ccccccccccccccc
ccccccccccccccc
ccccccccccccccc
ccccccccccccccc
ccccccccccccccc
ccccccccccccccc
ccccccccccccccc
ccccccccccccccc
Table 3: Cache and TLB miss ratios, for caches of the appropriate size and configuration, from Gee, et. al.[GeeJ91a and GeeJ91b]. DEC Alpha 4000/610 results are not shown in this table or in the rest of this paperbecause of restrictions on benchmarking the machine to which we have access. We expect to add completealpha results to a final version of this paper.
Gee et al. [GeeJ91, 92] have measured the cache and TLB miss ratios for the entire suite of SPECbenchmarks and have compared their results against other measurements based on hardware monitors,very long address traces, and those which include operating system and multiprogramming behavior.They found that the instruction cache miss ratios on all the SPEC benchmarks are very low relative toother measured and published results; the data cache miss ratios for the integer benchmarks were alsofound to be are consistently lower than published results. The data miss ratios for the floating-pointbenchmarks, however, are significantly higher and they appear to be in the same range as previous meas-urements.
In this section we use their results on the Fortran SPEC benchmarks to obtain the approximate missratios for the different cache and TLB configurations characterized in the previous sections. We note thatthe miss ratios reported in [GeeJ91,92] were obtained under specific conditions, and that measurementsfor different systems might be different. Their measurements were obtained in the following way: 1) byusing memory reference streams taken from the DECstation 3100, which contains the MIPS 2000microprocessor; 2) by using specific Fortran and C compilers; and 3) by running each program in auniprogramming mode, to completion, without consideration of any operating system activity (of whichthere was very little). For these reasons, their miss ratios only approximate the actual miss ratios onmachines other than the DECstation 3100. However, we believe that the differences between the various
15
machines and their compilers are not so large as to invalidate the use of these results.
In table 3 we present the cache and TLB miss ratios for the different machines. All the results,except those for the DECstation 3100, were obtained by using the parameters shown in table 2 and usingthe results published in [GeeJ91,92]. The cache miss ratios for the DECstation 3100 were not obtaineddirectly from their tables; the block size on this machine is only 4 bytes, while the cache miss ratios pub-lished in [GeeJ91] were computed for block sizes ranging from 16 to 256 bytes. However, we have madea rough approximation of the miss ratios on the DECstation 3100 by doubling the results computed for aline size of 16 bytes. We did this based on the observation that the precision of floating-point numbersused in the Fortran SPEC benchmarks is 8 bytes, and hence on a machine with a 32-bit memory interface,reading or writing the second part of a floating-point number never generates a miss, if the line size is atleast 8 bytes long. On the other hand, when the line size is only 4 bytes long, if the first part of thefloating-point number misses, then the second part also generates a miss. (An alternate approach wouldbe to use the "ratio of ratios" from [Smit87], which would suggest increasing the data miss ratios byaround a factor of 2.5.)
In table 3, the smallest cache miss ratios for each of the programs are highlighted. The effect ofassociativity and a large block size can be seen in the miss ratios of the IBM RS/6000 530. The averagemiss ratio on this machine, which has a 64KB, 4-way set associative cache with a 128-byte block size, is0.0309. Even though the RS/6000 has a very high miss penalty, the absolute loss of performance fromcache misses can be seen from table 4 to be the smallest of all of the machines shown. It is also interest-ing to note that the VAX 9000 has the lowest average cache miss ratio of all machines, although it alsohas the highest normalized miss penalty. This machine has a 128KB, 2-way set associative cache with a64-byte line. Hence, at least with respect to this particular workload, it is not the machine having thelargest cache size, or the longest cache line, or the highest degree of associativity, or the one with thesmallest miss ratio, but the one which combines the three factors in the most effective way.
Execution Time Penalty: Cacheiiiiiiiiiiiiiiiiiiiiiiiiiiiiiiiiiiiiiiiiiiiiiiiiiiiiiiiiiiiiiiiiiiiiiiiiiiiiiiiiiiiiiiiiiiiiiiiiiiiiiiiiiiiiiiiiiiiiimachine DODUC FPPPP TOMCATV MATRIX300 NASA7 SPICE2G6 Totaliiiiiiiiiiiiiiiiiiiiiiiiiiiiiiiiiiiiiiiiiiiiiiiiiiiiiiiiiiiiiiiiiiiiiiiiiiiiiiiiiiiiiiiiiiiiiiiiiiiiiiiiiiiiiiiiiiiiiiiiiiiiiiiiiiiiiiiiiiiiiiiiiiiiiiiiiiiiiiiiiiiiiiiiiiiiiiiiiiiiiiiiiiiiiiiiiiiiiiiiiiiiiiiiiiiiiiiiiiiiiiiiiiiiiiiiii
DECstation 3100 4.41 (1.27) 33.29 (5.28) 54.69 (8.83) 65.89 (5.94) 314.81 (8.31) 393.41 (10.61) 866.50 (8.49)DECstation 5400 6.86 (2.12) 51.78 (9.03) 85.07 (15.93) 102.49 (11.21) 489.70 (15.28) 611.97 (18.09) 1347.87 (15.09)DECstation 5500 3.06 (1.71) 23.12 (7.30) 37.98 (10.76) 45.75 (7.21) 218.61 (9.83) 273.20 (12.27) 601.73 (10.14)MIPS M/2000 2.50 (1.36) 16.78 (7.29) 18.30 (3.49) 40.04 (5.16) 184.47 (6.78) 214.83 (4.93) 476.93 (5.42)VAX 9000 0.09 (0.17) 0.06 (0.14) 6.35 (7.33) 14.17 (8.01) 102.87 (20.73) 97.21 (6.38) 220.75 (9.28)IBM RS/6000 530 0.03 (0.02) 0.03 (0.03) 1.50 (0.77) 15.38 (2.50) 58.07 (3.76) 55.12 (2.31) 130.13 (2.62)HP 9000/720 0.01 (0.01) 9.32 (13.57) 11.36 (6.66) 16.03 (2.75) 59.73 (5.02) 55.35 (3.61) 151.81 (4.18)SPARCstation 1 1.62 (0.47) 23.92 (7.10) 39.21 (7.37) 45.08 (3.59) 202.51 (4.12) 225.62 (6.70) 537.96 (5.00)SPARCstation 1+ 2.29 (0.55) 17.26 (2.97) 28.36 (5.09) 34.16 (2.56) 163.23 (3.15) 203.99 (4.54) 449.29 (3.57)iiiiiiiiiiiiiiiiiiiiiiiiiiiiiiiiiiiiiiiiiiiiiiiiiiiiiiiiiiiiiiiiiiiiiiiiiiiiiiiiiiiiiiiiiiiiiiiiiiiiiiiiiiiiiiiiiiiiiiiiiiiiiiiiiiiiiiiiiiiiiiiiiiiiiiiiiiiiiiiiiiiiiiiiiiiiiiiiiiiiiiiiiiiiiiiiiiiiiiiiiiiiiiiiiiiiiiiiiiiiiiiiiiiiiiiiiiccccccccccccccc
average ccccccccccccccc
ccccccccccccccc
2.32 (0.85) ccccccccccccccc
19.51 (5.86) ccccccccccccccc
31.42 (7.36) ccccccccccccccc
42.11 (5.44) ccccccccccccccc
199.33 (8.55) ccccccccccccccc
236.74 (7.72) ccccccccccccccc
ccccccccccccccc
531.44 (7.09) ccccccccccccccc
iiiiiiiiiiiiiiiiiiiiiiiiiiiiiiiiiiiiiiiiiiiiiiiiiiiiiiiiiiiiiiiiiiiiiiiiiiiiiiiiiiiiiiiiiiiiiiiiiiiiiiiiiiiiiiiiiiiii
Execution Time Penalty: TLBiiiiiiiiiiiiiiiiiiiiiiiiiiiiiiiiiiiiiiiiiiiiiiiiiiiiiiiiiiiiiiiiiiiiiiiiiiiiiiiiiiiiiiiiiiiiiiiiiiiiiiiiiiiiiiiiiiiiimachine DODUC FPPPP TOMCATV MATRIX300 NASA7 SPICE2G6 Totaliiiiiiiiiiiiiiiiiiiiiiiiiiiiiiiiiiiiiiiiiiiiiiiiiiiiiiiiiiiiiiiiiiiiiiiiiiiiiiiiiiiiiiiiiiiiiiiiiiiiiiiiiiiiiiiiiiiiiiiiiiiiiiiiiiiiiiiiiiiiiiiiiiiiiiiiiiiiiiiiiiiiiiiiiiiiiiiiiiiiiiiiiiiiiiiiiiiiiiiiiiiiiiiiiiiiiiiiiiiiiiiiiiiiiiiiii
DECstation 3100 0.00 (0.00) 0.00 (0.00) 0.07 (0.01) 31.27 (2.73) 46.34 (1.14) 9.55 (0.23) 87.23 (0.79)DECstation 5400 0.00 (0.00) 0.00 (0.00) 0.05 (0.01) 26.05 (2.63) 38.61 (1.06) 7.96 (0.20) 72.67 (0.71)DECstation 5500 0.00 (0.00) 0.00 (0.00) 0.04 (0.01) 16.94 (2.55) 25.10 (1.04) 5.17 (0.21) 47.25 (0.73)MIPS M/2000 0.00 (0.00) 0.00 (0.00) 0.05 (0.01) 22.80 (2.87) 33.79 (1.18) 6.96 (0.15) 63.60 (0.69)VAX 9000 0.00 (0.00) 0.00 (0.00) 0.00 (0.00) 0.00 (0.00) 0.00 (0.00) 0.00 (0.00) 0.00 (0.00)IBM RS/6000 530 0.00 (0.00) 0.00 (0.00) 0.94 (0.48) 65.11 (11.53) 104.51 (6.98) 17.01 (0.70) 187.57 (3.82)HP 9000/720 0.00 (0.00) 0.00 (0.00) 0.04 (0.02) 31.02 (5.47) 59.02 (4.96) 3.90 (0.25) 93.98 (2.55)Sparcstation 1 0.00 (0.00) 0.00 (0.00) 0.00 (0.00) 0.00 (0.00) 0.00 (0.00) 0.00 (0.00) 0.00 (0.00)Sparcstation 1+ 0.00 (0.00) 0.00 (0.00) 0.00 (0.00) 0.00 (0.00) 0.00 (0.00) 0.00 (0.00) 0.00 (0.00)iiiiiiiiiiiiiiiiiiiiiiiiiiiiiiiiiiiiiiiiiiiiiiiiiiiiiiiiiiiiiiiiiiiiiiiiiiiiiiiiiiiiiiiiiiiiiiiiiiiiiiiiiiiiiiiiiiiiiiiiiiiiiiiiiiiiiiiiiiiiiiiiiiiiiiiiiiiiiiiiiiiiiiiiiiiiiiiiiiiiiiiiiiiiiiiiiiiiiiiiiiiiiiiiiiiiiiiiiiiiiiiiiiiiiiiiii
average 0.00 (0.00) 0.00 (0.00) 0.13 (0.06) 21.47 (3.09) 34.15 (1.82) 5.62 (0.19) 61.37 (1.03)iiiiiiiiiiiiiiiiiiiiiiiiiiiiiiiiiiiiiiiiiiiiiiiiiiiiiiiiiiiiiiiiiiiiiiiiiiiiiiiiiiiiiiiiiiiiiiiiiiiiiiiiiiiiiiiiiiiiiccccccccccccccc
ccccccccccccccc
ccccccccccccccc
ccccccccccccccc
ccccccccccccccc
ccccccccccccccc
ccccccccccccccc
ccccccccccccccc
ccccccccccccccc
ccccccccccccccc
ccccccccccccccc
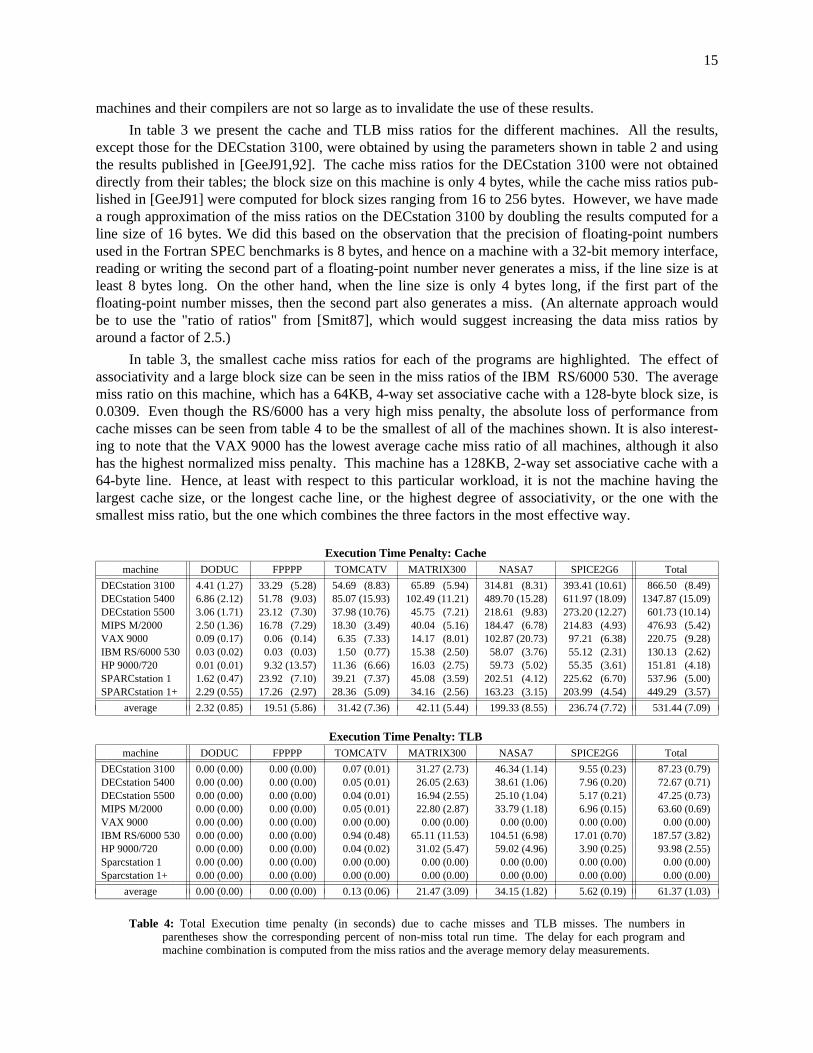
Table 4: Total Execution time penalty (in seconds) due to cache misses and TLB misses. The numbers inparentheses show the corresponding percent of non-miss total run time. The delay for each program andmachine combination is computed from the miss ratios and the average memory delay measurements.
16
With respect to the TLB, only three of the six programs exhibit TLB miss ratios that measurablyaffect the execution time of the programs on the DECstations, MIPS M/2000, IBM RS/6000 530, and HP9000/720. On these machines, the TLB miss ratio for MATRIX300 is almost 0.10, and for NASA7 it isclose to 0.04. Furthermore, the degree of associativity appears not to affect the TLB miss ratios on thesetwo programs. The results in [GeeJ92], however, indicate that a TLB with 256 entries, 2-way set associa-tive and with an entry granularity of 8KB will have miss ratios of less than 0.0001 on all SPEC bench-marks. Thus, we expect that the current SPEC benchmark suite will not at all test the performance of theTLB in new machines by the middle of this decade.
5.2. Execution Time Delay Due to Cache and TLB Misses
In table 4 we combine the cache and TLB miss ratios of the SPEC Fortran programs with thememory delays measured on each of the machines to compute the execution time penalty due to cacheand TLB misses. The results show that the delay due to TLB misses on benchmarks MATRIX300 andNASA7 is as large as the delay due to cache misses. Moreover, on the IBM RS/6000 530 the total delaydue to TLB misses (187.57 sec) is larger than the delay due to cache misses (130.13).
iiiiiiiiiiiiiiiiiiiiiiiiiiiiiiiiiiiiiiiiiiiiiiiiiiiiiiiiiiiiiiiiiiiiiiiiiiiiiiiiiiiiiiiiiiiiiiiiiiiiiiiSpice2g6 Excluded Spice2g6 Includediiiiiiiiiiiiiiiiiiiiiiiiiiiiiiiiiiiiiiiiiiiiiiiiiiiiiiiiiiiiiiiiiiiiiiiiiiiiiiiiiiiiii
Without Latency With Latency Without Latency With Latencyiiiiiiiiiiiiiiiiiiiiiiiiiiiiiiiiiiiiiiiiiiiiiiiiiiiiiiiiiiiiiiiiiiiiiiiiiiiiiiiiiiiiiimachine average root mean average root mean average root mean average root mean
error square error square error square error squareiiiiiiiiiiiiiiiiiiiiiiiiiiiiiiiiiiiiiiiiiiiiiiiiiiiiiiiiiiiiiiiiiiiiiiiiiiiiiiiiiiiiiiiiiiiiiiiiiiiiiiiiiiiiiiiiiiiiiiiiiiiiiiiiiiiiiiiiiiiiiiiiiiiiiiiiiiiiiiiiiiiiiiiiiiiiiiiiiiiiiiiiiiiiiiiiiiiiiiiiiiiiiiDECstation 3100 −9.56 % 14.34 % −3.30 % 11.47 % −1.47 % 20.62 % 5.39 % 22.52 %DECstation 5400 −8.44 % 12.77 % 1.79 % 11.01 % −0.90 % 19.00 % 10.21 % 23.59 %DECstation 5500 −18.84 % 22.81 % −11.36 % 17.02 % −7.29 % 29.29 % 0.79 % 29.55 %MIPS M/2000 −9.91 % 16.65 % −4.51 % 13.24 % −8.39 % 15.20 % −3.08 % 12.20 %VAX 9000 −6.44 % 24.09 % −0.24 % 20.57 % −8.07 % 22.96 % −1.91 % 19.24 %IBM RS/6000 530 0.64 % 20.95 % 5.42 % 19.35 % 7.00 % 24.84 % 11.48 % 24.56 %HP 9000/720 −11.40 % 22.48 % −4.41 % 20.32 % −6.55 % 21.76 % −0.11 % 20.51 %Sparcstation 1 −6.73 % 22.84 % −2.43 % 23.08 % 0.50 % 25.66 % 5.13 % 27.41 %Sparcstation 1+ −15.56 % 23.26 % −12.83 % 21.78 % −6.57 % 22.31 % −9.57 % 22.81 %iiiiiiiiiiiiiiiiiiiiiiiiiiiiiiiiiiiiiiiiiiiiiiiiiiiiiiiiiiiiiiiiiiiiiiiiiiiiiiiiiiiiiiiiiiiiiiiiiiiiiiiiiiiiiiiiiiiiiiiiiiiiiiiiiiiiiiiiiiiiiiiiiiiiiiiiiiiiiiiiiiiiiiiiiiiiiiiiiiiiiiiiiiiiiiiiiiiiiiiiiiiiii
overall −9.58 % 20.42 % −3.54 % 18.06 % −3.86 % 22.9278 % 2.37 % 22.78 %iiiiiiiiiiiiiiiiiiiiiiiiiiiiiiiiiiiiiiiiiiiiiiiiiiiiiiiiiiiiiiiiiiiiiiiiiiiiiiiiiiiiiiiiiiiiiiiiiiiiiiiccccccccccccccccccc
ccccccccccccccccccc
ccccccccccccccccccc
cccccccccccccccc
ccccccccccccccccc
cccccccccccccccc
ccccccccccccccccccc
ccccccccccccccccccc
cccccccccccccccc
ccccccccccccccccc
cccccccccccccccc
ccccccccccccccccccc
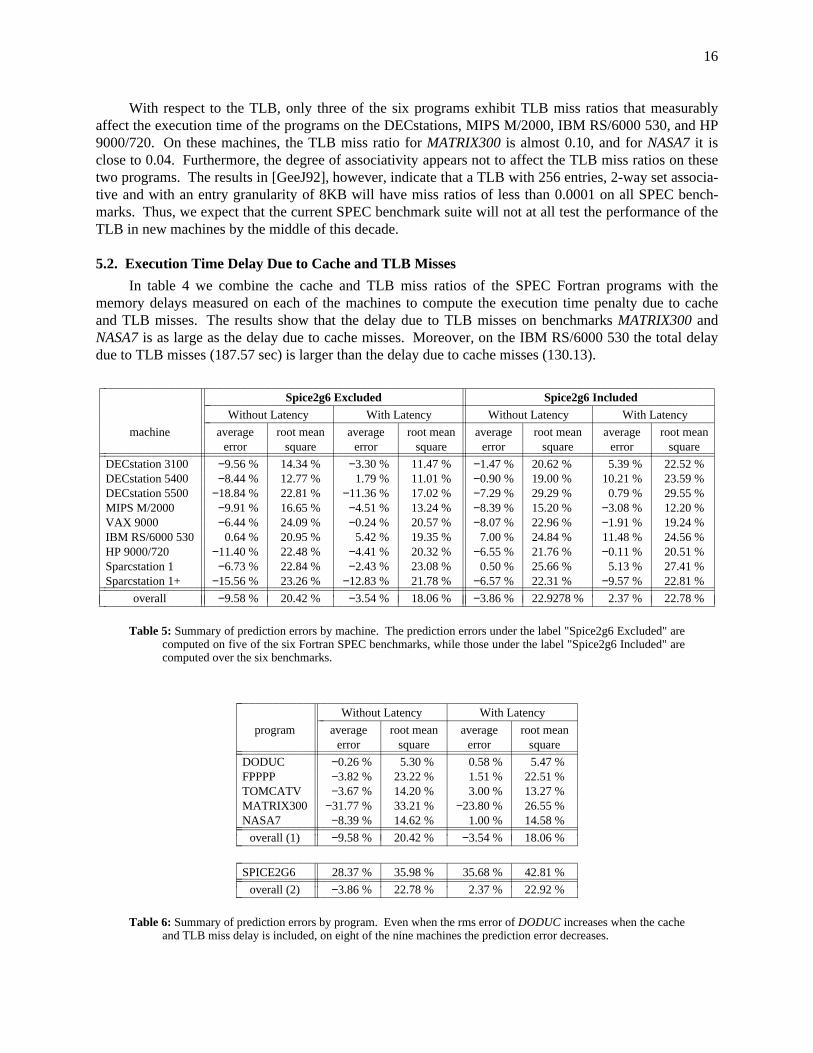
Table 5: Summary of prediction errors by machine. The prediction errors under the label "Spice2g6 Excluded" arecomputed on five of the six Fortran SPEC benchmarks, while those under the label "Spice2g6 Included" arecomputed over the six benchmarks.
iiiiiiiiiiiiiiiiiiiiiiiiiiiiiiiiiiiiiiiiiiiiiiiiiiiiiiiiiiWithout Latency With Latencyiiiiiiiiiiiiiiiiiiiiiiiiiiiiiiiiiiiiiiiiiiii
program average root mean average root meanerror square error squareiiiiiiiiiiiiiiiiiiiiiiiiiiiiiiiiiiiiiiiiiiiiiiiiiiiiiiiiiiiiiiiiiiiiiiiiiiiiiiiiiiiiiiiiiiiiiiiiiiiiiiiiiiiiiiiiiiii
DODUC −0.26 % 5.30 % 0.58 % 5.47 %FPPPP −3.82 % 23.22 % 1.51 % 22.51 %TOMCATV −3.67 % 14.20 % 3.00 % 13.27 %MATRIX300 −31.77 % 33.21 % −23.80 % 26.55 %NASA7 −8.39 % 14.62 % 1.00 % 14.58 %iiiiiiiiiiiiiiiiiiiiiiiiiiiiiiiiiiiiiiiiiiiiiiiiiiiiiiiiiiiiiiiiiiiiiiiiiiiiiiiiiiiiiiiiiiiiiiiiiiiiiiiiiiiiiiiiiiiicccccccccccc
overall (1) cccccccccccc
cccccccccccc
−9.58 % ccccccccccc
20.42 % cccccccccccc
−3.54 % ccccccccccc
18.06 % cccccccccccc
iiiiiiiiiiiiiiiiiiiiiiiiiiiiiiiiiiiiiiiiiiiiiiiiiiiiiiiiiiiiiiiiiiiiiiiiiiiiiiiiiiiiiiiiiiiiiiiiiiiiiiiiiiiiiiiiiiiiSPICE2G6 28.37 % 35.98 % 35.68 % 42.81 %iiiiiiiiiiiiiiiiiiiiiiiiiiiiiiiiiiiiiiiiiiiiiiiiiiiiiiiiiiiiiiiiiiiiiiiiiiiiiiiiiiiiiiiiiiiiiiiiiiiiiiiiiiiiiiiiiiii
overall (2) −3.86 % 22.78 % 2.37 % 22.92 %iiiiiiiiiiiiiiiiiiiiiiiiiiiiiiiiiiiiiiiiiiiiiiiiiiiiiiiiiiccc
ccc
ccc
ccc
ccc
ccc
ccc
Table 6: Summary of prediction errors by program. Even when the rms error of DODUC increases when the cacheand TLB miss delay is included, on eight of the nine machines the prediction error decreases.
17
5.3. Execution Prediction with Locality Delay
We now have estimates of the execution time delays due to cache and TLB misses and in this sec-tion we determine whether including that factor improves our execution time predictions. We do thisanalysis twice, once with the SPICE2G6 benchmark and once without; this is because our original predic-tion (see [Saav92a,b] and table 6) for that program was significantly high, and thus adding additionaldelays can not only make that prediction worse, but could obscure an otherwise general improvement. Asummary of the prediction errors is given in tables 5 and 6. The complete results, including the indivi-dual execution time predictions and prediction errors are given in [Saav92a]. In the tables, a negative(positive) average error means that our prediction was lower (greater) than the actual execution time.
The results in table 5 indicate that if the results for benchmark SPICE2G6 are not considered, thenthe average error decreases in magnitude for all but one machine (the IBM RS/6000), and the root meansquare (rms) error also decreases for all but one machine (the Sparcstation I). The overall average errordecreases from −9.58% to −3.54%, while the rms error decreases from 20.42% to 18.06%. The rms erroron the Sparcstation 1 increases because our predictions on FPPPP and TOMCATV have a positive erroreven when locality effects are ignored. Likewise, the average positive error for the RS/6000 increases.The skewness in the distribution of average errors appears to decrease when locality is taken into account.When locality is ignored, the average errors range from −18.84 to +0.64, but with the delay factor theerrors range from −12.83 to +5.42.
If we include SPICE2G6, then we see that the overall rms error decreases very little, from 22.92%to 22.78%, while the average error changes from −3.86 to +2.37. The distribution of average errors, how-ever, also presents less skewness. In fact, when locality is ignored, the number of machines with negativeand positive average errors are 7 and 2 respectively. The corresponding numbers when our predictionstake into account locality are 4 and 5.
With respect to the programs (table 6), the results show that the overall rms errors improve for fourout of the six benchmarks. The only benchmarks for which the rms error increases are DODUC andSPICE2G6. Although the overall rms error on DODUC increases, the individual predictions show that oneight of the nine machines the prediction error decreases or remains constant [Saav92a]. The reason whythe overall error increases is because the error on the MIPS M/2000, which is the one that increases, ismuch larger than the other eight errors2. Of all the programs, the one which experiences the largestimprovement is MATRIX300, where the average error decreases from -31.77% to 23.80%.
5.4. The Effect of the Memory System on Performance
In this section we use the results of §6.2 to evaluate the effect of the different memory systems onthe overall performance of the machines. We do this by computing, for each of the Fortran SPEC bench-marks, a new SPECratio which is our estimate of the performance of that program on that machine, givenzero cache and TLB misses.
The baseline SPECratios we use here have been taken from the original SPEC reports [SPEC90aSPEC90b SPEC91a, SPEC91b], except for the VAX 9000, which we benchmarked ourselves. We alsochanged a few of the original SPEC numbers, in particular, we ignored the lastest SPECratios forMATRIX300 on the HP-9000/720, the IBM RS/6000 series, and the Sparcstations. Here we decided touse older results or re-executed the benchmark without using the machines’ optimizing preprocessors.The reason for this is that these preprocessors change the original matrix multiply algorithm, which isbased on the SAXPY routine, and replace it by a blocking algorithm. These blocking algorithms exhibitsignificantly lower miss ratios than the ones computed by Gee et al. [Gee91], and would thus make ouranalysis meaningless.
hhhhhhhhhhhhhhhh2 The rms error is a non linear function which assigns more weight to the largest values.
18
SPECratios: With and Without Locality Effectsiiiiiiiiiiiiiiiiiiiiiiiiiiiiiiiiiiiiiiiiiiiiiiiiiiiiiiiiiiiiiiiiiiiiiiiiiiiiiiiiiiiiiiiiiiiiiiiiiiiiiiiimachine DODUC FPPPP TOMCATV MATRIX300 NASA7 SPICE2G6 SPECfpiiiiiiiiiiiiiiiiiiiiiiiiiiiiiiiiiiiiiiiiiiiiiiiiiiiiiiiiiiiiiiiiiiiiiiiiiiiiiiiiiiiiiiiiiiiiiiiiiiiiiiiiiiiiiiiiiiiiiiiiiiiiiiiiiiiiiiiiiiiiiiiiiiiiiiiiiiiiiiiiiiiiiiiiiiiiiiiiiiiiiiiiiiiiiiiiiiiiiiiiiiiiiiii
DECstation 3100 orig. 11.31 12.51 9.88 9.84 13.18 9.49 10.95modi. 11.62 14.49 12.42 12.48 17.26 11.30 13.11iiiiiiiiiiiiiiiiiiiiiiiiiiiiiiiiiiiiiiiiiiiiiiiiiiiiiiiiiiiiiiiiiiiiiiiiiiiiiiiiiiiiiiidiff. 2.68 % 13.71 % 20.43 % 21.13 % 23.68 % 15.97 % 16.54 %iiiiiiiiiiiiiiiiiiiiiiiiiiiiiiiiiiiiiiiiiiiiiiiiiiiiiiiiiiiiiiiiiiiiiiiiiiiiiiiiiiiiiiiiiiiiiiiiiiiiiiii
DECstation 5400 orig. 12.80 13.37 9.88 10.43 12.81 9.10 11.27modi. 13.43 17.32 14.47 14.81 19.31 11.90 15.02iiiiiiiiiiiiiiiiiiiiiiiiiiiiiiiiiiiiiiiiiiiiiiiiiiiiiiiiiiiiiiiiiiiiiiiiiiiiiiiiiiiiiiidiff. 4.71 % 22.79 % 31.74 % 29.62 % 33.68 % 23.55 % 24.91 %iiiiiiiiiiiiiiiiiiiiiiiiiiiiiiiiiiiiiiiiiiiiiiiiiiiiiiiiiiiiiiiiiiiiiiiiiiiiiiiiiiiiiiiiiiiiiiiiiiiiiiii
DECstation 5500 orig. 21.15 25.72 19.59 19.61 26.05 16.41 21.14modi. 21.91 31.99 27.26 26.93 38.08 20.27 27.11iiiiiiiiiiiiiiiiiiiiiiiiiiiiiiiiiiiiiiiiiiiiiiiiiiiiiiiiiiiiiiiiiiiiiiiiiiiiiiiiiiiiiiidiff. 3.47 % 19.58 % 28.11 % 27.17 % 31.60 % 19.07 % 22.01 %iiiiiiiiiiiiiiiiiiiiiiiiiiiiiiiiiiiiiiiiiiiiiiiiiiiiiiiiiiiiiiiiiiiiiiiiiiiiiiiiiiiiiiiiiiiiiiiiiiiiiiii
MIPS M/2000 orig. 17.58 20.39 17.66 13.31 18.37 12.07 16.29modi. 18.00 22.98 20.12 16.33 22.94 13.59 18.67iiiiiiiiiiiiiiiiiiiiiiiiiiiiiiiiiiiiiiiiiiiiiiiiiiiiiiiiiiiiiiiiiiiiiiiiiiiiiiiiiiiiiiidiff. 2.36 % 11.26 % 12.23 % 18.48 % 19.95 % 11.18 % 12.76 %iiiiiiiiiiiiiiiiiiiiiiiiiiiiiiiiiiiiiiiiiiiiiiiiiiiiiiiiiiiiiiiiiiiiiiiiiiiiiiiiiiiiiiiiiiiiiiiiiiiiiiii
VAX 9000 orig. 46.81 69.52 40.32 43.64 46.00 46.00 47.92modi. 46.92 69.62 44.63 50.54 60.17 56.56 54.10iiiiiiiiiiiiiiiiiiiiiiiiiiiiiiiiiiiiiiiiiiiiiiiiiiiiiiiiiiiiiiiiiiiiiiiiiiiiiiiiiiiiiiidiff. 0.23 % 0.14 % 9.67 % 13.66 % 23.55 % 18.67 % 11.42 %iiiiiiiiiiiiiiiiiiiiiiiiiiiiiiiiiiiiiiiiiiiiiiiiiiiiiiiiiiiiiiiiiiiiiiiiiiiiiiiiiiiiiiiiiiiiiiiiiiiiiiii
IBM RS/6000 530 orig. 27.68 54.74 75.69 21.80 35.48 27.59 36.71modi. 27.69 54.77 81.36 35.60 49.76 30.09 43.29iiiiiiiiiiiiiiiiiiiiiiiiiiiiiiiiiiiiiiiiiiiiiiiiiiiiiiiiiiiiiiiiiiiiiiiiiiiiiiiiiiiiiiidiff. 0.05 % 0.05 % 6.97 % 38.77 % 28.70 % 8.31 % 15.20 %iiiiiiiiiiiiiiiiiiiiiiiiiiiiiiiiiiiiiiiiiiiiiiiiiiiiiiiiiiiiiiiiiiiiiiiiiiiiiiiiiiiiiiiiiiiiiiiiiiiiiiii
HP 9000/720 orig. 47.17 78.10 51.34 25.81 51.88 75.22 51.68modi. 47.18 102.71 65.90 35.28 74.82 92.42 65.35iiiiiiiiiiiiiiiiiiiiiiiiiiiiiiiiiiiiiiiiiiiiiiiiiiiiiiiiiiiiiiiiiiiiiiiiiiiiiiiiiiiiiiidiff. 0.03 % 23.96 % 22.09 % 26.84 % 30.66 % 18.61 % 20.92 %iiiiiiiiiiiiiiiiiiiiiiiiiiiiiiiiiiiiiiiiiiiiiiiiiiiiiiiiiiiiiiiiiiiiiiiiiiiiiiiiiiiiiiiiiiiiiiiiiiiiiiii
Sparcstation 1 orig. 5.05 7.82 5.96 11.04 10.21 8.22 7.76modi. 5.07 8.33 6.53 12.40 11.38 8.91 8.38iiiiiiiiiiiiiiiiiiiiiiiiiiiiiiiiiiiiiiiiiiiiiiiiiiiiiiiiiiiiiiiiiiiiiiiiiiiiiiiiiiiiiiidiff. 0.44 % 6.16 % 8.82 % 11.00 % 10.29 % 7.74 % 7.47 %iiiiiiiiiiiiiiiiiiiiiiiiiiiiiiiiiiiiiiiiiiiiiiiiiiiiiiiiiiiiiiiiiiiiiiiiiiiiiiiiiiiiiiiiiiiiiiiiiiiiiiii
Sparcstation 1+ orig. 8.07 11.42 9.17 16.35 15.60 10.27 11.42modi. 8.15 12.21 10.16 18.66 17.86 11.26 12.49iiiiiiiiiiiiiiiiiiiiiiiiiiiiiiiiiiiiiiiiiiiiiiiiiiiiiiiiiiiiiiiiiiiiiiiiiiiiiiiiiiiiiiidiff. 0.99 % 6.49 % 9.81 % 12.35 % 12.67 % 8.75 % 8.59 %iiiiiiiiiiiiiiiiiiiiiiiiiiiiiiiiiiiiiiiiiiiiiiiiiiiiiiiiiiiiiiiiiiiiiiiiiiiiiiiiiiiiiiiiiiiiiiiiiiiiiiiiiiiiiiiiiiiiiiiiiiiiiiiiiiiiiiiiiiiiiiiiiiiiiiiiiiiiiiiiiiiiiiiiiiiiiiiiiiiiiiiiiiiiiiiiiiiiiiiiiiiiiiii
average 2.13 % 14.88 % 21.41 % 28.43 % 30.68 % 18.84 % 19.97 %iiiiiiiiiiiiiiiiiiiiiiiiiiiiiiiiiiiiiiiiiiiiiiiiiiiiiiiiiiiiiiiiiiiiiiiiiiiiiiiiiiiiiiiiiiiiiiiiiiiiiiiicccccccccccccccccccccccccccccccccccccccccc
cccccccccccccccccccccccccccccccccccccccccc
cccccccccccccccccccccccccccccccccccccccccc
cccccccccccccccccccccccccccccccccccccccccc
cccccccccccccccccccccccccccccccccccccccccc
cccccccccccccccccccccccccccccccccccccccccc
cccccccccccccccccccccccccccccccccccccccccc
cccccccccccccccccccccccccccccccccccccccccc
cccccccccccccccccccccccccccccccccccccccccc
cccccccccccccccccccccccccccccccccccccccccc
cccccccccccccccccccccccccccccccccccccccccc
cccccccccccccccccccccccccccccccccccccccccc
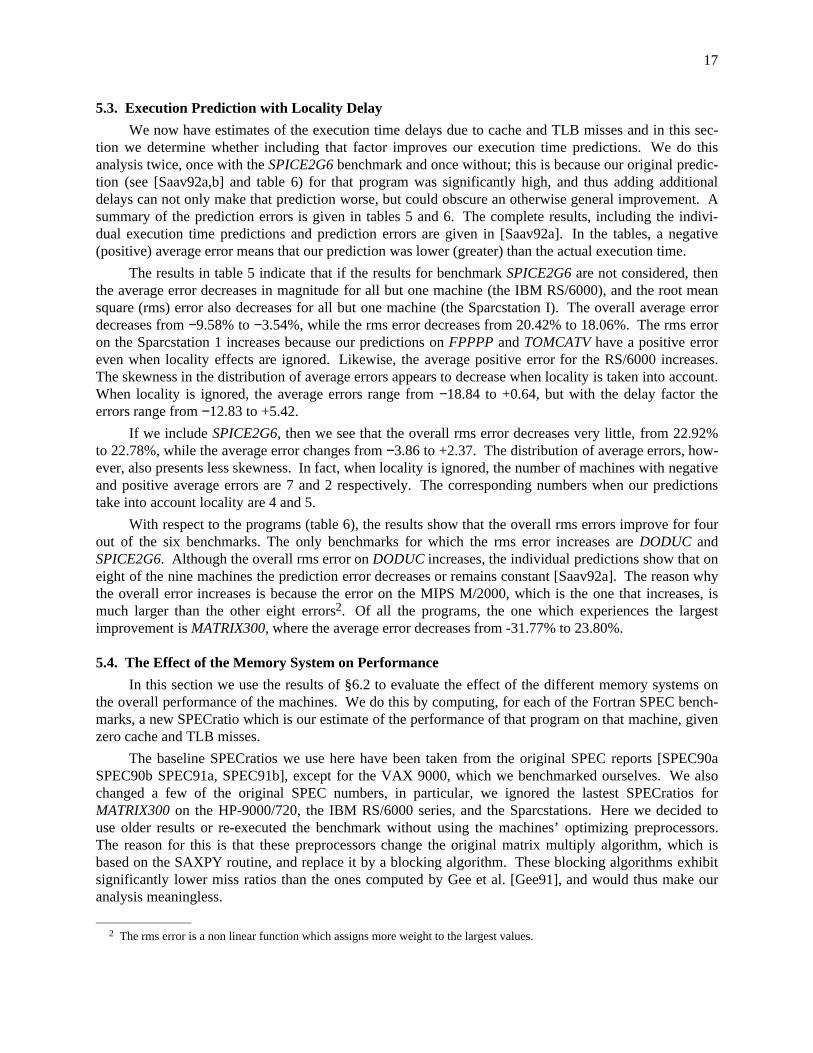
Table 7: The effect of memory delay on the overall machine performance. The results labeled orig. include thememory delay due to cache and TLB misses, from the measured run time, while those labeled modi. aredetermined by subtracting the computed respective memory delay penalty. The SPECfp is obtained by tak-ing the geometric mean of the individual SPECratios.
Table 7 presents for each machine and program combination the original SPECratios (orig.), themodified SPECratios assuming a memory delay of zero cycles (modi.), and their respective difference.The modified figure is computed by subtracting our computed delay for cache and TLB misses from themeasured run time. The rightmost column shows the SPECfp ratio (the geometric average of the sixSPECratios) computed for original and modified results. As expected, the impact of the cache and TLBmisses varies significantly from program to program. For example, DODUC exhibits the smallest effectwith the maximum performance degradation of less than 5% (DEC 5400), and an average of only 2.13%.Conversely, the largest average impact is observed for the MATRIX300 and NASA7 benchmarks with28.43% and 30.68% respectively.
Considering the machines, we find that the largest change in performance is for the DEC 5400 and5500, for which performance improves by 24.91% and 22.01% respectively when delays for cache andTLB misses are eliminated. The lowest impact is observed for the Sparcstation 1 which obtains animprovement of only 7.47%. It is important to note that the performance differences that we are reportingare functions of three factors: a) the miss ratios of the benchmarks, b) the delays in loading the cache andTLB when misses occur, c) and the raw performance of the CPU. Since the Sparcstations are among theslowest of the machines measured, the proportional effect of cache and TLB miss delays is less. This isdespite the fact that, as shown in table 3, the Sparcstations have relatively high miss ratios, and that thetotal delay due to misses (from table 7) is also relatively high.
19
Machine CharacteristicsiiiiiiiiiiiiiiiiiiiiiiiiiiiiiiiiiiiiiiiiiiiiiiiiiiiiiiiiiiiiiiiiiiiiiiiCharacteristics DEC 3100 DEC 5400 MIPS M/2000 DEC 5500iiiiiiiiiiiiiiiiiiiiiiiiiiiiiiiiiiiiiiiiiiiiiiiiiiiiiiiiiiiiiiiiiiiiiiiiiiiiiiiiiiiiiiiiiiiiiiiiiiiiiiiiiiiiiiiiiiiiiiiiiiiiiiiiiiiiiiiiiiiiiiCPU R2000 R3000 R3000 R3000FPU R2010 R3010 R3010 R3010Frequency 16.67 MHz 20 MHz 25 MHz 30 MHzFreq. ratio 0.834 1.000 1.250 1.500Cache (instr) 64 KB 64 KB 64 KB 64 KBCache (data) 64 KB 64 KB 64 KB 64 KBMain memory 24 MB 64 MB 64 MB 32 MBCC compiler MIPS 1.31 MIPS 2.1 MIPS 2.1 MIPS 2.1
ccccccccccccc
F77 compiler ccccccccccccc
ccccccccccccc
MIPS 2.1 ccccccccccccc
MIPS 2.1 ccccccccccccc
MIPS 2.1 ccccccccccccc
MIPS 2.1 ccccccccccccc
iiiiiiiiiiiiiiiiiiiiiiiiiiiiiiiiiiiiiiiiiiiiiiiiiiiiiiiiiiiiiiiiiiiiiii
SPEC Benchmark Resultsiiiiiiiiiiiiiiiiiiiiiiiiiiiiiiiiiiiiiiiiiiiiiiiiiiiiiiiiiiiiiiiiiiiiiiiprogram DEC 3100 DEC 5400 MIPS M/2000 DEC 5500iiiiiiiiiiiiiiiiiiiiiiiiiiiiiiiiiiiiiiiiiiiiiiiiiiiiiiiiiiiiiiiiiiiiiii
Gcc 10.9 (0.991) 11.0 (1.000) 19.0 (1.727) 20.3 (1.845)Espresso 12.0 (0.851) 14.1 (1.000) 18.3 (1.298) 21.7 (1.539)Spice 2g6 9.5 (1.044) 9.1 (1.000) 12.1 (1.330) 16.4 (1.802)Doduc 11.3 (0.883) 12.8 (1.000) 17.6 (1.375) 21.1 (1.648)Nasa7 13.2 (1.031) 12.8 (1.000) 18.4 (1.438) 26.1 (2.039)Li 13.1 (1.073) 12.2 (1.000) 23.8 (1.951) 23.4 (1.918)Eqntott 11.2 (0.824) 13.6 (1.000) 18.4 (1.353) 22.4 (1.647)Matrix300 9.8 (0.942) 10.4 (1.000) 13.3 (1.279) 19.6 (1.885)Fpppp 12.5 (0.933) 13.4 (1.000) 20.4 (1.522) 25.7 (1.918)Tomcatv 9.9 (1.000) 9.9 (1.000) 17.7 (1.788) 19.6 (1.980)iiiiiiiiiiiiiiiiiiiiiiiiiiiiiiiiiiiiiiiiiiiiiiiiiiiiiiiiiiiiiiiiiiiiiiiSPECint 11.8 (0.929) 12.7 (1.000) 19.8 (1.555)) 21.9 (1.724)SPECfp 10.9 (0.965) 11.3 (1.000) 16.3 (1.443) 21.1 (1.867)SPECMark 11.3 (0.958) 11.8 (1.000) 17.6 (1.492) 21.5 (1.822)iiiiiiiiiiiiiiiiiiiiiiiiiiiiiiiiiiiiiiiiiiiiiiiiiiiiiiiiiiiiiiiiiiiiiiicccccccccccccccccc
cccccccccccccccccc
cccccccccccccccccc
cccccccccccccccccc
cccccccccccccccccc
cccccccccccccccccc
cccccccccccccccccc
Table 8: The top portion of this table shows the characteristics of four machines based on either the MIPS R2000or R3000. Below are the SPEC benchmark results, each shown as a SPECratio. The numbers insideparentheses are normalized with respect to the DEC 5400.
6. Discussion
The data we’ve gathered, and our performance estimation technique, allow us to study the perfor-mance of several different machines based on the same instruction set architecture, but with significantlydifferent memory systems. In table 8 we show the main machine characteristics of four differentmachines based on MIPS processors: DEC 3100, DEC 5400, MIPS M/2000, and DEC 5500. Note thatthe main difference between the machines is their clock rates. Although the DEC 3100 uses theR2000/R2010 processor pair instead of the R3000/R3010, the performance difference between them,other than the clock rate, is too small to have a significant effect. In the same table we give the SPECra-tios of the machines on the SPEC programs as quoted in the SPEC Newsletter [SPEC90, SPEC91].Alongside each SPECratio we indicate, in parentheses, the relative performance with respect to the DEC5400.
The most interesting observation here is that the SPEC results on the DEC 5400 compared to theother machines cannot be explained only by the relative differences in their clock rates. The SPECresults indicate that, with respect to the DEC 5400, the DEC 3100 is 15% (0.958 vs. 0.834) faster than wewould expect it to be. Similarly, the MIPS M/2000 is around 19% faster (1.492 vs. 1.250), while theDEC 5500 is 21% faster (1.822 vs. 1.500) than what their clock rate ratios indicate. Notwithstanding thesmall statistical variation, this situation appears to be consistent across all benchmarks.
Table 8 provides only aggregate performance numbers, but doesn’t allow us to understand the rea-sons for the performance differences; our measurement and analysis technique permits us, in this section,
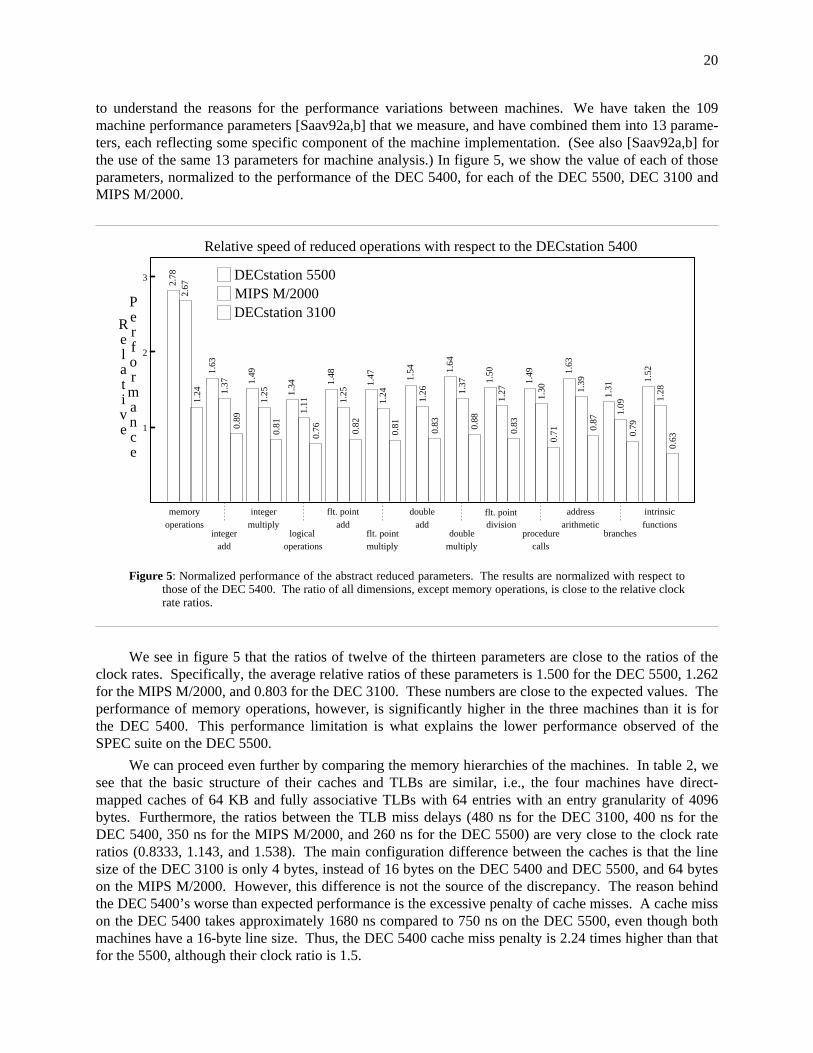
20
to understand the reasons for the performance variations between machines. We have taken the 109machine performance parameters [Saav92a,b] that we measure, and have combined them into 13 parame-ters, each reflecting some specific component of the machine implementation. (See also [Saav92a,b] forthe use of the same 13 parameters for machine analysis.) In figure 5, we show the value of each of thoseparameters, normalized to the performance of the DEC 5400, for each of the DEC 5500, DEC 3100 andMIPS M/2000.
3
2
1
2.78
1.63
1.49
1.34 1.
48
1.47 1.
54 1.64
1.50
1.49 1.
63
1.31
1.52
DECstation 5500
DECstation 3100
1.24
0.89
0.81
0.76 0.82
0.81
0.83 0.88
0.83
0.71 0.
87
0.79
0.63
memory
integer
integer flt. point
flt. point
double
doubledivision
procedure
address intrinsic
logical branchesoperations
add
multiply
operations
add
multiply
add
multiply
flt. point
calls
arithmetic functions
Relative speed of reduced operations with respect to the DECstation 5400
Relative
Performance
MIPS M/20002.67
1.37
1.25
1.11 1.
25
1.24 1.26 1.
37
1.27 1.30 1.
39
1.09
1.28
Figure 5: Normalized performance of the abstract reduced parameters. The results are normalized with respect tothose of the DEC 5400. The ratio of all dimensions, except memory operations, is close to the relative clockrate ratios.
We see in figure 5 that the ratios of twelve of the thirteen parameters are close to the ratios of theclock rates. Specifically, the average relative ratios of these parameters is 1.500 for the DEC 5500, 1.262for the MIPS M/2000, and 0.803 for the DEC 3100. These numbers are close to the expected values. Theperformance of memory operations, however, is significantly higher in the three machines than it is forthe DEC 5400. This performance limitation is what explains the lower performance observed of theSPEC suite on the DEC 5500.
We can proceed even further by comparing the memory hierarchies of the machines. In table 2, wesee that the basic structure of their caches and TLBs are similar, i.e., the four machines have direct-mapped caches of 64 KB and fully associative TLBs with 64 entries with an entry granularity of 4096bytes. Furthermore, the ratios between the TLB miss delays (480 ns for the DEC 3100, 400 ns for theDEC 5400, 350 ns for the MIPS M/2000, and 260 ns for the DEC 5500) are very close to the clock rateratios (0.8333, 1.143, and 1.538). The main configuration difference between the caches is that the linesize of the DEC 3100 is only 4 bytes, instead of 16 bytes on the DEC 5400 and DEC 5500, and 64 byteson the MIPS M/2000. However, this difference is not the source of the discrepancy. The reason behindthe DEC 5400’s worse than expected performance is the excessive penalty of cache misses. A cache misson the DEC 5400 takes approximately 1680 ns compared to 750 ns on the DEC 5500, even though bothmachines have a 16-byte line size. Thus, the DEC 5400 cache miss penalty is 2.24 times higher than thatfor the 5500, although their clock ratio is 1.5.
21
Comparing the miss penalties of the DEC 3100 and MIPS M/2000 with the DEC 5400 is not asstraightforward, because of the difference in line sizes. Here the line size, from the 3100 to the 5400,increases by a factor of 4, at the same time the miss penalty increases only by a factor of 3.111. However,the reduction in miss ratios due to a larger line size is for most programs smaller than the correspondingline size increase. For example, an acceptable rule of thumb for caches with parameters similar to theDECstations, and over a large sample of programs, is that doubling the line size will not decrease themiss ratio by more than a factor of 1.5 [Smit87]. Therefore, the decrease in the miss ratio when weincrease the line size by a factor of four should be only around 2.25, which is much lower than the 3.111increase in the miss penalty of the DEC 5400. (In section 5.1, we used a factor of two to estimate themiss ratio for a 4-byte line relative to that for a 16-byte line.)
Now, if we look at the cache parameters of the MIPS M/2000, we see that the line size is a factor of4 larger with respect to the DEC 5500 and a factor of 16 with respect to the DEC 3100, but the respectiveincreases in the the miss penalties are only 2.667 and 1.920. Even if we assume that the decrease in missratio is only 1.4, as a result of doubling the line size, the corresponding decreases in miss ratios should be3.842 and 1.960, which are larger than the corresponding line miss penalties increases. The more aggres-sive cache design on the MIPS M/2000 is effectively reducing the miss ratio without overly increasingthe penalty as is the case with the DEC 5400. This complemented with wraparound loads (see thecorresponding entries in table 2 for rows "miss penalty (word)" and "miss penalty (line)") are the mainreasons why the performance of the MIPS M/2000 on the SPEC benchmarks is higher than for othermachines based on the R3000/R3010 chips and with comparable clock rates.
It is worth pointing out that the low performance of the DEC 5400 memory system does not (likely)indicate poor design. Most vendors need a series of different machines, with different levels of perfor-mance and different prices. Unfortunately, the engineering cost of such separate developments is usuallyprohibitive, even were the people available to do the work. Therefore, a typical solution to this problemis to design and build the fastest possible machine, for sale at the highest price/performance point. Thatmachine is then deliberately slowed down by techniques such as slower memories, slower clocks, dis-abled functional unit bypasses, smaller and slower caches and TLBs, etc., to allow the vendor to selllower price/performance machines. These slower machines are usually not significantly cheaper than thehigher performance ones to manufacture, but the lower margin is more than compensated for by the sav-ings in engineering cost, time and personnel.
7. Conclusions
In this paper we have shown that we can extend our basic abstract machine model to incorporate theeffects of program locality and the characteristics of the memory hierarchy to compute the delay due tothe misses that occur at some level of the memory hierarchy. We have been able to measure and analyzethe design and performance of the caches and TLBs for a variety of machines using only a high levelanalysis program and without the need to refer to machine manuals or obtain information from themanufacturer. Using previously published miss ratio data, we have been able to improve our predictionsof program run times by combining our memory performance measurements with those miss ratios.
An important aspect of our methodology, and something which is illustrated in this paper, is that wecan construct relatively simple machine-independent tools for making good observations about thebehavior of different units on many machines using programs written in a high-level language. Thesemeasurements are accurate enough to make predictions and at the same time can be used to comparemachines with different instructions sets or memory structures. In §6 we showed how our cache and TLBmeasurements can be used to explain, in conjunction with the machine characterizations, the performancedifferences observed on machines with similar characteristics.

22
Acknowledgements
We would like to thank A. Karp from IBM for suggesting measuring the characteristics of thememory hierarchy, as well as David E. Culler and Luis Miguel from U.C. Berkeley who let us run ourprograms in their machines.
Bibliography
[Borg90] Brog, A.m Kesslet, R.E., and Wall, D.W.,‘‘Generation and Analysis of Very Long AddressTraces’’, Proc. of the 17th Int. Symp. on Comp. Arch.,Seattle, Washington, May 1990, pp. 270-279.
[CYPR90] Cypress Semiconductors, SPARC Refer-ence Manual, Cypress Semiconductors, 1990.
[Furl90] Furlong, T.C., Nielsen, M.J.K., Wilhelm,N.C., ‘‘Development of the DECstation 3100’’, Digi-tal Technical Journal, Vol.2, No.2, Spring 1990, pp.84-88.
[GeeJ91] Gee, J., Hill, M.D., Pnevmatikatos, D.N.,and Smith A.J., ‘‘Cache Performance of the SPECBenchmark Suite’’, submitted for publication, alsoUniversity of California, Berkeley, Technical ReportNo. UCB/CSD 91/648, October 1991. (To appear,IEEE MICRO, August, 1993.)
[GeeJ92] Gee, J. and Smith, A.J., ‘‘TLB Performanceof the SPEC Benchmark Suite’’, paper in prepara-tion, draft of January 1992.
[Good85] Goodman, J.R., Hsieh,J., Kiou, K.,Pleszkun A.R., Scheuchter, P.B., and Young, H.C.,‘‘PIPE: A VLSI Decoupled Architecture’’, Proc. ofthe 12th Int. Symp. on Comp. Arch., Boston, Mas-sachusetts, June 1985, pp. 20-27.
[Peut77] Peuto, B.L., and Shustek, L.J., ‘‘An Instruc-tion Timing Model of CPU Performance’’, FourthInternational Symposium on Computer Architecture,in Computer Architecture News, Vol.5, No.7, March1977, pp. 165-178.
[Pnev90] Pnevmatikatos, D.N. and Hill, M.D.,‘‘Cache Performance on the Integer SPEC Bench-marks’’, Computer Architecture News, Vol.18, No.2,June 1990, pp. 53-68.
[Saav89] Saavedra-Barrera, R.H., Smith, A.J., andMiya, E. ‘‘Machine Characterization Based on anAbstract High-Level Language Machine’’, IEEETrans. on Comp. Vol.38, No.12, December 1989, pp.1659-1679.
[Saav90] Saavedra-Barrera, R.H. and Smith, A.J.,Benchmarking and the Abstract Machine Characteri-zation Model, UC Berkeley, Tech. Rept. No.UCB/CSD 90/607, November 1990.
[Saav92a] Saavedra-Barrera, R.H., CPU PerformanceEvaluation and Execution Time Prediction UsingNarrow Spectrum Benchmarking, Ph.D. Thesis, UCBerkeley, Tech. Rept. No. UCB/CSD 92/684, Febru-ary 1992.
[Saav92b] Saavedra, R.H. and Smith, A.J., ‘‘Analysisof Benchmark Characteristics and Benchmark Perfor-mance Prediction’’, submitted for publication, USCTech. Rept. No. USC-CS-92-524, October 1992.
[Saav92c] Saavedra, R.H. and Smith, A.J., ‘‘Perfor-mance Characterization of Optimizing Compilers,submitted for publication, USC Tech. Rept. No.USC-CS-92-525, also UC Berkeley, Tech. Rept. No.UCB/CSD 92/699, August 1992.
[Smit82] Smith, A.J., ‘‘Cache Memories’’, ACMComputing Surveys, Vol.14, No.3, September 1982,pp. 473-530.
[Smith84] Smith, J.E., ‘‘Decoupled Access/ExecuteArchitectures’’, ACM Trans. on Computer Systems,Vol.2, No.4, November 1984, pp. 289-308.
[Smit87] Smith, A.J., ‘‘Line (Block) Size Choice forCPU Caches’’, IEEE Trans. on Computers, Vol. C-36, No.9, September 1987, pp. 1063-1075.
[SPEC90a] SPEC, ‘‘SPEC Newsletter: BenchmarkResults’’, Vol.2, Issue 2, Spring 1990.
[SPEC90b] SPEC, ‘‘SPEC Newsletter: BenchmarkResults’’, Vol.2, Issue 3, Summer 1990.
[SPEC91] SPEC, ‘‘SPEC Newsletter: BenchmarkResults’’, Vol.3, Issue 1, Winter 1991.
[Sper93] Spertus, E., Goldstein, S.C., Schauser, K.E.,von Eicken, T., Culler, D.E., and Dally, W.J.,‘‘Evaluation of Mechanisms for Fine-Grained ParallelPrograms in the J-Machine and the CM-5’’, Proc. ofthe 20’th Int. Symp. on Comp. Arch., San Diego, Cali-fornia, May 16-19 1993, pp. 302-313.
[Wulf88] Wolf, W.A., ‘‘The WM Computer Archi-tecture’’, Computer Architecture News, Vol.16, No.1,March 1988, pp. 70-84.


![Banshee: Bandwidth-Efficient DRAM Caching Via Software ...Tagless DRAM Cache (TDC [10]) also uses address remap-ping, but enables frequent cache replacement via hardware-managed TLB](https://static.fdocuments.in/doc/165x107/5f5b2ff9c3e89664d66f964e/banshee-bandwidth-eficient-dram-caching-via-software-tagless-dram-cache-tdc.jpg)