![ANSI/SCTE 35 2019a · 2020-02-25 · [SCTE 130-3] is used to support alternate content decisions (advertising, blackouts, stream switching) for live and time shifted delivery. [SCTE](https://static.fdocuments.in/doc/165x107/5e960d6cb8220a7b326b8fb4/ansiscte-35-2019a-2020-02-25-scte-130-3-is-used-to-support-alternate-content.jpg)
Measuring and Qualifying Upstream Signals SCTE New Jersey Chapter 9/13/07.
76
Measuring and Measuring and Qualifying Upstream Qualifying Upstream Signals Signals SCTE New Jersey Chapter 9/13/07
-
Upload
teresa-waters -
Category
Documents
-
view
222 -
download
0
Transcript of Measuring and Qualifying Upstream Signals SCTE New Jersey Chapter 9/13/07.

Measuring and Measuring and Qualifying Upstream Qualifying Upstream
Signals Signals
SCTE New Jersey Chapter9/13/07

My Business CardMy Business Card
Larry JumpRegional Sales Engineer
Sunrise Telecom Broadband814-692-4294
800-297-9726 tech [email protected]
www.sunrisetelecom.com

Questions and Questions and Comments are Comments are
WelcomeWelcome
Confidential & Proprietary
PurposePurpose
Better understand how to make upstream signals and measurements
What are the signal impairments on the reverse path

Confidential & Proprietary
AgendaAgenda
16 QAM Advantages and Challenges Measurements and Impairments Case Study

Confidential & Proprietary
Why 16-QAM?Why 16-QAM?
Higher upstream data throughput required for:
Voice Peer to Peer
Channel bandwidth, MHz
Symbol rate, ksym/sec
QPSK raw data rate, Mbps
QPSK nominal data rate, Mbps
16-QAM raw data rate, Mbps
16-QAM nominal data rate, Mbps
0.200 160 0.32 ~0.3 0.64 ~0.6
0.400 320 0.64 ~0.6 1.28 ~1.2
0.800 640 1.28 ~1.2 2.56 ~2.4
1.60 1,280 2.56 ~2.3 5.12 ~4.8
3.20 2,560 5.12 ~4.6 10.24 ~9.0

Confidential & Proprietary
Upstream 16 QAM ChallengesUpstream 16 QAM Challenges
Once interference occurs in voice the data cannot be retransmitted.
Measurements are more difficult because the signals are bursty.
16 QAM looses 3 dB of headroom because the maximum modem output is 55 dBmV as opposed to 58 dBmV for QPSK.

Confidential & Proprietary
More Upstream Challenges with More Upstream Challenges with 16 QAM16 QAM
16 QAM is less robust than QPSK Requires better SNR and MER
QAM means that the carrier is amplitude modulated and therefore more susceptible to amplitude based impairments such as: Ingress Micro-reflections Compression

Confidential & Proprietary
What needs to be done before What needs to be done before launching 16 QAM?launching 16 QAM?
Making 16-QAM work reliably requires attention to several details: The cable modem termination system (CMTS)
configuration must be optimized for 16-QAM Its also important to configure the CMTS
parameter called modulation profile correctly. The entire cable system needs to be DOCSIS-
compliant Return and Forward Sweep! Leakage kept to levels below that required by
the FCC If it leaks out, it leaks in!

Confidential & Proprietary
Recommended Network SpecificationsRecommended Network Specifications
Part 76 of the FCC Rules
DOCSIS for upstream and downstream
NCTA Recommended Practices for upstream carriers

Upstream Signal Upstream Signal MeasurementsMeasurements

Confidential & Proprietary
Spectrum Analyzer Upstream Spectrum Analyzer Upstream MeasurementsMeasurements
Upstream Carrier Levels Spectrum Analysis Constellation Measurements and
DiagnosisMER, BER, and Constellation Analysis
Upstream Linear Distortion Measurements

Confidential & Proprietary
Upstream Level MeasurementUpstream Level MeasurementThe First StepThe First Step
Verify the upstream carrier amplitude at the input to the CMTS upstream port is within spec.
Usually 0 dBmV at the input, some systems may vary. Can be measured using peak power on the
preamble of the carrier An average power measurement could also be made on
a constant carrier injected at the correct level. Be careful of mixed modulation profile measurements;
remember there is a 3 dB difference between QPSK and 16 QAM
Measure total power at the input to the CMTS (<35dBmV, TP)

Confidential & Proprietary
Upstream Level MeasurementUpstream Level Measurement
•Measurement made in the zero span mode•Peak power of the preamble

Spectrum AnalysisSpectrum Analysis-CNR-CNR
-C/I-C/I

Confidential & Proprietary
DOCSIS 1.1 Upstream RF Channel DOCSIS 1.1 Upstream RF Channel Transmission CharacteristicsTransmission Characteristics
Parameter Value Frequency range 5 to 42 MHz edge to edge
Transit delay from the most distant CM to the nearest CM or CMTS
<=0.800 msec (typically much less)
Carrier-to-noise ratio Not less than 25 dB
Carrier-to-ingress power (the sum of discrete and broadband ingress signals) ratio
Not less than 25 dB
Carrier-to-interference (the sum of noise, distortion, common-path distortion, and cross- modulation) ratio
Not less than 25 dB
Carrier hum modulation Not greater than –23 dBc (7%)
Burst noise Not longer than 10 μsec at a 1 kHz average rate for most cases (Notes 3, 4, and 5)
Amplitude ripple 5-42 MHz: 0.5 dB/MHz
Group delay ripple 5-42 MHz: 200 ns/MHz
Micro-reflections -- single echo -10 dBc@ <= 0.5 μsec -20 dBc@ <= 1.0 μsec -30 dBc@ > 1.0 μsec
Seasonal and diurnal signal level variation Not greater than 8 dB min to max

Confidential & Proprietary
Upstream CNRUpstream CNR
• Check the upstream carrier-to-noise, carrier-to-ingress, and carrier-to-interference ratios DOCSIS assumes a minimum of 25 dB for all three
parameters This is measured at the CMTS upstream port
Remember that we loose 3 dB of dynamic range with 16 QAM
CNR and SNR are different measurements! The correct noise power bandwidth is equal to the
symbol rate of the upstream carrier Can use noise power markers

Confidential & Proprietary
CNR or SNRCNR or SNR
CNR is a measurement performed on RF signals
Raw carrier power to raw noise power in the RF transport path onlyIdeal for characterizing network impairments
SNR is a pre-modulation or post-detection measurement performed on baseband signals
Includes noise in original signal, transmitter or modulator, transport path, and receiver & demodulatorIdeal for characterizing end-to-end performance—the overall signal quality seen by the end user

Confidential & Proprietary
CMTS Upstream SNR MeasurementCMTS Upstream SNR Measurement Broadcom burst demodulator chips used in a CMTS
provides an upstream SNR estimate. Other factors may degrade CMTS-reported SNR, even
when CNR is good including improper modulation profiles, bad timing errors, and poor headend combiner/splitter isolation. These of course would be system return path problems.
Impulse noise and certain other fast transient impairments generally will not show up in CMTS SNR estimate.
Outside of the range of 15~25 dB CNR, the SNR estimate will diverge numerically from measured CNR value by as much as 4 dB or more.
CMTS-reported SNR will always be less than—or at best equal to—CNR, but should never be better than CNR.

Confidential & Proprietary
Upstream Spectrum AnalysisUpstream Spectrum Analysis
Make sure noise floor of system is being displayed 10 db out of the spectrum analyzer noise floor
Use peak hold to capture transients
Use Averaging to capture CPD

Confidential & Proprietary
Good CNR and C/IGood CNR and C/I
3.2MHz

Confidential & Proprietary
Effects of Over-Driving a LaserEffects of Over-Driving a Laser

Confidential & Proprietary
CNR using a Noise MarkerCNR using a Noise Marker

Confidential & Proprietary
Upstream Carrier-to-InterferenceUpstream Carrier-to-Interference

Constellation AnalysisConstellation Analysis
Patterns in the Constellation
Confidential & Proprietary
MER, A Better MeasurementMER, A Better Measurement
A better parameter than SNR is modulation error ratio (MER) or error vector magnitude (EVM)
MER takes into account: CNR Phase Noise (jitter of phase of QAM modulator’s carrier) Intermod Distortions Compression of Lasers and Amplifiers Frequency Response THE SUM OF ALL EVILS
MER is a single figure of merit for the quality of an RF QAM modulated signal.
MER and EVM are the same thing. MER is expressed in dB; EVM is expressed in %.
A direct measurement of the digital signals modulation quality Can be directly linked to BER
Confidential & Proprietary
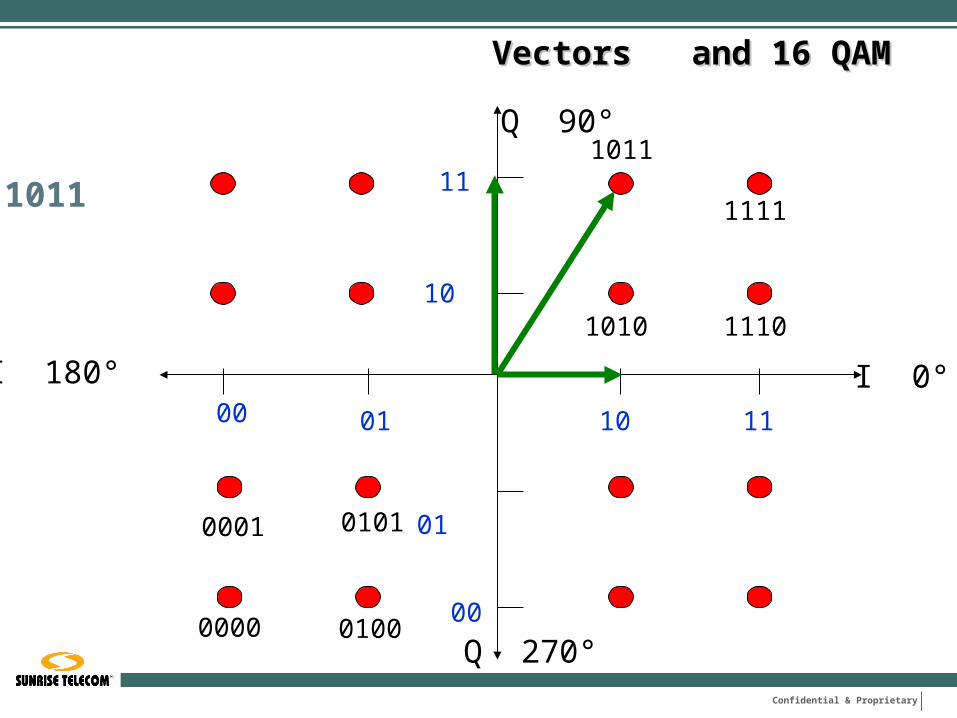
Vectors and 16 QAMVectors and 16 QAM
10
11
01
00
10
11
Q 90°
I 0°
1010 1110
1011
1111
0100
0001
0000
0101
0100
I 180°
Q 270°
1011
Confidential & Proprietary
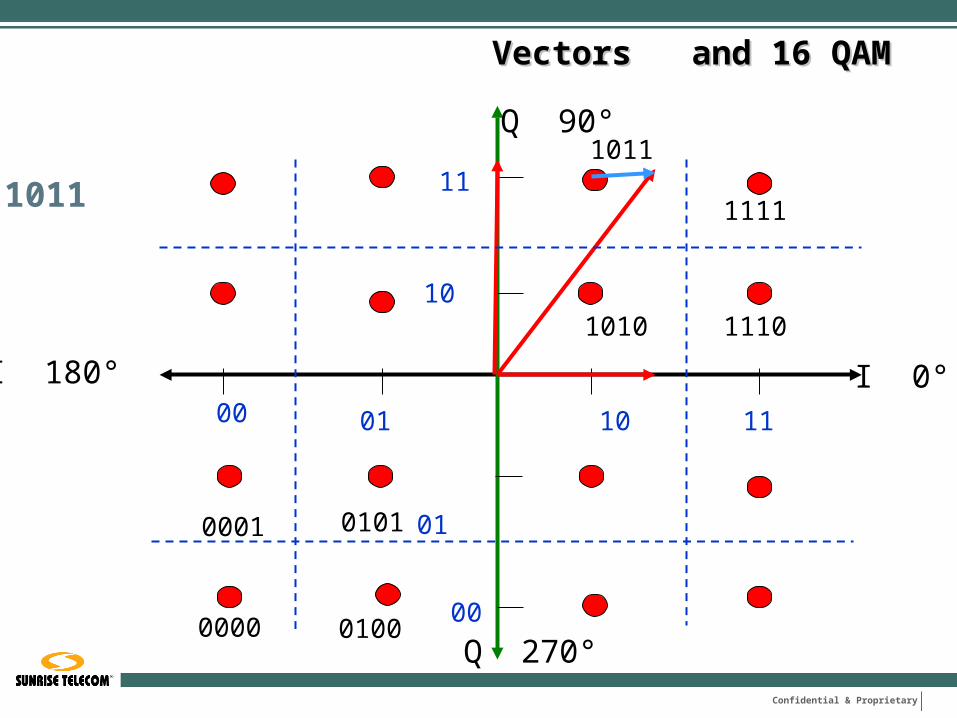
Vectors and 16 QAMVectors and 16 QAM
10
11
01
00
10
11
Q 90°
I 0°
1010 1110
1011
1111
0100
0001
0000
0101
0100
I 180°
Q 270°
1011

Confidential & Proprietary
Modulation Error RatioModulation Error Ratio
MER is defined as follows: MER is expressed in dB.
Ideal Symbol
RMS Error Magnitude
Average Symbol
Magnitude
RMS error magnitude
average symbol magnitude10 log

Confidential & Proprietary
Modulation Error RatioModulation Error Ratio
Minimum recommended downstream MER (includes 3 to 4 dB of headroom for reliable operation)
256-QAM: 31 dBQPSK: 13 dB16 QAM: 20 dB
Graphic courtesy of Sunrise Telecom
Confidential & Proprietary
Introduction to BERIntroduction to BER
Bit Error Rate (BER) is an important concept to understand in any digital transmission system since it is a major indicator of the quality of the digital system.
As data is transmitted some of the bits may not be reproduced at the receiver correctly. The more bits that are incorrect, the more the signal will be affected.
BER is a ratio of incorrect bits to the total number of bits measured.
Its important to know what portion of the bits are in error so you can determine how much margin the system has before failure.

Confidential & Proprietary
What is BER?What is BER?
BER is defined as the ratio of the number of wrong bits over the number of total bits.
BER is measured by sending a known string of bits and then counting the errored bits vs. the total number of bits sent.
This is technically an out of service measurement.
Sent Bits 1101101101
Received Bits 1100101101
BER = # of Wrong Bits
# of Total Bits=
1
10= 0.1
error

Confidential & Proprietary
What is BER?What is BER?
BER is normally displayed in Scientific Notation. The more negative the exponent, the better the BER. Better than 1.0E-6 is needed after the FEC for the system to
operate.
Decimal Scientific Notation1 1.0E+00
0.1 1.0E-010.01 1.0E-020.001 1.0E-03
0.0001 1.0E-040.00001 1.0E-05
0.000001 1.0E-060.0000001 1.0E-07
0.00000001 1.0E-080.000000001 1.0E-09
Lower and
Better BER
Decimal Scientific Notation0.00001 1.0E-050.000009 9.0E-060.000008 8.0E-060.000007 7.0E-060.000006 6.0E-060.000005 5.0E-060.000004 4.0E-060.000003 3.0E-060.000002 2.0E-060.000001 1.0E-06

Confidential & Proprietary
Forward Error CorrectionForward Error Correction
In every MPEG digital receiver, there is a FEC decoder that can actually repair damaged data.
Forward error correction (FEC) is a digital transmission system that sends redundant information along with the payload, so that the receiver can repair the damaged data and eliminate the need to retransmit.
It only works if the BER is higher than 1E-6 before the FEC decoder

Confidential & Proprietary
Pre and Post FEC BERPre and Post FEC BER
BER performance you need to know both the pre and post FEC bit error rate.
The FEC decoder needs a BER of better than 1 E-6 in order to operate.
Post FEC Bit errors are not acceptable. To get an accurate idea of the
You should look at both the Pre and Post FEC BER to determine if the FEC is working to correct errors and if so how hard.
FEC Decoder
Pre FEC BER
Post FEC BER

Confidential & Proprietary
Noise and IntermittentsNoise and Intermittents
Errors caused by noise or intermittent causes can have the same BER, but very different effects.
Errors that are spread out are due to noise problems Errors that are grouped are due to intermittent
problems such as ingress or loose connectors.
Spaced Errors 1101101011010011100
Burst Errors 1111101011101101101
This Example Shows the Same Error Rate But the Burst Errors are More Difficult to Correct

Confidential & Proprietary
Return Path Constellation AnalysisReturn Path Constellation Analysis

Confidential & Proprietary
16 QAM Upstream 16 QAM Upstream AnalysisAnalysis
Return PathVerification, Test
& Troubleshooting

Confidential & Proprietary
CPD and NoiseCPD and Noise

Confidential & Proprietary
Laser ClippingLaser Clipping

Confidential & Proprietary
NoiseNoise

Confidential & Proprietary
IngressIngress

Confidential & Proprietary
A Good 16 QAM ConstellationA Good 16 QAM Constellation
Zero Bit Errors

Confidential & Proprietary
Adaptive EqualizersAdaptive Equalizers
Corrects for Frequency Response imperfections
Corrects for Group Delay
Show impedance mismatches

Confidential & Proprietary
Adaptive EqualizersAdaptive Equalizers
Confidential & Proprietary
MicroreflectionsMicroreflections
Micro-reflections are impedance mismatches In the real world of cable networks, 75 Ω impedance is at
best considered nominal Micro-reflections cause group delay and frequency
response problems. Impedance mismatches are everywhere: connectors,
amplifiers inputs and outputs, passive device inputs and outputs, and even the cable itself
Upstream cable attenuation is lower than downstream cable attenuation, so upstream micro-reflections tend to be worse.
Anywhere an impedance mismatch exists, some of the incident energy is reflected back toward the source

Confidential & Proprietary
Micro-reflectionsMicro-reflections
Higher orders of modulation are affected by micro-reflections to a much greater degree so 16 QAM is affected more than QPSK
Upstream micro-reflections and group delay are minimized by using adaptive equalizers. This feature is available in DOCSIS 1.1 and 2.0 CMTSs , but not 1.0.

Confidential & Proprietary
MicroreflectionsMicroreflections
Damaged or missing end-of-line terminators Damaged or missing chassis terminators on directional coupler,
splitter, or multiple-output amplifier unused ports Loose center conductor seizure screws Unused tap ports not terminated—this is especially critical on
low value taps Unused drop passive ports not terminated Use of so-called self-terminating taps at feeder ends-of-line
Causes:

Confidential & Proprietary
MicroreflectionsMicroreflections
Kinked or damaged cable (includes cracked cable, which causes a reflection and ingress)
Defective or damaged actives or passives (water-damaged, water-filled, cold solder joint, corrosion, loose circuit board screws, etc.)
Cable-ready TVs and VCRs connected directly to the drop (return loss on most cable-ready devices is poor)
Some traps and filters have been found to have poor return loss in the upstream, especially those used for data-only service
Causes (cont’d):

Confidential & Proprietary
MicroreflectionsMicroreflections
Parameter Value
Frequency range 5 to 42 MHz edge to edge
Transit delay from the most distant CM to the nearest CM or CMTS
<=0.800 msec (typically much less)
Carrier-to-interference plus ingress (the sum of noise, distortion, common-path distortion and cross-modulation and the sum of discrete and broadband ingress signals, impulse noise excluded) ratio
Not less than 25 dB (Note 2)
Carrier hum modulation Not greater than –23 dBc (7%)
Burst noise Not longer than 10 μsec at a 1 kHz average rate for most cases (Notes 3 and 4)
Amplitude ripple 5-42 MHz 0.5 dB/MHz
Group delay ripple 5-42 MHz 200 ns/MHz
Micro-reflections—single echo -10 dBc@ <= 0.5 μsec -20 dBc@ <= 1.0 μsec -30 dBc@ > 1.0 μsec
Seasonal and diurnal reverse gain (loss) variation Not greater than 14 dB min to max
-10 dBc @ <=0.5 µsec-20 dBc @ <=1.0 µsec-30 dBc @ >1.0 µsec

Confidential & Proprietary
MicroreflectionsMicroreflections
Here’s an example: An approx. -33 dBc echo at just over 1 µsec
This echo meets the DOCSIS upstream -30 dBc at >1.0 µsec parameter however this is sufficient to cause some amplitude and group delay ripple

Confidential & Proprietary
Amplitude Ripple Amplitude Ripple ( Frequency Response)( Frequency Response)
Parameter Value
Frequency range 5 to 42 MHz edge to edge
Transit delay from the most distant CM to the nearest CM or CMTS
<=0.800 msec (typically much less)
Carrier-to-interference plus ingress (the sum of noise, distortion, common-path distortion and cross-modulation and the sum of discrete and broadband ingress signals, impulse noise excluded) ratio
Not less than 25 dB (Note 2)
Carrier hum modulation Not greater than –23 dBc (7%)
Burst noise Not longer than 10 μsec at a 1 kHz average rate for most cases (Notes 3 and 4)
Amplitude ripple 5-42 MHz 0.5 dB/MHz
Group delay ripple 5-42 MHz 200 ns/MHz
Micro-reflections—single echo -10 dBc@ <= 0.5 μsec -20 dBc@ <= 1.0 μsec -30 dBc@ > 1.0 μsec
Seasonal and diurnal reverse gain (loss) variation Not greater than 14 dB min to max

Confidential & Proprietary
Amplitude RippleAmplitude Ripple
An in-service spectrum analyzer measurement

Confidential & Proprietary
Group DelayGroup Delay
Different travel through the same medium at different speeds. This is Group Delay
Group delay is defined in units of time, typically nanoseconds (ns) over frequency. In other words how much GD per each MHz.
In a system, network or component with no group delay, all frequencies are transmitted through the system, network or component with equal time delay
Frequency response problems in a CATV network will cause group delay problems
Group delay is worse near band edges and diplex filter roll-off areas

Confidential & Proprietary
Upstream frequencyUpstream frequency
Keep the 16-QAM digitally modulated carrier well away from diplex filter roll-off areas (typically above about 35~38 MHz), where group delay can be a major problem
Choose an operating frequency that will minimize the likelihood of group delay
Frequencies in the 20~35 MHz range generally work well
Group delay may still be a problem when the frequency response is flat

Confidential & Proprietary
Group DelayGroup Delay
Parameter Value
Frequency range 5 to 42 MHz edge to edge
Transit delay from the most distant CM to the nearest CM or CMTS
<=0.800 msec (typically much less)
Carrier-to-interference plus ingress (the sum of noise, distortion, common-path distortion and cross-modulation and the sum of discrete and broadband ingress signals, impulse noise excluded) ratio
Not less than 25 dB (Note 2)
Carrier hum modulation Not greater than –23 dBc (7%)
Burst noise Not longer than 10 μsec at a 1 kHz average rate for most cases (Notes 3 and 4)
Amplitude ripple 5-42 MHz 0.5 dB/MHz
Group delay ripple 5-42 MHz 200 ns/MHz
Micro-reflections—single echo -10 dBc@ <= 0.5 μsec -20 dBc@ <= 1.0 μsec -30 dBc@ > 1.0 μsec
Seasonal and diurnal reverse gain (loss) variation Not greater than 14 dB min to max

Confidential & Proprietary
Group Delay MeasurementGroup Delay Measurement
Confidential & Proprietary
Some things to check out!Some things to check out!
Before adding a 16 QAM carrier the following should be checked Compression of the return laser due to
added carrier or a carrier with added bandwidth
MER and BER over a period of time Group Delay of a new carrier MER and BER of the new carrier. Amplitude Ripple Microreflections

Confidential & Proprietary
Upstream Spectrum Display Showing Upstream Spectrum Display Showing CompressionCompression

Confidential & Proprietary
Statistics ModeStatistics Mode

Confidential & Proprietary
Group Delay MeasurementGroup Delay Measurement

Confidential & Proprietary
Frequency Response of an Upstream Frequency Response of an Upstream CarrierCarrier

Confidential & Proprietary
A Case Study

Confidential & Proprietary
Upstream SpectrumUpstream Spectrum

Confidential & Proprietary
NoiseNoise
Confidential & Proprietary
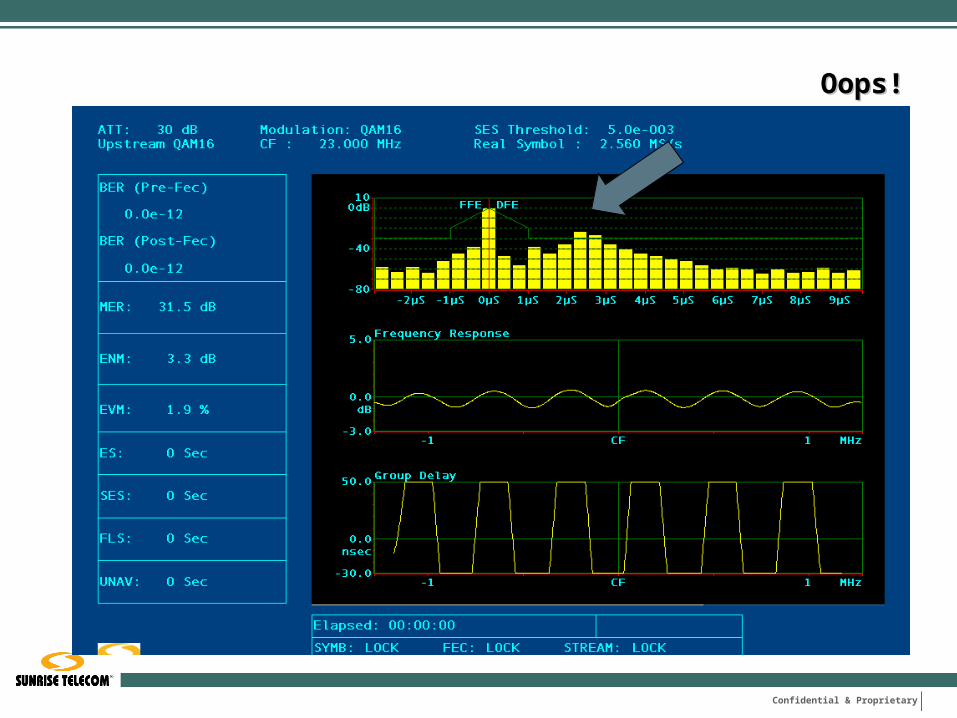
Oops!Oops!
Confidential & Proprietary
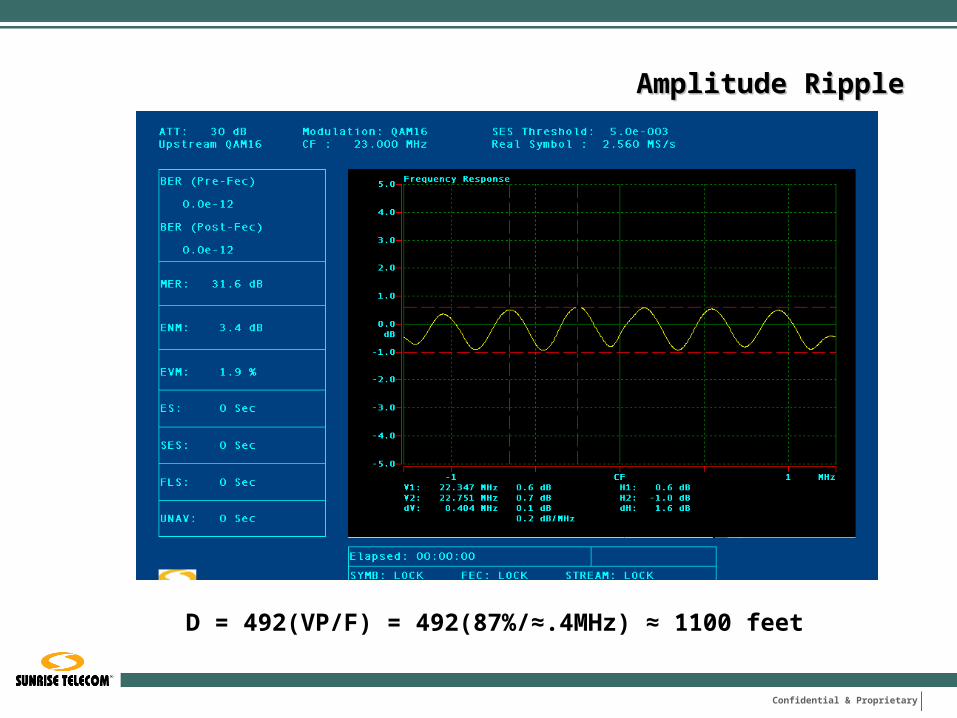
Amplitude RippleAmplitude Ripple
D = 492(VP/F) = 492(87%/≈.4MHz) ≈ 1100 feet

Confidential & Proprietary
Group DelayGroup Delay
Peak to Valley Group Delay ≈ 270 nSeconds

Confidential & Proprietary
Bit ErrorsBit Errors

Confidential & Proprietary
Moral of the Story?Moral of the Story?
CNR and Distortion measurements from a spectrum analyzer are great but, don’t tell the whole story.
Other digital measurements are advised using a vector analyzer to ensure 16 QAM reliability MER and BER Group Delay and other Equalizer measurements Constellation Statistic Measurement

Confidential & Proprietary
Measurement SummaryMeasurement Summary
Check for laser clipping Measure over time Measure for frequency response of the carrier Measure group delay of the carrier Measure MER and BER of upstream carrier Can be accomplished by inserting a 16 QAM carrier at the
EOL and using a digital analyzer in the headend.

Confidential & Proprietary
16-QAM Pre-Launch Checklist16-QAM Pre-Launch Checklist
CMTS modulation profile optimized for 16-QAM Vector Analysis, not just spectrum analysis Entire cable network—headend, distribution network
and subscriber drops—DOCSIS-compliant Select upstream frequency that avoids diplex filter roll-
off area Forward and reverse properly aligned Signal leakage and ingress management Good installation practices

Confidential & Proprietary
ReferencesReferences
Hranac R., “CNR versus SNR” March 2003 Communications Technology Hranac R., “Spectrum analyzer CNR versus CMTS SNR” September 2003
Communications Technology Hranac R., “16 QAM Plant Preparation” Hranac R., “Deploying VOIP on the Outside Plant” Hranac R., “Linear Distortions,” Last 2 issues of CT Magazine
Ron Hranac wrote the book

Confidential & Proprietary
ReferencesReferences
“RF Impairments in the Return Path and their impact on DOCSIS performance”, by Jack Moran, Motorola
National Cable Television Association’s Recommended Practices for Measurements on Cable Television Systems, 2nd Edition, October 1997 “Supplement on Upstream Transport Issues.”
“Broadband Return Systems for HFC Cable TV Networks”, by Donald Raskin and Dean Stoneback
“Return Path Level Selection, Set Up, and Alignment Procedure”, Motorola 1997
“Modern Cable Television Technology”, by Walter Cicora, James Farmer and David Large

Confidential & Proprietary
More ReferencesMore References
“Mystified by Return Path Activation?” Get your Upstream Fiber Links Aligned, by Ron Hranac, Communications Technology, March 2000
“Seek Balance in All Things” A Look at Unity Gain in the Upstream Coax Plant, by Ron Hranac, Communications Technology, June 2000
“A Primer on Common Path Distortion”, by Nick Romanick, Communications Technology, April 2001

Thank You!Thank You!


