Measuring (and Managing) the Costs of Student Attrition Nate Johnson Postsecondary Analytics 423...
19
Measuring (and Managing) the Costs of Student Attrition Nate Johnson Postsecondary Analytics 423 East Virginia Street Tallahassee, Florida 32301 State Policy Workshop: State Higher Education Executive Officers Chicago, August 8, 2012 .postsecondaryanalytics.com @NateJohnsonFL
-
Upload
randolph-brooks -
Category
Documents
-
view
218 -
download
3
Transcript of Measuring (and Managing) the Costs of Student Attrition Nate Johnson Postsecondary Analytics 423...

Measuring (and Managing) the Costs of
Student AttritionNate Johnson
Postsecondary Analytics423 East Virginia StreetTallahassee, Florida 32301
State Policy Workshop: State Higher Education
Executive Officers
Chicago, August 8, 2012www.postsecondaryanalytics.com @NateJohnsonFL
About the Cost of Attrition Project
• Initiative of the Delta Project on Postsecondary Education Costs, Productivity, & Accountability
• Work undertaken by Jane Wellman, Donna Desrochers, Colleen Lenihan, Patricia Steele, Nate Johnson
• Funded through a grant from the Bill & Melinda Gates Foundation
• Research and consultations took place 2010-2011
• Delta Project now housed at the American Institutes for Research
Questions We Sought to Answer
• What is attrition?
• How should it be defined for public policy?
• How should we talk about it?
• How much does higher education spend on students who do not finish?
• What are the most helpful ways to disaggregate attrition costs?
• How can better understanding of attrition and costs improve policy and practice?
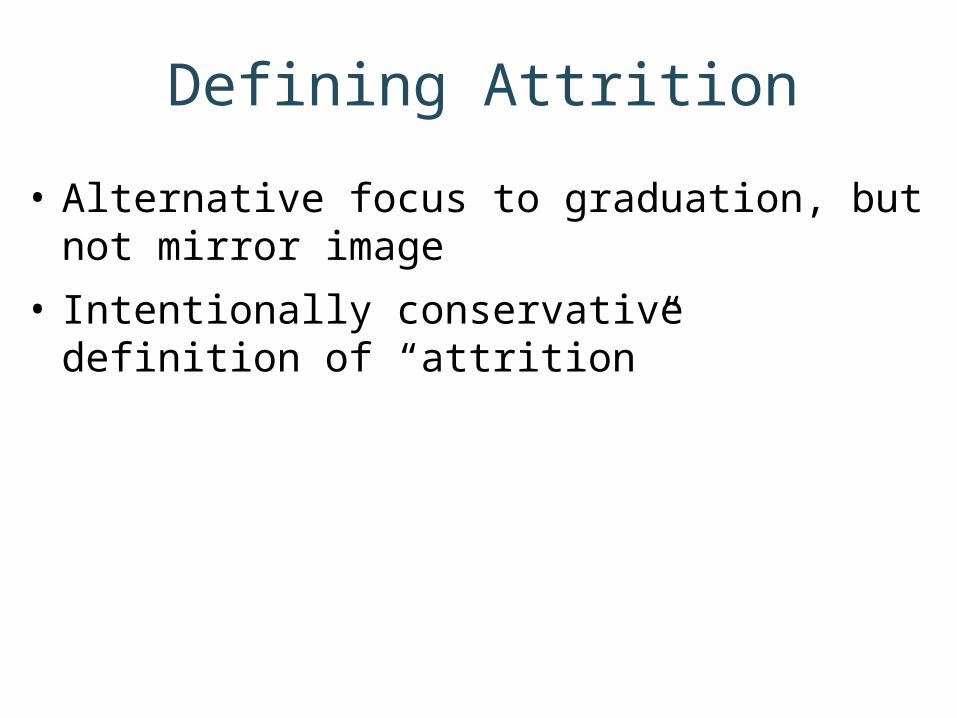
Defining Attrition
• Alternative focus to graduation, but not mirror image
• Intentionally conservative definition of “attrition”
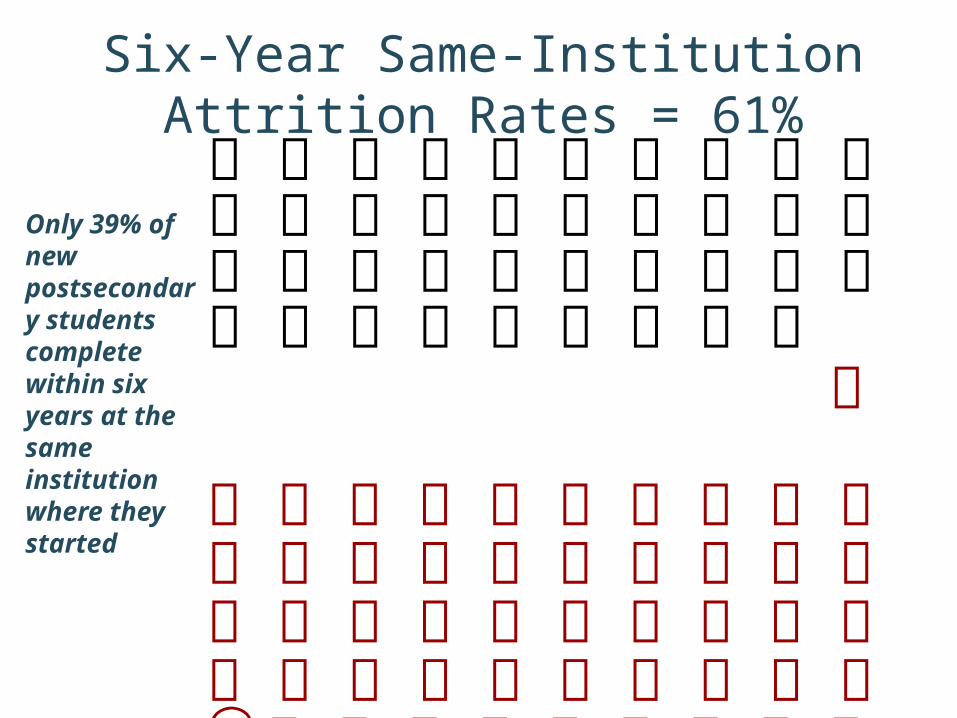
Six-Year Same-Institution Attrition Rates = 61%
Only 39% of new postsecondary students complete within six years at the same institution where they started
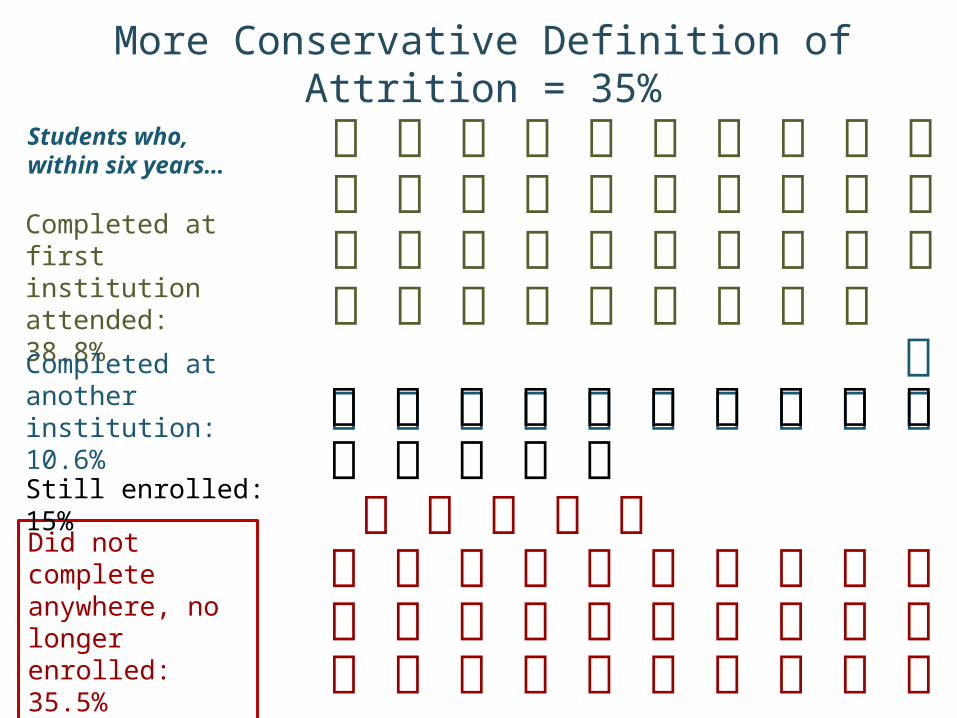
More Conservative Definition of Attrition = 35%
Completed at first institution attended: 38.8%
Did not complete anywhere, no longer enrolled: 35.5%
Completed at another institution: 10.6%
Still enrolled: 15%
Students who, within six years…
Defining Costs
• Beginning Postsecondary Students 2004/09 restricted use data
• Linked each student to institution-level IPEDS data
• Calculated expenditures per FT student (Delta Project “Education and Related Expenditures”)
• Calculated cumulative cost for each student
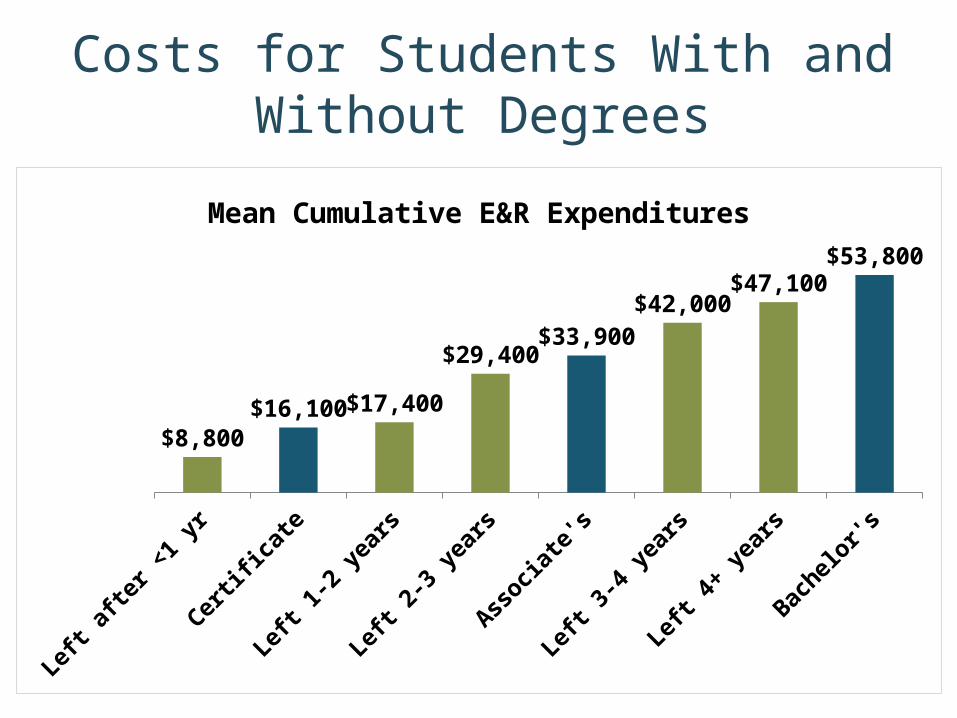
Costs for Students With and Without Degrees
Left a
fter
<1
yr
Certifi
cate
Left 1
-2 y
ears
Left 2
-3 y
ears
Assoc
iate
's
Left 3
-4 y
ears
Left 4
+ y
ears
Bache
lor's
$8,800 $16,100 $17,400
$29,400 $33,900
$42,000 $47,100
$53,800
Mean Cumulative E&R Expenditures
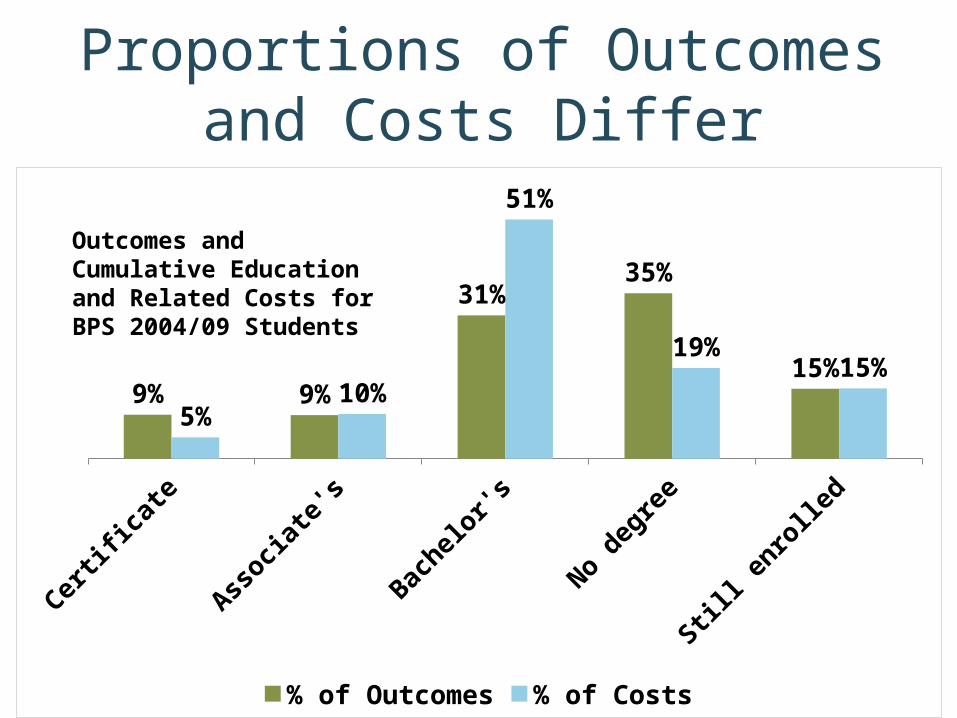
Proportions of Outcomes and Costs Differ
Certifica
te
Assoc
iate
's
Bache
lor's
No
degr
ee
Still
enr
olle
d
9% 9%
31%35%
15%
5%10%
51%
19%15%
% of Outcomes % of Costs
Outcomes and Cumulative Education and Related Costs for BPS 2004/09 Students

Magnitude of Attrition Cost Varies by Sector
Public 4-Year Public 2-Year Private 4-Year
73%
43%
83%
13%
33%
9%14%
24%
8%
Proportion of All Costs, by First Sector
Still enrolled
No Degree/Attrition
Degree or Credential
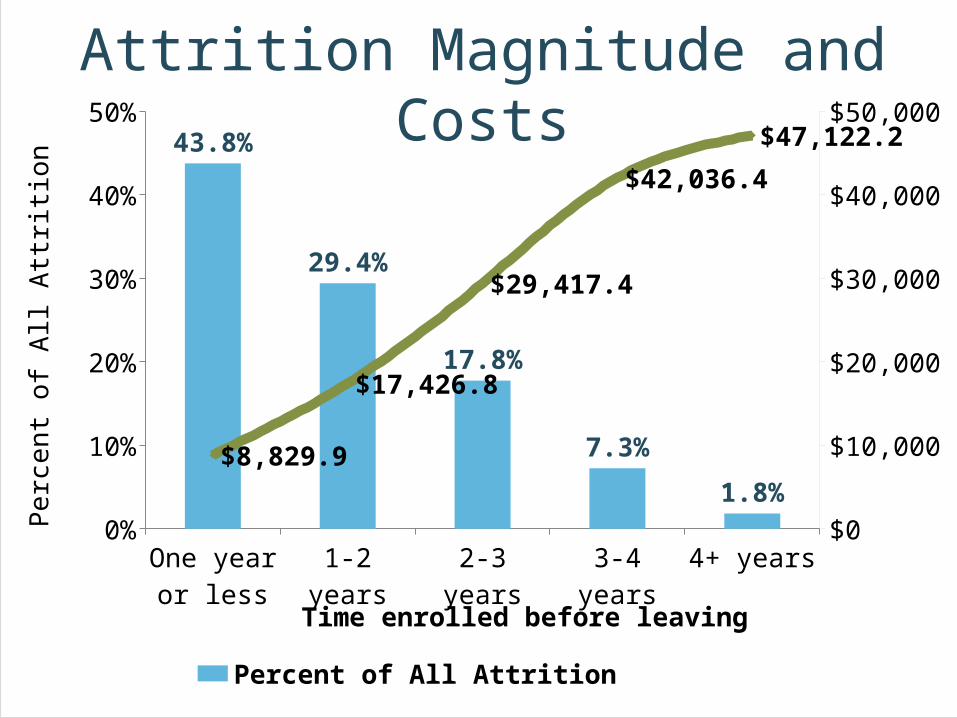
One year or less
1-2 years 2-3 years 3-4 years 4+ years$0
$10,000
$20,000
$30,000
$40,000
$50,000
0%
10%
20%
30%
40%
50%43.8%
29.4%
17.8%
7.3%
1.8%
$8,829.9
$17,426.8
$29,417.4
$42,036.4
$47,122.2
Percent of All Attrition
Time enrolled before leaving
Pe
rce
nt
of
All A
ttri
tio
n
Attrition Magnitude and Costs
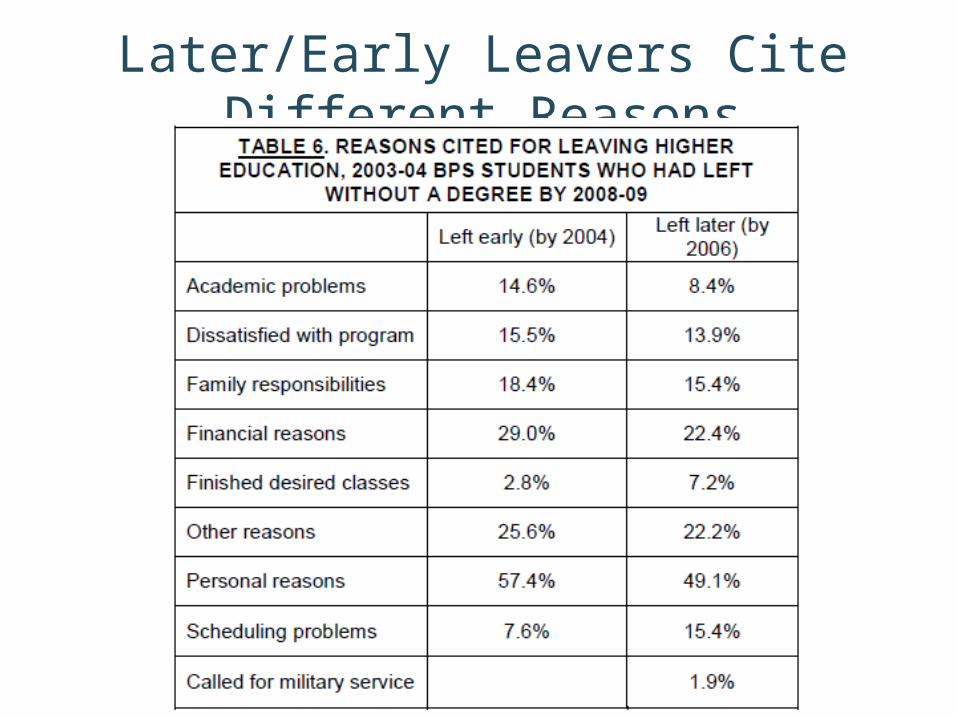
Later/Early Leavers Cite Different Reasons
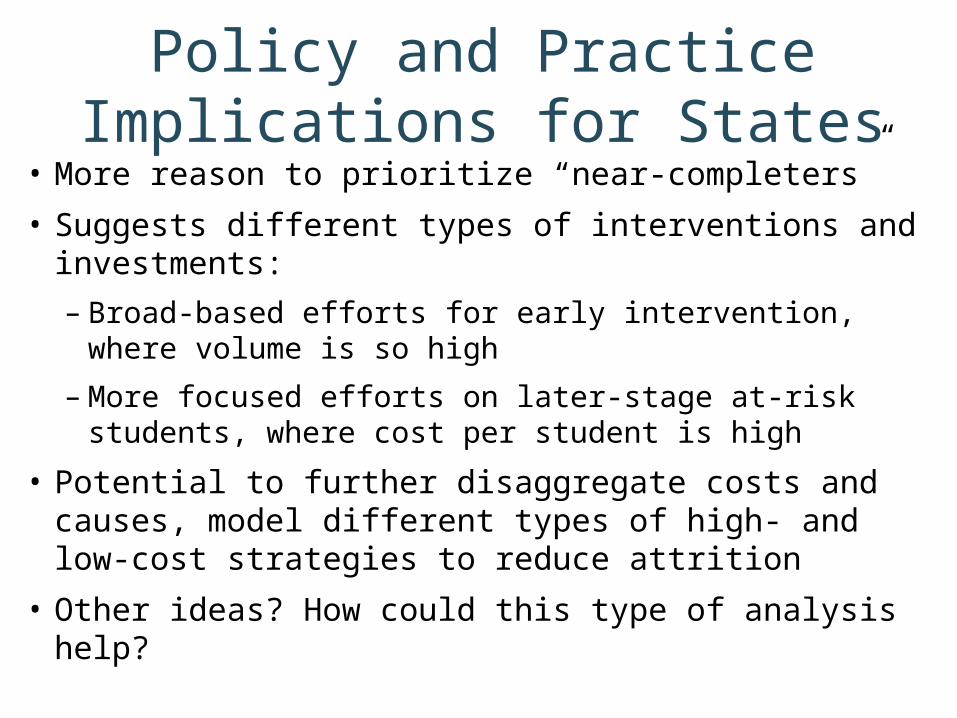
Policy and Practice Implications for States
• More reason to prioritize “near-completers”
• Suggests different types of interventions and investments:
– Broad-based efforts for early intervention, where volume is so high
– More focused efforts on later-stage at-risk students, where cost per student is high
• Potential to further disaggregate costs and causes, model different types of high- and low-cost strategies to reduce attrition
• Other ideas? How could this type of analysis help?
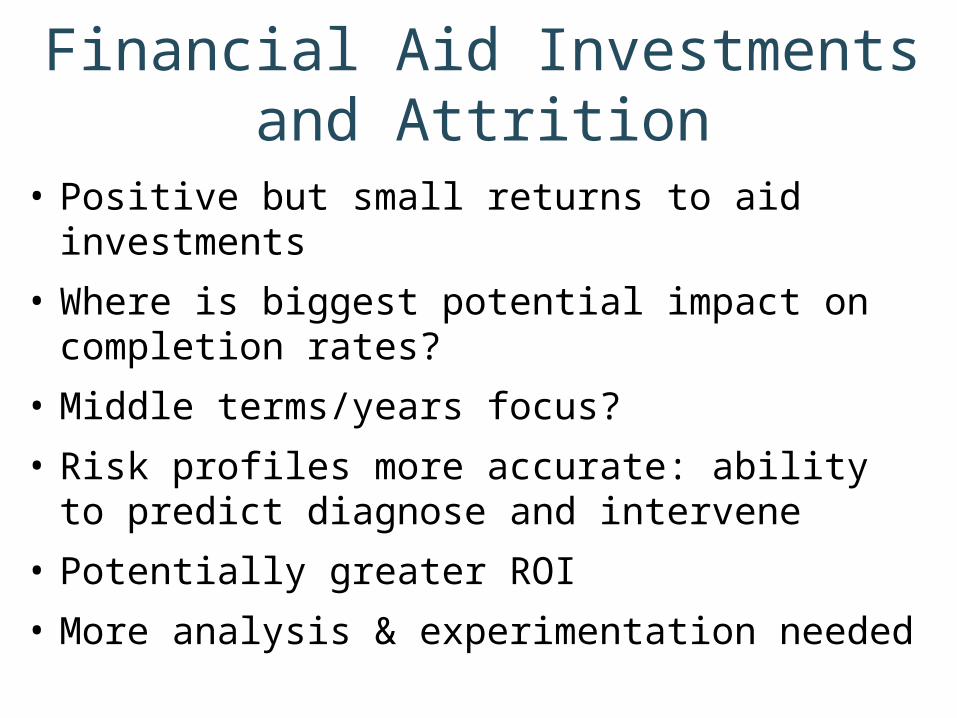
Financial Aid Investments and Attrition
• Positive but small returns to aid investments
• Where is biggest potential impact on completion rates?
• Middle terms/years focus?
• Risk profiles more accurate: ability to predict diagnose and intervene
• Potentially greater ROI
• More analysis & experimentation needed
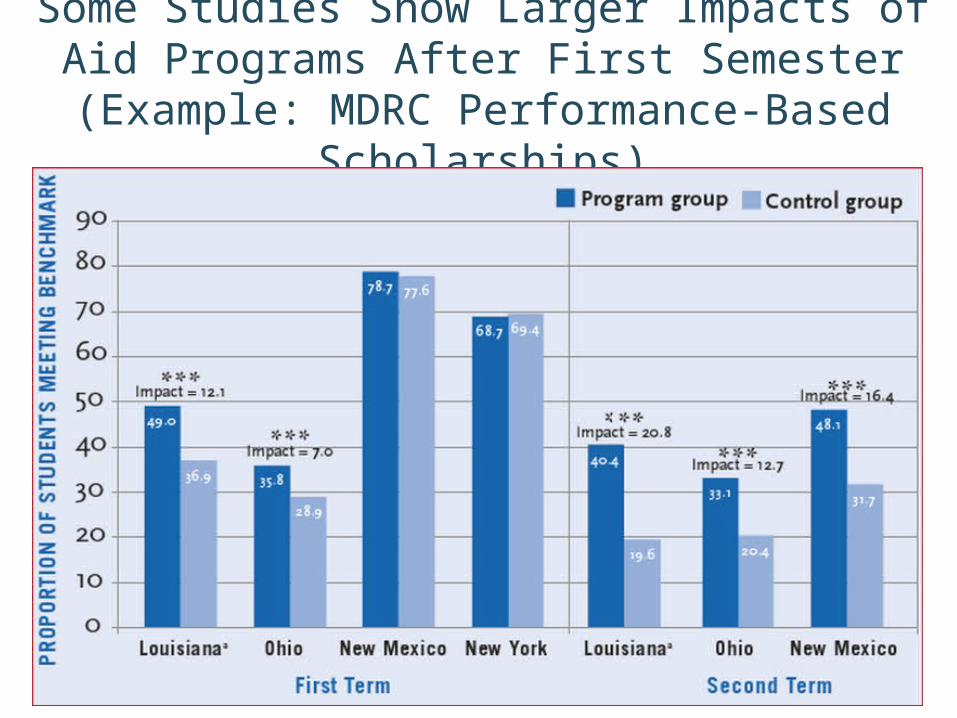
Some Studies Show Larger Impacts of Aid Programs After First Semester (Example: MDRC Performance-Based Scholarships)
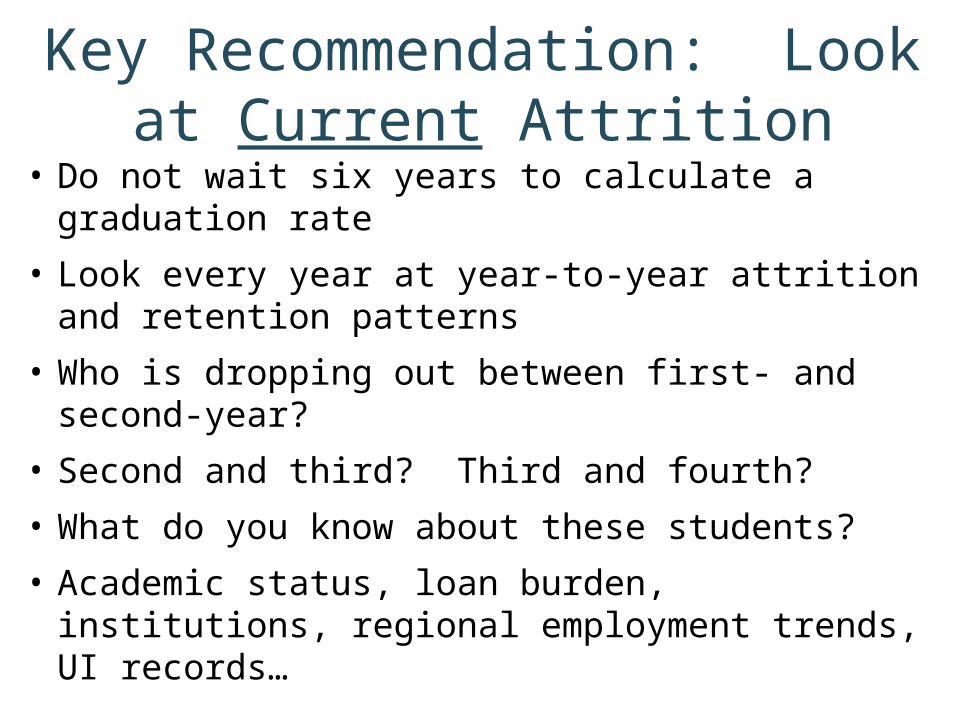
Key Recommendation: Look at Current Attrition
• Do not wait six years to calculate a graduation rate
• Look every year at year-to-year attrition and retention patterns
• Who is dropping out between first- and second-year?
• Second and third? Third and fourth?
• What do you know about these students?
• Academic status, loan burden, institutions, regional employment trends, UI records…
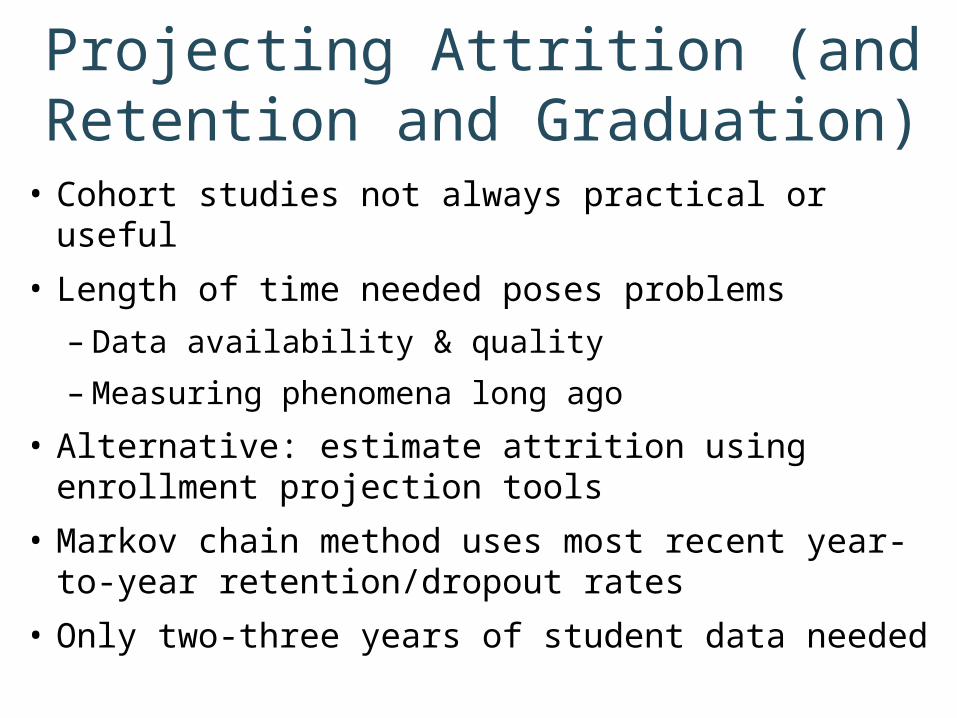
Projecting Attrition (and Retention and Graduation)
• Cohort studies not always practical or useful
• Length of time needed poses problems
– Data availability & quality
– Measuring phenomena long ago
• Alternative: estimate attrition using enrollment projection tools
• Markov chain method uses most recent year-to-year retention/dropout rates
• Only two-three years of student data needed
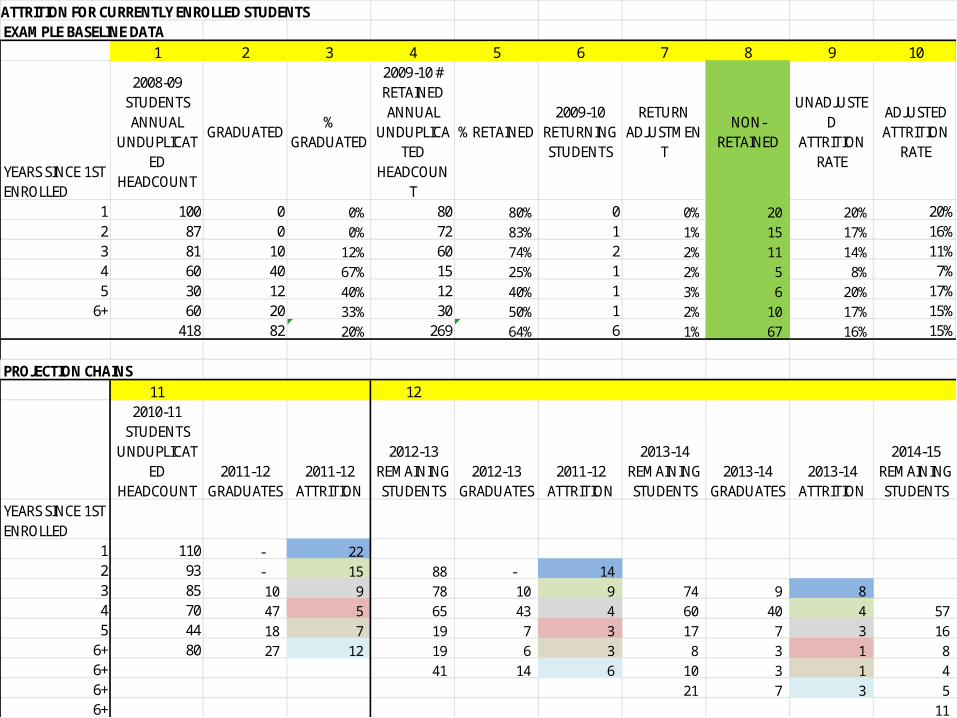
STEPS TO PROJECT LONG-TERM ATTRITION FOR CURRENTLY ENROLLED STUDENTSEXAMPLE BASELINE DATA
1 2 3 4 5 6 7 8 9 10
YEARS SINCE 1ST ENROLLED
2008-09 STUDENTS ANNUAL
UNDUPLICATED
HEADCOUNT
GRADUATED%
GRADUATED
2009-10 # RETAINED ANNUAL
UNDUPLICATED
HEADCOUNT
% RETAINED2009-10
RETURNING STUDENTS
RETURN ADJUSTMEN
T
NON-RETAINED
UNADJUSTED
ATTRITION RATE
ADJUSTED ATTRITION
RATE
1 100 0 0% 80 80% 0 0% 20 20% 20%2 87 0 0% 72 83% 1 1% 15 17% 16%3 81 10 12% 60 74% 2 2% 11 14% 11%4 60 40 67% 15 25% 1 2% 5 8% 7%5 30 12 40% 12 40% 1 3% 6 20% 17%
6+ 60 20 33% 30 50% 1 2% 10 17% 15%418 82 20% 269 64% 6 1% 67 16% 15%
PROJECTION CHAINS11 12
2010-11 STUDENTS
UNDUPLICATED
HEADCOUNT2011-12
GRADUATES2011-12
ATTRITION
2012-13 REMAINING STUDENTS
2012-13 GRADUATES
2011-12 ATTRITION
2013-14 REMAINING STUDENTS
2013-14 GRADUATES
2013-14 ATTRITION
2014-15 REMAINING STUDENTS
YEARS SINCE 1ST ENROLLED
1 110 - 22 2 93 - 15 88 - 14 3 85 10 9 78 10 9 74 9 8 4 70 47 5 65 43 4 60 40 4 57 5 44 18 7 19 7 3 17 7 3 16
6+ 80 27 12 19 6 3 8 3 1 8 6+ 41 14 6 10 3 1 4 6+ 21 7 3 5 6+ 11
Questions or comments?
• Materials will be released soon on the Delta Project website:
www.deltacostproject.org
• Feedback and questions welcome:[email protected]