
Measuring and Managing Particulates and Dust – Technical and ...
13
Measuring and Managing Particulates and Dust – Technical and Practical Issues RSC Law Group Seminar on Managing the Risk of Environmental Nuisance Claims Andy Talbot, Associate Air Quality & Greenhouse Gas Management 24 th June 2010 Introduction 2 This talk covers: ● Definitions of particulates and dust ● Sources ● Perception ● Measurement ● Management
Transcript of Measuring and Managing Particulates and Dust – Technical and ...
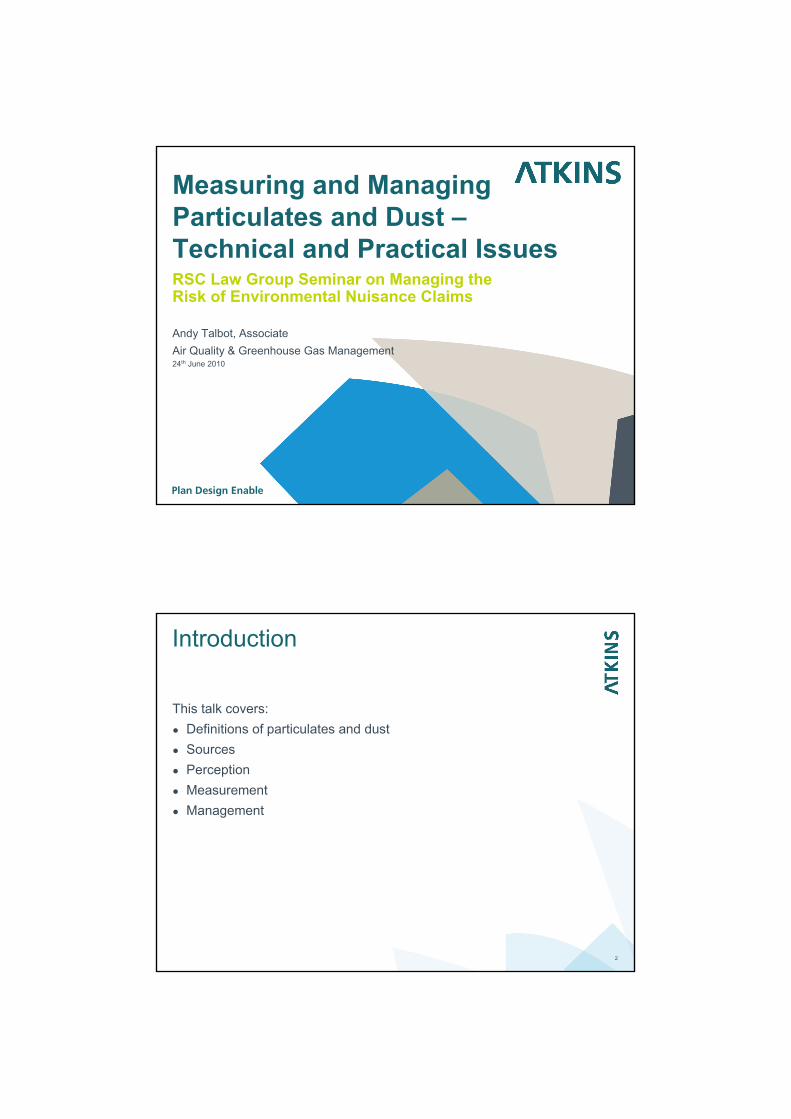
Measuring and Managing Particulates and Dust –Technical and Practical IssuesRSC Law Group Seminar on Managing the Risk of Environmental Nuisance Claims
Andy Talbot, Associate
Air Quality & Greenhouse Gas Management24th June 2010
Introduction
2
This talk covers:
● Definitions of particulates and dust
● Sources
● Perception
● Measurement
● Management
Definitions
3
● ‘Particulates’– Collection of discrete particles
● In practical terms anything from a ‘few’ nm to a ‘few’ mm in diameter that can become suspended in the atmosphere
● Compositionally homogenous or varied
● Characteristic morphology(ies)
– Primary particles are emitted directly
– Secondary particles are formed by chemical processes in atmosphere
– Health effects associated with fine particles smaller than 10 µm (PM10 and PM2.5)
– Synonymous with dust?
Definitions
4
● ‘Dust’– BS 6069 Part 2: Solid particulate matter 1 to 75 µm in diameter (larger =
‘grit’)
– Particulate matter that can become suspended in the atmosphere and deposited (a process that may repeat many times over)
– ‘Nuisance dust’ generally associated with coarse fraction particulates >20 µm in diameter, and not health effects
Sources
5
● Natural– Pollen and spores
– Sea salt
– Soil
– Volcanic ash
– Fires etc ….
● Anthropogenic– Agriculture
– Construction/demolition
– Minerals extraction
– Industry
– Transport
– ‘Leisure’ activities (e.g. off-roading)
Perception
6
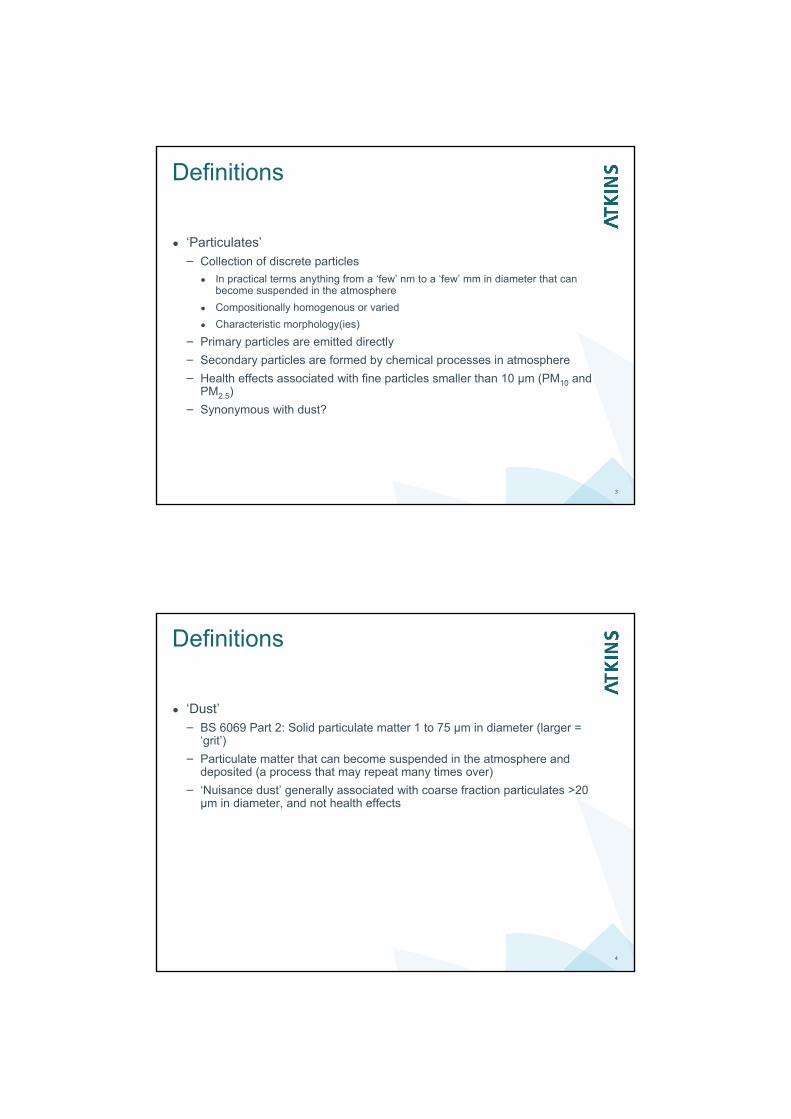
● Senses
● Tolerance
– Very variable, many influencing factors
Very bothered Not bothered
Measurement
7
Questions:● Where is the dust coming from?
● At what level is it going to be a ‘nuisance’?
To answer these questions we need:● Indicators
● Sampling methods
● Analytical methods
Measurement – Visual Inspection
8
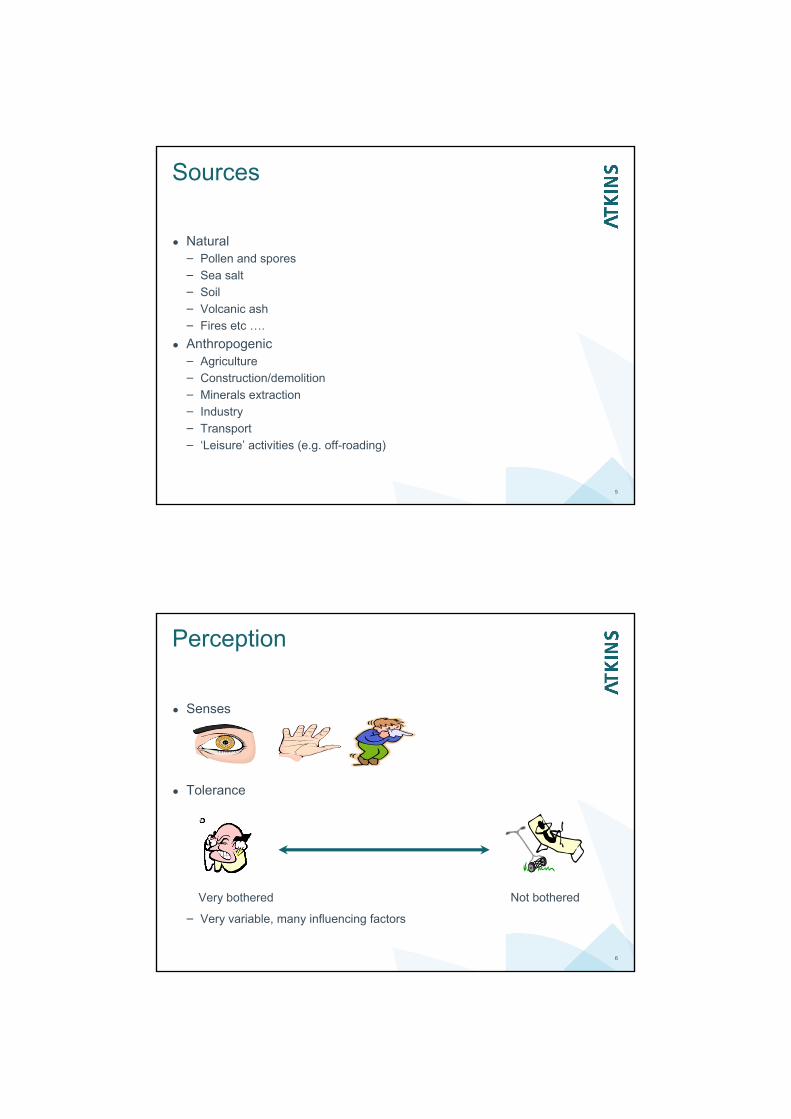
● Deposited dust and surface soiling
● Dust plume(s) from site
SITE INSPECTION PROFORMA – DUST/EMISSIONS CONTROL MEASURES
Sheet of Contractor Name: ............................................................................ Contract: .....................................................................................................................................................
Date: ....................... Time (24 hour): ...................... Completed By (print name):........................................................... (signature): .............................................................
1. Site activities and control measures Site location identifier
Activity observed Type of control applied
Effectiveness of applied control (tick appropriate box) Details of remedial action/change required No visible
emissions Emissions visible within site boundary only (consider tightening control)
Emissions crossing site boundary (remedial action required)
2. Weather and ground conditions (circle as appropriate):
Wind speed (use Beaufort scale) 1 2 3 4 5 6 7 8 9 10
Wind from N NE E SE S SW W NW
Rain None Intermittent (showers) Prolonged (>1hour) Light Heavy
Ground surface Dry Drying Damp Wet (puddles)
3. Give any other relevant information (such as investigation of complaint)
Measurement – Dust Deposition
9
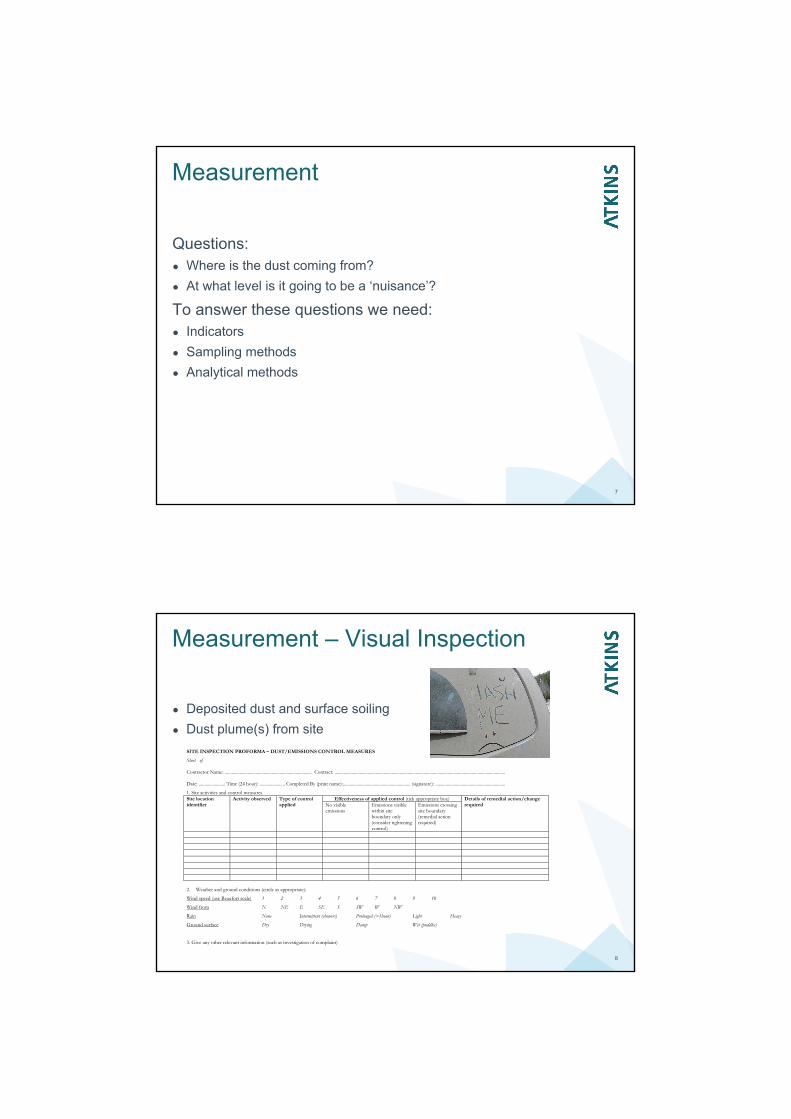
Dry ‘Frisbee’ deposit gauge (substantial improvement on BS 1747 Part 1 Deposit Gauge)
BS1747 Part 5 flux gauge (N.B. not deposition)
Measurement – Dust Deposition
10
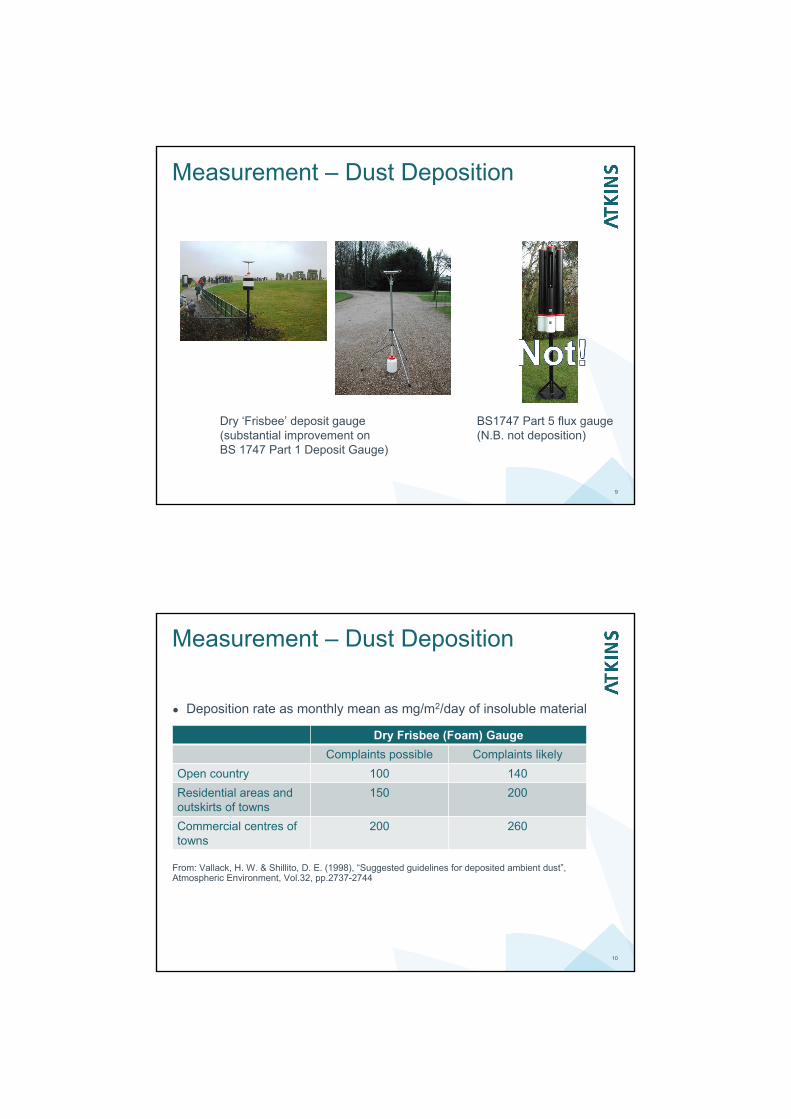
● Deposition rate as monthly mean as mg/m2/day of insoluble material
From: Vallack, H. W. & Shillito, D. E. (1998), “Suggested guidelines for deposited ambient dust”, Atmospheric Environment, Vol.32, pp.2737-2744
Dry Frisbee (Foam) Gauge
Complaints possible Complaints likely
Open country 100 140
Residential areas and outskirts of towns
150 200
Commercial centres of towns
200 260
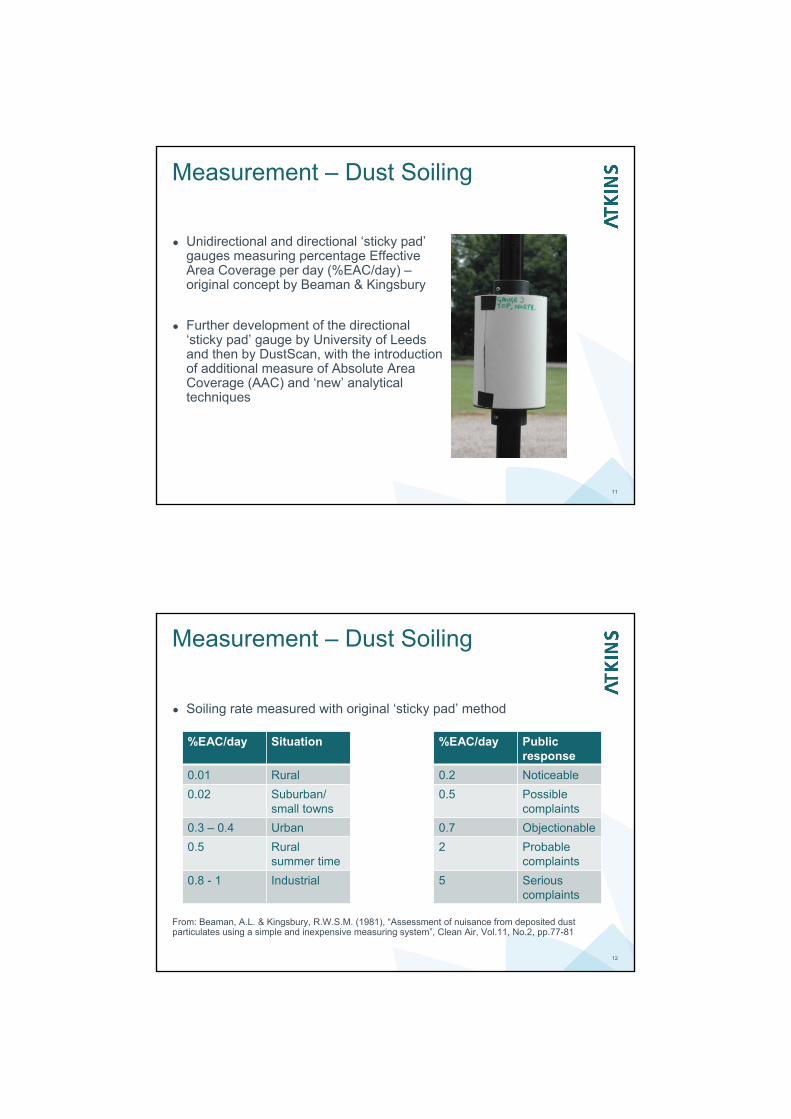
Measurement – Dust Soiling
11
● Unidirectional and directional ‘sticky pad’gauges measuring percentage Effective Area Coverage per day (%EAC/day) –original concept by Beaman & Kingsbury
● Further development of the directional ‘sticky pad’ gauge by University of Leeds and then by DustScan, with the introduction of additional measure of Absolute Area Coverage (AAC) and ‘new’ analytical techniques
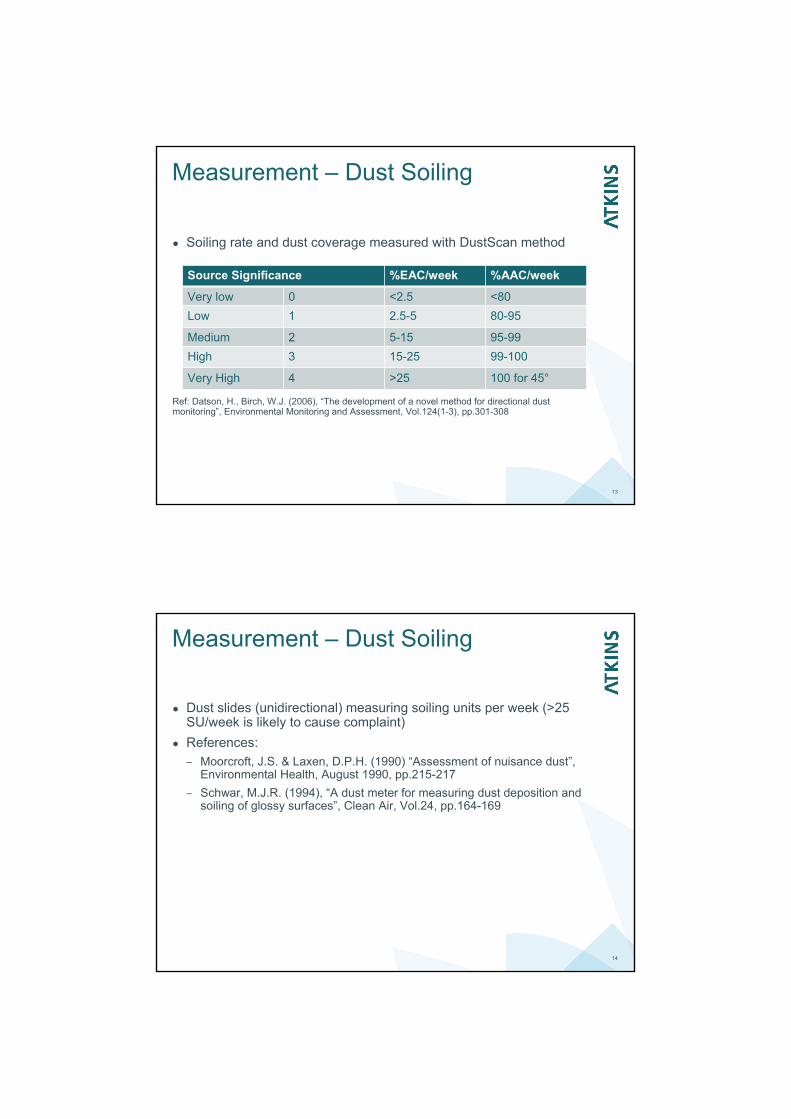
Measurement – Dust Soiling
12
● Soiling rate measured with original ‘sticky pad’ method
From: Beaman, A.L. & Kingsbury, R.W.S.M. (1981), “Assessment of nuisance from deposited dust particulates using a simple and inexpensive measuring system”, Clean Air, Vol.11, No.2, pp.77-81
%EAC/day Situation %EAC/day Public response
0.01 Rural 0.2 Noticeable
0.02 Suburban/ small towns
0.5 Possible complaints
0.3 – 0.4 Urban 0.7 Objectionable
0.5 Rural summer time
2 Probable complaints
0.8 - 1 Industrial 5 Serious complaints
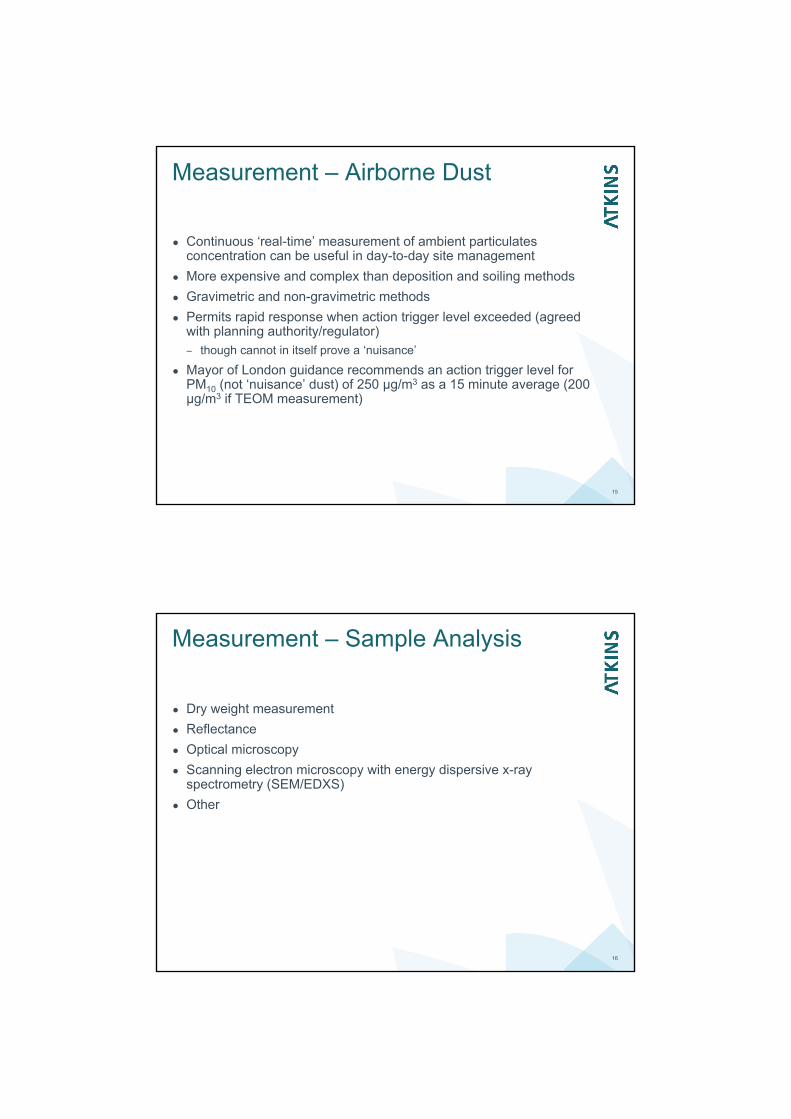
Measurement – Dust Soiling
13
● Soiling rate and dust coverage measured with DustScan method
Ref: Datson, H., Birch, W.J. (2006), “The development of a novel method for directional dust monitoring”, Environmental Monitoring and Assessment, Vol.124(1-3), pp.301-308
Source Significance %EAC/week %AAC/week
Very low 0 <2.5 <80
Low 1 2.5-5 80-95
Medium 2 5-15 95-99
High 3 15-25 99-100
Very High 4 >25 100 for 45°
Measurement – Dust Soiling
14
● Dust slides (unidirectional) measuring soiling units per week (>25 SU/week is likely to cause complaint)
● References: – Moorcroft, J.S. & Laxen, D.P.H. (1990) “Assessment of nuisance dust”,
Environmental Health, August 1990, pp.215-217
– Schwar, M.J.R. (1994), “A dust meter for measuring dust deposition and soiling of glossy surfaces”, Clean Air, Vol.24, pp.164-169
Measurement – Airborne Dust
15
● Continuous ‘real-time’ measurement of ambient particulates concentration can be useful in day-to-day site management
● More expensive and complex than deposition and soiling methods
● Gravimetric and non-gravimetric methods
● Permits rapid response when action trigger level exceeded (agreed with planning authority/regulator)– though cannot in itself prove a ‘nuisance’
● Mayor of London guidance recommends an action trigger level for PM10 (not ‘nuisance’ dust) of 250 μg/m3 as a 15 minute average (200 μg/m3 if TEOM measurement)
Measurement – Sample Analysis
16
● Dry weight measurement
● Reflectance
● Optical microscopy
● Scanning electron microscopy with energy dispersive x-ray spectrometry (SEM/EDXS)
● Other
Measurement – Sample Analysis
17
Particle CategoryMorphology / Elemental Composition
Unburnt CoalMainly organic, sulphur and chlorine may also be detected by EDXAAngular appearance with conchoidal fractures
Partially combusted Carbonaceous material
Negligible presence of elements detected by EDXAIrregular cellular structure, particles tend to appear round
SandSilicon rich particles with either amorphous or crystalline appearance
Amorphous dirtIrregularly shaped particles, containing aluminium, silicon, calcium, potassium and Iron in varying proportions
Fly AshSpherical in shape, usually containing combinations of silicon, aluminium, potassium, calcium, iron and titanium
Plant/AnimalOrganic fragments, often of uniform or regular structure, recognisable as having originated from insects or plants
Limestone Calcium detected as the major element
Iron Oxide Iron detected as the major element
SEM/EDXA
Source: TES Bretby
Measurement – Sample Analysis
18
● Photomicrograph showing large crystalline angular iron, large slag plus assorted small iron and slag particles
● Composition
Particle type
% freq
Range (µm)
Mean(µm)
Mode(µm)
Angular iron 14 1-30 8.5 *
Calcium (iron) alumina-silicate (slag)
72 0.5-100 11.8 2
Quartz (silica)
5 5-7 6.0 6
Alumina-silicate (clay etc)
2 5-6 5.5 *
Limestone 0 - - -
Carbon based
7 3-20 9.7 5
Spherical fly ash
0 - - -
Others 0 - - -
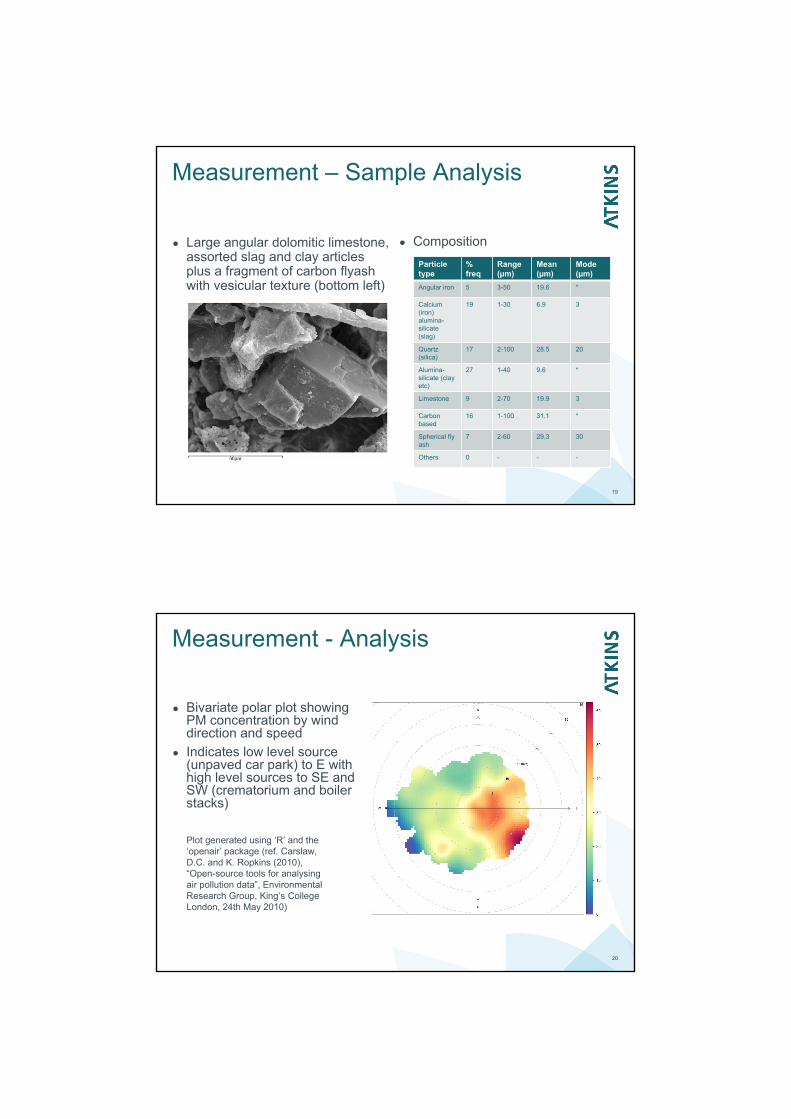
Measurement – Sample Analysis
19
● Large angular dolomitic limestone, assorted slag and clay articles plus a fragment of carbon flyash with vesicular texture (bottom left)
● Composition
Particle type
% freq
Range (µm)
Mean(µm)
Mode(µm)
Angular iron 5 3-50 19.6 *
Calcium (iron) alumina-silicate (slag)
19 1-30 6.9 3
Quartz (silica)
17 2-100 28.5 20
Alumina-silicate (clay etc)
27 1-40 9.6 *
Limestone 9 2-70 19.9 3
Carbon based
16 1-100 31.1 *
Spherical fly ash
7 2-60 29.3 30
Others 0 - - -
Measurement - Analysis
20
● Bivariate polar plot showing PM concentration by wind direction and speed
● Indicates low level source (unpaved car park) to E with high level sources to SE and SW (crematorium and boiler stacks)
Plot generated using ‘R’ and the ‘openair’ package (ref. Carslaw, D.C. and K. Ropkins (2010), “Open-source tools for analysing air pollution data”, Environmental Research Group, King’s College London, 24th May 2010)
21
Management
22
Good Management:
● Undertakes risk assessments at appropriate intervals
● Obtains and complies with permits for prescribed processes/installations
● Maintains industry ‘best practice’ …– ‘measures’ to address the risks (prevent, control, contain)
– in ‘monitoring’ to inform site management when there is potentially a problem
● Has formally documented (controlled) and readily accessible dust/particulate management and incident response procedures
● Undertakes staff training, has open communications with stakeholders, carries out regular process and management reviews + periodic formal audits
=
no/few complaints, no action by the local authority/regulator/court, money not wasted, reputation maintained/enhanced
Management
23
PREVENT (ideal)
REDUCE / CONTROL
CONTAIN* (not ideal)
Under normal operations, measures should …
… emissions
For when things go wrong …
BE PREPARED! OR
* within site boundary
Management
24
Examples of good practice references:● Mayor of London, “The Control of Dust and Emissions from
Construction and Demolition: Best Practice Guidance”, November 2006
● CIRIA C650 “Environmental good practice on site”
● www.goodquarry.com (University of Leeds and Mineral Industry Research Organisation)
● Environment Agency, “Monitoring of particulate matter in ambient air around waste facilities”, Technical Guidance Document (Monitoring) M17