
EXPLAINING DIFFERENCES/ EXPLAINING SIMILARITIES NATURE VS NURTURE.

Measuring and Explaining Management Practices across Firms and CountriesAuthor(s): Nicholas Bloom and John Van ReenenSource: The Quarterly Journal of Economics, Vol. 122, No. 4 (Nov., 2007), pp. 1351-1408Published by: Oxford University PressStable URL: http://www.jstor.org/stable/25098879 .
Accessed: 31/03/2014 10:41
Your use of the JSTOR archive indicates your acceptance of the Terms & Conditions of Use, available at .http://www.jstor.org/page/info/about/policies/terms.jsp
.JSTOR is a not-for-profit service that helps scholars, researchers, and students discover, use, and build upon a wide range ofcontent in a trusted digital archive. We use information technology and tools to increase productivity and facilitate new formsof scholarship. For more information about JSTOR, please contact [email protected].
.
Oxford University Press is collaborating with JSTOR to digitize, preserve and extend access to The QuarterlyJournal of Economics.
http://www.jstor.org
This content downloaded from 152.2.176.242 on Mon, 31 Mar 2014 10:41:04 AMAll use subject to JSTOR Terms and Conditions

THE
QUARTERLY JOURNAL OF ECONOMICS
Vol. CXXII November 2007 Issue 4
MEASURING AND EXPLAINING MANAGEMENT PRACTICES ACROSS FIRMS AND COUNTRIES*
Nicholas Bloom and John Van Reenen
We use an innovative survey tool to collect management practice data from
732 medium-sized firms in the United States, France, Germany, and the United
Kingdom. These measures of managerial practice are strongly associated with
firm-level productivity, profitability, Tobin's Q, and survival rates. Management
practices also display significant cross-country differences, with U.S. firms on av
erage better managed than European firms, and significant within-country dif
ferences, with a long tail of extremely badly managed firms. We find that poor
management practices are more prevalent when product market competition is
weak and/or when family-owned firms pass management control down to the el
dest sons (primogeniture).
I. INTRODUCTION
Economists have long speculated on why such astounding differences in productivity performance exist between firms and
plants within countries, even within narrowly defined sectors. For
example, labor productivity varies dramatically even within the
* More details can be found in the working paper version of this paper (Bloom and Van Reenen 2006). We would like to thank the Economic and Social Research Council, the Anglo-German Foundation, and the Advanced Institute for Manage ment for their substantial financial support. We received no funding from the
global management consultancy firm we worked with in developing the survey tool. Our partnership with John Dowdy, Stephen Dorgan, and Tom Rippin has been particularly important in the development of the project. The Bundesbank and the UK Treasury supported the development of the survey. Helpful com ments have been received from many people including Larry Katz, Ed Glaeser, and four anonymous referees, as well as seminar audiences at Berkeley, Chicago, Columbia, Cornell, the Federal Reserve Board, Harvard, Hebrew University, LSE, Maryland, Minnesota, MIT, NBER, Northwestern, NYU, Princeton, PSE, Stanford, UCL, Wharton, and Yale.
? 2007 by the President and Fellows of Harvard College and the Massachusetts Institute of
Technology. The Quarterly Journal of Economics, November 2007
1351
This content downloaded from 152.2.176.242 on Mon, 31 Mar 2014 10:41:04 AMAll use subject to JSTOR Terms and Conditions

1352 QUARTERLY JOURNAL OF ECONOMICS
same five-digit industry, and these differences are often highly persistent over time.1
The focus of much applied economic research has been in
"chipping away" at these productivity differences through better measures of inputs (capital, materials, skills, etc.). Some parts of the literature have attempted to see how much of the resid ual can be accounted for by explicit measures of technology, such as research and development or information and communication
technologies. But technology is only one part of the story, and a substantial unexplained productivity differential still remains, which panel data econometricians often label as the fixed effects of "managerial quality" (e.g., Mundlak [1961]).
While the popular press and business schools have
long stressed the importance of good management, empirical economists have had relatively little to say about management practices. A major problem has been the absence of high-quality data that are measured in a consistent way across countries and firms. One of the purposes of this paper is to present a survey instrument for the measurement of managerial practices. We col lect original data using this survey instrument from a sample of 732 medium-sized manufacturing firms in the United States, the United Kingdom, France, and Germany.
We start by evaluating the quality of these survey data. We first conduct internal validation by resurveying firms to interview different managers in different plants using different interviewers in the same firms and find a strong correlation between these two
independently collected measures. We then conduct external val idation by matching the survey data with information on firm ac counts and stock market values to investigate the association be tween our measure of managerial practices and firm performance.
We find that better management practices are significantly associ ated with higher productivity, profitability, Tobin's Q, sales growth rates, and firm-survival rates. This is true in both our English speaking countries (the United Kingdom and the United States) and the continental European countries (France and Germany), which suggests that our characterization of good management is not specific to Anglo-Saxon cultures.
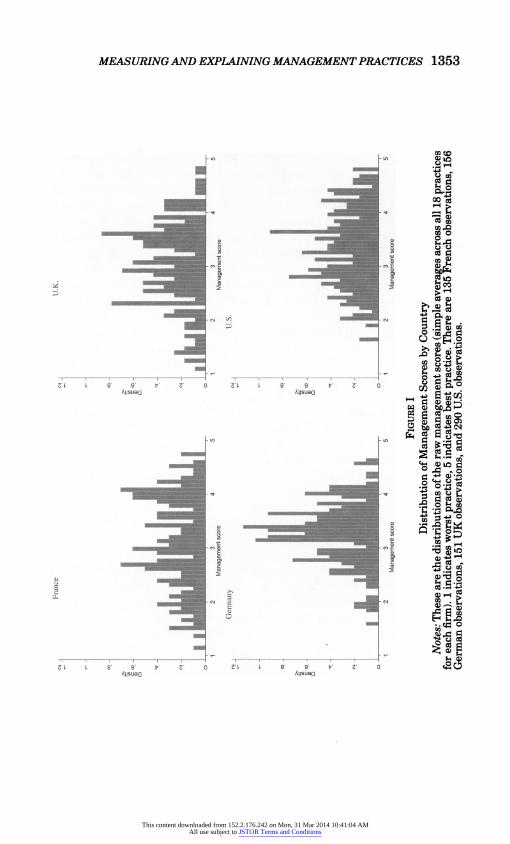
We then turn to analyzing the raw survey data and observe a surprisingly large spread in management practices across firms (see Figure I). Most notably, we see a large number of firms that
1. For example, Baily, Hulten, and Campbell (1992), Bartelsman and Dhrymes (1998), Bartelsman and Doms (2000), Foster, Haltiwanger, and Syverson (2005).
This content downloaded from 152.2.176.242 on Mon, 31 Mar 2014 10:41:04 AMAll use subject to JSTOR Terms and Conditions
3. Fraace
2. UK
^ J i d ^ Ii J ?
JiiIuUIIUl .iLjIil.. ! 1 i nm?t
4 5 12 1 4 5 G
Germany ? U.S. R?
{jLLiik ! 1 2 ? 4 5 12 > .:'--.; 4 * O
Figure I ts Distribution of Management Scores by Country
Notes: These are the distributions of the raw management scores (simple averages across all 18 practices ?? for each firm). 1 indicates worst practice, 5 indicates best practice. There are 135 French observations, 156 oi German observations, 151 UK observations, and 290 U.S. observations. w
This content downloaded from 152.2.176.242 on Mon, 31 Mar 2014 10:41:04 AMAll use subject to JSTOR Terms and Conditions
1354 QUARTERLY JOURNAL OF ECONOMICS
appear to be extremely badly managed, with ineffective monitor
ing, targets and incentives. We also observe significant variations in management practices across our sample of countries, with U.S.
firms on average better managed than European firms. This raises the main question that we address in the paper?
what could rationalize such variations in management practices? The two factors that appear to play an important role are prod uct market competition and family firms. First, higher levels of
competition (measured using a variety of different proxies, such as trade openness) are strongly associated with better manage ment practices. This competition effect could arise through a num ber of channels, including the more rapid exit of badly managed firms and/or the inducement of greater managerial effort. Second, family-owned firms in which the chief executive officer (CEO) is chosen by primogeniture (the eldest male child) tend to be very badly managed. In theory, family ownership could have beneficial effects from the concentration of ownership, as this may overcome some of the principal-agent problems associated with dispersed ownership. In our data, we find that family ownership combined with professional management (i.e., where the CEO is not a family member) has a mildly positive association with good managerial practices. The impact of family ownership and management is more theoretically ambiguous, however, with positive effects from
reducing the principal-agent problem but negative effects due to more limited selection into managerial positions as well as the
Carnegie effect.2 Empirically, we find that companies that select the CEO from all family members are no worse managed than other firms, but those that select the CEO based on primogeni ture are very poorly managed.
The impact of competition and family firms is quantitatively important. Low competition and primogeniture in family firms ac count for about half of the tail of poorly performing firms. Across
countries, competition and family firms also play a large role, ac
counting for over half of the gap in management practices between the United States and France and one-third of the gap between the United States and the United Kingdom. One reason is that Euro
pean competition levels are lower than those in the United States. Another reason is that primogeniture is much more common in
2. The "Carnegie effect" is named after the great philanthropist Andrew Carnegie, who claimed, "The parent who leaves his son enormous wealth gen erally deadens the talents and energies of the son, and tempts him to lead a less useful and less worthy life than he otherwise would." See also Holtz-Eakin, Joulfaian, and Rosen (1993).
This content downloaded from 152.2.176.242 on Mon, 31 Mar 2014 10:41:04 AMAll use subject to JSTOR Terms and Conditions
MEASURING AND EXPLAINING MANAGEMENT PRACTICES 1355
France and the United Kingdom due to their Norman heritage, in which primogeniture was legally enforced to preserve concen trated land-holdings for military support. More recently, Britain and other European countries have also provided generous estate tax exemptions for family firms.
Our work relates to a number of strands in the litera ture. First, our findings are consistent with recent econometric work looking at the importance of product market competition in increasing productivity.3 It has often been speculated that the productivity-enhancing effects of competition work through improving average management practices, and our study provides support for this view. Second, economic historians such as Lan des (1969) and Chandler (1994) have claimed that the relative industrial decline of the United Kingdom and France in the early twentieth century was driven by their emphasis on family man
agement, compared to the German and American approach of
employing professional managers.4 Our results suggest this phe nomenon is still important almost a century later. A third related strand is work on the impact of human resource management (HRM),5 which also finds that these management practices are linked to firm performance. Finally, there is the recent contribu tion of Bertrand and Schoar (2003), who focus on the impact of
changing CEOs and CFOs in very large quoted U.S. firms. This will tend to reflect the impact of management styles and strate
gies, complementing our work emphasizing the practices of middle
management. We see management practices as more than the at
tributes of the top managers: they are part of the organizational structure and behavior of the firm, typically evolving slowly over time even as CEOs and CFOs come and go.
The layout of this paper is as follows. Section II discusses
why management practices could vary, Section III discusses mea
suring management practices with our management data, and Section IV offers an external validation of the survey tool. In Section V, we discuss the distribution of management practices and offer evidence on the causes for the variations in manage ment. In Section VI, we pull this all together to try to explain
3. There is a very large number of papers in this area, but examples of key recent contributions would be Nickell (1996), Olley and Pakes (1996), and Syverson (2004a, 2004b).
4. See also the recent literature on family firms and performance, for exam
ple, Bertrand et al. (2005), Morck, Wolfenzon, and Yeung (2005), Perez-Gonzalez (2005), and Villalonga and Amit (2005).
5. For example, Ichinowski, Shaw, and Prenushi (1997), Lazear (2000), Black and Lynch (2001), and Bartel, Ichinowski, and Shaw (2005).
This content downloaded from 152.2.176.242 on Mon, 31 Mar 2014 10:41:04 AMAll use subject to JSTOR Terms and Conditions

1356 QUARTERLY JOURNAL OF ECONOMICS
management practices across firms and countries. Finally, some
concluding comments are offered in Section VII. More details of the data, models, and results can be found in the appendixes and the working paper version.
II. Models of Management Practices
II.A. Why Are There Good and Bad Management Practices?
Our starting point is that there are likely to be management practices that are, on average, "good" for firm productivity. Organi zations where managers are of high quality or supply effort that is more effective will tend to have better managerial practices. This notion underlies the Lucas (1978) model of firm size and Mundlak's (1961) discussion of firm fixed effects. It is also inher ent in the benchmarking exercises that are ubiquitous in the busi ness world. We will discuss in detail the challenge of empirically measuring these, but first consider some examples. Japanese lean
manufacturing techniques (just-in-time, quality circles, etc.) were a managerial innovation that was initially resisted but gradually became adopted across the West, first in the automobile industry and then elsewhere. Eventually these managerial methods were
acknowledged to be generally superior, even if they are not al
ways adopted (we discuss reasons for this below). A second exam
ple would be performance tracking, where a firm systematically collects, analyzes, and communicates key performance indicators (KPIs). The absence of any easily collected and analytically useful
measures of firm performance is likely to indicate poor manage ment. A third example is promotion decisions. Promoting workers who are poor performers or simply because of their tenure in the firm is likely to lead to lower productivity than considering indi vidual performance when deciding whether to move an employee up the hierarchy.
If certain management practices are beneficial for produc tivity, why do all firms not immediately adopt them? There are static and dynamic reasons for this. On the static side, there are at least three reasons that an industry will not adopt best man
agerial practices, even in the long run?costs, agency considera tions, and industry heterogeneity. First, although a management practice may be beneficial for productivity, there are also costs to take into account. Upgrading management is a costly investment and some firms may simply find that these costs outweigh the benefits of moving to better practices. In other words, although
This content downloaded from 152.2.176.242 on Mon, 31 Mar 2014 10:41:04 AMAll use subject to JSTOR Terms and Conditions

MEASURING AND EXPLAINING MANAGEMENT PRACTICES 1357
improving management practices increase productivity, profits will not rise.
Second, bad practices may be attractive to managers because of the greater effort involved in moving to best practice. Agency considerations can drive a wedge between shareholder interest and management behavior, and there may not be a contractual solution to obtain optimal managerial effort to improve practices.
A large literature discusses the theoretical and empirical impor tance of managerial entrenchment, and we discuss why low prod uct market competition and the prevalence of family firms may make firm value maximization less likely.
A third reason that firms may not adopt best practice is sim
ple heterogeneity. The optimal level of practices may vary due to differential costs and/or benefits. For example, investing heavily in best practice "people management" through rigorous appraisals
will be less beneficial if workers are unskilled and quite homoge nous. In the results section we examine this idea by looking at how different types of people management practices vary system atically with skill intensity in the environment.
In a dynamic context, frictions will slow down the adoption of best management practice. Even if a new management practice were a purely technological innovation, we would expect it to take time to spread throughout the economy (recall the lean manu
facturing example). First, there may be learning effects, as infor mation about the new management practice diffuses only slowly across firms. Second, there are costs of adjustment that will mean that moving immediately to the best practice is unlikely to be op timal. One extreme form of adjustment costs is when only new entrants are able to implement the best practice, as incumbent firms keep to the same practices that were imprinted upon them
by their founding entrepreneurs (cf. Jovanovic [1982]). In this case, a selection mechanism will gradually allocate more produc tion to the new firms with better practices and away from the incumbents (e.g., Hoppenhayn [1992]). Selection is likely to be an
important way in which management practices spread, even in models where incumbents can learn to improve, as the learning process will still take time.
II.B. The Determinants of Management Practices:
Competition and Family Firms
We focus on product market competition and family firms as reasons for the distribution of management practices across firms and countries, as these have been the subject of much theoretical
This content downloaded from 152.2.176.242 on Mon, 31 Mar 2014 10:41:04 AMAll use subject to JSTOR Terms and Conditions

1358 QUARTERLY JOURNAL OF ECONOMICS
discussion and are important in our data. We investigated a large number of other possible factors that we discuss in the results section (e.g., corporate governance, labor unions, capital markets,
and job regulations). These appeared to be empirically less im
portant in the data than competition and family firms. This may be because the effects of these other factors are more subtle, and
given our current sample size, we are not able to statistically identify their effects. In 20,06 we conducted a second wave of the
survey, increasing the sample size almost fivefold, that will, we
hope, enable a more detailed future investigation of alternative influences on management practices.
Product Market Competition. The most obvious effect of com
petition on management is through a Darwinian selection process, as discussed in the dynamic "frictions" model of selection. Higher product market competition will drive inefficient firms out of the market and allocate greater market share to the more efficient firms. Syverson (2004a, 2004b) focuses on productivity and offers
supportive evidence for these predictions in his analysis of the US. cement industry, finding that tougher competition is associ ated with both a higher average level of productivity and a lower
dispersion of productivity, as the less efficient tail of firms have been selected out. Therefore, we expect a better average level (and a more compressed spread) of management practices in environ ments that are more competitive.
Competition could also affect the degree of managerial effort under agency cost models, although formally its impact is am
biguous. Higher competition can increase managerial effort, as the fear of bankruptcy is higher (Schmidt 1997). In addition, the
sensitivity of market share to marginal cost differences is greater under higher competition, so this increases the marginal return to
managerial effort. On the other hand, profit margins will be lower when competition is more intense, so the rewards of the profit related component of pay will also be lower, and this will tend to
depress managerial effort. Because of these offsetting influences, the effect of competition on effort cannot in general be signed. Recent contributions that allow for endogenous entry, however, tend to find that the pro-effort effect will dominate when within
market competition increases (say, from a fall in transport costs). This is because the fall in margins will mean that in equilib rium, firm size will increase, so a unit decrease in marginal costs
through greater managerial effort is more valuable (e.g., Raith
[2003]; Vives [2005]; Bloom and Van Reenen [2006]).
This content downloaded from 152.2.176.242 on Mon, 31 Mar 2014 10:41:04 AMAll use subject to JSTOR Terms and Conditions

MEASURING AND EXPLAINING MANAGEMENT PRACTICES 1359
Family Firms. The theoretical implications of family owner
ship depend on the extent of involvement in management. Fam
ily ownership per se may have advantages over dispersed own
ership because the (concentrated) ownership structure may lead to closer monitoring of managers (e.g., Berle and Means [1932]).6 Furthermore, under imperfect capital markets, founders will find it difficult to sell off the firm to outside investors (Caselli and
Gennaioli 2006). Moreover, when minority investor rights are not well protected, it may be difficult to diversify ownership, so family firms may be optimal in a second-best world (Burkart, Panunzi, and Shleifer 2003).
Even when a firm is family-owned, outside professional man
agers can be appointed to run the firm, as is common in Germany, for example (see Section VC). Combining family ownership with
family management has several potential costs. Selecting man
agers only from family members limits the pool of potential talent to run the firm, and there is less competition for senior positions. Furthermore, the knowledge that family members will receive
management positions in the future may generate a "Carnegie effect" of reducing their investment in human capital earlier in life. These selection and Carnegie effects are likely to be much
more negative for primogeniture family firms, in which the eldest son is destined to control the firm from birth. On the other hand, principal-agent problems may be mitigated by combining own
ership and control (e.g., in the model of Burkart, Panunzi, and Shleifer [2003]). There may also be investment in firm-specific human capital if the owners' children expect to inherit the family firm. So ultimately, the impact of family firms on management practices is an empirical matter.
Family-owned firms should have incentives to balance these factors optimally before deciding on using family or external man
agers. However, companies may choose family management even
though this is suboptimal for company performance because fam
ily members receive amenity value from managing the family firm, which often bears the family name and has been managed by several previous generations. In this case, the family may ac
cept lower economic returns from their capital in return for the
6. Bennedsen et al. (2007) list a range of additional potential benefits (and costs) of family ownership, although these are likely to be less important than those discussed in the main text. The benefits include working harder due to higher levels of shame from failure, trust and loyalty of key stakeholders, and business knowledge from having grown up close to the firm. The costs include potential conflicts between business norms and family traditions.
This content downloaded from 152.2.176.242 on Mon, 31 Mar 2014 10:41:04 AMAll use subject to JSTOR Terms and Conditions

1360 QUARTERLY JOURNAL OF ECONOMICS
private utility of managerial control. Indeed, the desire to retain
family management may also be a reason for the refusal of family owners to sell equity stakes in the company to outsiders.
The existing evidence on inherited family firms suggests that
family ownership has a mixed effect on firm profitability, but fam
ily management appears to have a substantially negative effect.7 Our approach in this paper is to examine the impact of family firms on management practices directly rather than only look at firm performance measures. Although there, may be some endo
geneity problems with the family-firms effect on management, these selection effects seem to cause OLS estimates to underesti
mate the damage of family involvement in management. This is because family firms are empirically more likely to involve pro fessional managers when the firm has suffered a negative shock (see Bennedsen et al. [2007] ).8
III. Measuring Management Practices
To investigate these issues, we first have to construct a robust measure of management practices that overcomes three hurdles:
scoring management practices, collecting accurate responses, and
obtaining interviews with managers. We discuss these issues in turn.
III.A. Scoring Management Practices
To measure management requires codifying the concept of
"good" or "bad" management into a measure applicable to different firms across the manufacturing sector. This is a hard task, as
good management is tough to define and is often contingent on a firm's environment. Our initial hypothesis was that while some
management practices are too contingent to be evaluated as "good" or "bad," others can potentially be defined in these terms, and it is these practices we tried to focus on in the survey. To do this we used a practice evaluation tool developed by a leading international
management consultancy firm. In order to prevent any perception of bias with our study we chose to receive no financial support from this firm.
7. See for example Perez-Gonzalez (2005) and Villalonga and Amit (2005). 8. Bennedsen et al. (2007) construct a dataset of more than 6,000 Danish
firms, including information on the gender of the first-born child, which they use as an instrumental variable for remaining under family management after a succession.
This content downloaded from 152.2.176.242 on Mon, 31 Mar 2014 10:41:04 AMAll use subject to JSTOR Terms and Conditions

MEASURING AND EXPLAINING MANAGEMENT PRACTICES 1361
The practice evaluation tool defines and scores from one
(worst practice) to five (best practice) across eighteen key man
agement practices used by industrial firms. In Appendix LA we detail the practices and the type of questions we asked in the same order as they appeared in the survey. In Appendix LB we
give four example practices, the associated questions and scoring system, and three anonymized responses per practice. Bloom and Van Reenen (2006) give examples that are more extensive across all eighteen practices.
These practices are grouped into four areas: operations (three
practices), monitoring (five practices), targets (five practices), and incentives (five practices). The shop-floor operations section fo cuses on the introduction of lean manufacturing techniques, the documentation of processes improvements, and the rationale be hind introductions of improvements. The monitoring section fo cuses on the tracking of performance of individuals, reviewing performance (e.g., through regular appraisals and job plans), and
consequence management (e.g., making sure that plans are kept and appropriate sanctions and rewards are in place). The targets section examines the type of targets (whether goals are simply financial or operational or more holistic), the realism of the tar
gets (stretching, unrealistic, or nonbinding), the transparency of
targets (simple or complex), and the range and interconnection of
targets (e.g., whether they are given consistently throughout the
organization). Finally, the incentives section includes promotion criteria (e.g., purely tenure-based or including an element linked to individual performance), pay and bonuses, and fixing or firing bad performers, where best practice is deemed the approach that
gives strong rewards to those with both ability and effort.. A subset of the practices has similarities to those used in studies on human resource management practices.
Since the scaling may vary across practices in the econometric
estimation, we convert the scores (from the one to five scale) to z-scores by normalizing by practice to mean zero and standard deviation one. In our main econometric specifications, we take the
unweighted average across all ^-scores as our primary measure of overall managerial practice, but we also experiment with other
weighting schemes based on factor analytic approaches. There is scope for legitimate disagreement over whether all
of these measures really constitute "good practice." Therefore, an important way to examine the external validity of the mea sures is to examine whether they are correlated with data on firm performance constructed from completely independent data
This content downloaded from 152.2.176.242 on Mon, 31 Mar 2014 10:41:04 AMAll use subject to JSTOR Terms and Conditions
1362 QUARTERLY JOURNAL OF ECONOMICS
sources?company accounts and the stock market. We do this in Section IV
III.B. Collecting Accurate Responses
With this evaluation tool, we can provide some quantification of firms' management practices. However, an important issue is the extent to which we can obtain unbiased responses from firms to our questions. In particular, will respondents provide accu rate responses? As is well known in the surveying literature (e.g., Bertrand and Mullainathan [2001]), a respondent's answer to sur
vey questions is typically biased by the scoring grid, anchored to ward those answers that the respondent expects the interviewer to think are correct. In addition, interviewers may themselves have
preconceptions about the performance of the firms they are inter
viewing and bias their scores based on their ex ante perceptions. More generally, a range of background characteristics, potentially correlated with good and bad managers, may generate some kinds of systematic bias in the survey data.
To try to address these issues, we took a range of steps to ob tain accurate data. First, the survey was conducted by telephone, without telling the managers they were being scored.9 This en abled scoring to be based on the interviewer's evaluation of the firm's actual practices, rather than its aspirations, the manager's perceptions, or the interviewer's impressions. To run this "blind"
scoring we used open questions (e.g., "can you tell me how you promote your employees?") rather than closed questions (e.g., "do
you promote your employees on tenure [yes/no]?"). Furthermore, these questions target actual practices and examples, with the discussion continuing until the interviewer can make an accurate assessment of the firm's typical practices based on these exam
ples. For each practice, the first question is broad, with detailed
follow-up questions to fine-tune the scoring. For example, in di mension (1), modern manufacturing introduction, the initial ques tion is "Can you tell me about your manufacturing process?" and is followed up by questions such as "How do you manage your inventory levels?"
Second, the interviewers did not know anything about the firm's financial information or performance in advance of the
9. This survey tool has been passed by Stanford's Human Subjects Committee. The deception involved was deemed acceptable because it (i) is necessary to get unbiased responses; (ii) is minimized to the management practice questions and temporary (we send managers debriefing packs afterward); and (iii) presents no risk, as the data are confidential.
This content downloaded from 152.2.176.242 on Mon, 31 Mar 2014 10:41:04 AMAll use subject to JSTOR Terms and Conditions
MEASURING AND EXPLAINING MANAGEMENT PRACTICES 1363
interview. This was achieved by selecting medium-sized manu
facturing firms and by providing only firm names and contact de tails to the interviewers (but no financial details). Consequently, the survey tool is "double blind"?managers do not know they are being scored and interviewers do not know the performance of the firm. The interviewers were incentivized on the number of interviews they ran and so had no interest in spending time
researching the companies in advance of running the interview. These medium-sized firms (the median size was 675 employees) would not be known by name and are rarely reported in the busi ness media. The interviewers were specially trained graduate stu dents from top European and U.S. business schools. All interviews were conducted in the manager's native language.
Third, each interviewer ran over 50 interviews on average, allowing us to remove interviewer fixed effects from all empirical specifications. This helps to address concerns over inconsistent
interpretation of categorical responses (see Manski [2004]), stan
dardizing the scoring system. Fourth, the survey instrument was targeted at plant man
agers, who are typically senior enough to have an overview of
management practices but not so senior as to be detached from
day-to-day operations of the enterprise. Fifth, we collected a detailed set of information on the in
terview process itself (number and type of prior contacts before
obtaining the interviews, duration, local time of day, date, and
day of the week), on the manager (gender, seniority, nationality, company and job tenure, internal and external employment ex
perience, and location), and on the interviewer (individual inter viewer fixed effects, time of day, and subjective reliability score). Some of these survey controls are significantly informative about the management score10 and help reduce residual variation.
III.C. Obtaining Interviews with Managers
Each interview took on average fifty minutes and was run in the summer of 2004 from the Centre for Economic Performance at the London School of Economics. Overall, we obtained a relatively high response rate of 54%, which was achieved through four steps.
10. In particular, we found that the scores were significantly higher for senior managers when interviews were conducted later in the week and/or earlier in the day. That is to say, scores were highest, on average, for senior managers on a Friday morning and lowest for junior managers on a Monday afternoon. By including information on these characteristics in our analysis, we explicitly controlled for these types of interview bias.
This content downloaded from 152.2.176.242 on Mon, 31 Mar 2014 10:41:04 AMAll use subject to JSTOR Terms and Conditions
1364 QUARTERLY JOURNAL OF ECONOMICS
First, the interview was introduced as "a piece of work"11 with out discussion of the firm's financial position or its company ac
counts, making it relatively noncontroversial for managers to par ticipate. Interviewers did not discuss financials in the interviews, both to maximize the participation of firms and to ensure that our interviewers were truly blind to the firm's financial position. Second, practices were ordered to lead with the least controver sial (shop-floor operations management) and finish with the most controversial (pay, promotions, and firings). Third, interviewers'
performance was monitored, as was the proportion of interviews
achieved, so they were persistent in chasing firms (the median number of contacts each interviewer made in setting up the inter view was 6.4). The questions are also about practices within the
firm, so that any plant managers can respond, so there were poten tially several managers per firm who could be contacted.12 Fourth, the written endorsement of the Bundesbank (in Germany) and the
Treasury (in the United Kingdom) and a scheduled presentation to the Banque de France helped demonstrate to managers that this was an important exercise with official support.
III.B. Sampling Frame and Additional Data
Since our aim is to compare across countries, we decided to focus on the manufacturing sector, where productivity is easier to measure than in the nonmanufacturing sector. We also focused on medium-sized firms, selecting a sample where employment ranged between 50 and 10,000 workers (with a median of 675).
Very small firms have few publicly available data. Very large firms are likely to be more heterogeneous across plants, and so it would be more difficult to get a picture of managerial perfor
mance in the firm as a whole from one or two plant interviews. We drew a sampling frame from each country to be representative of medium-sized manufacturing firms and then randomly chose the order of which firms to contact (see Appendix II for details).
We also excluded any clients of our partnering consultancy firm from our sampling frame. Since we used different databases in
Europe (Amadeus) and the United States (Compustat), we had concerns regarding the cross-country comparisons, so we include
11. We avoided using the words "research" or "survey," as many firms link these to market research surveys, which they usually refuse to be involved with.
12. We found no significant correlation between the number, type, and time span of contacts before an interview is conducted and the management score. This suggests that while different managers may respond differently to the interview proposition, this does not appear to be directly correlated with their responses or the average management practices of the firm.
This content downloaded from 152.2.176.242 on Mon, 31 Mar 2014 10:41:04 AMAll use subject to JSTOR Terms and Conditions

MEASURING AND EXPLAINING MANAGEMENT PRACTICES 1365
country dummies in all regression tables. The only exception is Table VI, where we are explicitly comparing the national aver
ages, and here (as elsewhere) we are careful to include controls for size and listing status.
In addition to the standard information on management prac tices, we also ran two other surveys with the same firm (details in Bloom and Van Reenen [2006]). First, we collected information from a separate telephone survey of the human resource depart ment on the average characteristics of workers and managers in the firm, such as gender, age, college degree, hours, holidays, sick
ness, occupational breakdown, and a range of questions on the
organizational structure of the firm and the work-life balance.
Second, we collected information from public data sources and another telephone survey in summer 2005 on family ownership, management, and succession procedures, typically answered by the CEO or his office. Quantitative information on firm sales, em
ployment, capital, materials, and so forth came from the company accounts and proxy statements, while industry level data came from the OECD. To control for industry heterogeneity, we con dition on a full set of three-digit industry dummies (105 in all). As a robustness check, we also considered the subsample where we have at least five sampled firms in every three-digit industry (582 firms from our main sample of 732 firms). All of the reported results are as strong, if not stronger, for this subsample.
Comparing the responding firms with those in the sampling frame, we found no evidence that the responders were systemati cally different from the nonresponders on any of the performance
measures. They were also statistically similar on all the other observables in our dataset. The only exception was size, where our firms were slightly larger on the average than those in the
sampling frame.
III.E. Evaluating and Controlling for Measurement Error
The data potentially suffer from several types of measure ment error that are likely to bias the association of firm per formance with management toward zero. First, we could have measurement error in the management practice scores obtained
using our survey tool. To quantify this, we performed repeat in terviews on 64 firms, contacting different managers in the firm, typically at different plants, using different interviewers. To the extent that our management measure is truly picking up general company-wide management practices, these two scores should be
This content downloaded from 152.2.176.242 on Mon, 31 Mar 2014 10:41:04 AMAll use subject to JSTOR Terms and Conditions

1366 QUARTERLY JOURNAL OF ECONOMICS
correlated, while to the extent that the measure is driven by noise, the measures should be independent.
The correlation of the first interviews with the second inter views was strongly positive (a correlation coefficient of .734 with a
p-value of .000). Furthermore, there is no obvious (or statistically significant) relationship between the degree of measurement er ror and the absolute score. That is, high and low scores appear to be as well measured as average scores, and firms that have
high (or low) scores on the first interview tend to have high (or low) scores on the second interview. Thus, firms that score below two or above four appear to be genuinely badly or well managed rather than extreme draws of sampling measurement error.
Analyzing the measurement error in more detail, we find that the practice level measures are noisier, with 42% of the variation in the scores due to measurement error, compared to the average firm's scores, with 25% of the variation due to measurement er ror. This improved the signal-noise ratio in the firm-level average measure?which is our primary management proxy?is due to the
partial averaging out of measurement errors across practices. The second type of measurement error concerns the fact that
our management practices cover only a subset of all manage ment practices that drive performance. For example, our inter views did not contain any questions on management strategy (such as pricing or merger and acquisition policies). However, so long as firms' capabilities across all management practices are positively correlated?which they are, significantly, within the eighteen practices examined?our measure based on a subset of practices will provide a proxy of the firm's true management capabilities.
IV Validating the Management Practice Data
Before we investigate the reasons for the spread of manage ment practices across firms, it is worth evaluating whether these
practices are correlated with firm performance. The purpose of this exercise is not to directly identify a causal relationship be tween our management practice measures and firm performance. It is rather an external validity test of the survey measurement tool to check that the scores are not just "cheap talk" but are ac
tually correlated with quantitative measures of firm performance from independent data sources on company accounts, survival
rates, and market value.
This content downloaded from 152.2.176.242 on Mon, 31 Mar 2014 10:41:04 AMAll use subject to JSTOR Terms and Conditions

MEASURING AND EXPLAINING MANAGEMENT PRACTICES 1367
IV.A. Econometric Modeling of Productivity
Consider the basic firm production function
(1) yf, = afft + alk\t + cfnn\t + ?cMf + y* % + u\t,
where Y = deflated sales, L = labor, K = capital, and N =
intermediate inputs (materials) of firm / at time t in country c
(we allow country-specific parameters on the inputs and in some
experiments the management scores) and lower case letters de note natural logarithms iy = ln(Y), etc.). The Zs are a number of other controls that will affect productivity, such as workforce characteristics13 (the proportion of workers with a college degree, the proportion with MBAs, and the average hours worked), firm characteristics (firm age and whether the firm is publicly listed on the stock market), and a complete set of three-digit industry dummies and country dummies.
The crucial variable for us is management practices, denoted M. Our basic measure takes 2-scores of each of the eighteen in dividual management practices and then averages over the vari ables to proxy M. We experimented with a number of other ap proaches, including using the primary factor from factor analysis and using the raw average management scores, and found very similar results.
The most straightforward approach to estimating equation (1) is to simply run OLS in the cross section (or on the panel with stan dard errors clustered by company) and assume that all the cor related heterogeneity is captured by the control variables. Since we have panel data, however, an alternative is to implement a
two-step method where we estimate the production function in
stage one, including fixed (or quasi-fixed) effects, and then calcu late total factor productivity using the parameter estimates. We then project the "long-run" component of productivity on the man
agement scores in a separate second step. This is the approach used by Black and Lynch (2001) in a similar two-step analysis of workplace practices and productivity. We estimate the produc tion function in a variety of ways. The simplest method is within
groups?that is, including a full set of firm dummies. We com
pared this to the Olley and Pakes (1996) estimator that allows
13. We experimented with a wide range of other workforce characteristics, such as gender, average worker age, and unionization. We only found measures of human capital to be statistically significant after controlling for firm characteris tics. The data set and Stata estimation code are available online.
This content downloaded from 152.2.176.242 on Mon, 31 Mar 2014 10:41:04 AMAll use subject to JSTOR Terms and Conditions

1368 QUARTERLY JOURNAL OF ECONOMICS
an unobserved firm-specific efficiency term to follow a first-order Markov process. Using the estimates of the production function
parameters from Olley and Pakes, we construct the firm-specific efficiency measures and relate these in a second stage to man
agement practices. Finally, we estimate using the "System GMM"
approach (Blundell and Bond 2000) that also allows for the en
dogeneity of all the time-varying inputs (i.e., capital, labor, and
materials).
IV.B. Econometric Results
Table I investigates the association between firm performance and management practices. Column (1) simply reports a level OLS
specification including only labor, country, and time dummies as
additional controls. The management score is strongly positively and significantly associated with higher labor productivity. The second column includes fixed capital and materials, and this al
most halves the management coefficient. In column (3), we include our general controls of industry dummies, average hours worked, education, firm age, and listing status. This reduces the manage ment coefficient slightly more, but it remains significant. Finally, in column (4), we include a set of interview noise controls to mit
igate biases across interviewers and types of interviewees. This
actually increases the management coefficient, as we would ex
pect if we were stripping out some of the measurement error in the management score. Overall, the first four columns suggest that the average management score is positively and significantly correlated with total factor productivity.
In column (5) we present one example of a more econometri
cally sophisticated production function estimate, based on the two
step method discussed above, where we recover the unobserved
long-run component of TFP and project this onto the management score and other covariates. We estimate the permanent component by the Olley-Pakes method. The results are as strong as those pre sented for the simple OLS regressions. The coefficient (standard error) on management was 0.071 (0.017) in a GMM version of column (5) of Table I and 0.080 (0.017) in a within-groups ver sion. Whether estimated by GMM, Olley-Pakes, or within groups,
management practices are always positively and significantly as sociated with the longer-run component of TFP.
We were concerned that the definition of good management may be biased toward an Anglo-Saxon view of the management world. Some may regard such business practices as suitable for Britain and America but less suitable for continental Europe.
This content downloaded from 152.2.176.242 on Mon, 31 Mar 2014 10:41:04 AMAll use subject to JSTOR Terms and Conditions
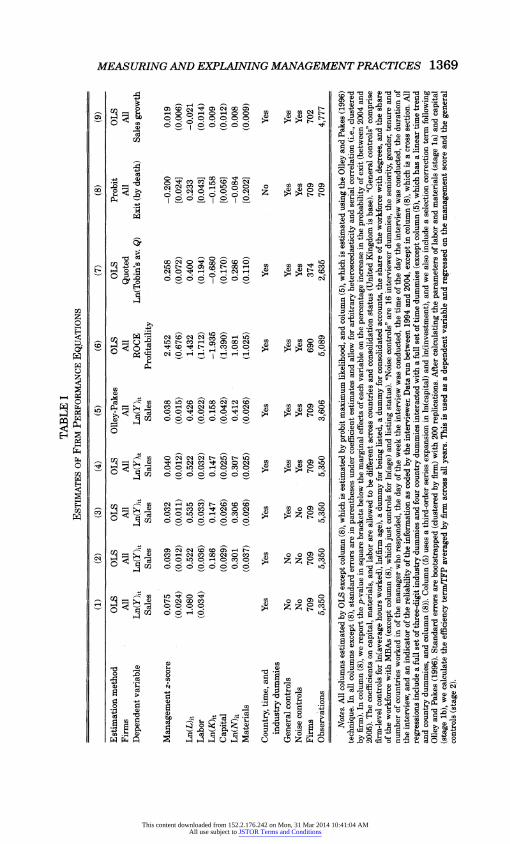
TABLE I Estimates of Firm Performance Equations
_(1)_(2)_(3)_(4)_(5)_(6)_(7)_(8) (9) ^ Estimation method OLS OLS OLS OLS Olley-Pakes OLS OLS Probit OLS
Eg Firms All All All All All All Quoted All All Co Dependent variable Ln(Y)it Ln(Y)it Ln(Y)it Ln(Y)it Ln(Y)it ROCE Ln(Tobin's av. Q) Exit (by death) Sales growth g Sales Sales Sales Sales Sales Profitability fa
? Management 2-score 0.075 0.039 0.032 0.040 0.038 2.452 0.258 -0.200 0.019
? (0.024) (0.012) (0.011) (0.012) (0.015) (0.676) (0.072) [0.024] (0.006) fe
Ln(L)it 1.080 0.522 0.535 0.522 0.426 1.432 0.400 0.233 -0.021 b Labor (0.034) (0.036) (0.033) (0.032) (0.022) (1.712) (0.194) [0.043] (0.014) feq LnODit 0.186 0.147 0.147 0.158 -1.935 -0.680 -0.158 0.009
^ Capital (0.029) (0.026) (0.025) (0.042) (1.390) (0.170) [0.056] (0.012)
? Ln(ADit 0.301 0.306 0.307 0.412 1.081 0.286 -0.084 0.008 g Materials (0.037) (0.026) (0.025) (0.026) (1.025) (0.110) [0.202] (0.009) ?
Country, time, and Yes Yes Yes Yes Yes Yes Yes No Yes Q
industry dummies ^ General controls No No Yes Yes Yes Yes Yes Yes Yes fe Noise controls No No No Yes Yes Yes Yes Yes Yes ?! Firms 709 709 709 709 709 690 374 709 702
g Observations 5,350 5,350 5,350 5,350 3,606 5,089 2,635 709 4,777 S -=-?-.-.?.-_-,-
I Notes. All columns estimated by OLS except column (8), which is estimated by probit maximum likelihood, and column (5), which is estimated using the Olley and Pakes (1996) ^J technique. In all columns except (8), standard errors are in parentheses under coefficient estimates and allow for arbitrary heteroscedasticity and serial correlation (i.e., clustered *S by firm). In column (8), we report the p-value in square brackets below the marginal effects of each variable on the percentage increase in the probability of exit (between 2004 and
|T3 2005). The coefficients on capital, materials, and labor are allowed to be different across countries and consolidation status (United Kingdom is base). "General controls" comprise r0 firm-level controls for ln(average hours worked), ln(firm age), a dummy for being listed, a dummy for consolidated accounts, the share of the workforce with degrees, and the share C of the workforce with MBAs (except column (8), which just controls for ln(age) and listing status). "Noise controls" are 16 interviewer dummies, the seniority, gender, tenure and k^ number of countries worked in of the manager who responded, the day of the week the interview was conducted, the time of the day the interview was conducted, the duration of fa the interview, and an indicator of the reliability of the information as coded by the interviewer. Data run between 1994 and 2004, except in column (8), which is a cross section. All ?q regressions include a full set of three-digit industry dummies and four country dummies interacted with a full set of time dummies (except column (5), which has a linear time trend Co and country dummies, and column (8)). Column (5) uses a third-order series expansion in ln(capital) and ln(investment), and we also include a selection correction term following Olley and Pakes (1996). Standard errors are bootstrapped (clustered by firm) with 200 replications. After calculating the parameters of labor and materials (stage la) and capital ?"j (stage lb), we calculate the efficiency term/TFP averaged by firm across all years. This is used as a dependent variable and regressed on the management score and the general ^ controls (stage 2). CO
This content downloaded from 152.2.176.242 on Mon, 31 Mar 2014 10:41:04 AMAll use subject to JSTOR Terms and Conditions

1370 QUARTERLY JOURNAL OF ECONOMICS
We empirically tested this by including interactions of the man
agement term with country dummies?we could not reject the
hypothesis that the coefficients on management were equal across
countries.14
In addition to the overall management score, we looked at the role that individual practices play. Rerunning column (4) of Table I, we find that thirteen of the practice z-scores are individ
ually significant at the 10% level or above, while five appear in
significant.15 The average practice-level point estimate is 0.023? about half the pooled average of 0.040?reflecting the higher practice-level measurement error. We also calculated the aver
age score separately for the four groups of management practices and entered them one at a time into the production function. The point estimates (standard errors) were as follows: operations 0.031 (0.010), monitoring 0.025 (0.010), targets 0.032 (0.010), and incentives 0.035 (0.012).16
We also considered whether the management measure was
simply proxying for better technology in the firm. Although tech
nology measures such as research and development (R&D) and
computer use are only available for subsamples of the dataset, we did not find that the management coefficient fell by very much in the production function when we included explicit mea sures of technology, as these are not strongly correlated with good
management.17 The final four columns of Table I examine four other measures
of firm performance. In column (6) we use an alternative perfor mance measure, which is return on capital employed (ROCE), a
14. For example, we generated a dummy for the two continental European countries and interacted this with the management score. When this was entered as an additional variable in the column (4) specification, the coefficient was 0.047 with a standard error of 0.031.
15. This suggests that not all eighteen of the individual management practices are associated with better performance. We could of course construct a "refined"
management measure by averaging over only the individually significant ques tions, but this becomes too close to crude data mining. Details of the regressions appear in Appendix I.C.
16. We also examined specifications with multiple questions or different groupings, but statistically the simple average was the best representation of the data. Part of the problem is that it is hard to reliably identify clusters of prac tices in the presence of measurement error. We show how subsets of management practices vary systematically in Section IVC.
17. In the context of the specification in Table I, column (4), for the 181 firms where we observe PCs per employee, the management coefficient is 0.084, with a standard error of 0.040 (the coefficient on PCs was 0.046, with a standard error of 0.025). This compares to a management coefficient of 0.088 with a standard error of 0.041 on the same sample when PCs are not included. For the sample of 216 firms where we have R&D information, the coefficient on management is 0.043, with a standard error of 0.017, in the specification with R&D and 0.046, with a standard error of 0.017, in the specification without R&D.
This content downloaded from 152.2.176.242 on Mon, 31 Mar 2014 10:41:04 AMAll use subject to JSTOR Terms and Conditions

MEASURING AND EXPLAINING MANAGEMENT PRACTICES 1371
profitability measure used by financial analysts and managers to benchmark firm performance (see Bertrand and Schoar [2003]). The significant and positive coefficient on management in the ROCE equation, which also includes the same set of controls as in column (4), confirms the basic productivity results. In column (7), we estimate a Tobin's Q specification (the ratio of the market value of the firm to its book value), which again includes the same set of controls as in the production function. We also find a significant and positive coefficient on management. In column (8), we esti mate the relationship between exit in the twelve months after the
survey and management practices. Over this period, eight firms went bankrupt, for which the implied marginal effects of manage ment in the probit equation are large and statistically significant. In column (9), we estimate the relationship between the aver
age annual growth rate of sales and management practices and
again find a positive arid significant coefficient on management. We also find a strong and positive correlation between firm size and management practices, which is consistent with the Lucas (1978) model.
The coefficients in the production function estimates are of
quantitative as well as statistical significance. Although we can not attribute causality to the management scores on productivity, a movement from the lower to the upper quartile of management scores between firms (0.972 points) is associated with an increase in productivity of between 3.2% (column (3)) and 7.5% (column (1)). Empirically the difference in TFP between the lower quartile and upper quartile of our firms is 32%. In a purely accounting sense, therefore, management scores explain between 10% and 23% of the interquartile range of productivity.
Overall, then, there is substantial evidence that the measures of management we use are positively and significantly associated with better firm performance. These results offer some external validation of the survey tool, implying that we are not simply measuring statistical noise.
IV. C. Contingent Management
In this subsection we present evidence that firms are choos
ing different "styles" of management systematically (cf. Athey and Stern [1998]). In particular, we hypothesize that firms in a high-skill environment may find good human-capital manage ment practices relatively more important than those in a low-skill environment (cf. Caroli and Van Reenen [2001]).
This content downloaded from 152.2.176.242 on Mon, 31 Mar 2014 10:41:04 AMAll use subject to JSTOR Terms and Conditions
13 72 QUARTERLY JOURNAL OF ECONOMICS
First, we investigated the impact of the weighting across indi vidual practices through factor analysis. There appeared to be one dominant factor that loaded heavily on all our practices?which could be labeled "good management"?that accounted for 48% of the variation.18 The only other notable factor, which accounted for a further 7% of the variation, could be labeled as "human capi tal management relative to fixed capital management;" it had a
positive loading on most of the human-capital-oriented practices and a negative loading on the fixed capital/shop-floor operations type of practices. This second factor was uncorrelated with any productivity measures, although interestingly it was significantly positively correlated with our skills measures (e.g., the proportion of employees with college degrees) and the level of worker auto
nomy,19 suggesting a slightly different pattern of relative manage ment practices across firms with different levels of human capital.
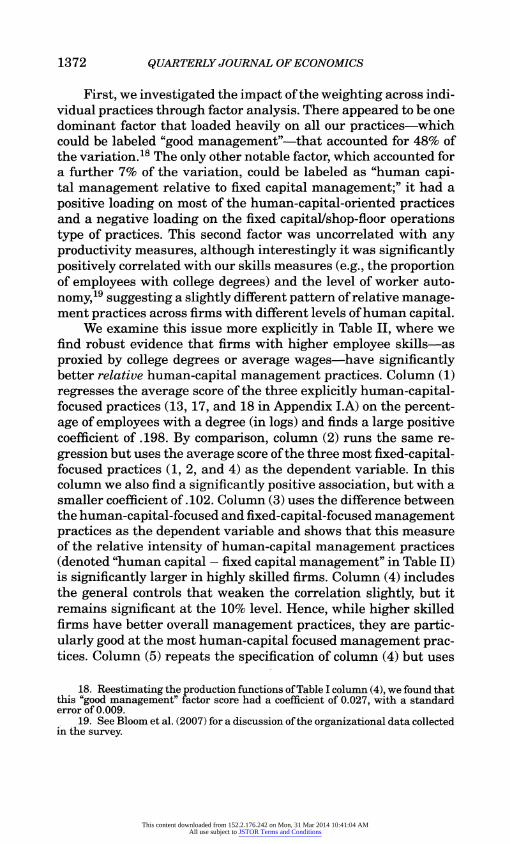
We examine this issue more explicitly in Table II, where we find robust evidence that firms with higher employee skills?as
proxied by college degrees or average wages?have significantly better relative human-capital management practices. Column (1) regresses the average score of the three explicitly human-capital focused practices (13, 17, and 18 in Appendix LA) on the percent age of employees with a degree (in logs) and finds a large positive coefficient of .198. By comparison, column (2) runs the same re
gression but uses the average score of the three most fixed-capital focused practices (1, 2, and 4) as the dependent variable. In this column we also find a significantly positive association, but with a smaller coefficient of .102. Column (3) uses the difference between the human-capital-focused and fixed-capital-focused management practices as the dependent variable and shows that this measure of the relative intensity of human-capital management practices (denoted "human capital
? fixed capital management" in Table II) is significantly larger in highly skilled firms. Column (4) includes the general controls that weaken the correlation slightly, but it remains significant at the 10% level. Hence, while higher skilled firms have better overall management practices, they are partic ularly good at the most human-capital focused management prac tices. Column (5) repeats the specification of column (4) but uses
18. Reestimating the production functions of Table I column (4), we found that this "good management" factor score had a coefficient of 0.027, with a standard error of 0.009.
19. See Bloom et al. (2007) for a discussion of the organizational data collected in the survey.
This content downloaded from 152.2.176.242 on Mon, 31 Mar 2014 10:41:04 AMAll use subject to JSTOR Terms and Conditions

TABLE II ? Skill-Contingent Management Practices S
(1) (2) (3) (4) (5) ?
Dependent variable Human capital Fixed capital Human capital - Human capital
- Human capital -
^ management management fixed capital fixed capital fixed capital ^
management management management 2
Ln(proportion of 0.198 0.102 0.096 0.099 ? employees with (0.043) (0.047) (0.049) (0.057) ? college degrees) ?
Ln(firm average 0.340 j? wages)it (0.168) fe
General controls No No No Yes Yes g Industry controls No No No Yes Yes g Firms/industries 732 732 732 732 424 S|
Notes. All columns estimated by OLS with robust standard errors in parentheses. A single cross section of data is used. "Human capital management" is the average z-score of the j three explicitly human-capital-focused practices (practices 13, 17, and 18 in Appendix LA). "Fixed capital management" is the average z-score of the three most fixed-capital-focused H3 practices (1, 2, and 4 in Appendix LA). "Human capital
- fixed capital management" is the difference of these two averages. "General controls" comprises controls for ln(firm age), ^ ln(average number of employees), a dummy for being listed, and a set of country dummies. "Industry controls" are a full set of three-digit industry dummies. ("^
1
CO <I CO
This content downloaded from 152.2.176.242 on Mon, 31 Mar 2014 10:41:04 AMAll use subject to JSTOR Terms and Conditions

1374 QUARTERLY JOURNAL OF ECONOMICS
average wages as an alternative measure of skill. We find a similar
pattern of more human-capital-focused management practices in firms with higher average wages.20 Overall, Table II is consistent with a model of management practices in which firms tailor their
practices to their environments.
TV.D. Firm-Performance-Related Measurement Bias
A criticism of our external validity test of looking at pro duction functions is that for psychological reasons managers will
respond optimistically in firms that are doing well even if the true state of management practices is poor. We label this phenomenon "firm-performance-related measurement bias."
There are several considerations mitigating the problem of
firm-performance-related measurement bias in our study. First, the survey is deliberately designed to try to minimize this kind of bias by using a double-blind methodology based on open questions using actual practices and examples to score the firm. So to the extent that managers talk about actual practices in their firms, this should help to reduce this measurement bias.
Second, psychological evidence (e.g., Schwarz and Strack
[1999]) suggests that recent improvements in a subject's condition are more likely to have an impact on survey responses than the ab solute level of a subject's condition. Therefore, if there were a large performance-related bias in the management scores, we would ex
pect this to show up in recent improvements in firm productivity (relative to comparators) having a big impact on managerial re
sponses. In fact, when we regress management scores against
lagged productivity growth rates, there is no significant correla tion. For example, a regression of management scores against the
lagged productivity growth rates over the previous year generated a coefficient (standard error) of 0.108 (0.150).21
20. We also used a three-digit industry-level measure of skills instead of a
firm-specific measure, the proportion of employees with a college degree in the United States based on data from the Current Population Survey. We found that this was also positively correlated with the relative intensity of human-capital
management practices. 21. We also tested this management and productivity growth relationship
over longer periods in a Table I, column (4) specification and found equally non
significant results. For example, when using the average of productivity growth in the last three years, we obtained a coefficient of 0.092 with a standard error of 0.197. The positive correlation of management with productivity levels and sales growth, but not with productivity growth, is consistent with a simple dynamic selection model. In such a model, management (and therefore productivity lev els) is fixed over time, and the market gradually allocates more sales to the more productive firms.
This content downloaded from 152.2.176.242 on Mon, 31 Mar 2014 10:41:04 AMAll use subject to JSTOR Terms and Conditions

MEASURING AND EXPLAINING MANAGEMENT PRACTICES 1375
Third, as we shall show below in Section V.B, firms in more
competitive industries?defined in terms of lower historical aver
age price-cost margins?are on average better managed. There
fore, at the industry level the correlation between management practices and historical average profitability goes in the reverse direction to that implied by this measurement bias story.
Finally, the appendixes in Bloom and Van Reenen (2006) re
port a further battery of robustness tests on this issue. For exam
ple, not all individual practices are significantly correlated with
performance, as shown in the final column of Appendix I.C. There
fore, to the extent that this bias is a serious phenomenon, it only seems to affect certain practices.
In conclusion, while there is undoubtedly scope for firm
performance-related measurement bias in the survey; we do not find evidence that this is a major problem in our results.
IV.E. Reverse Causality between Management Practices and Firm Performance
Recall that it was not possible to regard the coefficient on
management in Table I as a causal effect of management on firm
performance. Our estimated effects of the "true effect" of manage ment on productivity could be biased upward or downward due to reverse causality. For example, positive feedback could occur if higher productivity enabled cash-constrained firms to invest
more resources in improving managerial practices. This would bias our coefficient on management upward. Negative feedback could occur if higher performance generated free cash flow, en
abling managers to reduce their input of effort.22 This would bias the coefficient on management downward. We investigated, us
ing product market competition and family ownership as instru mental variables for management practices (see Bloom and Van Reenen [2006] for more details). For this to be valid we need to assume that the mechanism by which competition and primogeni ture family management impact on productivity is solely through improving managerial practices. Based on these admittedly very strong identification assumptions, we found that instrumental variable estimates of management were still significant at the 5% level and much larger in magnitude than the OLS coefficients (0.216 under I.V, compared to 0.042 under OLS).
22. Higher scoring practices involve more time and effort from managers on a range of monitoring and target practices, plus potentially more difficult decisions in incentive practices over hiring, firing, pay, and promotions.
This content downloaded from 152.2.176.242 on Mon, 31 Mar 2014 10:41:04 AMAll use subject to JSTOR Terms and Conditions

1376 QUARTERLY JOURNAL OF ECONOMICS
V. Accounting for the Distribution of Management Practices
V.A. The Distribution of Management Practices
Having confirmed that our management measures are infor
mative, we now proceed to examine the management scores di
rectly. Figure I shows the distribution of the average management scores per firm across all eighteen practices, plotted by country in raw form (not in z-score form). It is clear that there is a huge amount of heterogeneity within each country, with firms spread across most of the distribution. About 2% of the overall variation in firms' average management scores is across countries, 42% is across countries by three-digit industry, and the remaining 56% is within country and industry. This spread is particularly wide
when considered against the fact that a score of one indicates in
dustry worst practice and five industry best practice. Therefore, for example, firms scoring two or less have only basic shop-floor management, very limited monitoring of processes or people, in effective and inappropriate targets, and poor incentives and firing mechanisms. Thus, one of the central questions we address in the next section is how these firms survive.
Looking across countries, the United States has on average the highest scores (3.32), Germany is second (3.27), France third
(3.11), and the United Kingdom last (3.04), with the gaps between the United States, continental Europe (France and Germany), and the United Kingdom statistically significant at the 5% level. The
UK-US. gap also appears persistent over time. The Marshall Plan
productivity mission of 1947 reported that
efficient management was the most significant factor in the American advan
tage [over the United Kingdom].
(Dunning 1958, p. 120)
We were concerned that some of the apparent cross-country dif ferences in management scores might simply be driven by dif ferences in the sampling size distribution, but these figures are robust to controls for size and whether the firm is publicly listed (see Section V.B).
The presence of the United States at the top of the rank
ing is consistent with anecdotal evidence from other surveys.23 It also reflects the labor productivity rankings from other studies
23. For exahiple, Proudfoot Consulting (2003) regularly reports that U.S. firms were least hindered by poor management practices (36%) compared to firms in Australia, France, Germany, Spain, South Africa and the United Kingdom.
This content downloaded from 152.2.176.242 on Mon, 31 Mar 2014 10:41:04 AMAll use subject to JSTOR Terms and Conditions

MEASURING AND EXPLAINING MANAGEMENT PRACTICES 1377
comparing the four nations (the United States is at the top and the United Kingdom at the bottom). One might suspect that this
was due to an "Anglo-Saxon" bias?that is why, in the previous section, we had to confront the scores with data on productiv ity to show that the management scores are correlated with real outcomes within countries (see Table I). Furthermore, the posi tion of the United Kingdom as the country with the lowest av
erage management scores indicates that the survey instrument is not intrinsically Anglo-Saxon-biased. Appendix I.C provides
more details behind these cross-country comparisons and reveals a relative U.S. and UK strength in targets and incentives ver sus a German and French strength in shop-floor operations and
monitoring.
V.B. Management Practices and Product Market Competition
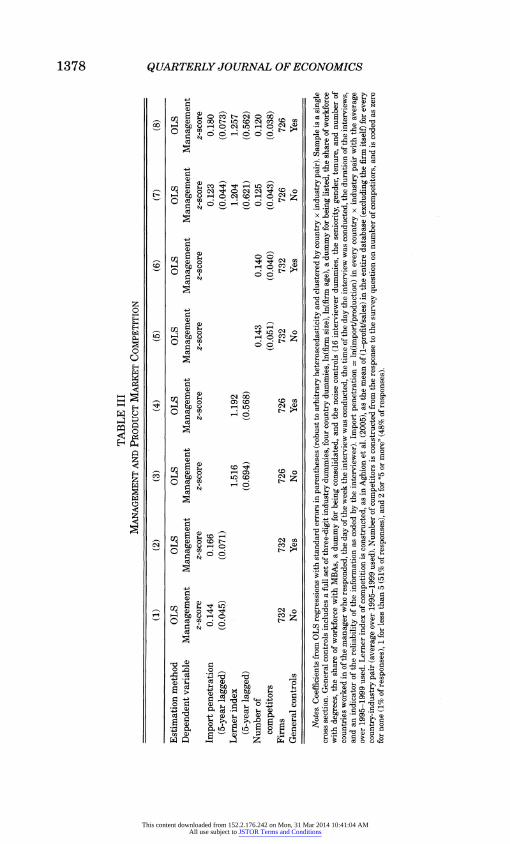
A common argument is that variations in management prac tice result from the differences in product market competition, because of selection effects and/or because of variations in the incentives to supply effort. Table III attempts to investigate this
by examining the relationship between product market compe tition and management. We use three broad measures of com
petition, following Nickell (1996) and Aghion et al. (2005). The first measure is the degree of import penetration, measured as the share of total imports relative to domestic production (spe cific to the country and the industry in which the firm operates). This is constructed for the period 1995-1999 to remove any po tential contemporaneous feedback.24 The second is the Lerner index of competition, which is (1 - profits/sales), calculated as the average across the entire firm population (excluding each firm itself). Again, this is constructed for the period 1995-1999 and is specific to the firm's country and three-digit industry. The third measure of competition is the survey question on the num ber of competitors a firm faces, valued zero for "no competitors,"
Unfortunately, these samples are drawn only from the consulting group's clients, so they suffer from serious selection bias.
24. This is measured at the ISIC-2 level, which is slightly more disaggregated than the U.S. SIC two-digit level. Melitz (2003) and others have suggested that trade exposure should truncate the lower part of the productivity distribution. We have also looked at (Imports + ExportsVProduction as an alternative indicator of trade exposure, with results similar to those reported here.
This content downloaded from 152.2.176.242 on Mon, 31 Mar 2014 10:41:04 AMAll use subject to JSTOR Terms and Conditions
h-1 CO
00
TABLE III Management and Product Market Competition
_(1)_(2)_(3) _(4)_(5)_(6)_(7)_(8) ^ Estimation method OLS OLS OLS OLS OLS OLS OLS OLS 5 Dependent variable Management Management Management Management Management Management Management Management ?q
z-score z-score z-score z-score z-score z-score z-score z-score jjj
Import penetration 0.144 0.166 0.123 0.180 ^ (5-year lagged) (0.045) (0.071) (0.044) (0.073) ^ Lerner index 1.516 1.192 1.204 1.257 q (5-year lagged) (0.694) (0.568) (0.621) (0.562) j*j Number of 0.143 0.140 0.125 0.120 ? competitors (0.051) (0.040) (0.043) (0.038) P
Firms 732 732 726 726 732 732 726 726 ?>
General controls No Yes No Yes No Yes No Yes kq =============^ o Notes. Coefficients from OLS regressions with standard errors in parentheses (robust to arbitrary heteroscedasticity and clustered by country x industry pair). Sample is a single ^ cross section. General controls includes a full set of three-digit industry dummies, four country dummies, ln(firm size), ln(firm age), a dummy for being listed, the share of workforce ^ with degrees, the share of workforce with MBAs, a dummy for being consolidated, and the noise controls (16 interviewer dummies, the seniority, gender, tenure, and number of ^ countries worked in of the manager who responded, the day of the week the interview was conducted, the time of the day the interview was conducted, the duration of the interviews, E^
and an indicator of the reliability of the information as coded by the interviewer). Import penetration = ln(import/production) in every country x industry pair with the average ?j over 1995-1999 used. Lerner index of competition is constructed, as in Aghion et al. (2005), as the mean of (1-profit/sales) in the entire database (excluding the firm itself) for every country-industry pair (average over 1995-1999 used). Number of competitors is constructed from the response to the survey question on number of competitors, and is coded as zero for none (1% of responses), 1 for less than 5 (51% of responses), and 2 for "5 or more" (48% of responses).
This content downloaded from 152.2.176.242 on Mon, 31 Mar 2014 10:41:04 AMAll use subject to JSTOR Terms and Conditions
MEASURING AND EXPLAINING MANAGEMENT PRACTICES 1379
one for "less than five competitors," and two for "five or more
competitors."25 In column (1) of Table III, we see that better management
scores are positively and significantly associated with greater im
port penetration. In column (2), we reestimate the same specifi cation but now include a full set of controls including country and
industry dummies, firm size, age, and listing status. We again find that higher lagged trade competition is significantly corre lated with better management. Thus, compared to other firms in the same country and industry, and after controlling for a range of firm-level characteristics, higher import penetration is signifi cantly associated with better management scores.26 In columns (3) and (4), we run two similar specifications on the lagged Lerner in dex of competition as an alternative competition measure and
again find a significant and positive effect. In columns (5) and
(6), we run two further similar specifications, but this time us
ing managers' own self-reported measure of the number of com
petitors they face, and again we find a positive and significant association: the more rivals a firm perceives it faces, the bet ter managed it appears to be. The final two columns include all three competition measures simultaneously. Although the statis tical significance and marginal effects are typically a bit lower, the same pattern of results persists. Across all columns, the conclusion
emerged that tougher product market competition is associated with significantly better management practices.
The magnitude of the competition effect on average manage ment scores is of economic as well as statistical significance. For
example, in column (6) of Table III, increasing the number of com
petitors from "few" to "many" is associated with a management 2-score increase of 0.140. As we will discuss later in Section V.I, this lack of competition accounts for a substantial proportion of the tail of badly performing firms and the management gap be tween the United States and Europe.
These are conditional correlations, of course, as we have no in strumental variable for competition. However, it is likely that any
25. This question has been used, inter alia, by Stewart (1990) and Nickell (1996). We obtained similar results using three separate dummies for high, low, and no competitors.
26. We also experimented with many other controls (results available on re quest). Union density was negatively correlated with management scores, but was insignificant. Although there was a significant negative correlation between man agement scores and average worker age in simple specifications, this disappeared when we controlled for firm age (older workers are more likely to be matched with older firms, and older firms on average were worse managed).
This content downloaded from 152.2.176.242 on Mon, 31 Mar 2014 10:41:04 AMAll use subject to JSTOR Terms and Conditions
1380 QUARTERLY JOURNAL OF ECONOMICS
endogeneity bias will cause us to underestimate the importance of product market competition for management. For example, in columns (3) and (4), an exogenous positive shock that raises man
agerial quality in an industry is likely to increase profitability and therefore lower the competition measure, based on the inverse Lerner index (indeed, Table I showed a positive correlation be tween management and individual firm-level profitability). This will make it harder for us to identify any positive impact of product market competition on management.27
The positive effect of competition on management practices could work through two possible mechanisms: (i) increasing man
agement scores through greater managerial effort and/or (ii) in
creasing the exit rate of badly managed firms relative to well
managed firms (see Section II). Using average managerial hours worked as a basic proxy for effort, we find an insignificant relation
ship between tougher competition and longer managerial hours.28 Of course, managerial hours are an imperfect proxy for manage rial effort, as managers may supply more effort by a greater "in
tensity" of work rather than longer hours. Still, it does suggest that the margin of impact of competition is not simply on the
length of the working day or week (see also Bloom, Kretschmer, and Van Reenen [2006] for further tests). Looking at the second
mechanism, we did find some weak evidence that greater prod uct market competition was associated with a reduction in the
dispersion of management practices (as suggested by Figure I and by Syverson [2004a, 2004b]). For example, if we regress the coefficient of variation of management practices (in an industry country pair) on our competition measures, there is a negative
marginal effect.29 This is suggestive of a selection model, where
competition drives out the worst-managed firms, but again the ev idence is weak, as the competition variables were not significant at
27. Similarly, better domestic management will reduce the degree of imports and enable the firm to pull away from other competitors and therefore faces fewer rivals. This will generate a bias toward zero on all the competition indicators in Table III.
28. We reestimated the specifications of Table III, columns (2), (4), and (6), using managerial hours as the dependent variable. The coefficients (standard errors) on import penetration, the Lerner index, and the number of competitors was 0.889 (0.752), -2.903 (5.664), and 0.892 (0.545), respectively. In the three regressions, one of the competition measures (the Lerner) is "incorrectly" signed and all are insignificant at the 5% level.
29. When imports were used, the coefficient was -0.043 with a standard error of 0.031, and when the Lerner index was used, the coefficient was -13.275 with a standard error of 8.943. These are estimated at the country-industry level, and we condition on having at least five firms per cell.
This content downloaded from 152.2.176.242 on Mon, 31 Mar 2014 10:41:04 AMAll use subject to JSTOR Terms and Conditions

MEASURING AND EXPLAINING MANAGEMENT PRACTICES 1381
TABLE IV Hereditary Family Firm Involvement by Country
% France Germany UK US.
Family largest shareholder 30 32 31 10
(of which) Family largest shareholder 19 11 23 7
and family CEO
(of which) Family largest shareholder, 14 3 15 3
family CEO, and primogeniture Founder largest shareholder 26 5 15 18
(of which) Founder largest shareholder 19 1 12 11
and CEO Number of firms 125 152 150 290
Notes. These mean values are taken from our sample of 717 firms. Family shareholding is combined across all family members. Family involvement is defined as second-generation family or beyond. Primogeniture is defined by a positive answer to the question "How was the management of the firm passed down: was it to the eldest son or by some other way?" Alternatives to primogeniture in frequency order are younger sons, sons-in-law, daughters, brothers, wives, and nephews. "Family largest shareholder" firms defined as those with a single family (combined across all family members, who are all second generation or beyond) as the largest shareholder; "family largest shareholder and family CEO" firms are those with additionally a family
member as the CEO; "family largest shareholder, family CEO, and primogeniture" with additionally the CEO selected as the eldest male child upon succession. See Appendix II for more details on construction of the variables.
conventional levels. In short, then, in samples of this size it is diffi cult to identify the precise mechanism through which competition has a positive effect on management practices.
V.C Management Practices and Family Firms
There has been much recent work on the efficiency of family firms. Family firms are the typical form of ownership and manage ment in the developing world and much of the developed world.30 As Table IV shows, family involvement is common in our sample. The largest shareholding block is a family (defined as the second
generation or beyond from the company's founder) in around 30% of European firms and 10% of American firms. This is similar in broad magnitude to the findings of La Porta, Lopez-de-Silanes, and Shleifer (1999), who report that about 40% of medium-sized firms were family-owned in Europe and about 10% were family owned in the United States.31 Interestingly, we see in the second
30. La Porta, Lopez-de-Silanes, and Shleifer (1999) and Morck, Wolfenzon, and Yeung (2005).
31. La Porta, Lopez-de-Silanes, and Shleifer (1999) define family "ownership" as controlling 20% or more of the equity; "medium-sized" as those with common
equity of just above $500 million; and "family" as including founder-owned firms. Including founder firms in our definition would increase family ownership to about 45% in Europe and 25% in the United States, higher than their numbers, although
This content downloaded from 152.2.176.242 on Mon, 31 Mar 2014 10:41:04 AMAll use subject to JSTOR Terms and Conditions

1382 QUARTERLY JOURNAL OF ECONOMICS
row that many of these firms have a family member as CEO, suggesting that families are reluctant to let professional man
agers run their firms. In the third row, we see that in the United
Kingdom and France around two-thirds of family-owned firms choose CEOs by primogeniture (succession to the eldest son), rep resenting around 15% of the total sample. In the United States this only occurs in about one-third of the family firms, represent ing 3% of all firms, and in Germany only 10% of family-owned firms have primogeniture. Consequently, only 3% of German and American firms have primogeniture in our sample, compared to 14% or 15% of French and British firms. In rows (4) and (5), we look at founder firms?those companies where the largest cur rent shareholder is the individual who founded the firm. We see that founder firms are also common in the United Kingdom and
France, as well as in the United States, although much less so in
Germany. One rationale for these differences in types of family involve
ment across countries is the historical tradition of feudalism, par ticularly in the Norman societies of the United Kingdom and France. This appears to have persisted long after the Norman
kingdoms collapsed, with primogeniture obligatory under English law until the Statute of Wills of 1540 and de facto in France until the introduction of the Napoleonic code in the early 1800s. German traditions were based more on the Teutonic principle of gavelkind (equal division amongst all sons). In the United States almost all the founding fathers were the younger sons of land-owning gentry, with primogeniture abolished after the Revolution ended British rule, so that equal treatment by birth order and gender was standard by the middle of the twentieth century (Menchik 1980). A second potential rationale for these differences is the structure of estate taxation, which for a typical medium-sized firm worth $10 million or more contains no substantial family firm ex
emptions in the United States, but gives about a 33%, 50%, and 100% exemption in France, Germany, and the United Kingdom, respectively.
In Table V, we investigate the relationship between firms'
management scores and family firms. Column (1) starts by re
gressing management scores against an indicator of the family as the single largest owner (defined on total family holdings)
our medium-sized firms are smaller. The main point to note is that family firms remain common in the OECD, particularly in continental Europe.
This content downloaded from 152.2.176.242 on Mon, 31 Mar 2014 10:41:04 AMAll use subject to JSTOR Terms and Conditions
MEASURING AND EXPLAINING MANAGEMENT PRACTICES 1383
plus the standard set of control variables. We see that family ownership per se does not seem to be associated with depressed firm performance with a positive but insignificant coefficient. In column (2), we regress management practices against an indica tor of family ownership and family management (defined by the CEO being a family member) and find that the coefficient becomes more negative but again is not significantly different from zero. In column (3), we include an indicator that the firm is family owned and family-managed with the CEO succession determined
by primogeniture?the current CEO is the eldest son. For these firms we see a strongly negative and significant coefficient, sug gesting that the subset of family firms that adopted primogeniture successions are substantially worse managed. In column (4), we
drop the general controls and show that the family firm correlation is much stronger in the unconditional regressions. In column (5),
we include all three indicators and see that it is the primogen iture family firms that are driving the negative coefficients. In
fact, family ownership per se has a positive association with good management. The final column drops the founder firms from the
sample so that external ownership is the omitted baseline, which makes little difference to the results. Taking Table V as a whole, it seems that the combination of family ownership and primogen iture family management significantly damages company perfor
mance.
One interpretation of this result is that being a primogeni ture company directly causes inferior performance in family firms due to the selection and Carnegie effects discussed in Section II. Another interpretation is that primogeniture is an indicator of firms being more generally backward, suggesting the persistence of "old-fashioned" management techniques. While this is possible, we do nevertheless find that primogeniture family firms are signif icantly worse managed even after including controls for firm age, average employee age, and CEO age.32 It is also difficult to see
why France and the United Kingdom should exogenously have a greater number of old-fashioned firms than Germany or the
32. Another interpretation on the poor management of family firms is that they operate less formally due to a lower return from "bureaucracy" (Novaes and Zingales 2004). The point-estimates (standard errors) for the column (3) specifica tion for individual management components are as follows: shop-floor operations, -0.434 (0.130); monitoring, -0.389 (0.117); targets, -0.242 (0.117); and incen tives, ?0.274 (0.096). So while there is some evidence for this in the particularly low monitoring scores for family firms, they still score significantly badly on other
management components such as shop-floor operations and incentives, which are not obviously linked to more formalized management styles.
This content downloaded from 152.2.176.242 on Mon, 31 Mar 2014 10:41:04 AMAll use subject to JSTOR Terms and Conditions

CO OO
TABLE V Management and Family Firms
(1) (2) (3) (4) (5) (6) - <o
Estimation method OLS OLS OLS OLS OLS OLS ? Sample All All All All All Family and W
external owners ^
Dependent variable Management Management Management Management Management Management f* 2-score z-score 2-score 2-score 2-score 2-score ^
Family largest 0.005 0.138 0.137 O shareholder (0.063) (0.086) (0.090) ?
Family largest shareholder -0.105 -0.010 -0.040 jg and family CEO (0.075) (0.113) (0.114) P
Family largest shareholder, -0.317 -0.590 -0.410 -0.379 ?
family CEO, and primogeniture (0.096) (0.098) (0.122) (0.128) fcq Firms 732 732 732 732 732 618 ? Country controls Yes Yes Yes Yes Yes Yes ? General controls Yes Yes Yes No Yes Yes ^ = I
Notes. Coefficients from OLS regressions with standard errors in parentheses (robust to arbitrary heteroscedasticity). The sample is a single cross section. In columns (1) to (5), the complete sample is used; in column (6), founder firms are dropped. "General controls" are a full set of three-digit industry dummies, ln(firm size), ln(firm age), a dummy for being listed, share of workforce with degrees, share of workforce with MBAs, a dummy for being consolidated, and the noise controls (16 interviewer dummies, the seniority, gender, tenure, and number of countries worked in of the manager who responded, the day of the week the interview was conducted, the time of day the interview was conducted, the duration of the interviews, and an indicator of the reliability of the information as coded by the interviewer).
This content downloaded from 152.2.176.242 on Mon, 31 Mar 2014 10:41:04 AMAll use subject to JSTOR Terms and Conditions
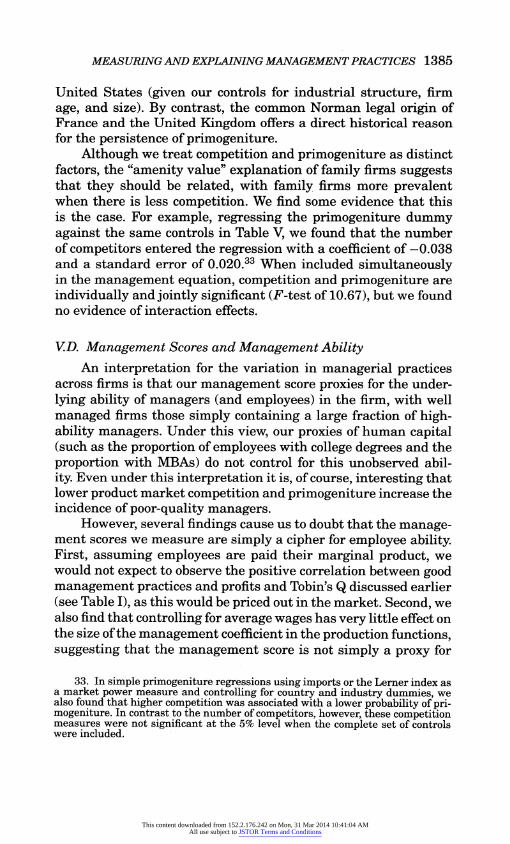
MEASURING AND EXPLAINING MANAGEMENT PRACTICES 1385
United States (given our controls for industrial structure, firm
age, and size). By contrast, the common Norman legal origin of France and the United Kingdom offers a direct historical reason for the persistence of primogeniture.
Although we treat competition and primogeniture as distinct
factors, the "amenity value" explanation of family firms suggests that they should be related, with family firms more prevalent when there is less competition. We find some evidence that this is the case. For example, regressing the primogeniture dummy against the same controls in Table V, we found that the number of competitors entered the regression with a coefficient of ?0.038 and a standard error of 0.020.33 When included simultaneously in the management equation, competition and primogeniture are
individually and jointly significant (F-test of 10.67), but we found no evidence of interaction effects.
V.D. Management Scores and Management Ability
An interpretation for the variation in managerial practices across firms is that our management score proxies for the under
lying ability of managers (and employees) in the firm, with well
managed firms those simply containing a large fraction of high ability managers. Under this view, our proxies of human capital (such as the proportion of employees with college degrees and the
proportion with MBAs) do not control for this unobserved abil
ity. Even under this interpretation it is, of course, interesting that lower product market competition and primogeniture increase the incidence of poor-quality managers.
However, several findings cause us to doubt that the manage ment scores we measure are simply a cipher for employee ability. First, assuming employees are paid their marginal product, we would not expect to observe the positive correlation between good management practices and profits and Tobin's Q discussed earlier (see Table I), as this would be priced out in the market. Second, we also find that controlling for average wages has very little effect on the size of the management coefficient in the production functions, suggesting that the management score is not simply a proxy for
33. In simple primogeniture regressions using imports or the Lerner index as a market power measure and controlling for country and industry dummies, we also found that higher competition was associated with a lower probability of pri mogeniture. In contrast to the number of competitors, however, these competition measures were not significant at the 5% level when the complete set of controls were included.
This content downloaded from 152.2.176.242 on Mon, 31 Mar 2014 10:41:04 AMAll use subject to JSTOR Terms and Conditions

1386 QUARTERLY JOURNAL OF ECONOMICS
unobserved employee ability.34 Finally, CEO pay (a proxy fbr top managerial ability) is not correlated with our management score once we control for firm size.35 Therefore, while managerial ability may account for some of the variation in management practices across firms, this is unlikely to explain all the observed variation. Our interpretation is that managerial practices are deeply em
bedded in the organizational capital of the firm, and this explains the higher productivity and profitability of well-managed firms. This organizational capital is greater than the sum of the parts of abilities and skills of the current employees.
VI. Explaining Management Practices across Firms and Countries: Quantification
We turn to quantifying the role of product market competition and primogeniture family firms in accounting for management practices.
VI.A. Explaining the Tail of Badly Managed Firms
One of the interesting features of the raw data is the sub stantial fraction of firms that appear to have surprisingly bad
management practices, with scores of two or less. These firms have only basic shop-floor management, very limited monitor
ing of processes or people, ineffective and inappropriate tar
gets, and poor incentives and firing mechanisms. Interestingly, most of the differences across countries highlighted in Figure I are due to the left tail36?the low UK and French average
34. When we include the ln(average wage of the firm) and its interactions with country dummies in a specification identical to that of column (4) in Table I, the
management coefficient is 0.049 with a standard error of 0.017. This compares to a management coefficient of 0.058 with a standard error of 0.020 without the wage terms on the same sample (we only have 430 firms for this regression, compared to the 732 in Table I, because wage data are not reported for some of the firms in the sample). The wage terms are positive and significant.
35. For example, regressing ln(CEO pay) on firm size, country dummies, in dustry dummies, and the management score, we find the coefficient (standard error) on the management score is 0.010 (0.045). Note that although CEO pay includes bonuses, it does not include share options.
36. We ran a Kolmogorov-Smirnov test of the equality of management score distributions between the United States and Germany versus the United Kingdom and France and found that this is rejected (p-value = .002) on the whole sample. If we test the equality of this distribution for management scores above two, this is not rejected (p-value
= .391). After truncating at two, the coefficients on the country dummies (standard errors) in a Table VI, column (1) specification with a
U.S. baseline fall to -0.015 (0.060) for Germany, -0.012 (0.078) for France, and -0.128 (0.070) for the United Kingdom, so that the U.S.-French gap is eliminated and the U.S.-UK gap falls by more than half.
This content downloaded from 152.2.176.242 on Mon, 31 Mar 2014 10:41:04 AMAll use subject to JSTOR Terms and Conditions

MEASURING AND EXPLAINING MANAGEMENT PRACTICES 1387
management scores are primarily due to long tails of badly man
aged firms. To investigate the extent to which low competition and pri
mogeniture family firms can account for this tail of badly run
firms, we split the sample based on these measures. Figure II
plots the management histogram for all firms reporting low
competition37 and/or primogeniture family succession, account
ing for 414 firms. Panel B of Figure II plots the management his
togram for the remaining high-competition and no-primogeniture succession, accounting for the remaining 308 firms. Comparing these two graphs, it is clear that the tail of badly managed firms is substantially larger in the low-competition and primo geniture sample, with 9.7% of firms scoring two or less, com
pared to 2.9% of firms in the high-competition no-primogeniture sample.38 Given that 7.0% of all firms in the sample scored two or less, controlling for competition and primogeniture succession
appears to remove over half of the tail of very badly managed firms.39
VLB. Explaining the Cross-Country Variation in Management Scores
In Table VI, we attempt to account for the variations in
management practices across countries. In column (1), we regress management on dummy variables for Germany, France, and the United Kingdom (with the United States omitted as the baseline
category). We find that UK and French firms are significantly worse managed than U.S. firms on average, with a gap of 0.276 and 0.202, respectively. German firms are worse managed than American firms, but not significantly so with a smaller gap
37. Defined by firms reporting "few" or "no" competitors. We use this measure to analyze cross-country competition because it is consistently measured across the sample. The Lerner index and import penetration measures may vary with accounting standards and country size respectively. In the regression results, we controlled for this with country dummies and identify from within country varia tion, but in this section we want to look explicitly across countries.
38. This split is also true in the U.S. and European subsamples. In the United States, 5.2% of firms score two or less in the low-competition and/or primogeniture group, while 0.6% score two or less in the high-competition non
primogeniture group. In Europe, 11.2% of firms score two or less in the low competition and/or primogeniture group, while 5.3% score two or less in the high competition/nonprimogeniture group.
39. Competition explains around two-thirds of this reduction in the tail. Con ditioning on "many" competitors alone takes the share of firms scoring two or less from 7.0% (in the whole sample) down to 4.2%.
This content downloaded from 152.2.176.242 on Mon, 31 Mar 2014 10:41:04 AMAll use subject to JSTOR Terms and Conditions

1388 QUARTERLY JOURNAL OF ECONOMICS
Panel A: Low competition and/or primogeniture family firms 01 _
.a
O I .""'".-"" (- """ " "" " ' >'* " " ""*' ? V^'" " ̂ ̂''" ' * " " * "> '(' ' "'- "'.-T
12 3 4 5 Management score
Panel B: High competition and nonprimogeniture family firms
cq _
co
oi,_1 iiii_ :':'-:' :>^.fi'-^ -.'?' 5 ';^: -^' V' '
12 3 4 5 Management score
Figure II
The Distribution of Management Scores Split by Production Market Competition and Family Firms
Notes: Panel A shows average management scores for the 414 firms which (i) report facing "few" or "no" competitors, and/or (ii) have a family (second generation or more) as the largest shareholder with a family CEO chosen by primogeniture. Split by country is France (95), Germany (101), UK (84) and the U.S. (134). Overall 9.7% of the sample score two or less. 1 indicates worst practice, 5 indicates best practice. Panel B shows average management scores for the 308 firms which report facing "many" competitors and do not have a family (second generation or more) as the largest shareholder with a family CEO chosen by primogeniture. Split by country is France (34), Germany (51), UK (67) and the U.S. (156). Overall 2.9% of the sample score two or less. 1 indicates worst practice, 5 indicates best practice.
of 0.045. In column (2) we include controls for firm size and stock market listing status, as we were concerned that the
cross-country differences might be driven by the fact that there are more smaller and unlisted firms in Europe than in the United
This content downloaded from 152.2.176.242 on Mon, 31 Mar 2014 10:41:04 AMAll use subject to JSTOR Terms and Conditions
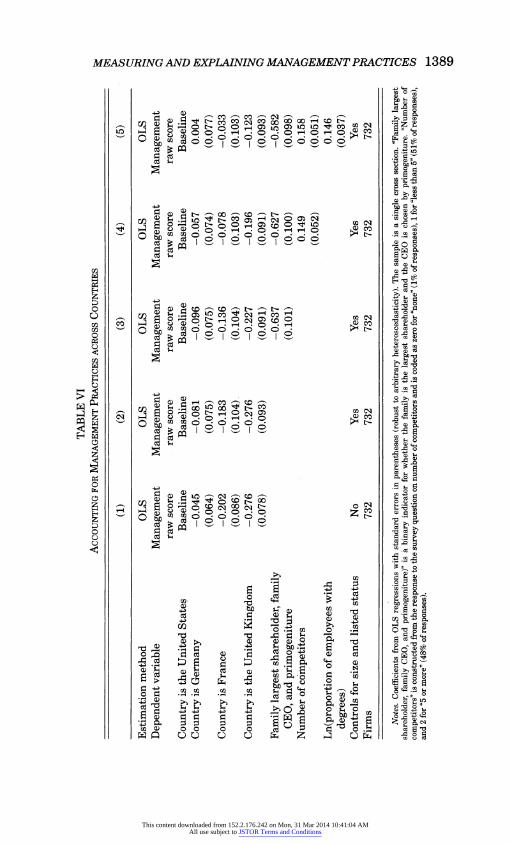
TABLE VI Accounting for Management Practices across Countries ^
============= ?
(1) (2) (3) (4) (5) g - g
Estimation method OLS OLS OLS OLS OLS 3 Dependent variable Management Management Management Management Management ?
raw score raw score raw score raw score raw score ^
Country is the United States Baseline Baseline Baseline Baseline Baseline Q Country is Germany -0.045 -0.081 -0.096 -0.057 0.004 tq
(0.064) (0.075) (0.075) (0.074) (0.077) ^ Country is France -0.202 -0.183 -0.136 -0.078 -0.033 P
(0.086) (0.104) (0.104) (0.103) (0.103) ? Country is the United Kingdom -0.276 -0.276 -0.227 -0.196 -0.123 ?!
(0.078) (0.093) (0.091) (0.091) (0.093) O
Family largest shareholder, family -0.637 -0.627 -0.582 S
CEO, and primogeniture (0.101) (0.100) (0.098) g Number of competitors 0.149 0.158 q
(0.052) (0.051) |
Ln(proportion of employees with 0.146 fcq
degrees) (0.037) ^ Controls for size and listed status No Yes Yes Yes Yes ^
Firms 732 732 732 732 732 ? a Notes. Coefficients from OLS regressions with standard errors in parentheses (robust to arbitrary heteroscedasticity). The sample is a single cross section. "Family largest C^
shareholder, family CEO, and primogeniture)" is a binary indicator for whether the family is the largest shareholder and the CEO is chosen by primogeniture. "Number of ?q competitors" is constructed from the response to the survey question on number of competitors and is coded as zero for "none" (1% of responses), 1 for "less than 5" (51% of responses), CO and 2 for "5 or more" (48% of responses).
CO 00 CD
This content downloaded from 152.2.176.242 on Mon, 31 Mar 2014 10:41:04 AMAll use subject to JSTOR Terms and Conditions
1390 QUARTERLY JOURNAL OF ECONOMICS
States. The similarity of the results to those in column (1) suggests that this is not the case.40
In column (3), we repeat the specification of column (2) but also include a dummy for a primogeniture family firm, whose coefficient is negative and significant at the 5% level, as ex
pected. The coefficients on the UK and French dummy variables
drop substantially, by around 0.05, reflecting the extensive pres ence of family firms with traditional primogeniture progression rules. In column (4), we condition on our measure of the num
ber of competitors faced by the firm. Consistent with the ear lier results of the competition variables, this enters the regres sion with a positive and significant coefficient. The coefficient on the UK dummy drops slightly, as the degree of competi tion is only marginally lower in the United Kingdom than in the United States. By contrast, the coefficients for France and
Germany drop by more, because the level of competition is re
ported to be lower by French or German companies than by U.S. firms. Together, competition and family firm status accounts for 57% (=100 x (0.183
- 0.078)/0.183) of the gap between the
United States and France and 29% (=100 x (0.276 -
0.196)/0.276) of the gap between the United States and the United Kingdom. In column (5), we add one final control, which is the propor tion of employees with a college degree, and find that this ac counts for much of the remaining UK and French gap with the
U.S.
Although we were expecting the competition results, the role of family firms is more surprising. The finding matches up with the earlier economic history literature of Landes (1969) and Chandler (1994), who claim that hereditary family management was probably the primary reason for the industrial decline of the United Kingdom and France relative to the United States and
40. We also considered a wide range of other checks on sampling differences. If we drop all firms with more than 1,500 workers, the mean sizes of U.S. and European firms are very similar (an average of 484 workers per firm in the United States and 504 in Europe). Rerunning column (2) on this sample gives, if any thing, stronger results: the United Kingdom has a score 0.41 points below the
United States, France is 0.32 below the United States, and Germany 0.26 points below (all these are differences are significant at the 5% level). Running the same
specification on just the listed firms also gives similar results, with the United Kingdom and France jointly significantly worse managed than American firms at the 10% level.
This content downloaded from 152.2.176.242 on Mon, 31 Mar 2014 10:41:04 AMAll use subject to JSTOR Terms and Conditions

MEASURING AND EXPLAINING MANAGEMENT PRACTICES 1391
Germany around the early 1900s.41 For example, Landes (1967) states that
The Britain of the late 19th century basked complacently in the sunset of economic hegemony. Now it was the turn of the third generation ... [and] the
weakness of British enterprise reflected their combination of amateurism and
complacency.
(p. 563)
Before the war the model [French] enterprise was family-owned and operated, security-orientated rather than risk-taking, technologically conservative and
economically inefficient.
(p. 528)
The results in Table VI suggest that family firms?at least in our sample of medium-sized manufacturing firms?are still a fac tor in explaining cross-country management practices one hun dred years later. And extrapolating from the 30% of firms under
family ownership in 2004 to the majority share they would have accounted for in the early twentieth century suggests that they could have played the dominant cross-country role in that period suggested by Landes and Chandler.
VII. Conclusions
In this paper we use an innovative survey tool to collect
management practice data from 732 medium-sized manufactur
ing firms in Europe and the United States. The methodology de scribed here combines the econometric advantages of large sample surveys with the measurement advantages of more detailed case
study interviews. We believe that it will be a useful part of the
empirical toolkit to be used by researchers interested in the in ternal organization of firms. Rather than simply label unobserved
heterogeneity "fixed effects," we have explicitly developed indica tors of managerial best practice.
In our application, we find that these measures of better
management practice are strongly associated with superior firm
performance in terms of productivity, profitability, Tobin's Q, sales growth, and survival. We also find significant variation across countries, with U.S. firms on average much better managed than European firms. There is, however, a much larger variation
41. Nicholas (1999) provides supporting evidence for the United Kingdom, showing that over this period, individuals who inherited family firms accumulated less lifetime wealth than either firm founders or professional managers.
This content downloaded from 152.2.176.242 on Mon, 31 Mar 2014 10:41:04 AMAll use subject to JSTOR Terms and Conditions

1392 QUARTERLY JOURNAL OF ECONOMICS
between firms within countries, with a long tail of extremely badly managed firms. This heterogeneity is consistent with what we know from the productivity distribution between firms and plants.
Why do so many firms exist with apparently inferior manage ment practices, and why does this vary so much across countries? We find that this is due to a combination of (i) low product mar ket competition, which appears to allow poor management prac tices to persist, and (ii) family firms passing management con trol down by primogeniture. European firms in our sample report facing lower levels of competition than U.S. firms. France and the United Kingdom also display substantially higher levels of
primogeniture, probably due to their Norman legal origin and traditions and more generous exemption from the estate taxa tion regime. Product market competition and family firms alone
appear to account for around half of the long tail of badly man
aged firms and between one-half (France) and one-third (United
Kingdom) of the European management gap with respect to the United States.
Our research design focuses on managerial practices from the employer perspective rather than the worker perspective. Do these "tough" management practices come at the expense of work intensification and a breakdown of reciprocity and job satisfaction in the workplace? In a companion paper (Bloom, Kretschmer, and
Van Reenen 2006), we show that our overall management score is strongly positively correlated with many pro-worker features of firms, such as more generous childcare subsidies and better work-life balance indicators. Although these indicators have no association with productivity conditional on management, it sug gests that workers may prefer working in well-managed firms.
A range of potential extensions to this work is in progress, including running a second survey wave. It is important to follow up these firms in order to examine the extent to which manage ment practice evolves over time. This will enable us to examine whether competition is working simply through selection or if there is learning of better managerial techniques by incumbent firms. The methodology of quantifying management is general enough to be applied (with modifications) to other countries and other sectors, including hospitals, schools, and the retail sector.
We are also developing this survey methodology to measure the
organizational structure and characteristics of firms and attempt ing to empirically test the long line of organizational theories of the firm.
This content downloaded from 152.2.176.242 on Mon, 31 Mar 2014 10:41:04 AMAll use subject to JSTOR Terms and Conditions

MEASURING AND EXPLAINING MANAGEMENT PRACTICES 1393
Appendix I: Details of the Survey Questionnaires
APPENDIX LA Full List of Management Practices with Examples of the Questions Asked
Practice
Practice number Practice type Example of questions we asked
Modern 1 Operations Can you describe the production
manufacturing, process for me?
introduction What kinds of lean (modern)
manufacturing processes have
you introduced?
Can you give me specific
examples? How do you manage inventory
levels? What is done to balance
the line?
Modern 2 Operations Can you talk through the
manufacturing, rationale to introduce these
rationale processes? What factors led to the adoption
of these lean (modern)
management practices? Process 3 Operations How do you go about improving
documentation the manufacturing process itself?
How do problems typically get
exposed and fixed? Talk me through the process for a
recent problem. Do the staff ever suggest process
improvements? Performance 4 Monitoring Tell me how you track production
tracking performance. What kind of key performance
indicators (KPIs) would you use
for performance tracking? How
frequently are these measured?
Who gets to see these KPI data?
If I were to walk through your
factory could I tell how you were doing against your KPIs?
Performance 5 Monitoring How do you review your KPIs?
review Tell me about a recent meeting. Who is involved in these
meetings? Who gets to see the results of this
review?
This content downloaded from 152.2.176.242 on Mon, 31 Mar 2014 10:41:04 AMAll use subject to JSTOR Terms and Conditions

1394 QUARTERLY JOURNAL OF ECONOMICS
APPENDIX LA (Continued)
Practice
Practice number Practice type Example of questions we asked
Performance 6 Monitoring How are these meetings
dialogue structured? Tell me about your most recent meeting.
During these meeting, how many useful data do you have?
How useful do you find problem
solving meetings? What type of feedback occurs in
these meetings?
Consequence 7 Monitoring What happens if there is a part of
management the business (or a manager) who isn't achieving agreed upon results? Can you give me a
recent example? What kind of consequences would
follow such an action?
Are there are any parts of the
business (or managers) that seem to repeatedly fail to carry out agreed actions?
Target breadth 8 Targets What types of targets are set for
the company? What are the
goals for your plant? Tell me about the financial and
nonfinancial goals? What do company headquarters
(CHQ) or their appropriate manager emphasize to you?
Target 9 Targets What is the motivation behind
interconnection your goals? How are these goals cascaded
down to the individual workers?
What are the goals of the top
management team (do they even know what they are?)?
How are your targets linked to
company performance and their
goals?
Target time 10 Targets What kind of time scale are you horizon looking at with your targets?
How are long-term goals linked to
short-term goals? Could you meet all your short-run
goals but miss your long-run
goals?
This content downloaded from 152.2.176.242 on Mon, 31 Mar 2014 10:41:04 AMAll use subject to JSTOR Terms and Conditions

MEASURING AND EXPLAINING MANAGEMENT PRACTICES 1395
APPENDIX LA (Continued)
Practice
Practice number Practice type Example of questions we asked
Targets are 11 Targets How tough are your targets? Do
stretching you feel pushed by them?
On average, how often would you
say that you meet your targets? Are there any targets that are
obviously too easy (will always be met) or too hard (will never
be met)? Do you feel that on targets all
groups receive the same degree of difficulty?
Do some groups get easy targets? Performance 12 Monitoring What are your targets (i.e., do
clarity and they know them exactly)? Tell
comparability me about them in full.
Does everyone know their
targets? Does anyone complain that the targets are too
complex? How do people know about their
own performance compared to
other people's performance?
Managing human 13 Targets Do senior managers discuss
capital attracting and developing talented people?
Do senior managers get any rewards for bringing in and
keeping talented
people in the company? Can you tell me about the
talented people you have
developed within your team?
Did you get any rewards for
this? Rewarding high 14 Incentives How does your appraisal system
performance work? Tell me about the most
recent round?
How does the bonus system work?
Are there any nonfinancial
rewards for top performers?
This content downloaded from 152.2.176.242 on Mon, 31 Mar 2014 10:41:04 AMAll use subject to JSTOR Terms and Conditions

1396 QUARTERLY JOURNAL OF ECONOMICS
APPENDIX LA (Continued)
Practice
Practice number Practice type Example of questions we asked
Removing poor 15 Incentives If you had a worker who could not
performers do his job what would you do?
Could you give me a recent
example? How long would underperformance
be tolerated?
Do you find any workers who lead a
sort of charmed life? Do some
individuals always just manage to avoid being fixed/fired?
Promoting high 16 Incentives Can you rise up the company
performers rapidly if you are really good? Are there any examples you can
think of? What about underperformers?do
they get promoted more slowly? Are there any examples you can
think of? How would you identify and
develop (i.e., train) your star
performers? If two people both joined the
company five years ago and one
was much better than the other, would he/she be promoted faster?
Attracting 17 Incentives What makes it distinctive to work human capital at your company as opposed to
your competitors? If you were trying to sell your firm
to me how would you do this (get them to try to do this)?
What don't people like about
working in your firm?
Retaining human 18 Incentives If you had a star performer who
capital wanted to leave what would the
company do?
Could you give me an example of a
star performers being persuaded to stay after wanting to leave?
Could you give me an example of a
star performer who left the
company without anyone trying to keep them?
Note. Scoring guide provided in Appendix LB.
This content downloaded from 152.2.176.242 on Mon, 31 Mar 2014 10:41:04 AMAll use subject to JSTOR Terms and Conditions

APPENDIX LB g Management Practice Interview Scoring Guide and Example Responses for 4 of the 18 Practices r5 -
| Practice 3: Process problem documentation (operations) ?
Score 1 Score 3 Score 5 ^ Scoring grid: No process improvements are made Improvements are made in weekly Exposing problems in a structured
<j when problems occur. workshops involving all staff, to way is integral to individuals' ^
improve performance in their area responsibilities, and resolution H
of the plant occurs as a part of normal fa
business processes rather than by ?
extraordinary effort/teams fa
Examples: A U.S. firm has no formal or informal A US. firm takes suggestions via an The employees of a German firm Q mechanism in place for either anonymous box; they then review constantly analyze the production fe|
process documentation or these each week in their section process as part of their normal ^
improvement. The manager meeting and decide on any that duty. They film critical production ^ admitted that production takes they would like to proceed with. steps to analyze areas more tq
place in an environment where thoroughly. Every problem is 5
nothing has been done to encourage registered in a special database ^ or support process innovation. that monitors critical processes, k^
and each issue must be reviewed g
and signed off by a manager. O
1 Co
CO CO
This content downloaded from 152.2.176.242 on Mon, 31 Mar 2014 10:41:04 AMAll use subject to JSTOR Terms and Conditions

M CO CD
APPENDIX LB ??
(Continued)
Practice 4: Performance tracking (monitoring) Score 1 Score 3 Score 5
Scoring grid: Measures tracked do not indicate Most key performance indicators are Performance is continuously tracked ^
directly if overall business tracked formally. Tracking is and communicated, both formally j?> objectives are being met. Tracking overseen by senior management. and informally, to all staff using a k^ is an ad hoc process (certain range of visual management tools.
gj processes aren't tracked at all) S
Examples: A manager of a U.S. firm tracks a At a U.S. firm every product is A U.S. firm has screens in view of <^
range of measures when he does bar-coded and performance every line. These screens are used 2 not think that output is sufficient. indicators are tracked throughout to display progress to daily target 3 He last requested these reports the production process; however, and other performance indicators.
g about 8 months ago and had them this information is not The manager meets with the shop :T
printed for a week until output communicated to workers. floor every morning to discuss the ^ increased again. Then he stopped day past and the one ahead and ^ and has not requested anything uses monthly company meetings to O
since. present a larger view of the goals to g date and strategic direction of the ? business to employees. He even O
stamps canteen napkins with key
performance achievements to
ensure everyone is aware of a
target that has been hit.
This content downloaded from 152.2.176.242 on Mon, 31 Mar 2014 10:41:04 AMAll use subject to JSTOR Terms and Conditions

! APPENDIX LB ?
(Continued) fa - S
Practice 11: Targets are stretching (targets) fe Score 1 Score 3 Score 5 b
Scoring grid: Goals are either too easy or In most areas, top management Goals are genuinely demanding for S
impossible to achieve; managers pushes for aggressive goals based all divisions. They are grounded in ro
provide low estimates to ensure on solid economic rationale. There solid economic rationale. ^
easy goals. are a few "sacred cows" that are not ^
held to the same rigorous standard. ?
Examples: A French firm uses easy targets to A chemicals firm has two divisions, A manager of a UK firm insisted that ^ improve staff morale and producing special chemicals for he has to set aggressive and k.
encourage people. They find it very different markets (military, demanding goals for g difficult to set harder goals because civil). Easier levels of targets are everyone?even security. If they hit
g people just give up and managers requested from the founding and all their targets he worries that he
^ refuse to work people harder. more prestigious military division. has not stretched them enough. &
Each KPI is linked to the overall >s business plan. Sj
O
I to
h-1 CO CO CD
This content downloaded from 152.2.176.242 on Mon, 31 Mar 2014 10:41:04 AMAll use subject to JSTOR Terms and Conditions

o o
APPENDIX LB (Continued)
Practice 16: Promoting high performers (incentives) *g Score 1 Score 3 Score 5 ^
Scoring grid: People are promoted primarily upon People are promoted upon the basis of We actively identify, develop, and ^ the basis of tenure. performance. promote our top performers. ?
Examples: A UK firm promotes based on an A U.S. firm has no formal training At a UK firm each employee is given &
individual's commitment to the program. People learn on the job a red light (not performing), an ^
company measured by experience. and are promoted based on their amber light (doing well and q Hence, almost all employees move performance on the job. meeting targets), a green light Sj up the firm in lock step. (consistently meeting targets, very ?> Management was afraid to change high performer), or a blue light ~ this process because it would create (high performer capable of ^ bad feeling among the older promotion by up to two levels).
?j employees, who were resistant to Each manager is assessed every Q change. quarter based on his succession g
plans and development plans for ^
individuals. P Co
Notes. Any score from 1 to 5 can be given, but the scoring guide and examples are only provided for scores of 1, 3, and 5. Multiple questions are used for each dimension to improve scoring accuracy. The full set of scoring and examples can be found in Bloom and Van Reenen (2006). The survey software is available on http://www.stanford.edu/~n.bloom/
This content downloaded from 152.2.176.242 on Mon, 31 Mar 2014 10:41:04 AMAll use subject to JSTOR Terms and Conditions

MEASURING AND EXPLAINING MANAGEMENT PRACTICES 1401
APPENDIX I.C Practice Level Averages by Country
Average value by country Regression (US. = 100) coefficients
Practice _ -
number (1) (2) (3) (4)
Practice name UK Germany France All Modern manufacturing, 1 90.2 86.2 101.1 0.013
introduction (3.50) (3.46) (3.63) (0.011) Modern manufacturing, 2 93.1 101.4 101 0.012
rationale (3.35) (3.31) (3.47) (0.011) Process documentation 3 89.2 106.8 99.4 0.044***
(3.51) (3.47) (3.64) (0.012) Performance tracking 4 98.4 109.1 110.7 0.020*
(3.2) (3.16) (3.32) (0.012) Performance review 5 94.6 109.7 104.3 0.020*
(2.99) (2.96) (3.11) (0.012) Performance dialogue 6 92.8 103 99.2 0.024**
(3.18) (3.09) (3.26) (0.013) Consequence management 7 96.4 108.6 93.5 0.027**
(3.02) (3) (3.14) (0.013) Target breadth 8 91.4 93 94 0.020*
(3.53) (3.49) (3.66) (0.012) Target interconnection 9 94 97.3 77.8 0.035**
(3.55) (3.51) (3.68) (0.014) Target time horizon 10 92.1 98.9 91.8 0.032***
(3.7) (3.66) (3.84) (0.012) Targets are stretching 11 88.1 104.8 101.4 0.022*
(3.33) (3.3) (3.45) (0.012) Performance clarity and 12 93.4 80.5 82.7 0.008
comparability (3.53) (3.48) (3.65) (0.012) Managing human capital 13 89.3 98.5 89 0.043**
(3.94) (3.91) (4.09) (0.013) Rewarding high performance 14 81.7 84.9 85 0.024**
(3.41) (3.39) (3.54) (0.011) Removing poor performers 15 89.5 92.5 83 0.016
(3.04) (3.01) (3.15) (0.012) Promoting high performers 16 90.3 104.7 92.1 0.031**
(2.86) (2.83) (2.97) (0.012) Attracting human capital 17 90.5 94.8 85.2 0.032***
(2.9) (2.87) (3) (0.012) Retaining human capital 18 93.5 97.5 96.6 0.004
(2.75) (2.72) (2.84) (0.012) Unweighted average 91.7 98.6 9(3.9 0.023
Notes. In columns (1) to (3) each practice is benchmarked against the average U.S. score (U.S. = 100). In columns (1) to (3) the standard deviation of each practice's average response is reported below in brackets. Calculated from full sample of 732 firms. Management z-scores used in these calculations. In column (4) results are given from 18 OLS estimations following exactly the same specification as column (4), Table I, except estimated with each individual practice z-score one by one rather than the average management z score. So every cell in column (4) is from a different regression, where standard errors in parentheses allow for arbitrary heteroscedasticity and correlation (clustered by firm), and regression includes "general controls" as detailed in Table I. *** denotes that the variable is significant at the 1% level,
** denotes 5% significance, and * denotes 10% significance.
This content downloaded from 152.2.176.242 on Mon, 31 Mar 2014 10:41:04 AMAll use subject to JSTOR Terms and Conditions

1402 QUARTERLY JOURNAL OF ECONOMICS
Appendix II: Data
The entire anonymized dataset, with a full set of do-files
generating all results in this paper, is available online at
www-econ.stanford.edu/faculty/bloom.html and http://cep.lse.ac. uk/people/bio.asp?id=1358.
II.A. Sampling Frame Construction
Our sampling frame was based on the Amadeus dataset for
Europe (United Kingdom, France, and Germany) and the Com
pustat dataset for the United States. These all have information on company accounting data. We chose firms whose principal in dustries were in manufacturing and that employed (on average between 2000 and 2003) no less than 50 employees and no more
than 10,000 employees. We also removed any clients of the con
sultancy firm we worked with from the sampling frame (33 out of
1,353 firms). Our sampling frame is reasonably representative of medium
sized manufacturing firms. The European firms in Amadeus in clude both private and public firms, whereas Compustat includes
only publicly listed firms. There is no U.S. database of privately listed firms with information on sales, labor, and capital. Fortu
nately, a much larger proportion of firms are listed on the stock
exchange in the United States than in Europe, so we are able to go far down the size distribution using Compustat. Nevertheless, the U.S. firms in our sample are slightly larger than those of the other
countries, so we are always careful to control for size and public listing in the analyses. Furthermore, when estimating production functions, we allow all coefficients to be different on labor, capital, materials, and consolidation status in each country (see notes to Table I).
Another concern is that we condition on firms where we have information on sales, employment, and capital. These items are not compulsory for firms below certain size thresholds, so disclo sure is voluntary to some extent for the smaller firms. By design, the firms in our sampling frame (over 50 workers) are past this threshold for voluntary disclosure (the only exception is for capital in Germany).
We achieved a response rate of 54% from the firms that we
contacted, a very high success rate given the voluntary nature of
participation. Respondents were not significantly more productive
This content downloaded from 152.2.176.242 on Mon, 31 Mar 2014 10:41:04 AMAll use subject to JSTOR Terms and Conditions

MEASURING AND EXPLAINING MANAGEMENT PRACTICES 1403
than nonresponders. French firms were slightly less likely to re
spond than firms in the other three countries, and all respon dents were significantly larger than nonrespondents. Apart from these two factors, respondents seemed randomly spread around our sampling frame.
II.B. Firm-Level Data
The collection of the management data and human resource data is described in the text and in Bloom and Van Reenen (2006). Our firm accounting data on sales, employment, capi tal, profits, shareholder equity, long-term debt, market values (for quoted firms), and wages (where available) came from Amadeus
(France, Germany, and the United Kingdom) and Compustat (United States). For other data fields we did the following:
Materials. In France and Germany, these are line items in the accounts. In the United Kingdom, they were constructed by de
ducting the total wage bill from the cost of goods sold. In the United States, they were constructed following the method in
Bresnahan, Brynjolfsson, and Hitt (2002). We start with costs of
good sold (COGS) less depreciation (DP) less labor costs (XLR). For firms that do not report labor expenses expenditures, we use average wages and benefits at the four-digit industry level
(Bartelsman, Becker, and Gray [2000] until 1996 and then census
average production worker annual payroll by four-digit NAICS code) and multiply this by the firm's reported employment level. This constructed measure is highly correlated at the industry level with materials. Obviously there may be problems with this mea sure of materials (and therefore value added), which is why we check the robustness of the Table I estimates to measures with out materials.
Company Shareholdings. This was manually extracted from the Bloomberg online data service for the ten largest shareholders and the ten largest insider shareholders.
Dates of Incorporation (Age). For UK, French, and German
companies, these are provided by Amadeus datasets. For the United States, they were obtained from Dunn and Bradstreet.
Family Ownership Data. The ownership data, directors'
data, shareholder information, and family generation were col lected from company SEC filings (particularly the DEF14a), com
pany databases (Compustat and ICARUS in the United States; Amadeus in the United Kingdom, France, and Germany), com
pany Web sites, The International Directory of Company Histories
This content downloaded from 152.2.176.242 on Mon, 31 Mar 2014 10:41:04 AMAll use subject to JSTOR Terms and Conditions

1404 QUARTERLY JOURNAL OF ECONOMICS
(St. James Press), and Moody's Manuals (Moody's Investor Ser
vice). When these data were missing or ambiguous, they were sup plemented with information from the family firm telephone sur
vey, which was run on around 300 firms in the sample that were
(or potentially were) family-owned. This allowed us to separate firms into the three family firm categories: "family largest share
holder," "family largest shareholder and family CEO," and "fam
ily largest shareholder, family CEO, and primogeniture." "Family largest shareholder" firms were defined as those with a single family (combined across all family members, who are all second
generation or beyond) as the largest shareholder; "family largest shareholder and family CEO" firms are defined as the subset of
"family largest shareholder" firms where the CEO was a family member. Finally, "family largest shareholder, family CEO, and pri mogeniture" were the subset of "family largest shareholder and
family CEO" firms where the eldest male child was selected as the CEO upon succession. In the regressions of Table V, column (5), the omitted baseline category includes founder firms (114 obser
vations), institutionally owned firms (including banks, pension funds, insurance companies, and private equity?336 observa
tions), manager-owned firms (21 observations), private nonexecu tive individually owned firms (59 observations), and others (such as charities, cooperatives and foundations?41 observations). We
experiment with dropping the founder firms in column (6) of Table V.
CEO Pay and Age. In the United States, the S&P 1500
largest firms (which cover all sectors) are contained in Execu
comp, which provided data for the 106 largest of our U.S. firms. For the remaining firms, we manually downloaded the Defl4a proxy statements from the SEC to extract the details of the CEO com
pensation package and age over the last three accounting years. In the United Kingdom, the highest-paid director is a mandatory line item in the accounts, and we took this as the CEO's salary. In France and Germany we have no data on executive pay.
II.C Industries and Industry-Level Data
Our basic industry code is the U.S. SIC (1987) three-digit level, which is our common industry definition in all four coun tries. We allocate each firm to its main three-digit sector (based on sales). For the 732 firms in the sample, we have 105 unique three-digit industries. There are at least two sampled firms in
This content downloaded from 152.2.176.242 on Mon, 31 Mar 2014 10:41:04 AMAll use subject to JSTOR Terms and Conditions
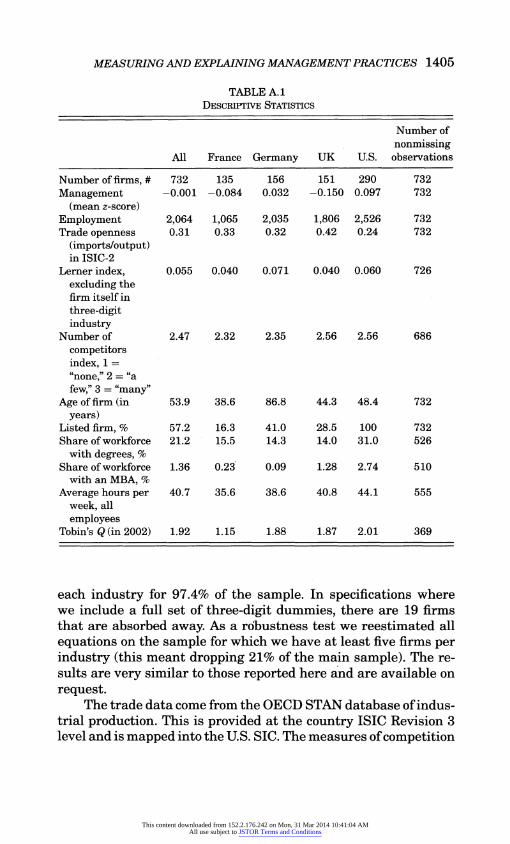
MEASURING AND EXPLAINING MANAGEMENT PRACTICES 1405
TABLE A. 1 Descriptive Statistics
Number of
nonmissing All France Germany UK U.S. observations
Number of firms, # 732 135 156 151 290 732 Management -0.001 -0.084 0.032 -0.150 0.097 732
(mean 2-score)
Employment 2,064 1,065 2,035 1,806 2,526 732 Trade openness 0.31 0.33 0.32 0.42 0.24 732
(imports/output) in ISIC-2
Lerner index, 0.055 0.040 0.071 0.040 0.060 726
excluding the
firm itself in
three-digit
industry Number of 2.47 2.32 2.35 2.56 2.56 686
competitors
index, 1 =
"none," 2 = "a
few," 3 = "many"
Age of firm (in 53.9 38.6 86.8 44.3 48.4 732
years) Listed firm, % 57.2 16.3 41.0 28.5 100 732
Share of workforce 21.2 15.5 14.3 14.0 31.0 526
with degrees, %
Share of workforce 1.36 0.23 0.09 1.28 2.74 510
with an MBA, %
Average hours per 40.7 35.6 38.6 40.8 44.1 555
week, all
employees Tobin's Q (in 2002) 1.92 1.15 1.88 1.87 2.01 369
each industry for 97.4% of the sample. In specifications where we include a full set of three-digit dummies, there are 19 firms that are absorbed away. As a robustness test we reestimated all
equations on the sample for which we have at least five firms per industry (this meant dropping 21% of the main sample). The re sults are very similar to those reported here and are available on
request.
The trade data come from the OECD STAN database of indus trial production. This is provided at the country ISIC Revision 3 level and is mapped into the U.S. SIC. The measures of competition
This content downloaded from 152.2.176.242 on Mon, 31 Mar 2014 10:41:04 AMAll use subject to JSTOR Terms and Conditions

1406 QUARTERLY JOURNAL OF ECONOMICS
we use are "Import Penetration" = lnQmport/Production) in every country x industry pair (i.e., 4 countries and 108 industries im
ply up to 432 cells). We use the average over 1995-1999. "Lerner index of competition" is constructed, as in Aghion et al. (2005), as the mean of (1
? profit/sales) in the entire database (exclud
ing the firm itself) for every country-industry pair (average over 1995-1999 used).
A set of descriptive statistics broken down by country are in Table A.l. We have 732 possible firms with management data, but there are some missing values on a few of the control variables
(e.g., percentage MBAs). In these cases we set the value of the control variable equal to zero when it was missing and include an additional dummy variable to indicate this.
Stanford, NBER, and Centre for Economic Performance
London School of Economics, Centre for Economic Performance, NBER, and
CEPR
References
Aghion, Philippe, Nicholas Bloom, Richard Blundell, Rachel Griffith, and Peter Howitt, "Competition and Innovation: An Inverted U Relationship," Quarterly Journal of Economics, 120 (2) (2005), 701-728.
Athey, Susan, and Scott Stern, "An Empirical Framework for Testing Theories about Complementarity in Organizational Design," NBER Working Paper 6600, 1998.
Baily, Martin, Charles Hulten, and David Campbell, "Productivity Dynamics in Manufacturing Plants," Brookings Papers on Economic Activity, 1992 (1992), 187-267.
Bartel, Ann, Casey Ichinowski, and Kathryn Shaw, "How Does Information Tech nology Really Affect Productivity? Plant-Level Comparisons of Product In novation, Process Improvement and Worker Skills," NBER Working Paper 11773, 2005.
Bartelsman, Eric, Randy Becker, and Wayne Gray, "The NBER Manufacturing Productivity Database," National Bureau of Economic Research, 2000.
Bartelsman, Eric, and Phoebus Dhrymes, "Productivity Dynamics: U.S. Manu facturing Plants, 1972-1986," Journal of Productivity Analysis, 9 (1) (1998), 5-34.
Bartelsman, Eric, and Mark Doms, "Understanding Productivity: Lessons from Longitudinal Microdata," Journal of Economic Literature, 38 (3) (2000), 569 594.
Bennedsen, Morten, Kasper Nielsen, Francisco Perez-Gonzales, and Daniel Wolfenzon, "Inside the Family Firm: The Role of Families in Succession De cisions and Performance," Quarterly Journal of Economics, 122 (2) (2007), 647-691.
Berle, Adolph, and Gardiner Means, The Modern Corporation and Private Property (New York, NY: MacMillan, 1932).
Bertrand, Marianne, Simon Johnson, Krislert Samphantarak, and Antoinette Schoar, "Mixing Family with Business: A Study of Thai Business Groups and the Families behind Them," Mimeo, Chicago GSB, 2005.
Bertrand, Marianne, and Sendhil Mullainathan, "Do People Mean What They Say? Implications for Subjective Survey Data," American Economic Review Papers and Proceedings, 91 (2) (May 2001), 67-72.
This content downloaded from 152.2.176.242 on Mon, 31 Mar 2014 10:41:04 AMAll use subject to JSTOR Terms and Conditions

MEASURING AND EXPLAINING MANAGEMENT PRACTICES 1407
Bertrand, Marianne, and Antoinette Schoar, "Managing with Style: The Effect of
Managers on Firm Policies," Quarterly Journal of Economics, 118 (4) (2003), 1169-1208.
Black, Sandra, and Lisa Lynch, "How to Compete: The Impact of Workplace Prac tices and Information Technology on Productivity," Review of Economics and
Statistics, 83 (3) (2001), 434-445.
Bloom, Nicholas, Tobias Kretschmer, and John Van Reenen, "Work-Life Balance, Management Practices and Productivity," Center for Economic Performance
Special Paper No. 16, 2006. Bloom, Nicholas, Raffaella Sadun, and John Van Reenen, "Americans do I.T. Better:
US. Multinationals and the Productivity Miracle," NBER Working Paper No. 13085, 2007.
Bloom, Nicholas, and John Van Reenen, "Measuring and Explaining Management Practices across Firms and Nations," Center for Economic Performance Dis cussion Paper No. 716, 2006.
Blundell, Richard and Steve Bond, "GMM Estimation with Persistent Panel Data: An Application to Production Functions," Econometric Reviews, 19 (3) (2000), 321-340.
Bresnahan, Tim, Eric Brynjolfsson, and Lorin Hitt, "Information Technology, Workplace Organization and the Demand for Skilled Labor: Firm-Level Evi dence," Quarterly Journal of Economics, 117 (1) (2002), 339-376.
Burkart, Mike, Fausto Panunzi, and Andrei Shleifer, "Family Firms," Journal of Finance, 58 (5) (2003), 2167-2201.
Caroli, Eve, and John Van Reenen, "Skill-Biased Organizational Change? Evidence from a Panel of British and French Establishments," Quarterly Journal of Economics, 116 (4) (2001), 1449-1492.
Caselli, Francesco, and Nicola Gennaioli, "Dynastic Management," Centre for Eco nomic Performance Discussion Paper No. 668, 2006.
Chandler, Alfred, Scale and Scope: The Dynamics of Industrial Capitalism (Cam bridge, MA: Belknap Press, 1994).
Dunning, John, American Investment in British Manufacturing Industry (London: George Allen, 1958).
Foster, Lucia, John Haltiwanger, and Chad Syyerson, "Reallocation, Firm Turnover and Efficiency: Selection on Productivity or Profitability?" NBER Working Paper 11555, 2005.
Holtz-Eakin, Douglas, David Joulfaian, and Harvey Rosen, "The Carnegie Con jecture: Some Empirical Evidence," Quarterly Journal of Economics, 108 (2) (1993), 413-436.
Hoppenhayn, Hugo, "Entry, Exit and Firm Dynamics in Long-Run Equilibrium," Econometrica, 60 (5) (1992), 1127-1150.
Ichniowski, Casey, Kathryn Shaw, and Giovanna Prenushi, "The Effects of Human Resource Management: A Study of Steel Finishing Lines," American Economic Review, 87 (3) (1997), 291-313.
Jovanovic, Boyan (1982), "Selection and the Evolution of Industry," Econometrica, 50 (3) (1982), 649-670.
Landes, David, The Unbound Prometheus: Technological Change and In dustrial Development in Western Europe from 1750 to the Present (Cambridge, UK: Cambridge University Press, 1969).
La Porta, Rafael, Florencio Lopez-de-Silanes, and Andrei Shleifer, "Corporate Ownership around the World," Journal of Finance, 54 (2) (1999), 471-517.
Lazear, Edward, "Performance Pay and Productivity," American Economic Review, 90 (5) (2000), 1346-1361.
Lucas, Robert, "On the Size Distribution of Business Firms," Bell Journal of Eco nomics, 9(2) (1978), 508-523.
Manski, Charles, "Measuring Expectations," Econometrica, 72 (5) (2004), 1329 1376.
Melitz, Marc, "The Impact of Trade on Intra-industry Reallocations and Aggregate Productivity Growth," Econometrica, 71 (6) (2003), 1695-1725.
Menchik, Paul, "Primogeniture, Equal Sharing and the U.S. Distribution of Wealth," Quarterly Journal of Economics, 94 (2) (1980), 299-316.
Morck, Randall, Daniel Wolfenzon, and Bernard Yeung, "Corporate Governance, Economics Entrenchment and Growth," Journal of Economic Literature, 43 (3) (2005), 655-720.
This content downloaded from 152.2.176.242 on Mon, 31 Mar 2014 10:41:04 AMAll use subject to JSTOR Terms and Conditions

1408 QUARTERLY JOURNAL OF ECONOMICS
Mundlak, Yair, "Empirical Production Function Free of Management Bias," Jour nal of Farm Economics, 43 (1) (1961), 44-56.
Nicholas, Tom, "Clogs to Clogs in Three Generations? Explaining Entrepreneurial Performance in Britain since 1850," Journal of Economic History, 59 (1999), 688-713.
Nickell, Steve, "Competition and Corporate Performance," Journal of Political
Economy, 104 (4) (1996), 724-746. Novaes, Walter, and Luigi Zingales, "Bureaucracy as a Mechanism to Generate
Information," Rand Journal of Economics, 35 (2) (2004), 245-259.
Olley, Steven, and Ariel Pakes, "The Dynamics of Productivity in the Telecommu nications Industry," Econometrica, 64 (6) (1996), 1263-1297.
Perez-Gonzalez, Francisco, "Inherited Control and Firm Performance," Mimeo, Columbia University, 2005.
Proudfoot Consulting, Missing Millions: How Companies Mismanage Their Most Valuable Resource (London: Proudfoot Consulting, 2003).
Raith, Michael, "Competition, Risk and Managerial Incentives," American Eco nomic Review, 93 (4) (2003), 1424-1436.
Schmidt, Klaus, "Managerial Incentives and Product Market Competition," Review
of Economic Studies, 64 (2) (1997), 191-213. Schwarz, Norbert, and Frita Strack, "Reports of Subjective Well-being: Judgmental
Processes and their Methodological Implications," in Well-Being: The Foun dations of Hedonic Psychology, Daniel Kahneman, Ed Diener, and Norbert Schwarz eds. (New York, NY: Russell Sage Foundation, 1999).
Stewart, Michael, "Union Wage Differentials, Product Market Influences and the Division of Rents," Economic Journal, 100 (403) (1990), 1122-1137.
Syverson, Chad, "Market Structure and Productivity: A Concrete Example," Jour nal of Political Economy, 112 (6) (2004a), 1181-1222.
-, "Product Substitutability and Productivity Dispersion," Review of Economics and Statistics, 86 (2) (2004b), 534-550.
Villalonga, Belen, and Raphael Amit (2006), "How Do Family Ownership, Control and Management Affect Firm Value?" Journal of Finance, 80 (2) (2006), 385 417.
Vives, Xavier, "Innovation and Competitive Pressure," CEPR Discussion Paper DP4369, 2005.
This content downloaded from 152.2.176.242 on Mon, 31 Mar 2014 10:41:04 AMAll use subject to JSTOR Terms and Conditions