Measurements of an FM Receiver in FM Interference · MEASUREMENTS OF AN FM RECEIVER IN FM...
44
N ITA-REPORT -79-27 Measurements of an FM Receiver in FM Interference J. R. Juroshek u.s. DEPARTMENT OF COMMERCE Juanita M. Kreps, Secretary Henry Geller, Assistant Secretary for Communications and Information October 1979
Transcript of Measurements of an FM Receiver in FM Interference · MEASUREMENTS OF AN FM RECEIVER IN FM...
N ITA-REPORT -79-27
Measurements of anFM Receiver in
FM Interference
J. R. Juroshek
u.s. DEPARTMENT OF COMMERCEJuanita M. Kreps, Secretary
Henry Geller, Assistant Secretaryfor Communications and Information
October 1979

TABLE OF CONTENTS
LIST OF FIGURES
LIST OF TABLES
ABSTRACT
1. INTRODUCTION
2. TEST DESCRIPTION
3. TEST RESULTS
4. SPECTRUM PHOTOGRAPHS
5. SUMMARY AND CONCLUSIONS
6 • REFERENCES
iii
PAGE
iv
v
1
1
2
7
27
31
33
LIST OF FIGURES
PAGE
Figure 1.
Figure 2.
Figure 3.
Figure 4.
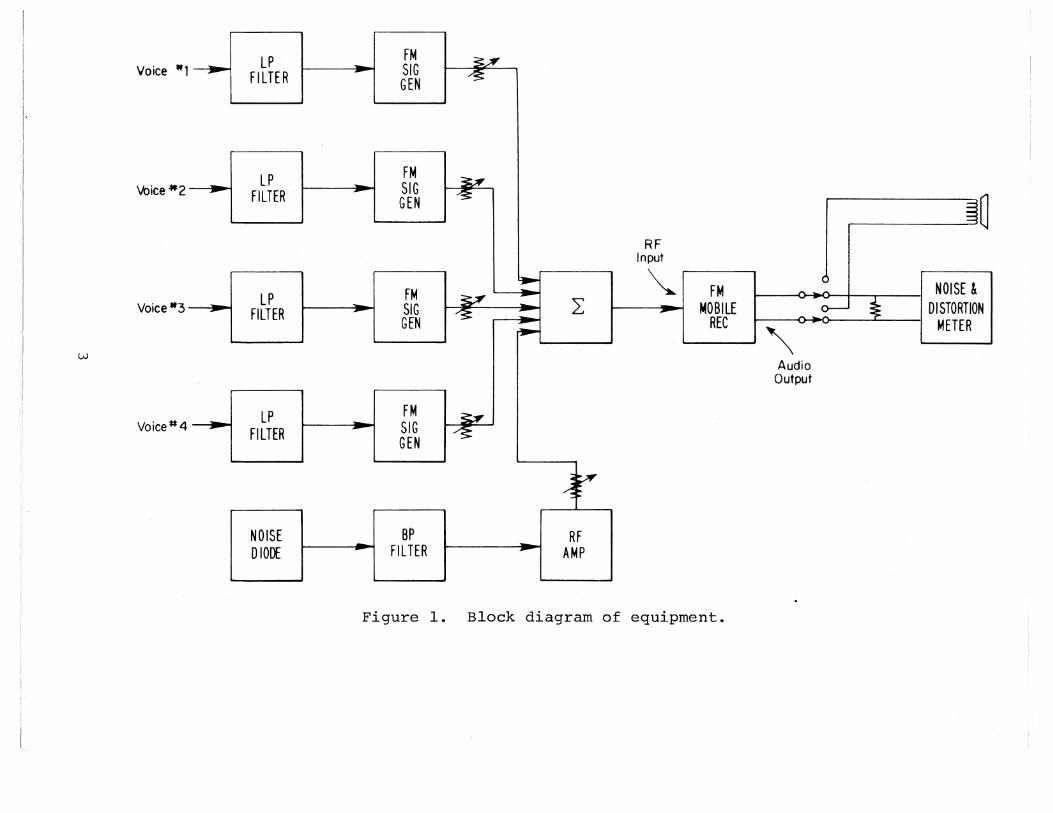
Block diagram of equipment.
Phase noise from FM generators.
Measured performance of an FM receiverin Gaussian noise.
Measured performance of an FM receiverwith a single FM interferer.
3
5
9
10
Figure 5. Measured performance of an FM receiver 11with two equal amplitude interferers.
Figure 6. Measured performance of an FM receiver 12with three equal amplitude interferers.
Figure 7. Measured performance of an FM receiver 15with 1, 2 and 3 equal amplitude FMinterferers. Peak deviation of allFM generators is e = 3 kHz.
Figure 8. . Measured performance of an FM receiver 16wi th a sing Le FM interferer and pos it i veand negative frequency offsets~ Peakdeviation of generators is '8 = 3 k Hz ,
Figure 9. Measured performance of an FM receiver with 17a single FM interferer. Peak frequencydeviation of all FM signals is e = 3 kHz.
Figure 10.
Figure 11.
Figure 12.
Measured performance of an FM receiverwi th two FM interferers. Peak frequencydeviation of all FM signals is e = 3 kHz.
Measurements of SII N required to producea SINAD = 12 dB witfl a single FM interfererand Gaussian noise. Peak frequencydeviation of all FM signals is e = 3 kHz.
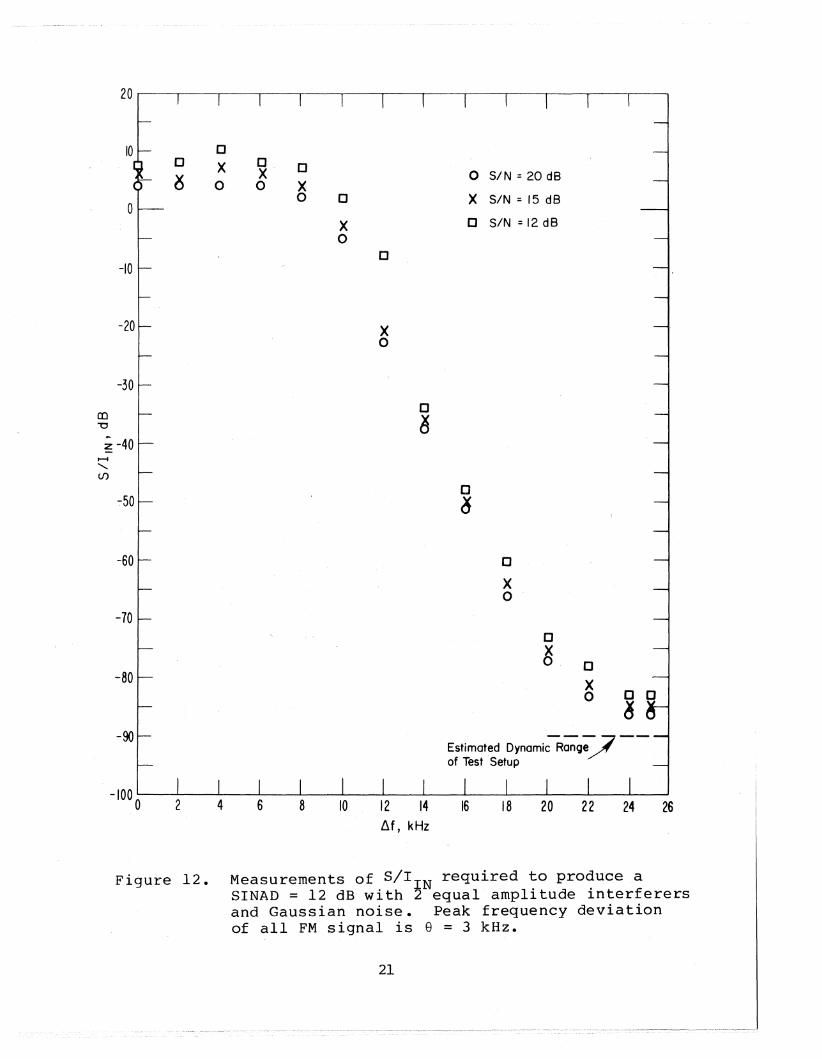
Measurements of SII N required to producea SI~D = 12 dB witfl 2 equal amplitudeinterferers and Gaussian noise. Peakfrequency deviation of all FM signalis e = 3 kHz.
iv
18
20
21
Figure 13.
Figure 14.
Figure 15.
Figure 16.
Figure 17.
Figure 18.
TABLE 1.
TABLE 2 •
TABLE 3.
Threshold of perceptible interference foran FM receiver with a single FM interferer.Peak frequency deviation is 8 = 3 kHz.
Threshold of perceptible interference foran FM receiver with equal amplitude FMinterferers. Peak frequency deviationis 8 = 3 kHz.
Measurements of SINAD as a function ofnormalized input signal-to-interferenceratio for various frequency offsets ~f.
Interference is a single FM signal. Peakfrequency deviation of all FM generatorsis 8 = 3 kHz.
Spectra of a 171'.8 MHz FM signal modulatedwith (a) a voice signal and (b) a 400 Hztone. Peak frequency deviation is e = 3 kHz.
Spectra of the audio output from an FMreceiver with (a) receiver background noise,(b) Gaussian noise of SiN N = 10 dB, (c) asingle FM interferer of S}IIN = 10 dB, and(d) 3 equal amplitude FM interferers ofS/IIN = 10 dB.
Spectra of the audio output from an FMreceiver with a single FM interfereroffset in frequency by (a) ~f = 0 kHz,(b) ~f = 4kHz, (c) ~f = 12 kHz and (d)~f = 24kHz. Peak frequency deviationof all FM signals is 8 = 3 kH~.
LIST OF TABLES
Estimates of S/N I N required to produceaSINAD = 12 dB.
Estimates of SINAD for S/IIN OrS/N I N = 20 dB.
Summary of S/II~ required to produce aSINAD = 12 dB wlth 8 = 3 kHz.
v
PAGE
23
24
26
28
29
30
13
13
22

MEASUREMENTS OF AN FM RECEIVER IN FM INTERFERENCE
John R. Juroshek*
This report investigates the performance ofan FM, landrnobile, receiver in FM interference.Measurements are described showing the effects ofmultiple interfering FM signals as a function ofmodulation index, signal-to-interference ratio,signal-to-noise ratio, and frequency offsetbetween the victim and interferer. The performance of the receiver is measured with variouscombinations of one to three interfering FMsignals. The report also describes the spectra ofthe audio output during various interferenceconditions.
Key words: frequency modulation; spectrum;interference; communications;land-mobile radio
1. INTRODUCTION
An estimate of the performance of an FM system is often
based on t he assumption that white Gaussian noise is the
factor limiting performance. Increased demands for
spectrum, however, are resulting in more instances where
interfering signals are the dominant source of degradation.
Thus, it becomes increasingly important to understand how an
FM receiver behaves in FM interference.
This report will discuss the laboratory measurements of
a single FM receiver in a co-channel and off-frequency FM
interference environment. The effects of one to three
independent, interfering, FM signals are measured as a
function of modulation index, signal-to-interference ratio,
* The author is with u.S. Department of Commerce, Institute forTelecommunication Sciences, National Telecommunications andInformation Administration, Boulder, Colorado 80303.
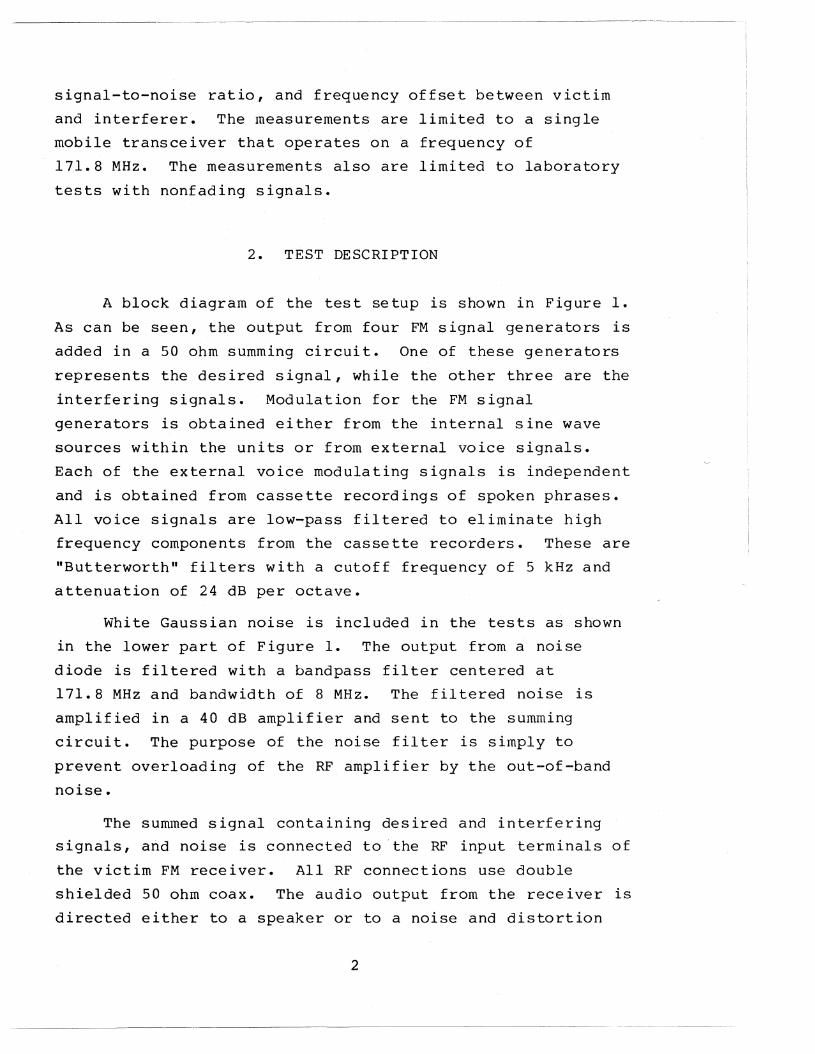
signal-to-noise ratio,and frequency offset between victim
and interferer. The measurements are limited to a single
mobile transceiver that operates on a frequency of
171.8 MHz. The measurements also are limited to laboratory
tests with nonfading signals.
2. TEST DESCRIPTION
A block diagram of the test setup is shown in Figure 1.
As can be seen, the output from four FM signal generators is
added in a 50 ohm summing circuit. One of these generators
represents the desired signal, while the other three are the
interfering signals. Modulation for the FM signal
generators is obtained either from the internal sine wave
sources within the units or from external voice signals.
Each of the external voice modulating signals is independent
and is obtained from cassette recordings of spoken phrases.
All voice signals are low-pass filtered to eliminate high
frequency components f.r om the cassette recorders. These are
"Butterworth" filters with a cutoff frequency of 5 kHz and
attenuation of 24 dB per octave.
White Gaussian noise is included in the tests as shown
in the lower part of Figure 1. The output from a noise
diode is filtered with a bandpass filter centered at
171.8 MHz and bandwidth of 8 MHz. The filtered noise is
amplified in a 40 dB amplifier and sent to the summing
circuit. The purpose of the noise filter is simply to
prevent overloading of the RF amplifier by the out-of-band
noise.
The s ummed vs i qnal containing desired and interfering
signals, and noise is connected to I t he RF input terminals of
the victim FM receiver. All RF connections use double
shielded 50 ohm coax. The audio output from the receiver is
directed either to a speaker or to a noise and distortion
2
Voice "'1 LPFILTER
FMSIGGEN
LP I ~IFM
Voice"'2 --1 SIG I "S ,1 3~
FILTER .. GEN I
I IRF
Input
\FM I¥; ~I H fM
I~:2NOISE &
LP I -IVoice-3 , .... 1 SIG L • MOBILE ~ DISTORTIONFILTER GEN REC METER
w I IAudio
Output
~ I J
LP I --I fMVoice#4~
FILTER SIGGEN
NOISEDIOl!
BPFILTER
RFAMP
Figure 1. Block diagram of equipment.
meter whose input is terminated with a noninductive resistor
equal to the nominal speaker impedance.
Whenever possible, the tests were conducted according
to the procedures recommended in EIA Standard RS-204-A
(Electronic Industries Association, 1972). The only major
deviation from the recommended standard occurs when the FM
signal generators are voice modulated. The standard
requires that the FM generators be tone-modulated and thus
does not define test procedures for voice modulation.
Although most of the tests were conducted with tone
modulation, it was felt that at least a few tests should use
voice modulation to see if there were any major differences.
The FM generators were modern units whose output could
be frequency locked to insure a stability of better than
5 x 10⁻⁸• The accuracy of the counter used to set the
generators, on the other hand, was only one part in lOG.
Thus, the frequency that the generators are tuned to is
known to an accuracy of 500 Hz. This accuracy, however, is
sufficient for these tests.
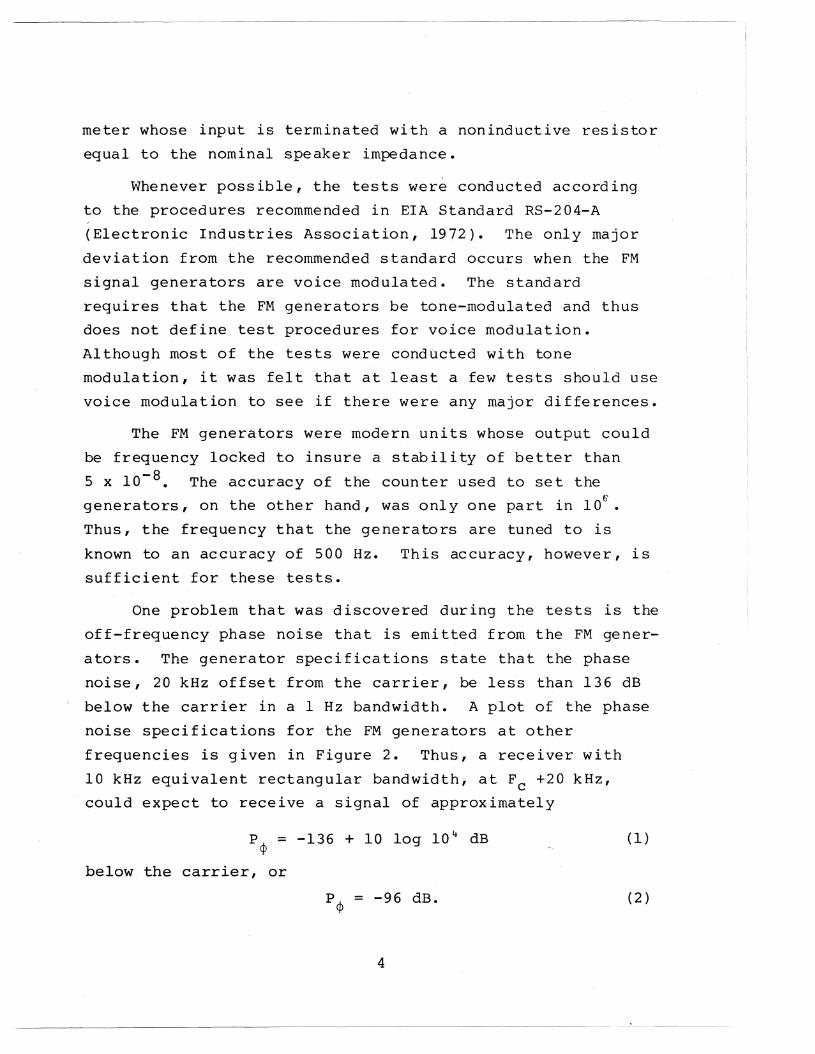
One problem that was discovered during the tests is the
off-frequency phase noise that is emitted from the FM gener
ators. The generator specifications state that the phase
noise, 20 kHz offset from the carrier, be less than 136 dB
below the carrier in a 1 Hz bandwidth. A plot of the phase
noise specifications for the FM generators at other
frequencies is given in Figure 2. Thus, a receiver with
10 kHz equivalent rectangular bandwidth, at Fe +20 kHz,
could expect to receive a signal of approximately
P¢ = -136 + 10 log 10 4 dB
below the carrier, or
P¢ = -96 dB.
4
(1)
(2)
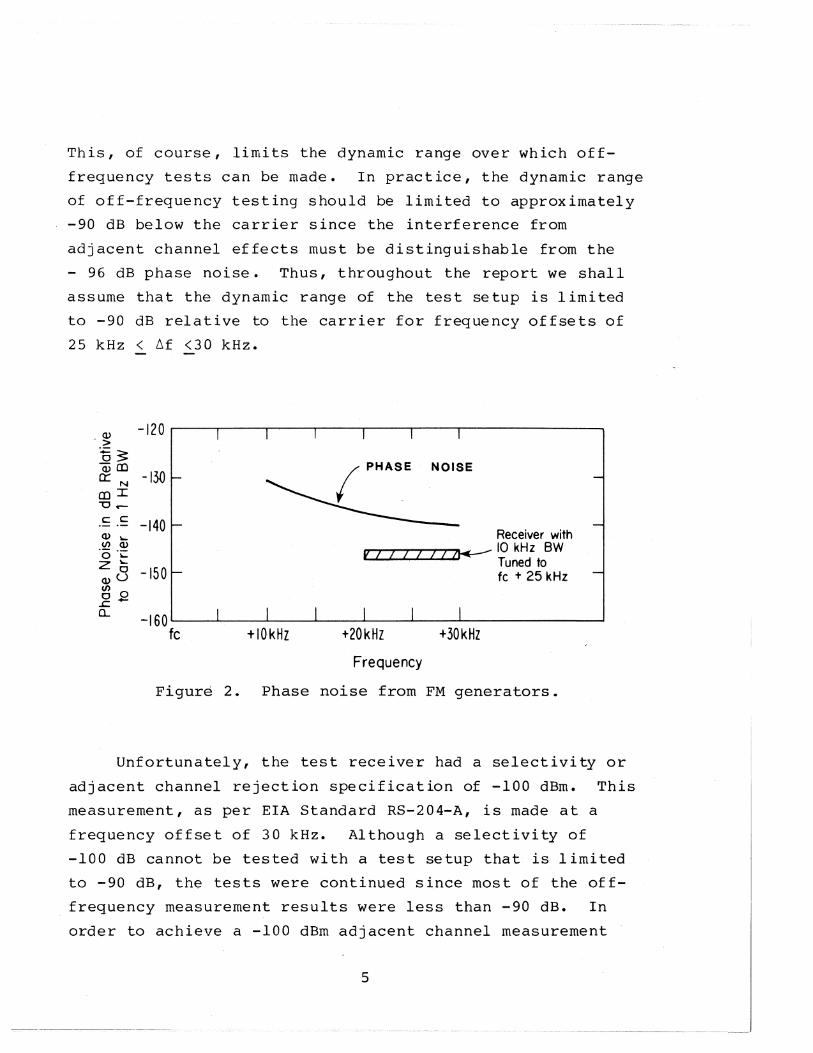
This, of course, limits the dynamic range over which off
frequency tests can be made. In practice, the dynamic range
of off-frequency testing should be limited to approximately
-90 dB below the carrier since the interference from
adjacent channel effects must be distinguishable from the
- 96 dB phase noise. Thus, throughout the report we shall
assume that the dynamic range of the test setup is limited
to -90 dB relative to the carrier for frequency offsets of
25 kHz < ~f <30 kHz.
.~ -120 I
.-5 3:OJ CD(LN -13D£DI-0 .-
C c -140OJ ~
(f) OJ·0 .~
z~
-1500OJU(f)
o.E.J::.CL -160
fc +IOkHZ
v 7
+20kHz
Receiver with7 7 7 7 7~ 10 kHz BW
Tuned totc + 25 kHz
+30kHz
Frequency
Figure 2. Phase noise from FM generators.
Unfortunately, the test receiver had a selectivity or
adjacent channel rejection specification of -100 dBm. This
measurement, as per EIA Standard RS-204-A, is made at a
frequency offset of 30 kHz. Although a selectivity of
-100 dB cannot be tested with a test setup that is limited
to -90 dB, the tests were continued since most of the off
frequency measurement results were less than -90 dB. In
order to achieve a -100 dBm adjacent channel measurement
5
capability, screen room shielding would probably be needed,
as well as substantially improved signal generators.
The discussion so far has assumed that the phase noise
is from 1 FM generator. This test setup however, can have
up to three act i ve interfering generators and one v ict Lm
generator. Let us assume the total power of th.e three
interfering generators at the input to the receiver is
(3)
where i k is the power in the kth interfering signal source.
This report uses a convention of designating numeric values
with lower case letters and equivalent dB values in upper
case. The ratio of i I N to total phase noise power is then
given by
=Pep PI + P2 + P3
, (4)
where Pi is the' phase noise contribution of theith
generator. However, for various ieasons, we have found it
necessary to restr ict the tests to equal amplitude
interfering signals which means that
and for all practical purposes
p = p = P1 2 '··3
Thu.s
(5)
(6)
i I N.
Pep= (7)
which means the ratio of interference power to phase-noise
power at the: input to the receiver remains constant with the
number of Ln t er ferLnq sources.
6
Some other parameters of interest in the test setup are
the receiver specifications. These are:
Sensitivity/
?12 dB SINAD (EIA method) 0.35 LA'
20 dB Quieting 0.50
Channel Spacing 30 kHz
Audio Output 12 watts at less
Oscillator Stability
Maximum Frequency Deviation
3. TEST RESULTS
than 3% distortion
to 8 ohm speaker
+ 0.0002%
+ 5 kHz
One measure of performance for an FM receiver is SINAD,
which is an abbreviation for the ratio "signal + noise
+ distortion to noise + distortion" expressed in dB. This
ratio is measured with a noise and distortion meter
connected to the output terminals of the receiver.
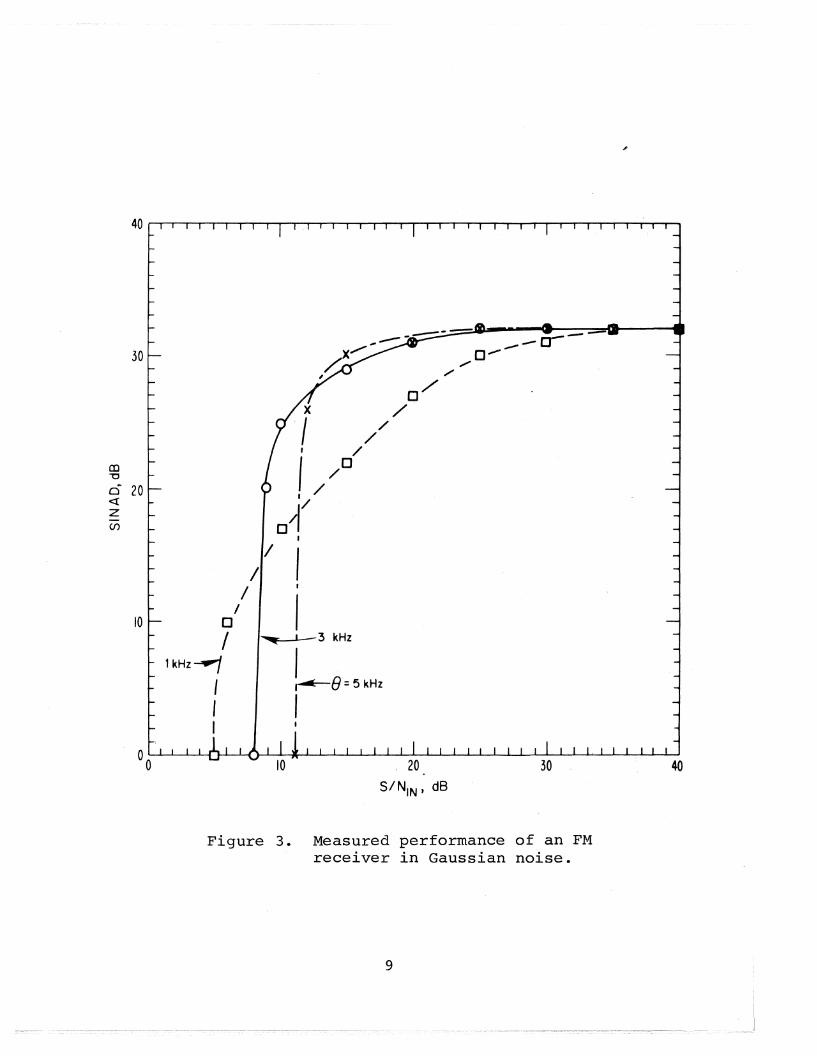
shows the measurement of SINAD in Gaussian noise.
Figure 3
For this
particular test, only one active FM generator is used; the
desired generator. The quantity S/N1N designates the ratio
of signal power to noise power at the input to the receiver
and e denotes peak frequency deviati~. Noise power here is
referenced to the receiver IF bandwi~th, or
(8)
where b I F is the IF noise power bandwidth, and no is the
noise power density. The value of b I F for the test receiver
is 10.1 KHz. All SINAD measurements were conducted with a
1000 Hz modulating tone on the desired FM generator.
7
Figure 3 shows the classical FM improvement-threshold
relationship. The larger value of e, provides a larger
value of SINAD provided S/N1N is above threshold. Unfor
tunately, the threshold requirements also increase with
increasing e. One should note that the maximum SINAD
obtainable with the test receiver is approximately 30 dB,
which is consistent with its specifications. A SINAD of
0.0 dB is used to designate a loss of capture of the desired
signal.
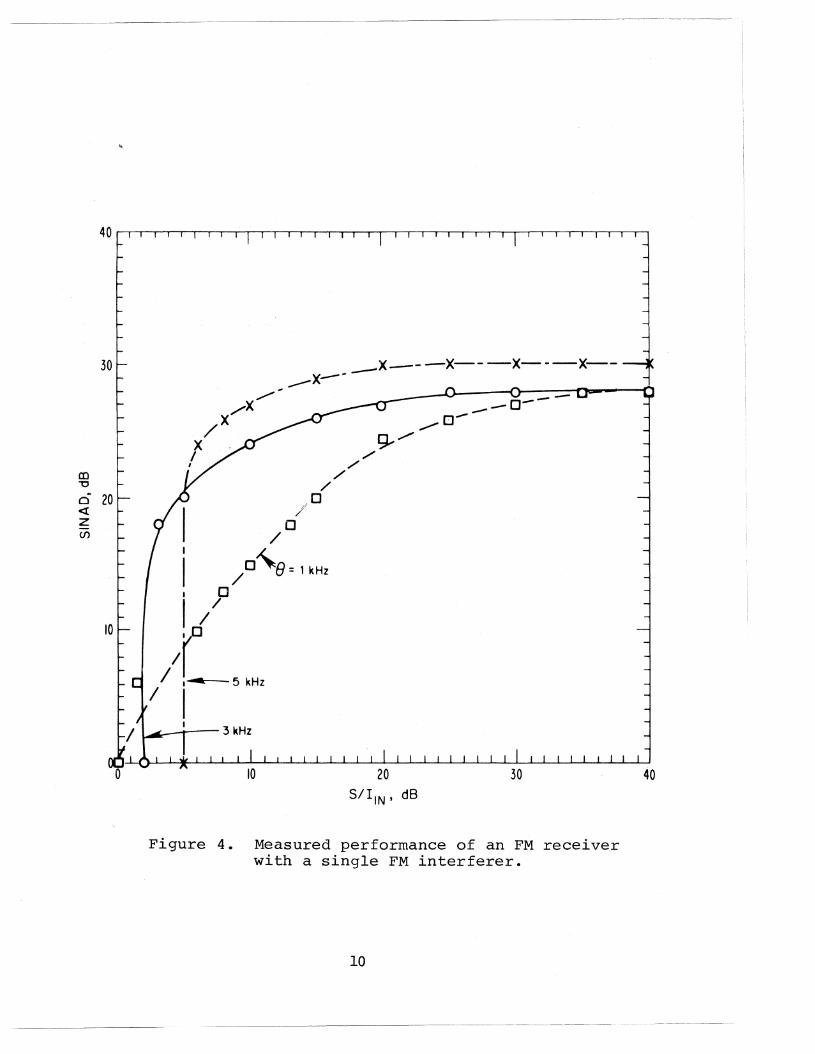
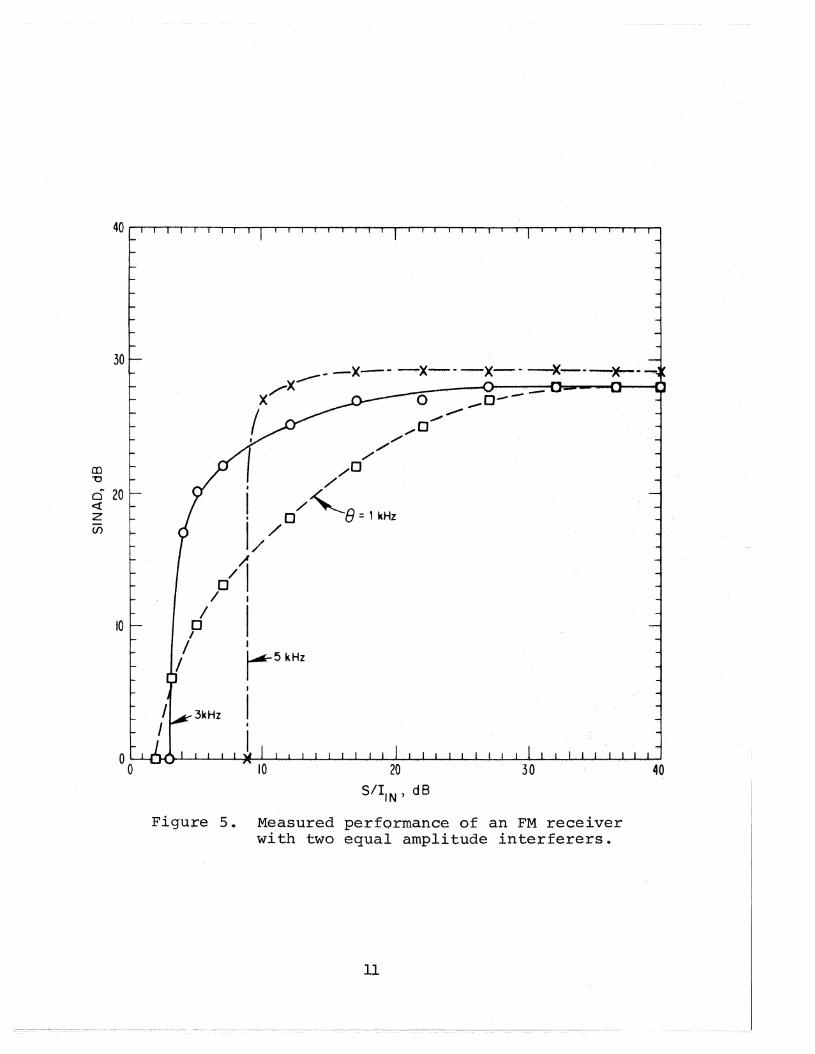
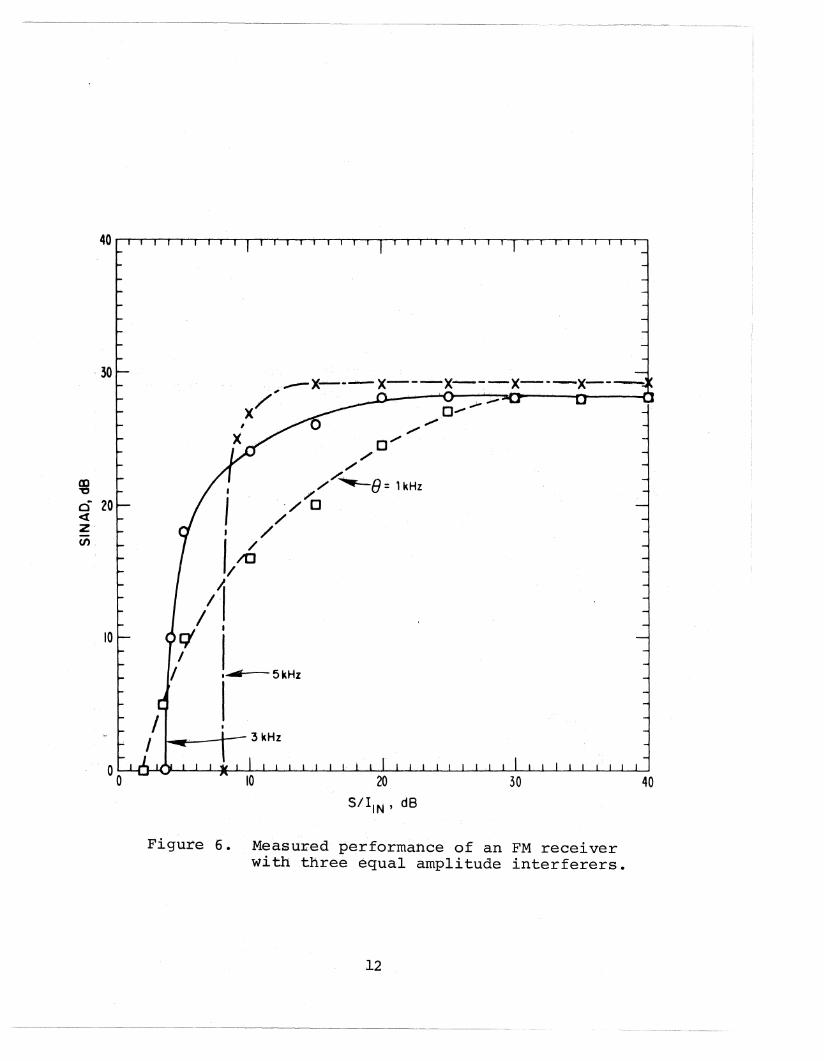
Figures 4,· 5, and 6 show similar measurements except
that FM interference is now substituted for the Gaussian
noise. Figure 4 shows the results with a single FM
interferer while 5 and 6 are for two and three equal
amplitude FM interferers respectively. The curves are
plotted in S/IIN' which is the ratio of signal-power to
total-interference-power at the input to the receiver.
Again, as per EIA specifications, the desired FM signal is
modulated with a 1000 Hz tone while each interfering signal
is modulated with a 400 Hz tone. All of the tests were made
at a desired input signal level of SIN = - 80 dBm and zero
frequency offset between the desired and interfering
signals.
The important difference to note in Figures 3 through 6
is that the threshold requirements change somewhat for FM
interference as compared to Gaussian noise. Although the
definition of threshold is arbitrary, it is evident that
with e = 5 kHz, an S/N1 N greater that 11 dB is required for
satisfactory operation, in Gaussian noise. However, with~
single FM interference, this reduces to 5 db.
These results are summarized in Table 1, which shows an
estimate of the S/IIN or S/N 1N that is required to produce
an output SINAD = 12 dB.
8
30
CD"'0
o 20<t:Z(J)
10
I•
I'-3 kHz
Il~e=5kHz
I
Figure 3. Measured performance of an FMreceiver in Gaussian noise.
9
40
x--- -x-- --x- --x-~x--- ------
---.....----~ 3 kHz
0 .........~
~,/
/'/
/"/
,.0//o
/
i /0"8 =1 kHz
• 0
I //
/(/ .........--·-5 kHz
/ II
to
30
CD"'0
ci 20<tZ(/)
e to 20S/I,N' dB
30 40
Figure 4. Measured performance of an FM receiverwith a single FM interferer.
10
30
rn'U
q 20«zU5
10I
~5kHZ
Figure 5~ Measured performance of an FM receiverwith two equal amplitude interferers.
11
30
CD~
ci 20<tZu;
10
,~x-''-.----x---x-'---x--' ----x--....--.-
5kHz
Figure 6. Measured performance of an FM receiverwith three equal amplitude interferers.
12
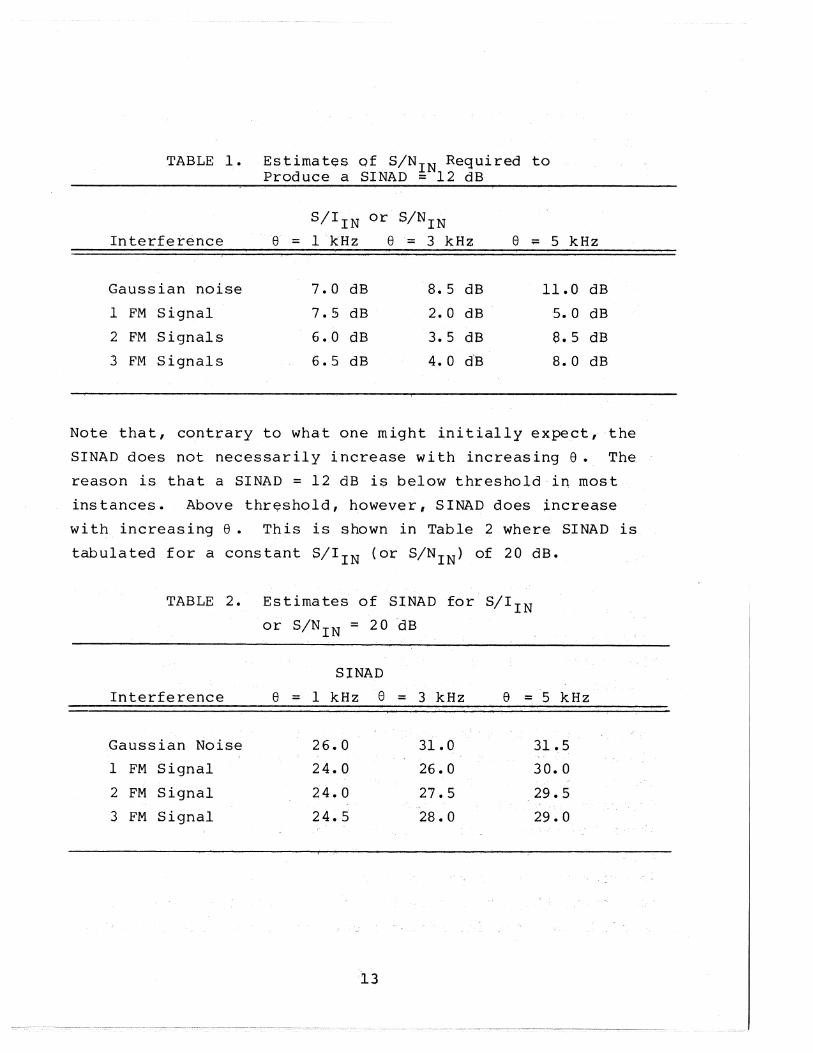
TABLE 1. Estimates ofS/NINRequired toProduce a SINAD = 12 dB
S/IIN or S/N1NInterference e = 1 kHz e = 3 kHz e :;:: 5 kHz
Gaussian noise 7.0 dB 8.5 dB 11.0 dB
1 FM Signal 7.5 dB 2.0 dB '5. 0 dB
2 FM Signals 6.0 dB 3.5 dB e.5 dB
3 FM Signals 6.5 dB 4.0 d"B 8.0 dB
Note that, contrary to what one might ~nitially expect, the
SINAD does not necessarily increase with increasing 8. The
reason is that a SINAD = 12dB is below threshold in most
ins tances. Above t.hr esho Ld , however I S INAD does Lnc r e ase
wi th increasing e. This is shown in Table 2 whe re. SINAD is
tabulated for a constant S/IIN (or S/N I N) of 20 dB.
TABLE 2. Estimates of SINAD for S/IIN
or S/N 1N = 20 ~B
SINAD
Interference e = 1 kHz e = 3 kHz e :;: 5 kHz
Gaussian Noise 26.0 31.0 31.5
1 FM Signal 24.0 26. 0 30.0
2 FM Signal 24.0 27.5 29. 5
3 FM Signal 24.5 28. 0 29.0
13
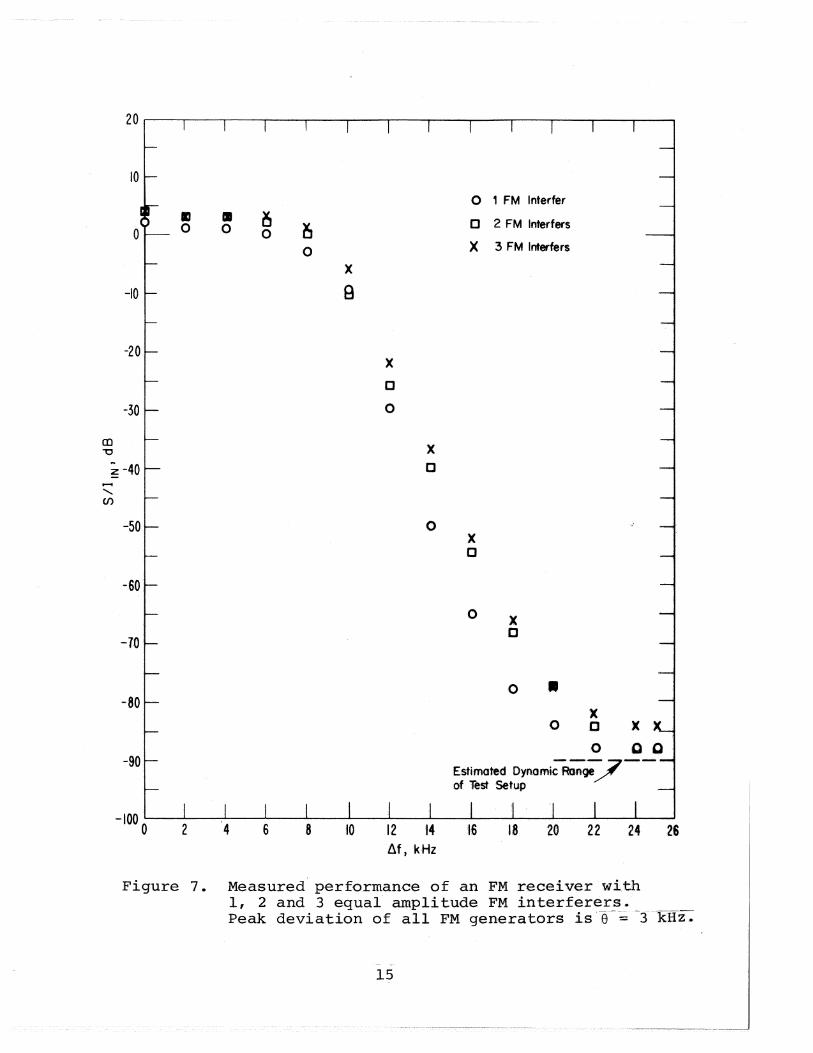
Frequency offset between the victim and interfering
signals is denoted ~f, where a positive Af meanS the
interfering signals are higher in frequency than the desired
signal. Figure 7 shows a plot of S/IIN that is required to
produce a S!NAD of 12 dB for various 8f. The test setup is
basically the same as for the previous tests described in
Figures 4 through 7, except that 8 is set to 3 KHz. It
should be pointed out that a SINAD = 12 dB corresponds to
marginal performance. Also note from the 8 == 3 curves in
Figures 4, 5, and 6, that the performance rapidly changes at
the SINAD = 12 dB point with. small changes in S/I 1 N• As can
be seen, the difference in performance due to one or three
interferers is only a few dB.
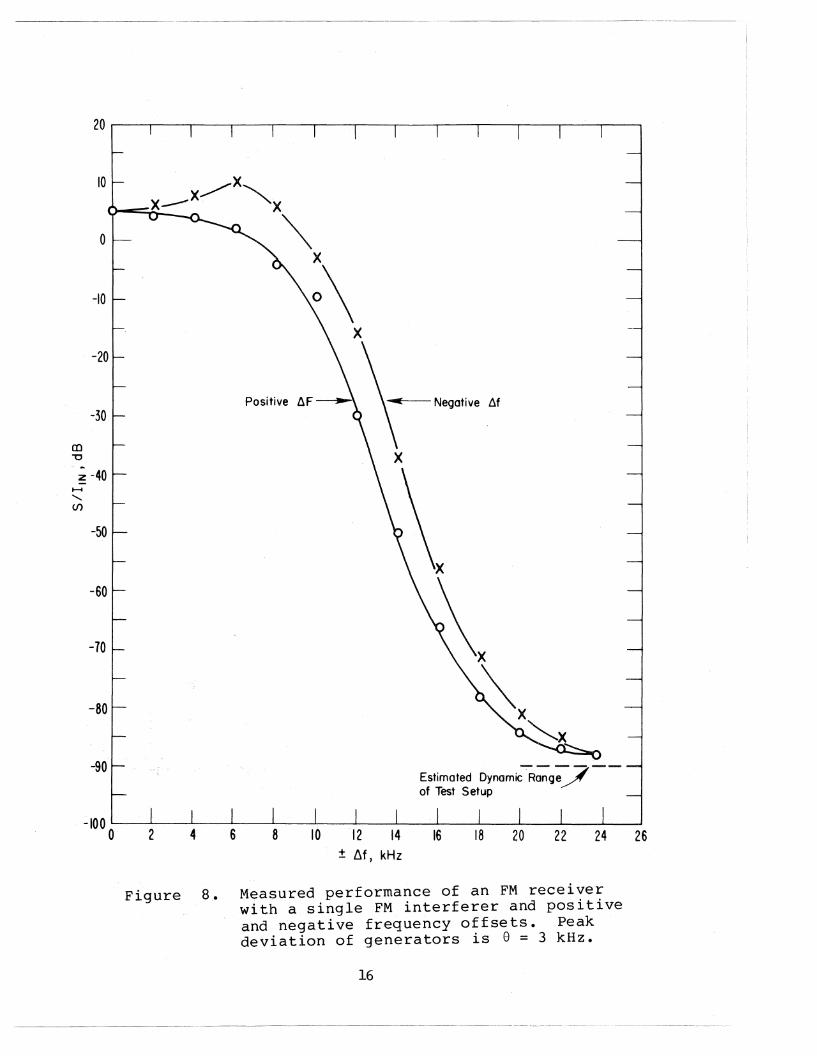
The response of the rece i ver when the interferer's
frequency is less than the v ict Lm (nega t i veti f )i9 shown in
Figure 841 As can be seen, the results are asymme tr ical with
the two response curves offset by 1.2 kHz. This offset is
due toa combination of receiver tolerances and oscillator
stability.
So far, the tests have all used 1000 Hz tone modulation
for the desired FM signal and 400 Hz modulation on the
interfering generators as specified in the EIA standard.
The response with voice modulated interference, however, is
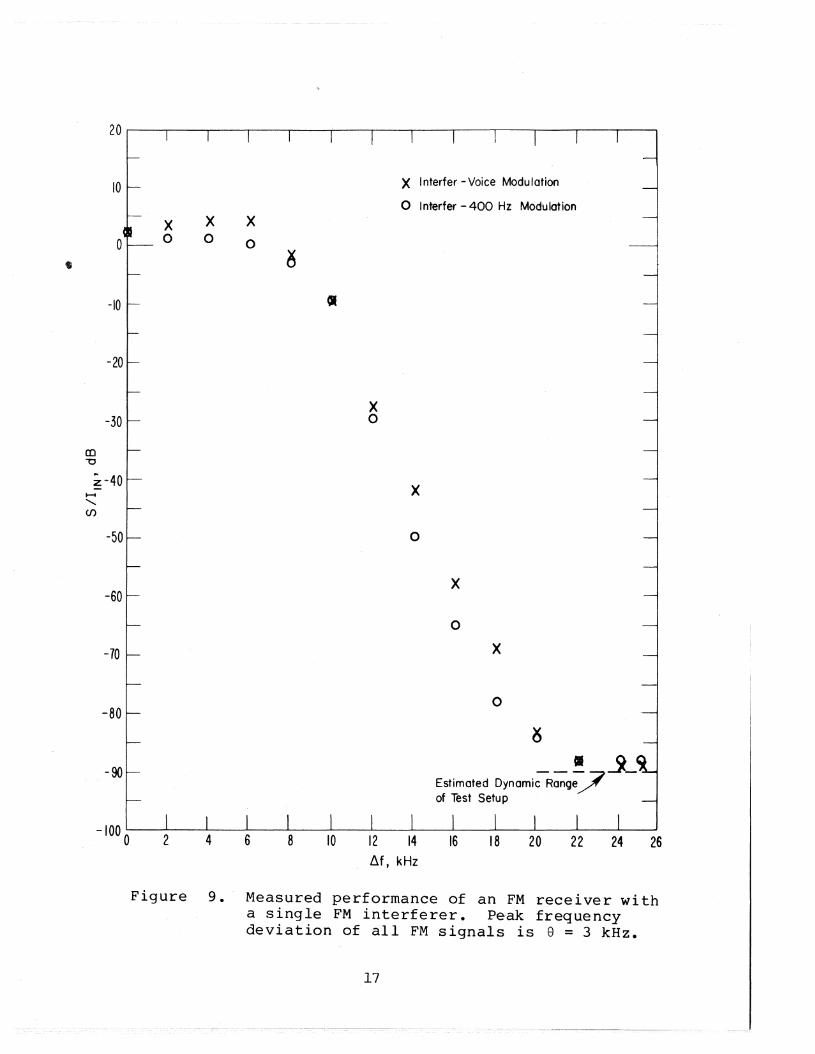
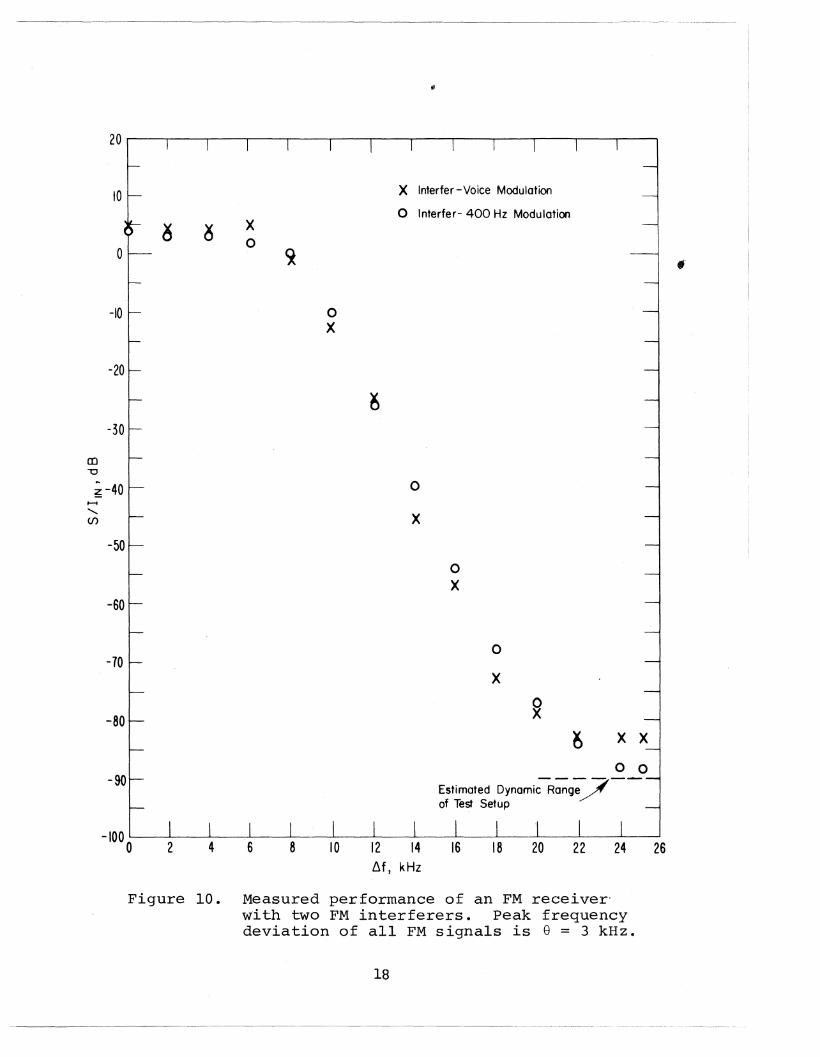
similar, as shown in Figures 9 and 10. These figures
compare the interference produced by 400 Hz modulation with
that pr-oduced by voice modulation of the interfering PM
signal. Plotted in these figures is the S/1 IN required to
insure a SINAD of 12 dB as a funct ion of 8 f. The pe ak
frequency deviation f or both cases is e == 3kHz. Figure 9
shows the results for a single FM interferer, while
Figure 10 shows the resu.lts wi th two equal amplitude
interferers. Although the results for three interferers are
hGt shown, they are nearly identical. Therefore, one can
coneludethat the interference does not change significantly
14
10
o
-10
-20
-30
(D"'0
~ -40
-50
-60
IIo II
o ~o ~
ox8
xC
o
o
o 1 FMlnterfer
C 2 FM Interfers
X :3 FMlnterfers
xo
-70
o XD
-80
-90
'Xo ,0)(
-000Estimated Dynomlc~qe7-of Test 'Setup
2 4 6 8 to 12 14trfJkHz
16 18 20 22 :24 26
Figure 7. Measured perf,orman-ceof an FM recei-ver with1,2 and 3 equal'amplitudeFM interferers.Peak deviation ofallFM generatorsi.s '-e--;;;-3 --'kHz;.
15
o
-10
-20
-30
m"U
~ -40
-50
-60
-10
-80
-90
Negati ve .1f
Estimated DynomicRange~-of Test Setup
12 14± ~f) kHz
16 18 20 22 24 26
Figure 8. Measured performance of an FM receiverwith a singleFM interferer and positiveand negative frequency offsets. Peakdeviation of generators is e = 3 kHz.
16
20 ..---.....--....-----.---.,..----+---.-----,----.----r---r---r---,------,
10
o
-10
xo
xo
xo
X Interfer - Voice Modulotion
o Interfer - 400 Hz Modulation
-20
X-30 0
co-0
~-40X......
<,(f)
-50 0
X-60
0
-70 X
-80
-90
o
~
--~7~-Estimated Dynamic Range/of Test Setup
2 4 6 8 10 12 14Llf J kHz
16 18 20 26
Figure 9. Measured performance of anFM receiver witha single FM interferer. Peak frequencydeviation of all FM signals is e = 3 kHz.
17
to
o
-10
-20
-30
CD"0
~-40
-50
-60
-70
-80
-90
X Interfer - Voice Modulation
o Interfer- 400 Hz Modulationxo
oX
o
x
oX
o
x
~ X X
o 0Estimated Dynami;Range7-of Test Setup
1
10 12 14 16 18 20 22 24 266f, kHz
Figure 10. Measured performance of an FM receiver-w'i, th two FM interferers. P·eakfrequencydeviation of all FM signals is e = 3 kHz.
18
,-
if the FM signal is voice modulated in place of the 400 Hz
tone modulation.
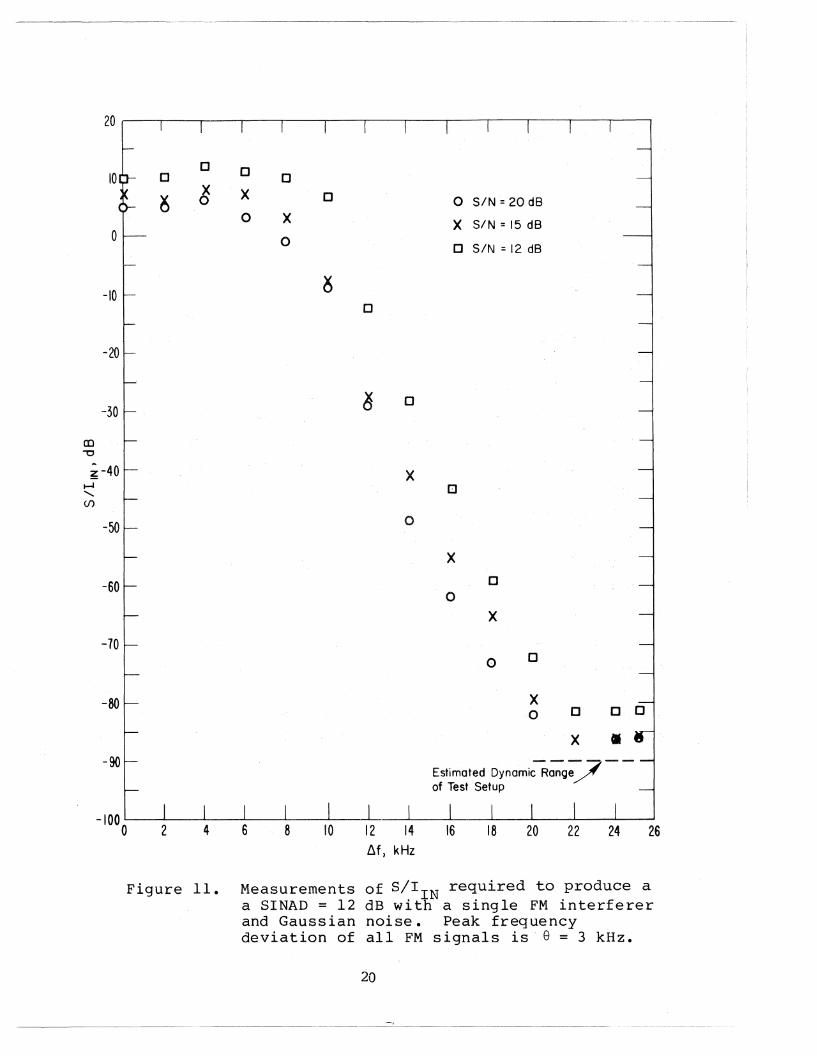
Tests also were conducted to show the effects of the
receiver being subjected simultaneously to Gaussian noise
and FM interference. In Figures 11 and 12, a plot of S/IIN
that is required for a SINAD of 12 dB is plotted as a
function of ~f. This time, however, Gaussian noise is also
included in the tests. Results are shown for Gaussian
signal-to-noise ratios of 20, 15, and 12 dB. The quantity
S/IIN represents signal power to total interference power
and does not include the Gaussian noise.
One can see that the Gaussian noise degrades the
system's ability to withstand interference. Figure 11 shows
a change in S/IIN of approximately 5 dB is required to
compensate for the effects of S/N1 N of 12 dB. Figure 12 is
for the case of two equal amplitude interferers. No tests
were made with S/N1N less than 12 dB since the receiver's
performance rapidly degrades at this point. Again the tests
with three interferers are almost identical and, therefore,
are not shown in the report.
These results are summarized in Table 3, where the
S/IIN required for a SINAD = 12 dB is shown for various
interference conditions and frequency offsets of 12, 20, and
25 kHz. The .f i r s t; three entries are for the tests without
Gaussian noise, while the last two entries includes Gaussian
noise. Note the large change that occurs at ~f = 12 kHz.
19
20 r---.---.-----.----.---~-.__-__r__-__,__-____r-- __-_- -_
10 00 X [J 0(S X 0 SIN =20 dB
0 0 X
00 0 X SIN = 15 dB
X 0 SIN =12 dB0
0-10
-20
-30
CD-c
~ -40t--4<,(f)
-:-50
-60
-70
-80
xo
oXo
oXo c c
~-90
Estimated Dynami;Range/-of Test Setup
2 4 6 8 10 12 14Llf, kHz
16 18 20 22 24 26
Figure 12. Measurements of S/IIN required to produce ~a
SINAD = 12 dB with 2 equal amplitude interferersand Gaussian noise. Peak frequency deviationof all FM signal is 8 = 3 kHz.
21
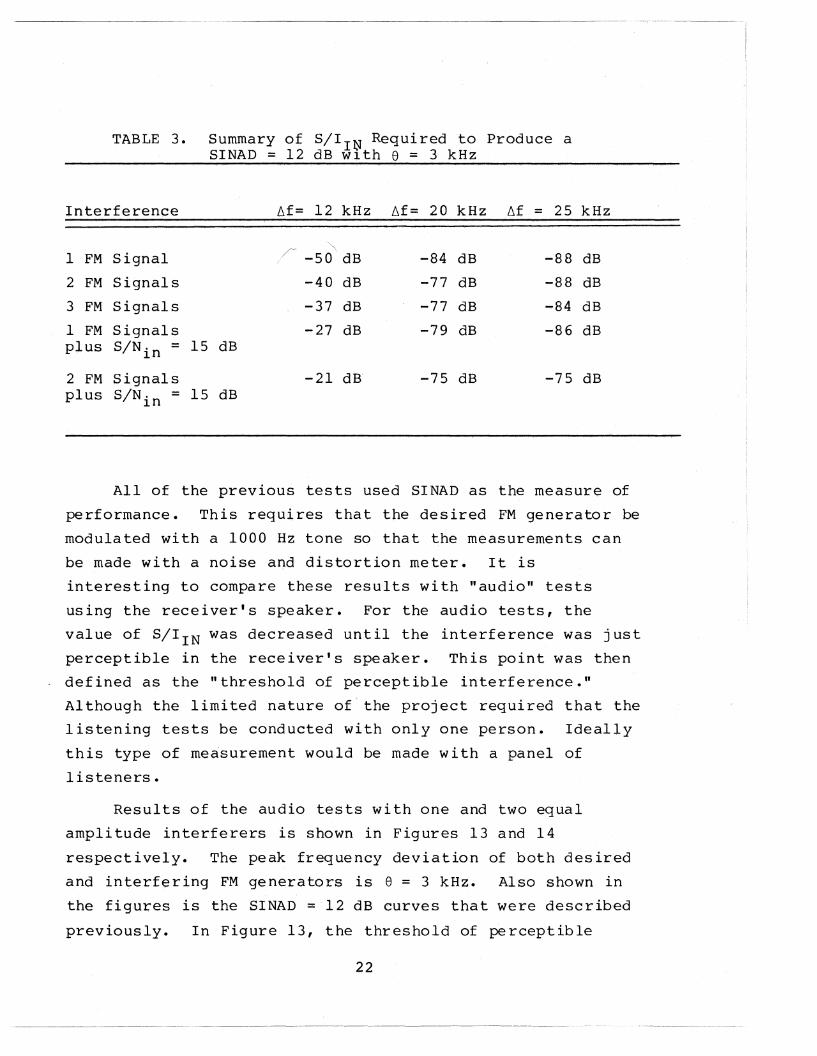
TABLE 3. Summary of S/II~ Required to Produce aSINAD = 12 dB wlth e = 3 kHz
Interference ~f= 12 kHz ~f= 20 kHz ~f = 25 kHz
1 FM Signal
2 FM Signals
3 FM Signals
1 FM Signalsplus S/N i n = 15 dB
2 FM Signalsplus S/N i n = 15 dB
<,-50 dB
-40 dB
-37 dB
-27 dB
-21 dB·
-84 dB
-77 dB
-77 dB
-79 dB
-75 dB
-88 dB
-88 'dB
-84 dB
-86 dB
-75 dB
All of the previous tests used SINAD as the measure of
performance. This requires that the desired FM generator be
modulated with a 1000 Hz tone so that the measurements can
be made with a noise and distortion meter. It is
interesting to compare these results with "audio" tests
using the receiver's speaker. For the audio tests, the
value of S/IIN was decreased until the interference was just
perceptible in the receiver's speaker. This point was then
defined as the "threshold of perceptible interference."
Although the limited nature of the project required that the
listening tests be conducted with only one person. Ideally
this type of measurement would be made with a panel of
listeners.
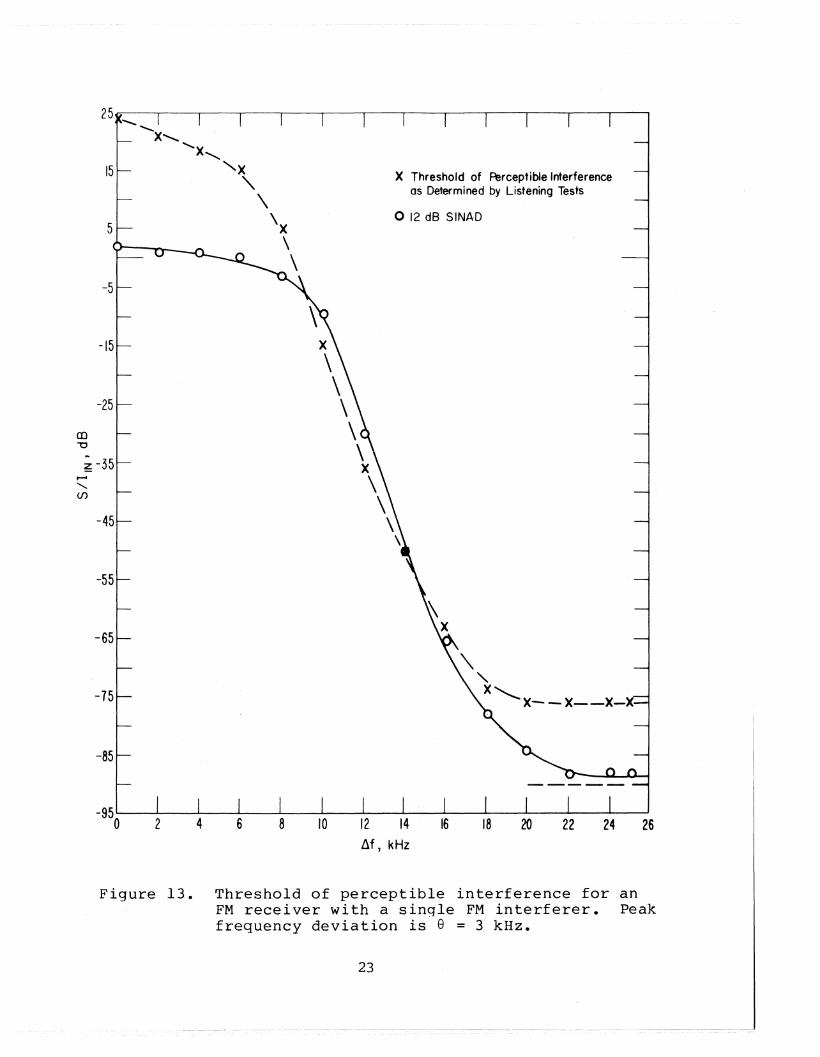
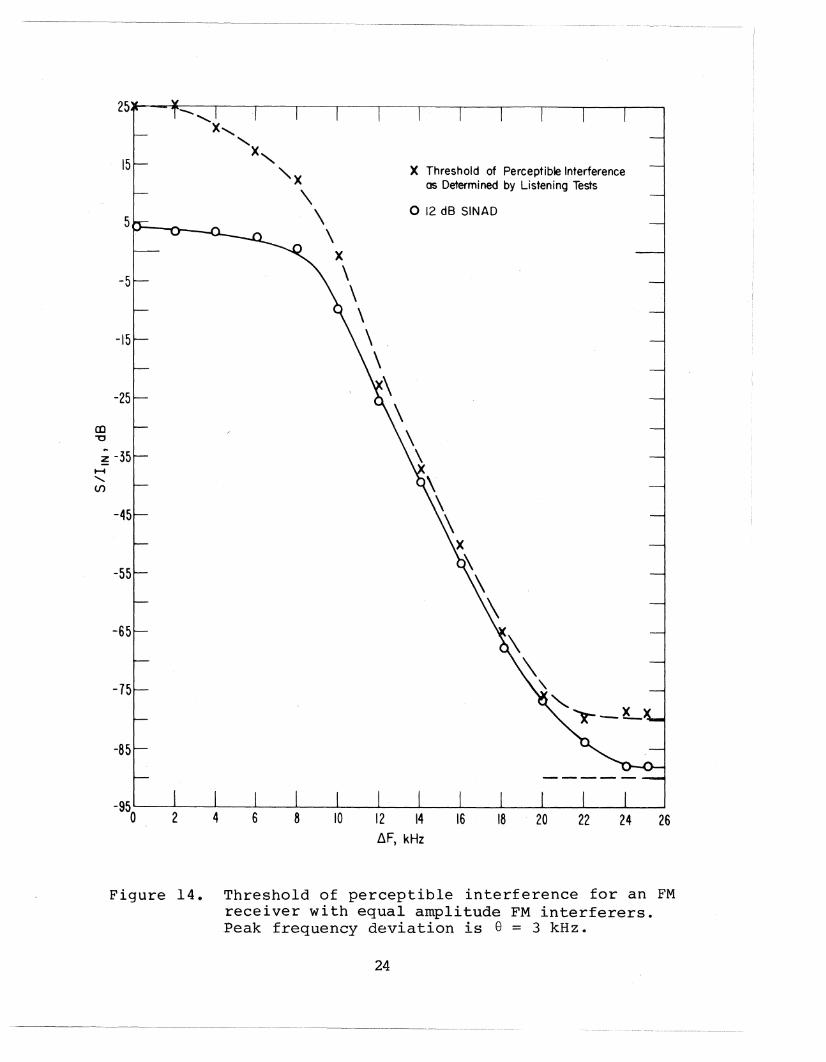
Results of the audio tests with one and two equal
amplitude interferers is shown in Figures 13 and 14
respectively. The peak frequency deviation of both desired
and interfering FM generators is e = 3 kHz. Also shown in
the figures is the SINAD = 12 dB curves that were described
previously. In Figure 13, the threshold of perceptible
22
X Threshold of Perceptible Interferenceas Determined by Listening Tests
o 12 dB SINAD
15
5
-5
-85
-75
-65
-15 x\\
-25 \CD \'U \~ -35 X~ \<,(/)
\-45 \
\
-55
2 4 6 8 10 12 14tlf, kHz
16 18 20 22 24 26
Figure 13. Threshold of perceptible interference for anFM receiver with a single FM interferer. Peakfrequency deviation is 8 = 3 kHz.
23
15
-5
-15
-25
CD-0
~ -35H<,(J)
-45
-55
-65
X Threshold of Perceptible Interferenceas Determined by Listening Tests
o 12 dB SINAD
-75
-85
2 4 6 8 10 12 14ilF, kHz
16 18 20 22 24 26
Figure 14. Threshold of perceptible interference for an FMreceiver with equal amplitude FM interferers.Peak frequency deviation is e = 3 kHz.
24
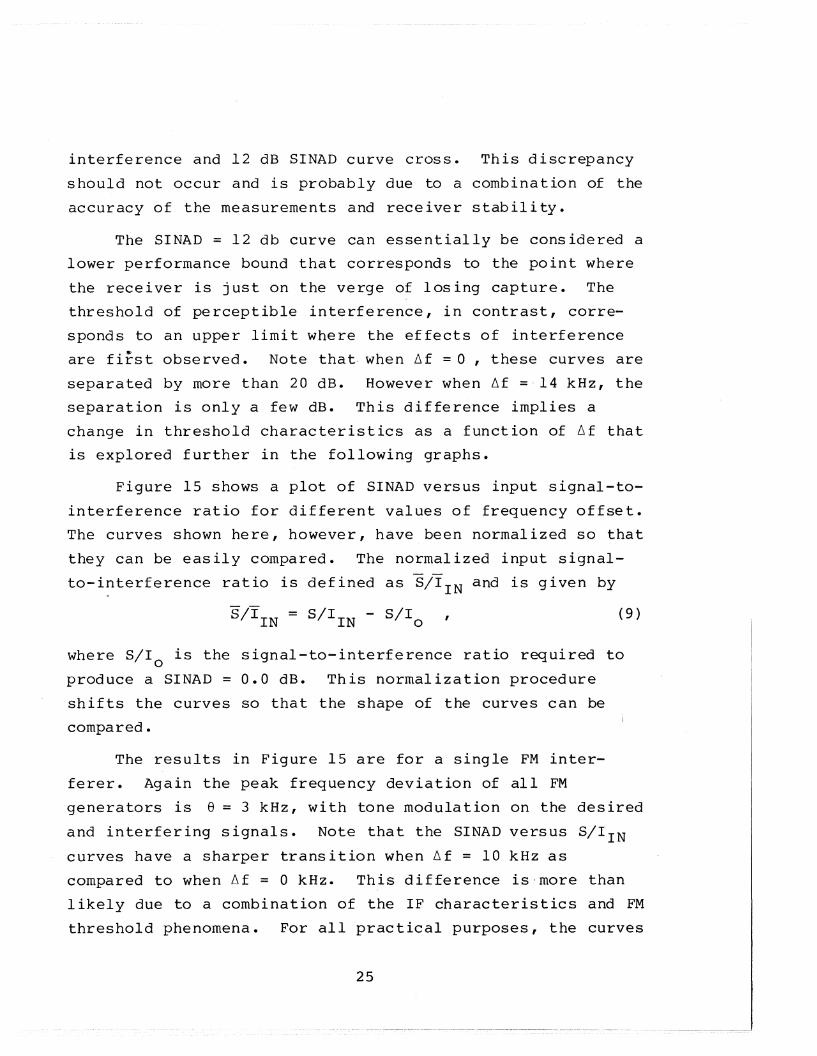
interference and 12 dB SINAD curve cross. This discrepancy
should not occur and is probably due to a combination of the
accuracy of the measurements and receiver stability.
The SINAD = 12 db curve can essentially be considered a
lower performance bound that corresponds to the point where
the receiver is just on the verge of losing capture. The
threshold of perceptible interference, in contrast, corre
sponds to an upper limit where the effects of interference
are fi~st observed. Note that when ~f = 0 , these curves are
separated by more than 20 dB. However when ~f =,14 kHz, the
separation is only a few dB. This difference implies a
change in threshold characteristics as a function of ~f that
is explored further in the following graphs.
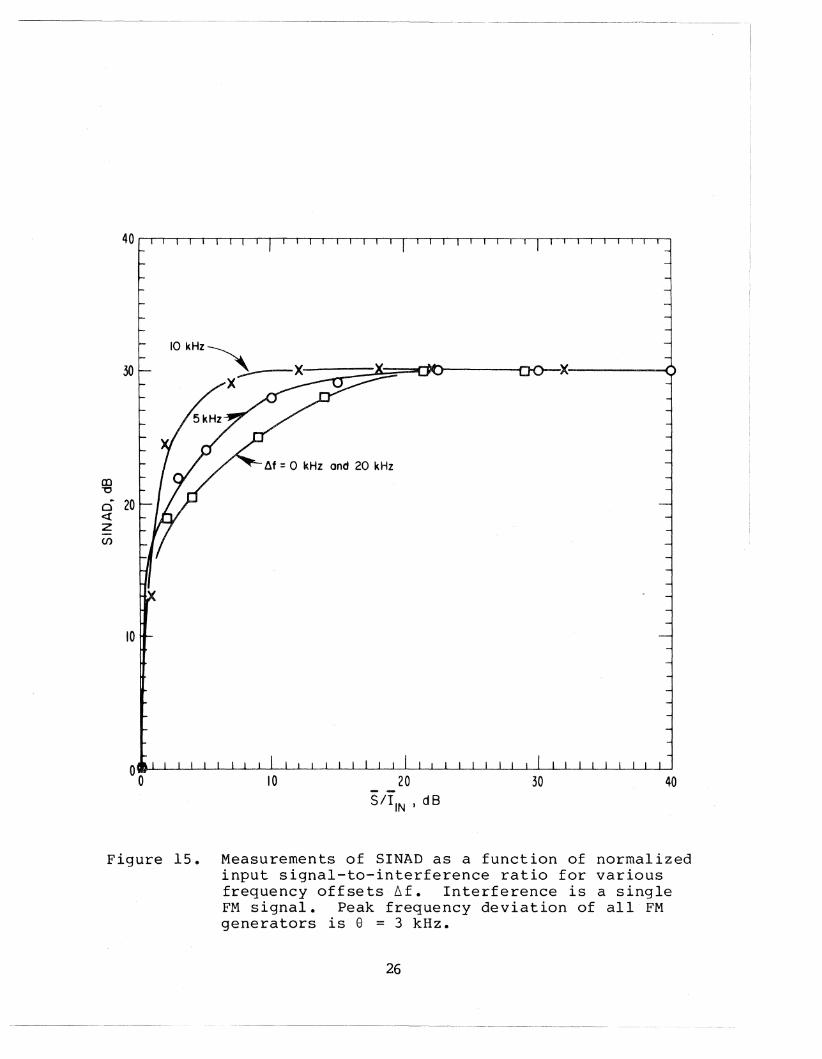
Figure 15 shows a plot of SINAD versus input signal-to
interference ratio for different values of frequency offset.
The curves shown here, however, have been normalized so that
they can be easily compared. The normalized input signal
to-interference ratio is defined as SjIIN and is given by
S/IIN = S/IIN - S/Io (9)
where S/Io is the signal-to-interference ratio required to
produce a SINAD = 0.0 dB. This normalization procedure
shifts the curves so that the shape of the curves can be
compared.
The results in Figure 15 are for a single FM inter
ferer. Again the peak frequency deviation of all FM
generators is e = 3 kHz, with tone modulation on the desired
and interfering signals. Note that the SINAD versus S/IIN
curves have a sharper transition when ~f = 10 kHz as
compared to when ~f = 0 kHz. This difference is·more than
likely due to a combination of the IF characteristics and FM
threshold phenomena. For all practical purposes, the curves
25
30
CD~
o 20<t2(f)
10
10kHz~~
~X---=::'-:A:;;;=:::a[]P'( """'----..-~X
~f =0 kHz and 20 kHz
x------.......
10 20S/IIN ) dB
30 40
Figure 15. Measurements of SINAD as a function of normalizedinput signal-to-interference ratio for variousfrequency offsets ~f. Interference is a singleFM signal. Peak frequency deviation of all FMgenerators is e = 3 kHz.
26
with ~f = a and 20 kHz are identical, and therefore, only
the ~f = 0 kHz curve is shown in the figure.
4. SPECTRUM PHOTOGRAPHS
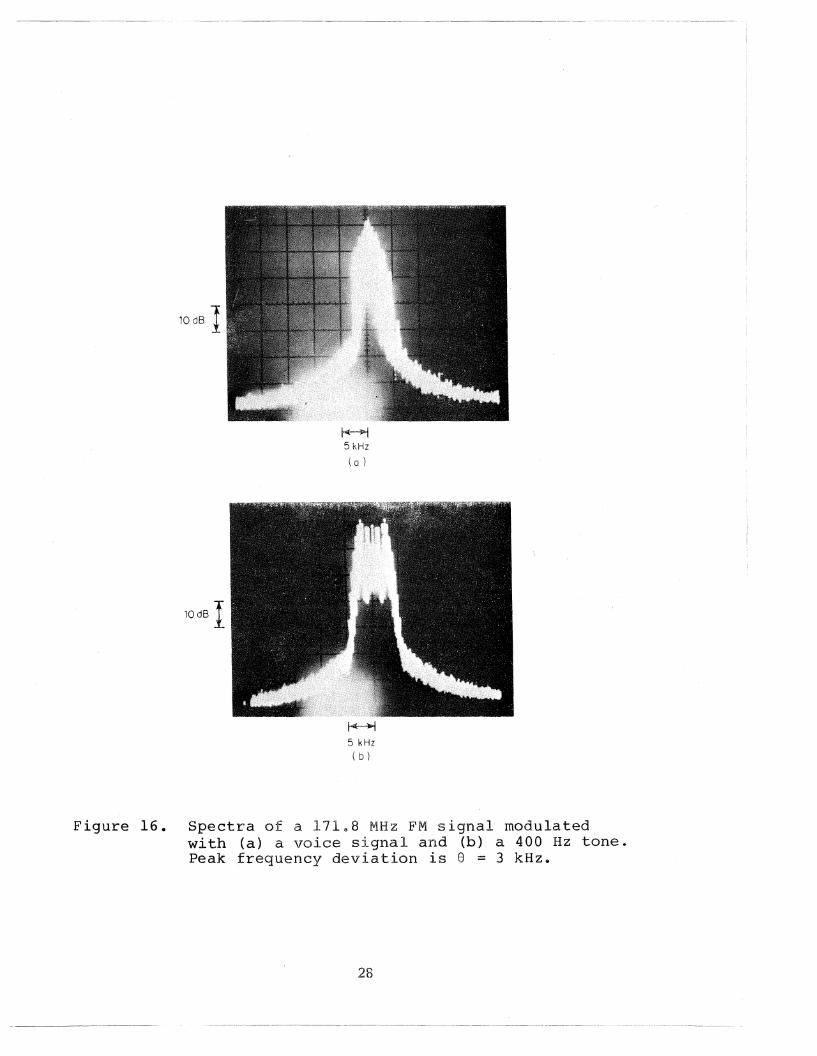
Photographs of the spectra of the interfering FM
signals are shown in Figure 16. Figure l6(a) shows the
spectrum of a voice modulated, interfering PM signal with a
peak frequency deviation of 8 = 3 kHz, while 16 (b) shows
the spectra with 400 Hz tone modulation.
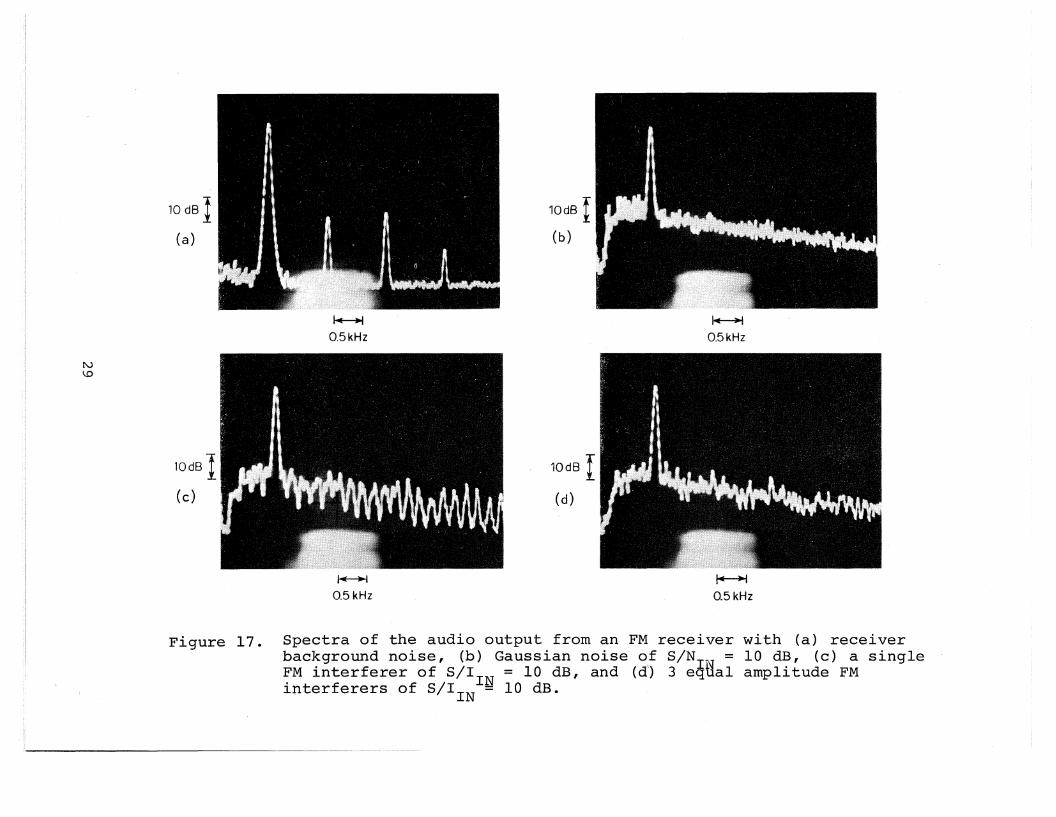
The spectra of the audio output from the receiver is
shown in Figures 17 and 18. In Figure l7(a) the audio
output spectrum is shown with only receiver background
noise. The fundamental and harmonic output due to the
1000 Hz modulation can be clearly seen. In Figure l7(b)
Gaussian noise of S/N I N = 10 dB is the interfering source.
Figure 17 (c) is similar except that now a single FM
interferer of S/IIN = 10 dB replaces the Gaussian noise.
The last photograph in this series shows three equal
amplitude interferers of S/IIN = 10 dB. The peak frequency
deviation of all FM signals in Figure 17 is e = 3 kHz. Note
the s i mi I ar i t.y between Gaussian noise and FM interference as
shown in (b), (c), and (d).
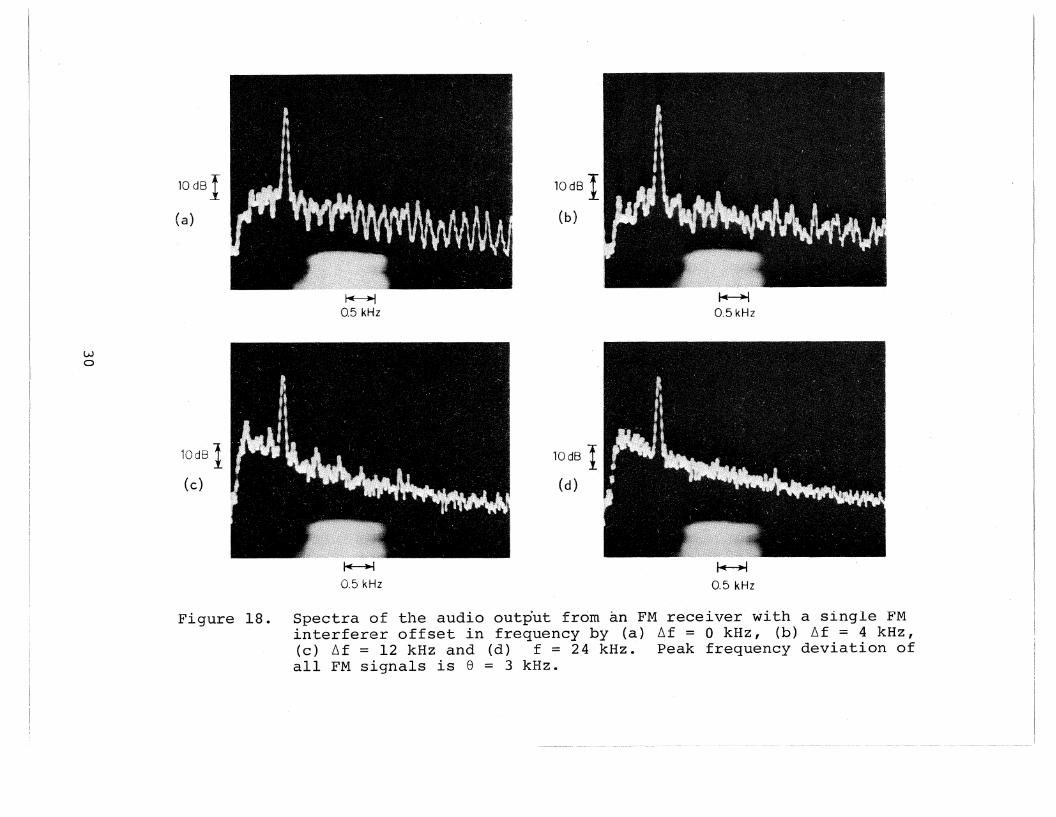
Figure 18 shows similar results as a function of
frequency offset ~f. Spectra of the audio output signal are
shown for a single FM interferer at frequency offsets of 0,
4, 12, and 24 kHz. All spectra are the result of 1000 Hz
modulation on the desired FM signal and 400 Hz modulation on
the interfering FM signal. The peak frequency deviation is
e = 3 'kHz. The value of S/IIN was varied during these tests
to maintain a constant output SINAD.
27
10dS 1
io ee I
~5 kHz
~
5 kHz( b)
Figure 16. Spectra of a 171~8 MHz FM signal modulatedwith (a) a voice signal and (b) a 400 Hz tone.Peak frequency deviation is e = 3 kHz.
28
lOdB I(a)
k--+IO.5kHz
10dB I(b)
~
0.5 kHz
l\J\0
lOdB I(c)
~
0.5 kHz
10dB I(d)
J+--+I0.5 kHz
Figure 17. Spectra of the audio output from an FM receiver with (a) receiverbackground noise, (b) Gaussian noise o;f S/N
1N= 10 dB, (c) a single
FM interferer of S/IIN = 10 dB, and (d) 3 eqbal amplitude FMinterferers of S/IIN = 10 dB.
wo
toasI(a)
ioes I(c)
.~
0.5 kHz
.~
'0.5 kHz
ladB I(b)
lOdB I(d)
~
0.5 kHz
0.5 kHz
Figure lB. Spectra of the audio output from an FM receiver with a single FMinterferer offset in frequency by (a) ~f = 0 kHz, (b) ~f = 4 kHz,(c) ~f = 12 kHz and (d) f = 24 kHz. Peak frequency deviation ofall FM signals is e = 3 kHz.
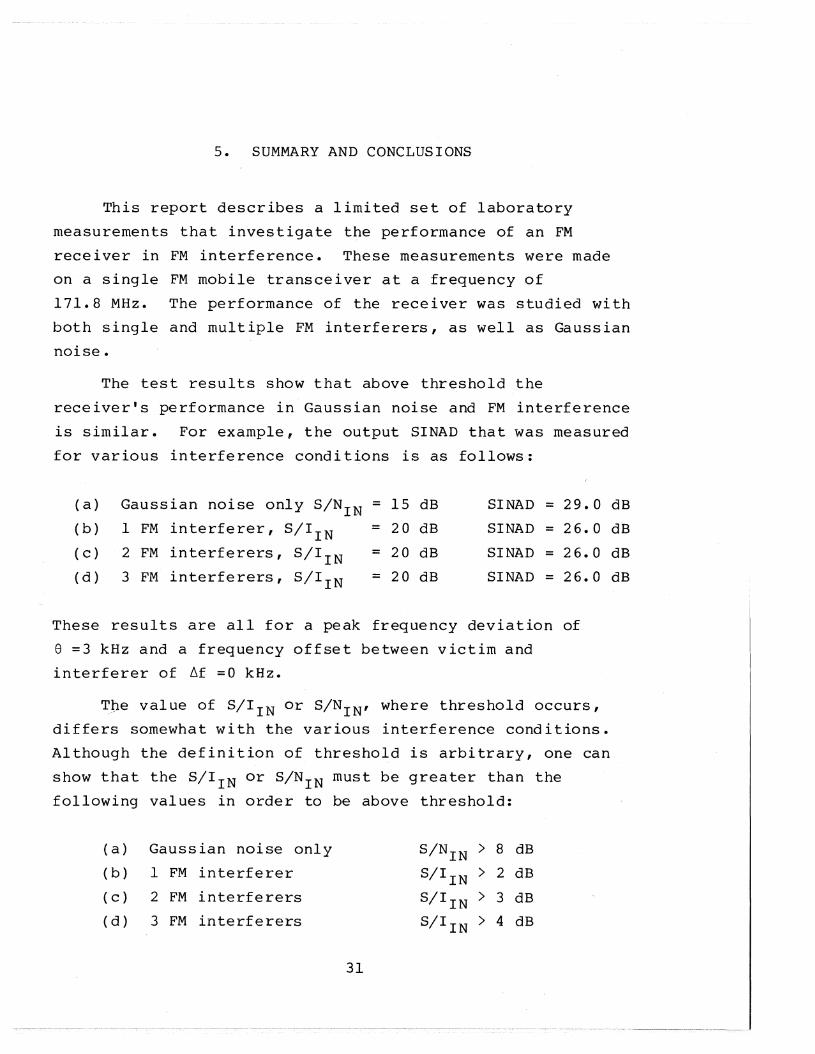
5. SUMMARY AND CONCLUSIONS
This report describes a limited set of laboratory
measurements that investigate the performance of an FM
receiver in FM interference. These measurements were made
on a single FM mobile transceiver at a frequency of
171.8 MHz. The performance of the receiver was studied with
both single and multiple FM interferers, as well as Gaussian
noise.
The test results show that above threshold the
receiver's performance in Gaussian noise and FM interference
is similar. For example, the output SINAD that was measured
for various interference conditions is as follows:
(a) Gaussian noise only S/NI N = 15 dB SINAD = 29.0 dB
(b) 1 FM in terfe rer , S/IIN = 20 dB SINAD = 26.0 dB
( c) 2 FM interferers, S/IIN = 20 dB SINAD = 26.0 dB
(d) 3 FM interferers, S/IIN = 20 d-B SINAD = 26.0 dB
These results are all for a peak frequency deviation of
e =3 kHz and a frequency offset between victim and
interferer of ~f =0 kHz.
~~e value of S/IIN or S/NI N, where threshold occurs,
differs somewhat with the various interference conditions.
Although the definition of threshold is arbitrary, one can
show that the S/IIN or S/N I N must be greater than the
following values in order to be above threshold:
(a) Gaussian noise only S/N1 N > 8 dB
(b) 1 FM interferer S/IIN > 2 dB
(c ) 2 FM interferers S/IIN > 3 dB
(d) 3 FM interferers S/IIN > 4 dB
31
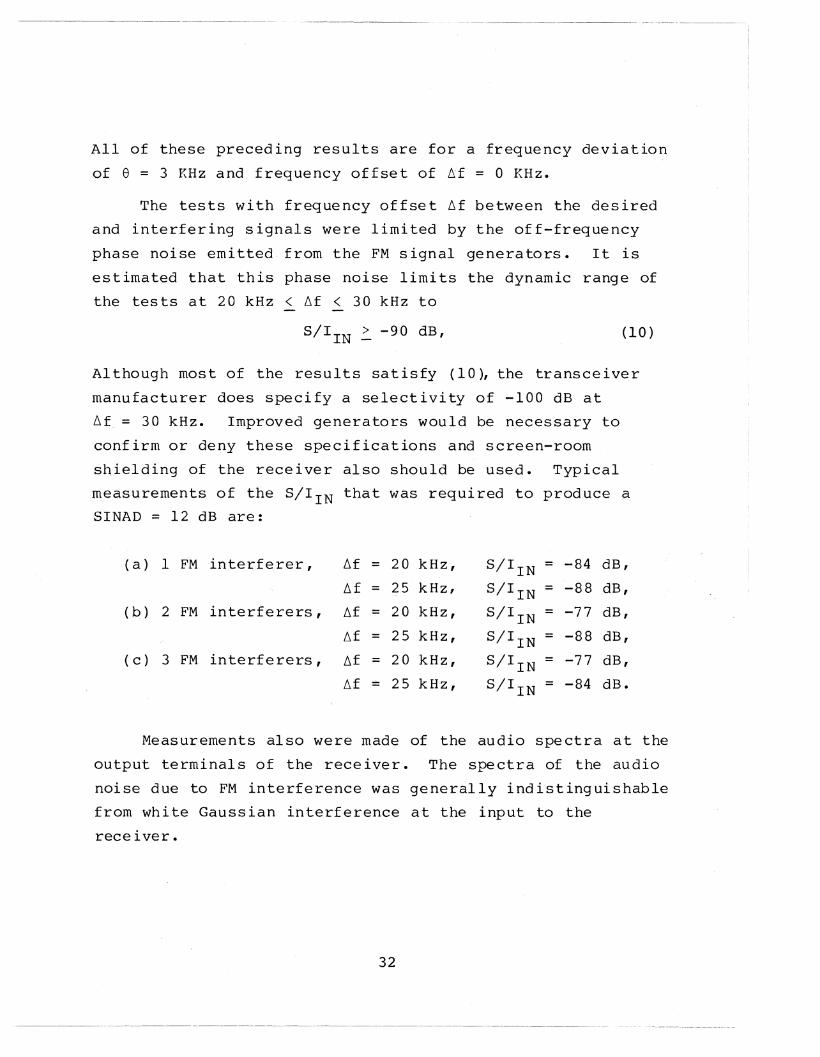
All of these preceding results are for a frequency deviation
of 8 = 3 KHz and frequency o~fset of ~f = 0 KHz.
The tests with frequency offset ~f between the desired
and interfering signals were limited by the off-frequency
phase noise emitted from the FM signal generators. It is
estimated that this phase noise limits the dynamic range of
the tests at 20 kHz < ~f < 30 kHz to
S/IIN .:. -90 dB, (10)
Although most of the results satisfy (10), the transceiver
manufacturer does specify a selectivity of -100 dB at
~f_ = 30 kHz. Improved generators would be necessary to
confirm or deny these specifications and screen-room
shielding of the receiver also should be used. Typical
measurements of the S/IIN that was required to produce a
SINAD = 12 dB are:
(a) 1 FM interferer, ~f = 20 kHz, S/IIN = -84 dB,
~f = 25 k Hz , S/IIN = -88 dB,
(b) 2 FM interferers, ~f = 20 kHz, S/IIN = -77 dB,
~f = 25 kHz, S/IIN = -88 dB,
( c ) 3 FM interferers, ~f = 20 kHz, S/IIN = -77 dB,
l1f - 25 kHz, S/IIN = -84 dB.
Measurements also were made of the audio spectra at the
output terminals of the receiver. The spectra of the audio
noise due to FM interference was generally indistinguishable
from white Gaussian interference at the input to the
receiver.
32
In summary, the test results with FM interference
showed only minor differences between co-channel FM
interference and white Gaussian interference of equal power.
This is true, however, only when the input signal-to
interference ratio S/IIN is greater than threshold. The
value of this threshold is different for FM interference as
compared to Gaussian noise. Threshold values with a single
FM interferer were generally 5 or 6 dB lower than those with
white Gaussian noise.
6. REFERENCES
Electronic Industries Association (1972), Minimum standards for
land mobile communication FM or PM receivers; 25-970 MHz;
RS-204-A; July.
33

FORM OT-29(3-731
U.S. DEPARTMENT OF COMMERCEOFFICE OF TELECOMMUNICATIONS
BIBLIOGRAPHIC DATA SHEET
1. PUBLICATION OR REPORT NO 2. Govt Acce s s ion No.3. Rec-ipient's Accession No.
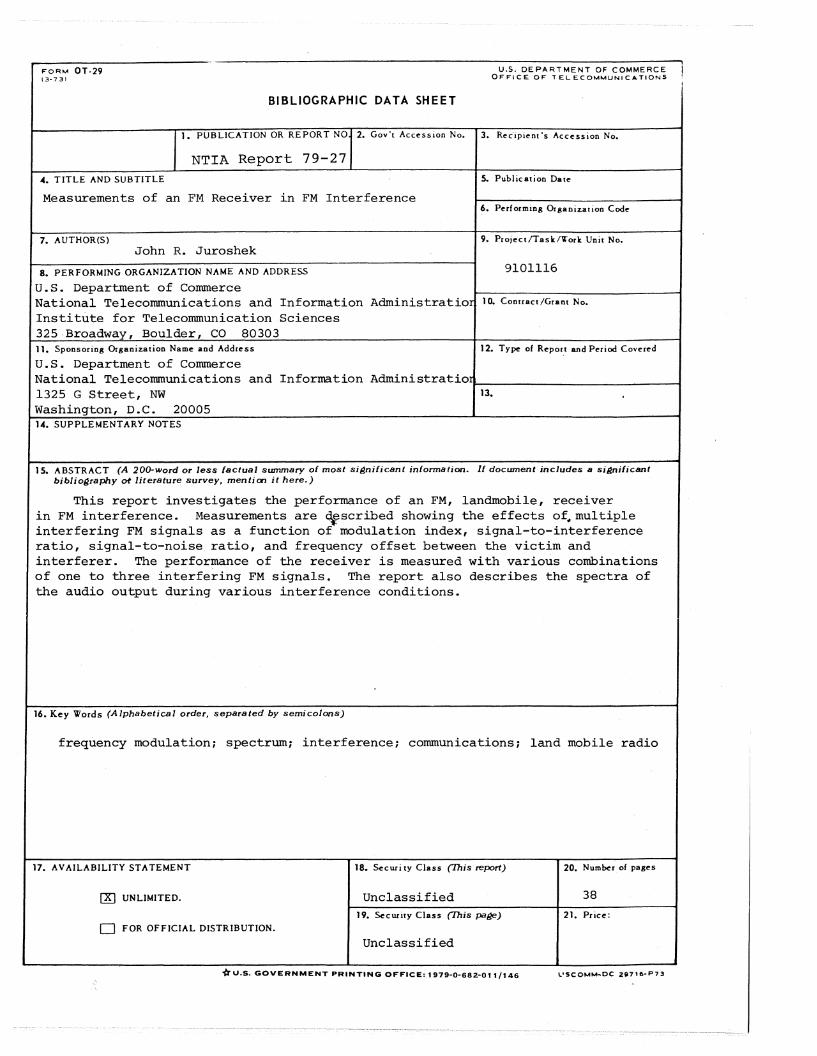
NTIA Report 79-27... TITLE AND SUBTITLE
Measurements of an FM Receiver in FM Interference
7. AUTHOR(S)John R. Juroshek
S. Publication Date
6. Performing Organization Code
9. ProjectlTask/'l"ork Unit No.
91011168. PERFORMING ORGANIZATION NAME AND ADDRESS
U.S. Department of CommerceNational Telecommunications and Information Administratior 10. Contract/Grant No.
Institute for Telecommunication Sciences325-Broadway, Boulder, CO 8030311. Sponsoring Organization Name and Address 12. Type of Report and Period Covered
U.S. Department of CommerceNational Telecommunications and Information Administratior_~ ~ ~
1325 G Street, NW 13.
Washington, D.C. 2000514. SUPPLEMENTARY NOTES
1S. ABSTRACT (A 20o-word or less factual summery of most si~nificant iniormation, If document includes a si~nificant
bjbljo~raphy ot literature survey, men ti ca it here.)
This report investigates the performance of an FM, landmobile, receiverin FM interference. Measurements are ~scribed showing the effects of~multiple
interfering FM signals as a function of modulation index, signal-to-interferenceratio, signal-to-noise ratio, and frequency offset between the victim andinterferer. The performance of the receiver is measured with various combinationsof one to three interfering FM signals. The report also describes the spectra ofthe audio output during various interference conditions.
16. Key Words (Alphabetical order, separated by semicolons)
frequency modulation; spectrum; interference; communications; land mobile radio
17. AVAILABILITY STATEMENT
IKl UNLIMITED.
o FOR OFFICIAL DISTRIBUTION.
18. Se c ur i ty Class (This report)
Unclassified19. Se c ur ity Class (Thie page)
Unclassified
20. Number of pages
38
21. Price:
{r u.s. GOVERNMENT PRINTING OFFICE:.1979-0-682-011/146 l'5COMM.. OC 2;716· P73