
Measurement validation peak load reduction
19
Measurement & Validation of Peak Load Reduction Jeremy Carden, P.E. Lead Volt/VAR Engineer Duke Energy Dragan Popovic, Ph.D. Executive Vice President – Smart Grid IT Schneider Electric 1 February 4, 2015
-
Upload
schneider-electric -
Category
Technology
-
view
248 -
download
3
Transcript of Measurement validation peak load reduction
Measurement & Validation of Peak Load Reduction
Jeremy Carden, P.E.
Lead Volt/VAR Engineer
Duke Energy
Dragan Popovic, Ph.D.
Executive Vice President – Smart Grid IT
Schneider Electric
1
February 4, 2015

Presentation Summary
Introduction to Duke’s DSDR system
Implementation Details
Duke’s M&V Approach
Benefits to Duke
Productizing the Solution
Conclusions
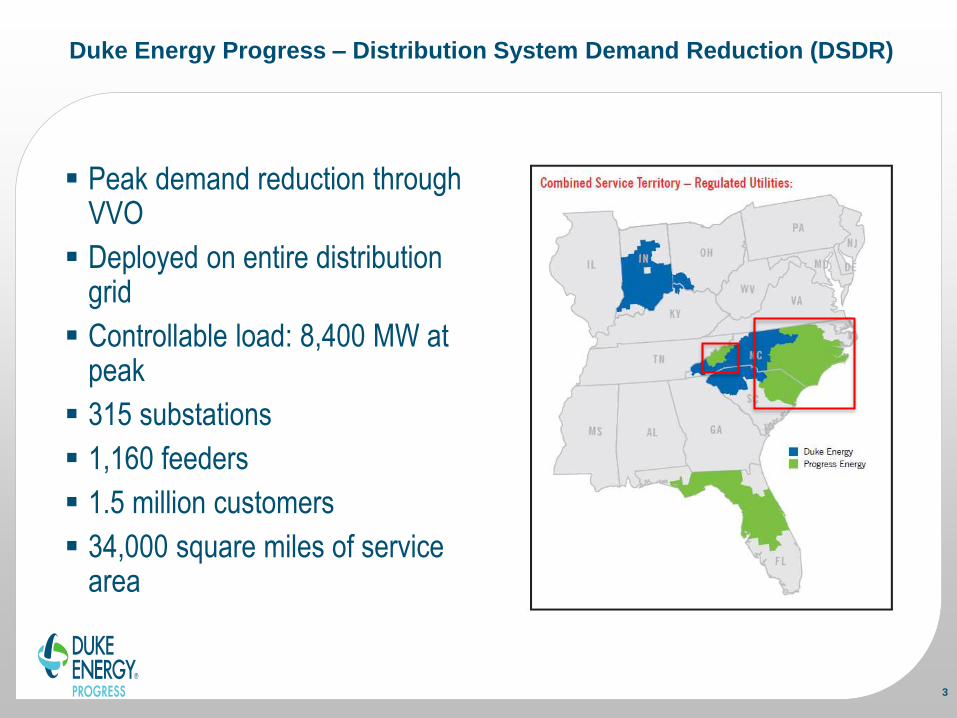
Duke Energy Progress – Distribution System Demand Reduction (DSDR)
Peak demand reduction through VVO
Deployed on entire distribution grid
Controllable load: 8,400 MW at peak
315 substations
1,160 feeders
1.5 million customers
34,000 square miles of service area
3
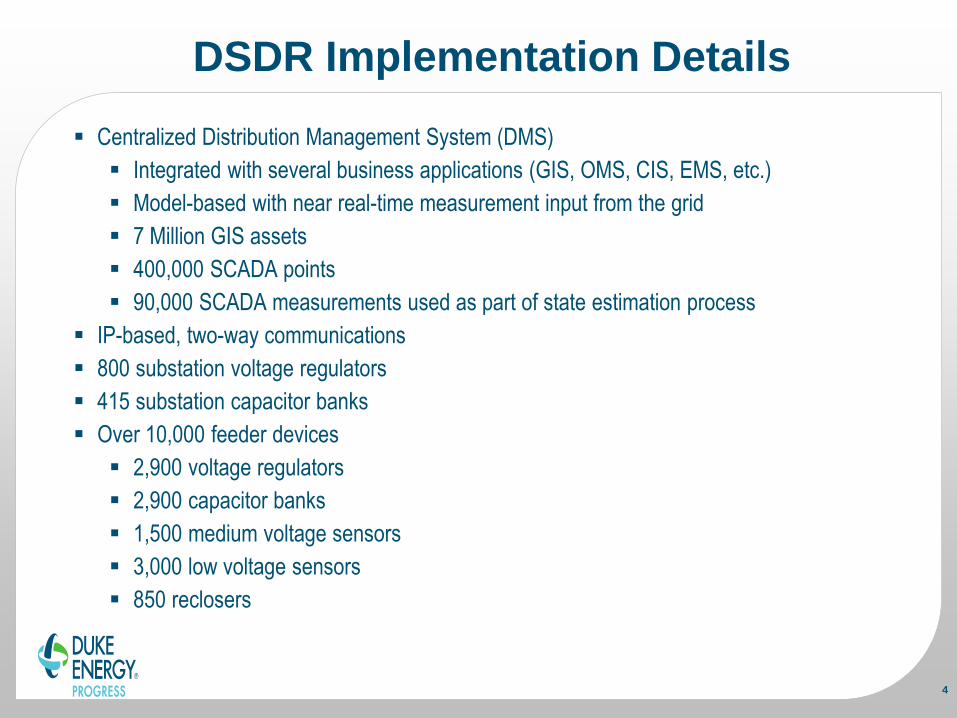
DSDR Implementation Details
Centralized Distribution Management System (DMS)
Integrated with several business applications (GIS, OMS, CIS, EMS, etc.)
Model-based with near real-time measurement input from the grid
7 Million GIS assets
400,000 SCADA points
90,000 SCADA measurements used as part of state estimation process
IP-based, two-way communications
800 substation voltage regulators
415 substation capacitor banks
Over 10,000 feeder devices
2,900 voltage regulators
2,900 capacitor banks
1,500 medium voltage sensors
3,000 low voltage sensors
850 reclosers
4

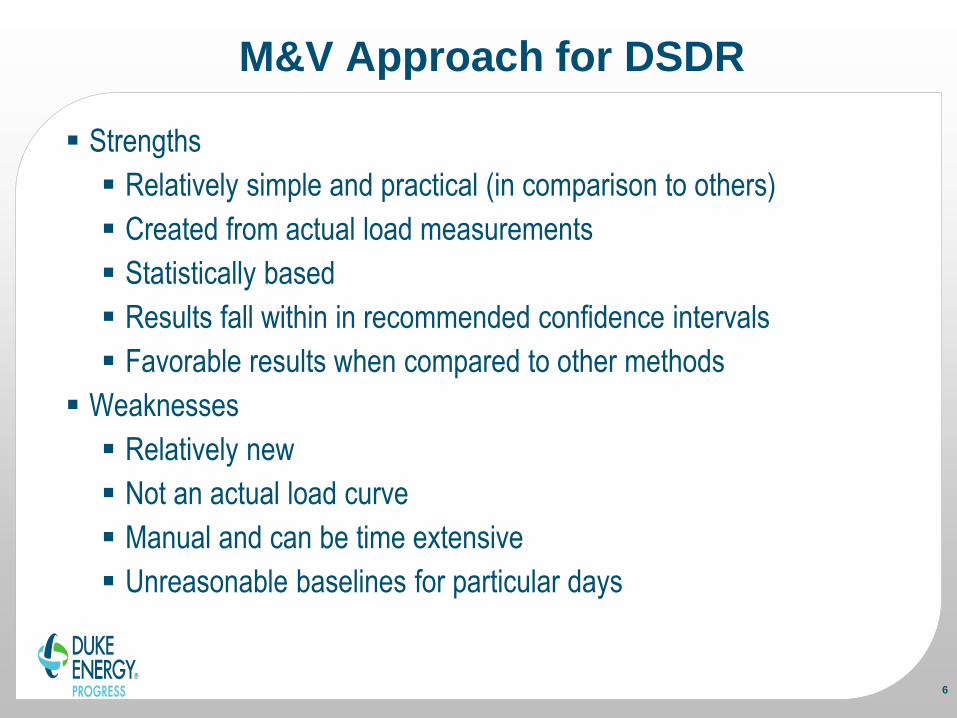
M&V Approach for DSDR
Post-activation analysis developed by Duke in 2013
Creates a baseline estimate by applying a polynomial regression to pre-activation load measurements
Primarily evaluated at the system level
Performed on data captured directly from DMS (before/during/after)
Data requirements
Frequent sample rate (typically 30 seconds)
3 – 6 hours of pre-activation data (winter vs. summer peak)
5 – 13 hours of total data (winter vs. summer peak)
5
M&V Approach for DSDR
Strengths
Relatively simple and practical (in comparison to others)
Created from actual load measurements
Statistically based
Results fall within in recommended confidence intervals
Favorable results when compared to other methods
Weaknesses
Relatively new
Not an actual load curve
Manual and can be time extensive
Unreasonable baselines for particular days
6

2014 Polar Vortex Example
7

2014 Summer Example
8

Results/Benefits
Validation of 316 MW of peak demand reduction
Avoided peak energy production cost estimates
DSDR business case deferred construction of two peaking CT generation units
Validation of 178 MW of peak spinning reserves (non-optimized voltage reduction)
Avoided energy production cost estimates
Validation of benefit from emergency voltage reduction activations
Example is 2014 Polar Vortex that helped DEP avoid shedding firm load
Development of hourly forecast models
Aids in planning and economical dispatch order of resources
9

Conclusions
Continual application and refinement is a necessity
Compare and contrast against other methods
Duke has utilized 3 different methods
Provides validation of results
Data, Data, Data
Need the tools and resources to collect, extract, and retain
Not only for benefit but also for system performance (identifying issues)
Visibility into the state of the grid during activation
Availability of resources (circuits and devices)
Communications status
Event/command logs
10

Productization – ADMS
●Software solution that integrates SCADA/DMS/OMS/DSM into one product – IT/OT
convergence
●Managing one network model for all operations based on the GIS
●One user interface familiar to all users within utility
●One data base and one security
●Functionality
● Network monitoring and management
● Improved management of alarming, tagging and history
● Validation of switching operations
● Basic calculations (load flow, state estimation) and network optimization applications
● Closed loop execution (VVO, FLISR)
● Distribution training simulator (DTS)
● Distribution network planning and design tool
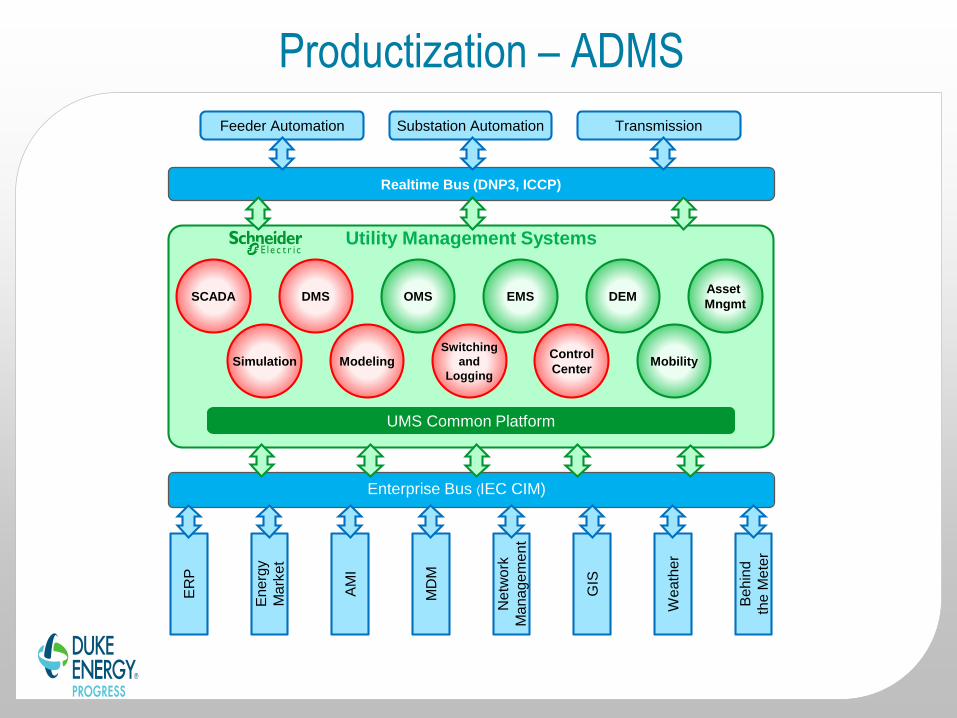
Productization – ADMS
Realtime Bus (DNP3, ICCP)
Utility Management Systems
DMSSCADA OMS
Control
Center
Switching
and
Logging
EMS
Simulation Modeling
DEMAsset
Mngmt
Mobility
Feeder Automation Substation Automation Transmission
Enterprise Bus (IEC CIM)
ER
P
En
erg
y
Ma
rke
t
GIS
Ne
two
rk
Ma
na
ge
me
nt
AM
I
We
ath
er
MD
M
Be
hin
d
the M
ete
r
UMS Common Platform

Productization – VVO Closed loop
●Configuration
●Profiles – presets of VVO configuration managed by grid engineers
●Control & Monitoring
●24/7 operation control
●Automatic verification of command execution
●Overview of devices availability and commanding
●Modes: Loss Optimization, DSDR, Emergency, Storm
●Manual execution on request
●Off-line and real-time analysis of VVO decisions

Productization – VVO Closed Loop
DMS
Distribution Management System
1. Field data collecting
2. Real-time analysis
3. Decision making
4. Commands executing
Regulator Capacitor
SUB
DSCADATap Lines
Phase Additions
Sensors
AMI

Productization – VVO & DSDR
●VVO optimizes network state in all load conditions
● Normal load
●Reduces losses, provides VAR support
●Energy savings vs. energy charging
● Heavy load
●Peak load shaving
●Avoids high cost of peak spinning reserves
●Avoids load shedding in emergency situations
●Achieved benefits
● Loss Optimization – continuous VAR support for transmission needs
● DSDR – 250 MW demand reduction benefit – summer 2014
● Emergency – level 2 implements 250 MW reduction during cold wave – January 2014

Productization – VVO & DSDR
WP Losses
WP Benefits
Achieved

Productization – Network model data challenge
●Quality of calculated state depends on accuracy of GIS data
●Good quality of calculated state needed for VVO multi-objective decisions (LO,
DSDR)
●To include more VVO single objective approaches based on basic network model &
topology, SCADA measurements, smart meters
● Implementation of VVO in phases, on different parts of network
●Gaining benefit in earlier phases prior to data improvement
●To support automatic detection of parts of network ready for multi-objective VVO with
full benefit
Productization – Conclusions
● ADMS – comprehensive, real-time solution for network management and design
● Productization of ADMS with VVO Closed Loop – DSDR
● VVO – continuous process that optimizes power grid 24/7
● DSDR project – measurable and verified benefits of implementation of VVO
● Loss Optimization/VAR support
● DSDR – peak shaving
● Emergency
● New ideas for software solution from DSDR project
● Automatic support for different quality of network model data
● New ways of calculating and reporting benefit
18

19
Jeremy D. Carden, P.E.
Dragan Popovic, Ph.D.


