Measurement of Transfer and Development Lengths of 0.7 in ...
178
University of Arkansas, Fayetteville University of Arkansas, Fayetteville ScholarWorks@UARK ScholarWorks@UARK Graduate Theses and Dissertations 5-2015 Measurement of Transfer and Development Lengths of 0.7 in. Measurement of Transfer and Development Lengths of 0.7 in. Strands on Pretensioned Concrete Elements Strands on Pretensioned Concrete Elements Canh Ngoc Dang University of Arkansas, Fayetteville Follow this and additional works at: https://scholarworks.uark.edu/etd Part of the Civil Engineering Commons, and the Transportation Engineering Commons Citation Citation Dang, C. N. (2015). Measurement of Transfer and Development Lengths of 0.7 in. Strands on Pretensioned Concrete Elements. Graduate Theses and Dissertations Retrieved from https://scholarworks.uark.edu/etd/1076 This Dissertation is brought to you for free and open access by ScholarWorks@UARK. It has been accepted for inclusion in Graduate Theses and Dissertations by an authorized administrator of ScholarWorks@UARK. For more information, please contact [email protected].
Transcript of Measurement of Transfer and Development Lengths of 0.7 in ...
University of Arkansas, Fayetteville University of Arkansas, Fayetteville
ScholarWorks@UARK ScholarWorks@UARK
Graduate Theses and Dissertations
5-2015
Measurement of Transfer and Development Lengths of 0.7 in. Measurement of Transfer and Development Lengths of 0.7 in.
Strands on Pretensioned Concrete Elements Strands on Pretensioned Concrete Elements
Canh Ngoc Dang University of Arkansas, Fayetteville
Follow this and additional works at: https://scholarworks.uark.edu/etd
Part of the Civil Engineering Commons, and the Transportation Engineering Commons
Citation Citation Dang, C. N. (2015). Measurement of Transfer and Development Lengths of 0.7 in. Strands on Pretensioned Concrete Elements. Graduate Theses and Dissertations Retrieved from https://scholarworks.uark.edu/etd/1076
This Dissertation is brought to you for free and open access by ScholarWorks@UARK. It has been accepted for inclusion in Graduate Theses and Dissertations by an authorized administrator of ScholarWorks@UARK. For more information, please contact [email protected].
Measurement of Transfer and Development Lengths of 0.7 in. Strands on Pretensioned Concrete Elements
Measurement of Transfer and Development Lengths of 0.7 in. Strands on Pretensioned Concrete Elements
A dissertation submitted in partial fulfillment of the requirements for the degree of
Doctor of Philosophy in Civil Engineering
by
Canh Ngoc Dang Ho Chi Minh City University of Technology
Bachelor of Engineering in Civil Engineering, 2009 Ho Chi Minh City University of Technology
Master of Engineering in Civil Engineering, 2011
May 2015 University of Arkansas
This dissertation is approved for recommendation to the Graduate Council. Dr. Micah Hale Dissertation Director Dr. Ernie Heymsfield Dissertation Committee
Dr. Douglas Spearot Dissertation Committee
Dr. Daniel Luecking Dissertation Committee
Dr. J.R. Martí-Vargas Dissertation Committee
Abstract
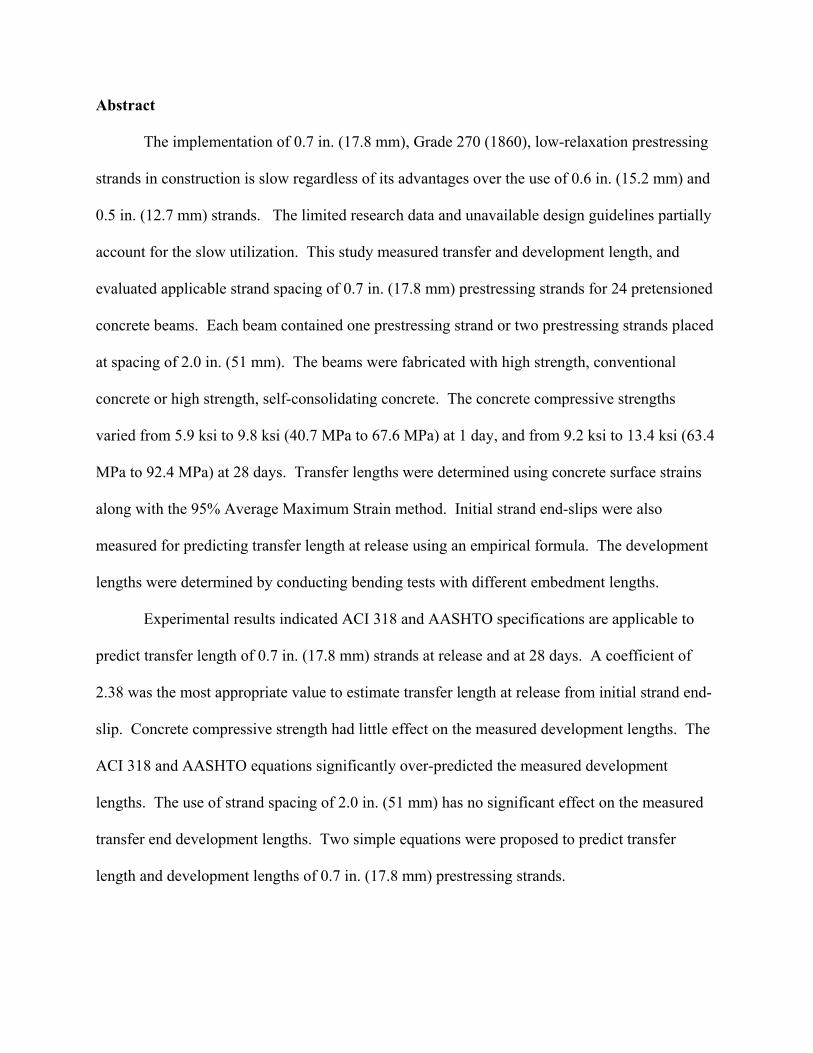
The implementation of 0.7 in. (17.8 mm), Grade 270 (1860), low-relaxation prestressing
strands in construction is slow regardless of its advantages over the use of 0.6 in. (15.2 mm) and
0.5 in. (12.7 mm) strands. The limited research data and unavailable design guidelines partially
account for the slow utilization. This study measured transfer and development length, and
evaluated applicable strand spacing of 0.7 in. (17.8 mm) prestressing strands for 24 pretensioned
concrete beams. Each beam contained one prestressing strand or two prestressing strands placed
at spacing of 2.0 in. (51 mm). The beams were fabricated with high strength, conventional
concrete or high strength, self-consolidating concrete. The concrete compressive strengths
varied from 5.9 ksi to 9.8 ksi (40.7 MPa to 67.6 MPa) at 1 day, and from 9.2 ksi to 13.4 ksi (63.4
MPa to 92.4 MPa) at 28 days. Transfer lengths were determined using concrete surface strains
along with the 95% Average Maximum Strain method. Initial strand end-slips were also
measured for predicting transfer length at release using an empirical formula. The development
lengths were determined by conducting bending tests with different embedment lengths.
Experimental results indicated ACI 318 and AASHTO specifications are applicable to
predict transfer length of 0.7 in. (17.8 mm) strands at release and at 28 days. A coefficient of
2.38 was the most appropriate value to estimate transfer length at release from initial strand end-
slip. Concrete compressive strength had little effect on the measured development lengths. The
ACI 318 and AASHTO equations significantly over-predicted the measured development
lengths. The use of strand spacing of 2.0 in. (51 mm) has no significant effect on the measured
transfer end development lengths. Two simple equations were proposed to predict transfer
length and development lengths of 0.7 in. (17.8 mm) prestressing strands.

© 2015 by Canh Ngoc Dang All Rights Reserved

Acknowledgments
I would like to thank the staff of the Graduate School at the University of Arkansas. This
dissertation would not have been possible without their help.
I am extremely grateful to Dr. Micah Hale for his support and encouragement. It is
difficult to express the gratitude to what he did, he does, and he is doing for me. He has changed
my life forever.
I would like to thank my committee members: Dr. Ernie Heymsfield, Dr. Douglas
Spearot, Dr. Daniel Luecking, and Dr. J.R. Martí-Vargas. Their contributions made this
dissertation better than it should be.
This research cannot be completed without the assistance of a number of individuals at
the Department of Civil Engineering. I would like to thank: Richard Deschenes Jr., Cameron
Murray , Joseph Daniels III, William Phillips, Doddridge Davis, Alberto Ramirez, and Ryan
Hagedorn. They helped me cast and test all the beams during a hot summer in 2014. I also
would like to thank David Peachee for his assistant in technical issues and the use of his
equipment.
I would like to thank my family and friends at the University of Arkansas and the
Virginia Tech for their support and encouragement. I would like to thank Ms. My Hanh for
helping me get through the most difficult times. I also would like to thank Dr. Vu Nguyen for
being my best friend and for sharing valuable life experience and knowledge.
Finally, I would like to thank the Vietnam Education Foundation (VEF) for supporting
my study. I also would like to thank the VEF staff for their assistance.

Dedication
I dedicate this dissertation to my parents, who always encouraged me to complete my Ph.D.
study.
Table of Content
: INTRODUCTION AND RESEARCH OBJECTIVES ................................... 1 CHAPTER 1
Introduction ................................................................................................................... 1 1.1
Conventional Concrete ................................................................................... 1 1.1.1
Self-Consolidating Concrete .......................................................................... 1 1.1.2
Pretensioned Concrete ................................................................................... 2 1.1.3
Transfer Length .............................................................................................. 2 1.1.4
Development length ....................................................................................... 4 1.1.5
Prestressing Strand ......................................................................................... 5 1.1.6
Objectives ..................................................................................................................... 7 1.2
Testing Program ............................................................................................................ 7 1.3
: LITERATURE REVIEW................................................................................... 9 CHAPTER 2
Introduction ................................................................................................................... 9 2.1
Elements of Bond .......................................................................................................... 9 2.2
Pull out Test ................................................................................................................ 12 2.3
Research on Bond of Prestressing Strand in Conventional Concrete ......................... 13 2.4
Zia and Moustafa (1977) .............................................................................. 13 2.4.1
Mitchell et al. (1993).................................................................................... 14 2.4.2
Cousins et al. (1990a; 1993; 1990b) ............................................................ 15 2.4.3
Logan (1997) ................................................................................................ 16 2.4.4
Rose and Russell (1997) .............................................................................. 16 2.4.5
Ramirez and Russell (2008) ......................................................................... 17 2.4.6
Research on Bond of Prestressing Strand in SCC ...................................................... 18 2.5
Benefit of SCC ............................................................................................. 18 2.5.1
Engineering Properties ................................................................................. 19 2.5.2
Previous Research on Bond of Prestressing Strand in SCC ........................ 20 2.5.3
Research on Bond of 0.7 in. (17.8 mm) Prestressing Strand ...................................... 24 2.6
Benefit of 0.7 in. (17.8 mm) strand .............................................................. 24 2.6.1
Application of 0.7 in. (17.8 mm) strand in bridge construction .................. 25 2.6.2
Previous Research on Bond of 0.7 in. (17.8 mm) strand ............................. 27 2.6.3
Conclusion .................................................................................................................. 36 2.7
: EXPERIMENTAL PROGRAM ...................................................................... 38 CHAPTER 3
Introduction ................................................................................................................. 38 3.1
Mix design .................................................................................................................. 38 3.2
Overview ...................................................................................................... 38 3.2.1
Mixture proportions ..................................................................................... 39 3.2.2
Concrete compressive strengths ................................................................... 40 3.2.3
Beam specimen testing ............................................................................................... 42 3.3
Beam fabrication .......................................................................................... 42 3.3.1
Transfer length measurements ..................................................................... 44 3.3.2
Strand end-slip measurement ....................................................................... 48 3.3.3
Development length measurements ............................................................. 49 3.3.4
: TRANSFER LENGTH RESULTS .................................................................. 53 CHAPTER 4
Measured transfer lengths ........................................................................................... 53 4.1
Statistical transfer lengths ........................................................................................... 55 4.2

Increase of transfer lengths by time ............................................................................ 57 4.3
Transfer length comparison of CC and SCC .............................................................. 58 4.4
Effect of strand spacing .............................................................................................. 58 4.5
Effect of concrete compressive strengths ................................................................... 59 4.6
Proposed equation of transfer length .......................................................................... 61 4.7
Initial strand end-slips ................................................................................................. 62 4.8
Measured initial strand end-slips ................................................................. 62 4.8.1
Predicted transfer length from initial strand end-slip .................................. 64 4.8.2
Summary and conclusions .......................................................................................... 67 4.9
: DEVELOPMENT LENGTH RESULTS ........................................................ 70 CHAPTER 5
Measured development lengths................................................................................... 70 5.1
N-SCC-S beams ........................................................................................... 70 5.1.1
H-SCC-S beams ........................................................................................... 74 5.1.2
N-CC-S beams ............................................................................................. 77 5.1.3
H-CC-S beams ............................................................................................. 80 5.1.4
H-SCC-D beams .......................................................................................... 83 5.1.5
H-CC-D beams ............................................................................................. 87 5.1.6
Effect of strand spacing .............................................................................................. 89 5.2
Effect of concrete compressive strength ..................................................................... 90 5.3
Proposed equation of development length .................................................................. 91 5.4
Summary ..................................................................................................................... 92 5.5
: SUMMARY AND CONCLUSIONS ............................................................... 94 CHAPTER 6
Summary ..................................................................................................................... 94 6.1
Conclusion .................................................................................................................. 95 6.2
Transfer length ............................................................................................. 95 6.2.1
Development length ..................................................................................... 96 6.2.2
Strand spacing .............................................................................................. 97 6.2.3
REFERENCES ............................................................................................................................ 98
APPENDIX A : BEAM ANALYSIS ....................................................................................... 104
A.1 Cross-section properties ............................................................................................ 104
A.2 Prestress losses .......................................................................................................... 106
A.3 Nominal moment capacity ........................................................................................ 108
A.4 Predicted transfer and development lengths ............................................................. 108
APPENDIX B : TRANSFER LENGTH DATA ..................................................................... 110
B.1 Transfer length measurement .................................................................................... 110
B.1.1 N-CC-S beams ........................................................................................... 110
B.1.2 H-CC-S beams ........................................................................................... 112
B.1.3 H-CC-D beams ........................................................................................... 114
B.1.4 N-SCC-S beams ......................................................................................... 116
B.1.5 H-SCC-S beams ......................................................................................... 118
B.1.6 H-SCC-D beams ........................................................................................ 120
B.2 Transfer length statistics ........................................................................................... 122
B.3 End-slip measurement ............................................................................................... 126
APPENDIX C : DEVELOPMENT LENGTH DATA ........................................................... 127
C.1 Bending test results ................................................................................................... 127
C.1.1 N-SCC-S beams ......................................................................................... 127
C.1.2 H-SCC-S beams ......................................................................................... 132
C.1.3 N-CC-S beams ........................................................................................... 136
C.1.4 H-CC-S beams ........................................................................................... 140
C.1.5 H-SCC-D beams ........................................................................................ 144
C.1.6 H-CC-D beams ........................................................................................... 148
C.2 Development length determination ........................................................................... 152
List of Figures
Figure 1.1 – Transfer and development length diagram. ............................................................... 3
Figure 2.1 – Adhesion bond. ........................................................................................................ 10
Figure 2.2 – Hoyer’s effect. ......................................................................................................... 11
Figure 2.3 – Mechanical interlock. .............................................................................................. 11
Figure 2.4 – Filling concrete in the inverted mold (ASTM C1621 2014). .................................. 20
Figure 2.5 – J-Ring flow after lifting the mold (ASTM C1621 2014). ........................................ 20
Figure 3.1 – Average concrete compressive strengths. ................................................................ 41
Figure 3.4 – Section properties of the beams using one prestressing strand ............................... 42
Figure 3.5 – Section properties of the beams using two prestressing strands .............................. 43
Figure 3.6 – Anchor prestressing strand using chucks (dead end). .............................................. 44
Figure 3.7 – Tension prestressing strands using hydraulic actuator (live end). ........................... 44
Figure 3.8 – Beam preparation. .................................................................................................... 44
Figure 3.9 – Casting concrete. ..................................................................................................... 44
Figure 3.10 – Attachment of target points. .................................................................................. 45
Figure 3.11 – Transfer length measurement. (1) The attachment of target points on the surface
of a pre-tensioned concrete beam after removing the form; (2) A set of target points at spacing of
4 in. (100 mm); (3) The use of mechanical strain gauge to measure concrete strains. ................. 45
Figure 3.12 – Determination of transfer length. ........................................................................... 47
Figure 3.13 – End-slip measurement. .......................................................................................... 49
Figure 3.14 – Bending test setup. ................................................................................................. 50
Figure 3.15 – Bending test frame. ................................................................................................ 52
Figure 4.1 – Determination of transfer length at release at the live end of beam N-SCC-2. ....... 54
Figure 4.2 – Transfer length at release at the live ends and dead ends of 24 pretensioned concrete
beams. ........................................................................................................................................... 55
Figure 4.3 – Normal distribution model of the measured transfer lengths at release of N-CC-S
beams. ........................................................................................................................................... 56
Figure 4.4 – Increase of transfer length over time ....................................................................... 57
Figure 4.5 – Transfer lengths at release and concrete compressive strengths. ............................ 59
Figure 4.6 – Comparison of measured strand end-slips with the allowable strand end-slips
calculated by different bond stress distribution coefficients. ........................................................ 64
Figure 4.7 – The measured transfer lengths and the predicted transfer lengths from strand end-
slips using BSD coefficients varying from 2.0 to 3.0. .................................................................. 66
Figure 4.8 – Relationship of coefficient of determination R2 and α coefficient. ......................... 66
Figure 4.9 – Comparison of the measured transfer lengths and the predicted transfer lengths
using an α coefficient of 2.38. ...................................................................................................... 67
Figure 5.1 – Bending test results of N-SCC-S beams. ................................................................. 71
Figure 5.2 –Test results of N-SCC-S2-L with an embedment length of 4 ft (1220 mm). ........... 72
Figure 5.3 – Crack pattern of N-SCC-S2-L. ................................................................................ 72
Figure 5.4 – Test results of N-SCC-S2-D with an embedment length of 3.5 ft (1067 mm). ....... 73
Figure 5.5 – Crack pattern of N-SCC-S2-D. ................................................................................ 73
Figure 5.6 – Bending test results of H-SCC-S beams. ................................................................. 74
Figure 5.7 – Test results of H-SCC-S4-L with an embedment length of 4 ft (1220 mm). .......... 75
Figure 5.8 – Crack pattern of H-SCC-S4-L. ................................................................................ 75
Figure 5.9 – Test results of H-SCC-S4-D with an embedment length of 3.75 ft (1143 mm). ..... 76
Figure 5.10 – Crack pattern of H-SCC-S4-D. .............................................................................. 76
Figure 5.11 – Bending test results of N-CC-S beams. ................................................................. 77
Figure 5.12 – Test results of N-CC-S4-D with an embedment length of 3.5 ft (1067 mm). ....... 78
Figure 5.13 – Crack pattern of N-CC-S4-D. ................................................................................ 78
Figure 5.14 – Test results of N-CC-S1-L with an embedment length of 3 ft (914 mm). ............ 79
Figure 5.15 – Crack pattern of N-CC-S1-L. ................................................................................ 80
Figure 5.16 – Bending test results of H-CC-S beams. ................................................................. 81
Figure 5.17 – Test results of H-CC-S4-L with an embedment length of 4 ft (1220 mm). .......... 81
Figure 5.18 – Crack pattern of H-CC-S4-L. ................................................................................ 82
Figure 5.19 – Test results of H-CC-S1-D with an embedment length of 3.25 ft (991 mm). ....... 83
Figure 5.20 – Crack pattern of H-CC-S1-D. ................................................................................ 83
Figure 5.21 – Bending test results of H-SCC-D beams. .............................................................. 84
Figure 5.22 – Test results of H-SCC-D3-D with an embedment length of 4.0 ft (1220 mm). .... 85
Figure 5.23 – Crack pattern of H-SCC-D3-D. ............................................................................. 85
Figure 5.24 – Test results of H-SCC-D4-D with an embedment length of 3.75 ft (1143 mm). .. 86
Figure 5.25 – Crack pattern of H-SCC-D4-D. ............................................................................. 86
Figure 5.26 – Bending test results of H-CC-D beams. ................................................................ 87
Figure 5.27 – Test results of H-CC-D2-D with an embedment length of 3.75 ft (1143 mm). .... 88
Figure 5.28 – Crack pattern of H-CC-D2-D. ............................................................................... 88
Figure 5.29 – Test results of H-CC-D2-L with an embedment length of 3.5 ft (1067 mm). ....... 89
Figure 5.30 – Crack pattern of H-CC-D2-L. ................................................................................ 89
Figure 5.31 – Proposed equation of development length. ............................................................ 92
Figure A.1 – Cross-section parameters of: (1) gross cross-section and (2) transformed cross-
section. ........................................................................................................................................ 104
Figure B.1 – Measured transfer lengths of beam N-CC-S1 ....................................................... 110
Figure B.2 – Measured transfer lengths of beam N-CC-S2 ....................................................... 111
Figure B.3 – Measured transfer lengths of beam N-CC-S3 ....................................................... 111
Figure B.4 – Measured transfer lengths of beam N-CC-S4 ....................................................... 112
Figure B.5 – Measured transfer lengths of beam H-CC-S1 ....................................................... 112
Figure B.6 – Measured transfer lengths of beam H-CC-S2 ....................................................... 113
Figure B.7 – Measured transfer lengths of beam H-CC-S3 ....................................................... 113
Figure B.8 – Measured transfer lengths of beam H-CC-S4 ....................................................... 114
Figure B.9 – Measured transfer lengths of beam H-CC-D1 ...................................................... 114
Figure B.10 – Measured transfer lengths of beam H-CC-D2 .................................................... 115
Figure B.11 – Measured transfer lengths of beam H-CC-D3 .................................................... 115
Figure B.12 – Measured transfer lengths of beam H-CC-D4 .................................................... 116
Figure B.13 – Measured transfer lengths of beam N-SCC-S1 ................................................... 116
Figure B.14 – Measured transfer lengths of beam N-SCC-S2 ................................................... 117
Figure B.15 – Measured transfer lengths of beam N-SCC-S3 ................................................... 117
Figure B.16 – Measured transfer lengths of beam N-SCC-S4 ................................................... 118
Figure B.17 - Measured transfer lengths of beam H-SCC-S1 ................................................... 118
Figure B.18 – Measured transfer lengths of beam H-SCC-S2 ................................................... 119
Figure B.19 – Measured transfer lengths of beam H-SCC-S3 ................................................... 119
Figure B.20 - Measured transfer lengths of beam H-SCC-S4 ................................................... 120
Figure B.21 – Measured transfer lengths of beam H-SCC-D1 .................................................. 120
Figure B.22 – Measured transfer lengths of beam H-SCC-D2 .................................................. 121
Figure B.23 – Measured transfer lengths of beam H-SCC-D3 .................................................. 121
Figure B.24 – Measured transfer lengths of beam H-SCC-D4 .................................................. 122
Figure C.1 – Test results of N-SCC-S4-L with an embedment length of 6.0 ft (1830 mm) ..... 128
Figure C.2 – Test results of N-SCC-S4-D with an embedment length of 5.5 ft (1676 mm) ..... 128
Figure C.3 – Crack pattern of N-SCC-S4-L (top) and N-SCC-S4-D (bottom). ........................ 128
Figure C.4 – Test results of N-SCC-S3-L with an embedment length of 5.25 ft (1600 mm) ... 129
Figure C.5 – Test results of N-SCC-S3-D with an embedment length of 5.0 ft (1524 mm) ..... 129
Figure C.6 – Crack pattern of N-SCC-S3-L (top) and N-SCC-S3-D (bottom). ........................ 129
Figure C.7 – Test results of N-SCC-S2-L with an embedment length of 4.0 ft (1220 mm) ..... 130
Figure C.8 – Test results of N-SCC-S2-D with an embedment length of 3.5 ft (1067 mm) ..... 130
Figure C.9 – Crack pattern of N-SCC-S2-L (top) and N-SCC-S2-D (bottom). ........................ 130
Figure C.10 – Test results of N-SCC-S1-L with an embedment length of 3.5 ft (1067 mm) ... 131
Figure C.11 – Test results of N-SCC-S1-D with an embedment length of 3.25 ft (991 mm) ... 131
Figure C.12 – Crack pattern of N-SCC-S1-L (top) and N-SCC-S1-D (bottom). ...................... 131
Figure C.13 – Test results of H-SCC-S2-L with an embedment length of 4.5 ft (1372 mm) ... 132
Figure C.14 – Test results of H-SCC-S2-D with an embedment length of 4.0 ft (1220 mm) ... 132
Figure C.15 – Crack pattern of H-SCC-S2-L (top) and H-SCC-S2-D (bottom). ...................... 132
Figure C.16 – Test results of H-SCC-S1-L with an embedment length of 3.75 ft (1143 mm) . 133
Figure C.17 – Test results of H-SCC-S1-D with an embedment length of 3.75 ft (1143 mm) . 133
Figure C.18 – Crack pattern of H-SCC-S1-L (top) and H-SCC-S1-D (bottom). ...................... 133
Figure C.19 – Test results of H-SCC-S4-L with an embedment length of 4.0 ft (1120 mm) ... 134
Figure C.20 – Test results of H-SCC-S4-D with an embedment length of 3.75 ft (1143 mm) . 134
Figure C.21 – Crack pattern of H-SCC-S4-L (top) and H-SCC-S4-D (bottom). ...................... 134
Figure C.22 – Test results of H-SCC-S3-L with an embedment length of 3.5 ft (1067 mm) ... 135
Figure C.23 – Test results of H-SCC-S3-D with an embedment length of 3.75 ft (1143 mm) . 135
Figure C.24 – Crack pattern of H-SCC-S3-L (top) and H-SCC-S3-D (bottom). ...................... 135
Figure C.25 – Test results of N-CC-S4-L with an embedment length of 4.0 ft (1220 mm) ...... 136
Figure C.26 – Test results of N-CC-S4-D with an embedment length of 3.5 ft (1067 mm) ..... 136
Figure C.27 – Crack pattern of N-CC-S4-L (top) and N-CC-S4-D (bottom). ........................... 136
Figure C.28 – Test results of N-CC-S3-L with an embedment length of 3.5 ft (1067 mm) ...... 137
Figure C.29 – Test results of N-CC-S3-D with an embedment length of 3.5 ft (1067 mm) ..... 137
Figure C.30 – Crack pattern of N-CC-S3-L (top) and N-CC-S3-D (bottom). ........................... 137
Figure C.31 – Test results of N-CC-S2-L with an embedment length of 3.25 ft (991 mm) ...... 138
Figure C.32 – Test results of N-CC-S2-D with an embedment length of 3.25 ft (991 mm) ..... 138
Figure C.33 – Crack pattern of N-CC-S2-L (top) and N-CC-S2-D (bottom). ........................... 138
Figure C.34 – Test results of N-CC-S1-L with an embedment length of 3.0 ft (915 mm) ........ 139
Figure C.35 – Test results of N-CC-S1-D with an embedment length of 3.25 ft (991 mm) ..... 139
Figure C.36 – Crack pattern of N-CC-S1-L (top) and N-CC-S1-D (bottom). ........................... 139
Figure C.37 – Test results of H-CC-S4-L with an embedment length of 4.0 ft (1220 mm) ...... 140
Figure C.38 – Test results of H-CC-S4-D with an embedment length of 4.25 ft (1295 mm) ... 140
Figure C.39 – Crack pattern of H-CC-S4-L (top) and H-CC-S4-D (bottom). ........................... 140
Figure C.40 – Test results of H-CC-S3-L with an embedment length of 4.0 ft (1220 mm) ...... 141
Figure C.41 – Test results of H-CC-S3-D with an embedment length of 4.25 ft (1295 mm) ... 141
Figure C.42 – Crack pattern of H-CC-S3-L (top) and H-CC-S3-D (bottom). ........................... 141
Figure C.43 – Test results of H-CC-S2-L with an embedment length of 4.0 ft (1220 mm) ...... 142
Figure C.44 – Test results of H-CC-S2-D with an embedment length of 3.75 ft (1143 mm) ... 142
Figure C.45 – Crack pattern of H-CC-S2-L (top) and H-CC-S2-D (bottom). ........................... 142
Figure C.46 – Test results of H-CC-S1-L with an embedment length of 3.5 ft (1067 mm) ...... 143
Figure C.47 – Test results of H-CC-S1-D with an embedment length of 3.25 ft (991 mm) ..... 143
Figure C.48 – Crack pattern of H-CC-S1-L (top) and H-CC-S1-D (bottom). ........................... 143
Figure C.49 – Test results of H-SCC-D2-L with an embedment length of 4.0 ft (1220 mm) ... 144
Figure C.50 – Test results of H-SCC-D2-D with an embedment length of 3.75 ft (1143 mm) 144
Figure C.51 – Crack pattern of H-SCC-D2-L (top) and H-SCC-D2-D (bottom). ..................... 144
Figure C.52 – Test results of H-SCC-D1-L with an embedment length of 3.75 ft (1143 mm) . 145
Figure C.53 – Test results of H-SCC-D1-D with an embedment length of 4.0 ft (1220 mm) .. 145
Figure C.54 – Crack pattern of H-SCC-D2-L (top) and H-SCC-D2-D (bottom). ..................... 145
Figure C.55 – Test results of H-SCC-D4-L with an embedment length of 3.5 ft (1067 mm) ... 146
Figure C.56 – Test results of H-SCC-D4-D with an embedment length of 3.75 ft (1143 mm) 146
Figure C.57 – Crack pattern of H-SCC-D4-L (top) and H-SCC-D4-D (bottom). ..................... 146
Figure C.58 – Test results of H-SCC-D3-L with an embedment length of 4.25 ft (1295 mm) . 147
Figure C.59 – Test results of H-SCC-D3-D with an embedment length of 4.0 ft (1220 mm) .. 147
Figure C.60 – Crack pattern of H-SCC-D3-L (top) and H-SCC-D3-D (bottom). ..................... 147
Figure C.61 – Test results of H-CC-D4-L with an embedment length of 4.5 ft (1372 mm) ..... 148
Figure C.62 – Test results of H-CC-D4-D with an embedment length of 4.0 ft (1220 mm) .... 148
Figure C.63 – Crack pattern of H-CC-D4-L (top) and H-CC-D4-D (bottom). ......................... 148
Figure C.64 – Test results of H-CC-D3-L with an embedment length of 3.75 ft (1143 mm) ... 149
Figure C.65 – Test results of H-CC-D3-D with an embedment length of 3.5 ft (1067 mm) .... 149
Figure C.66 – Crack pattern of H-CC-D3-L (top) and H-CC-D3-D (bottom). ......................... 149
Figure C.67 – Test results of H-CC-D2-L with an embedment length of 3.5 ft (1067 mm) ..... 150
Figure C.68 – Test results of H-CC-D2-D with an embedment length of 3.75 ft (1143 mm) .. 150

Figure C.69 – Crack pattern of H-CC-D2-L (top) and H-CC-D2-D (bottom). ......................... 150
Figure C.70 – Test results of H-CC-D1-L with an embedment length of 4.25 ft (1295 mm) ... 151
Figure C.71 – Test results of H-CC-D1-D with an embedment length of 4.0 ft (1220 mm) .... 151
Figure C.72 – Crack pattern of H-CC-D2-L (top) and H-CC-D2-D (bottom). ......................... 151
List of Tables
Table 1.1 – Pretensioned concrete beams ...................................................................................... 8
Table 2.1 – Minimum requirement for different strand diameters in NASP test ......................... 13
Table 3.1 – Concrete mixtures ..................................................................................................... 39
Table 3.2 – Concrete properties ................................................................................................... 40
Table 3.3 – Concrete compressive strengths ................................................................................ 41
Table 4.1 – Transfer length analysis ............................................................................................ 61
Table 5.1 – Measured and predicted development lengths .......................................................... 90
Table 5.2 – Development lengths ................................................................................................. 92
Table A.1 – Gross cross-section properties ................................................................................ 104
Table A.2 – Concrete strengths and the placement of top steel and prestressing strand ........... 105
Table A.3 – Transformed cross-section properties .................................................................... 105
Table A.4 – Prestress loss and strand stress immediately after transfer .................................... 106
Table A.5 – Parameters for calculating long-time prestress loss ............................................... 107
Table A.6 – Prestress losses at 28 days and effective strand stress ........................................... 107
Table A.7 – Nominal moment capacity ..................................................................................... 108
Table A.8 – Predicted transfer and development lengths ........................................................... 109
Table B.1 – Measured transfer lengths at the live end ............................................................... 123
Table B.2 – Measured transfer lengths at the dead end ............................................................. 124
Table B.3 – Statistical analysis .................................................................................................. 125
Table B.4 – Measured and allowable strand end-slips ............................................................... 126
Table C.1 – Bending test results of N-SCC-S beams ................................................................ 152
Table C.2 – Bending test results of H-SCC-S beams ................................................................ 152

Table C.3 – Bending test results of H-SCC-S beams ................................................................ 152
Table C.4 – Bending test results of H-CC-S beams ................................................................... 153
Table C.5 – Bending test results of H-SCC-D beams ................................................................ 153
Table C.6 – Bending test results of H-CC-D beams .................................................................. 153
Notations
db : strand diameter
fpe : effective stress in the prestressing steel after losses
fpj : stress in the prestressing steel at jacking
fpt : stress in prestressing steel immediately after transfer
fps : average stress in prestressing steel at the time for which the nominal resistance
of member is required
fpu : ultimate strength of prestressing strand
f’ci : concrete compressive strength at 1 day
f’c : concrete compressive strength at 28 days
f’ct : concrete compressive strength at the time of conducting a bending test
Ec : modulus of elasticity of concrete
Ep : modulus of elasticity of prestressing strand
Lt : transfer length
Lb : flexural bond length
Ld : development length
ACI 318 : American Concrete Institute Building Code Requirements for Structural
Concrete
AASHTO : American Association of State Highway and Transportation Officials
AMS : average maximum strain
ASTM : American Society for Testing and Materials
CC : conventional concrete
N-CC : normal strength, conventional concrete
N-CC-S : the beams using normal strength, conventional concrete and one 0.7 in. (17.8
mm) prestressing strand
N-SCC : normal strength, self-consolidating concrete
N-SCC-S : the beams using normal strength, self-consolidating concrete and one 0.7 in.
(17.8 mm) prestressing strand
H-CC : high strength, conventional concrete
H-CC-S : the beams using high strength, conventional concrete and one 0.7 in. (17.8 mm)
prestressing strand
H-CC-D : the beams using high strength, conventional concrete and two 0.7 in. (17.8 mm)
prestressing strands
H-SCC : high strength, self-consolidating concrete
H-SCC-S : the beams using high strength, self-consolidating concrete and one 0.7 in. (17.8
mm) prestressing strand
H-SCC-D : the beams using high strength, self-consolidating concrete and two 0.7 in. (17.8
mm) prestressing strands
SCC : self-consolidating concrete

A List of Published Journal Articles
Dang, C. N., Murray, C. D., Floyd, R. W., Micah Hale, W., and Martí-Vargas, J. R. (2014). "Analysis of bond stress distribution for prestressing strand by Standard Test for Strand Bond." Eng.Struct., 72 152-159.
Dang, C. N., Murray, C. D., Floyd, R. W., Micah Hale, W., and Martí-Vargas, J. R. (2014). "A Correlation of Strand Surface Quality to Transfer Length." ACI Struct.J., 111(5), 1245-1252.
1
: INTRODUCTION AND RESEARCH OBJECTIVES CHAPTER 1
Introduction 1.1
This chapter aims at giving fundamental definitions regarding conventional concrete,
self-consolidating concrete, and pretensioned concrete members. The calculations of transfer
length and development length for pretensioned concrete members using the current
specifications are addressed. In addition, the use of these specifications and possible issues
relating to different strand diameters are discussed in detail. Finally, the research objectives and
testing program are given at the end of this chapter.
Conventional Concrete 1.1.1
A fresh conventional concrete (CC) mixture requires external or internal vibration
procedures to attain proper consolidation. This task may be noisy, time-consuming, and increase
labor costs. In addition, bug holes or voids often occur on the surfaces of pretensioned concrete
members. If these voids occur at the interface of prestressing strands and surrounding concrete,
they may reduce the bond strength between the prestressing strands and the concrete which
decreases the shear strength and moment capacity of pretensioned concrete members.
Self-Consolidating Concrete 1.1.2
Self-Consolidating Concrete (SCC), also known as Self-Compacting Concrete, was first
developed in Japan in 1980s (Okamura and Ouchi 2003; Okamura et al. 2000) due to lack of
skilled workers. SCC is an improvement of the CC by adjusting the mix designs and adding
superplasticizers to create a highly flowable and non-segregating concrete. The fluidity is
measured by slump flow rather than slump as CC and the typical slump flow is between 25 in. –
2
30 in. (650 mm – 750 mm). The flow rate is measured by T20 (T500) parameter which is the time
to achieve slump flow of 20 in. (500 mm). SCC can be placed and filled formwork by its own
weight without vibrating, and flows through congested reinforcement regions and confined
spaces without segregating or bleeding. The fresh properties of SCC are an important
improvement when compared to CC while the hardened SCC properties can maintain all the
mechanical properties and durability characteristics.
Pretensioned Concrete 1.1.3
Pretensioned concrete members are widely used in a variety types of structures including
bridges, buildings, and parking garage structures. Pretensioned concrete is a form of reinforced
concrete. However, pretensioned concrete members include an initial compressive force to
mitigate internal tensile stresses due to applied loads and to reduce cracking (Gilbert and
Mickleborough 1990). In order to increase the effectiveness of using pretensioned concrete
members, high grade strands or tendons (Grade 250 or Grade 270) are used instead of
reinforcement rebar (Grade 60). The initial compressive force is created by the following
procedures. The strands are tensioned between two fixed abutments and anchored. After placing
the formwork, concrete is cast around the prestressing strands. Once the concrete achieves the
required compressive strength, the prestressing strands are cut or released, and the tension force
is transferred to the concrete as an axial compressive force. The prestress force is transferred by
the bond between the prestressing strands and the surrounding concrete.
Transfer Length 1.1.4
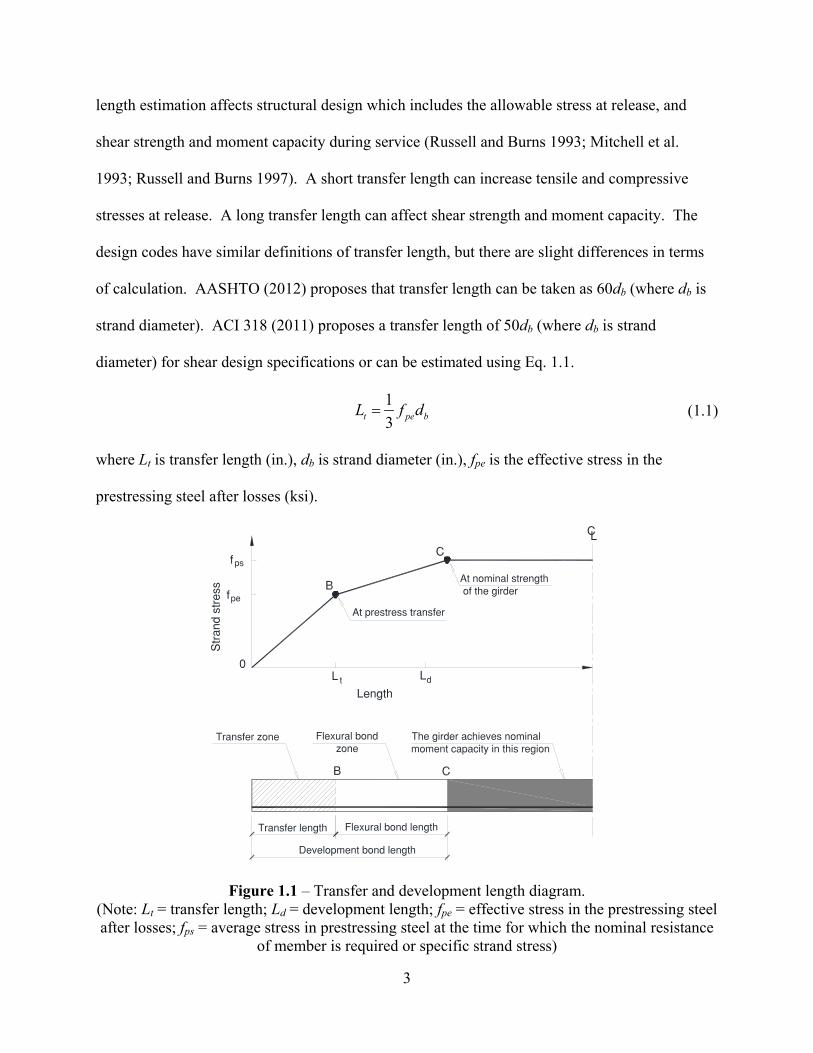
In pretensioned concrete members, transfer length is the required length to transfer the
effective prestress from the prestressing strands to concrete as shown in Figure 1.1. The transfer
3
length estimation affects structural design which includes the allowable stress at release, and
shear strength and moment capacity during service (Russell and Burns 1993; Mitchell et al.
1993; Russell and Burns 1997). A short transfer length can increase tensile and compressive
stresses at release. A long transfer length can affect shear strength and moment capacity. The
design codes have similar definitions of transfer length, but there are slight differences in terms
of calculation. AASHTO (2012) proposes that transfer length can be taken as 60db (where db is
strand diameter). ACI 318 (2011) proposes a transfer length of 50db (where db is strand
diameter) for shear design specifications or can be estimated using Eq. 1.1.
13t pe bL f d= (1.1)
where Lt is transfer length (in.), db is strand diameter (in.), fpe is the effective stress in the
prestressing steel after losses (ksi).
Figure 1.1 – Transfer and development length diagram. (Note: Lt = transfer length; Ld = development length; fpe = effective stress in the prestressing steel after losses; fps = average stress in prestressing steel at the time for which the nominal resistance
of member is required or specific strand stress)
4
Development length 1.1.5
The development length is the required length for prestressing strands to develop fps
(where fps is the average stress in prestressing steel at the time for which the nominal resistance
of member is required or specific strand stress) under ultimate stage as illustrated in Figure 1.1.
The member is able to achieve nominal moment capacity in the region beyond the development
length. If the required development length is shorter than the predicted development length by
current codes, the member exhibits flexural failure under ultimate stage which show visible
warning before collapsed. Otherwise, the member tends to exhibit bond failure if the required
development length is greater than the predicted development length. These assessments are
based on an assumption that the member is adequately designed for shear. The bond failure is
due to the prestressing strands do not have enough length to develop the bond with the adjacent
concrete. This failure type is unpredictable and unacceptable in the design of pretensioned
concrete members.
The codes have several equations to predict development length of 0.5 in. (12.7 mm) and
0.6 in. (15.2 mm) prestressing strands. Technically, development length is a summation transfer
length (Eq. 1.1) and flexural bond length (Eq. 1.2). The ACI 318 (2011) development length
equation is shown in Eq. 1.3. AASHTO (2012) proposes a similar equation to estimate
development length but including a multiplier κ to account for high shear effects as shown in
Eq. 1.4. A κ of 1.6 is used for members having the depth greater than 24 in. (610 mm),
otherwise, κ receives a value of 1.0. In the latter case, the AASHTO equation is identical with
the ACI 318 equation.
( )b ps pe bL f f d= − (1.2)
5
( )13d pe b ps pe bL f d f f d= + − (1.3)
23d ps pe bL f f dκ = −
(1.4)
Where Lb = flexural bond length; Ld is development length (in.); db is strand diameter (in.); fpe is
the effective stress in the prestressing steel after losses (ksi); fps is the average stress in
prestressing steel at the time for which the nominal resistance of member is required or specific
strand stress (ksi); κ is a multiplier.
Prestressing Strand 1.1.6
In the United States, 0.5 in. (12.7 mm) and 0.6 in. (15.2 mm) prestressing strands are
dominant while 0.7 in. (17.8 mm) prestressing strands were first used in practice in 2008
(Morcous et al. 2010). A 0.7 in. (17.8 mm) strand has a cross-sectional area of 0.294 in.2 (189.7
mm2). Accordingly, tensioning a 0.7 in. (17.8 mm) strand to 0.75fpu (where fpu is the ultimate
strength of prestressing strand) results in a prestress force of 60 kip (265 kN) which is 35% and
92% greater than the corresponding force of a 0.6 in. (15.2 mm) and 0.5 in. (12.7 mm) strand,
respectively. This increase of prestress force can enhance shear strength and moment capacity,
decrease girder depth, or reduce the required number of strands in the girder.
ACI Committee 323 (1963) proposed minimum strand spacing of 4db (where db is strand
diameter) center-to-center for the strand diameters varying from 3/8 in. (9.5 mm) to 0.5 in. (12.7
mm). For instance, minimum spacing of 0.5 in. (12.7 mm) strands was 2.0 in. (51 mm).
Accordingly, transfer length and development length were predicted using Eq. 1.1 and Eq. 1.3,
respectively. In 1988, the Federal Highway Administration (FHWA) issued a memorandum that
forbade the use of 0.6 in. (15.2 mm) strands when this type of strand was started using in
6
construction. The FHWA also included a multiplier of 1.6 for the development length equation
as a safety factor when researchers reported the measured development lengths were greater than
the predicted development length for several pretensioned concrete members (Buckner 1995;
Lane and Rekenthaler Jr 1998). The strand spacing requirement of 4db (where db is strand
diameter) was maintained until 1996 when the FHWA made a number of changes to
accommodate the use of 0.6 in. (15.2 mm) strands to the current codes (Lane and Rekenthaler Jr
1998). The changes included the reduction of the minimum SS of 0.5 in. (12.7 mm) strands to
1.75 in. (44 mm), and the establishment minimum SS of 2.0 in. (51 mm) for 0.6 in. (15.2 mm)
strands. These spacing values were approximately to 3.5db (where db is strand diameter).
Cousins et al. (1994) and Deatherage et al. (1994) determined that the use of strand spacing of
1.75 in. (44 mm) for 0.5 in. (12.7 mm) strands had no effect on transfer and development length,
and resulted in no splitting cracks. The sufficiency of using 0.6 in. (15.2 mm) strands at spacing
of 2.0 in. (51 mm) was confirmed by a number of studies (Russell and Burns 1996; Russell and
Burns 1997; Shahawy et al. 1992; Gross and Burns 1995; Barnes et al. 1999).
The changes of strand spacing requirements were adapted and maintained to the current
ACI 318 specifications (2011) without modifying the transfer and development length equations.
AASHTO also adapted changes regarding the strand spacing requirements. However, AASHTO
(2012) uses a transfer length of 60db (where db is strand diameter) instead of Eq. 1.1, and
includes a multiplier κ for development length equation as mentioned in previous section.
The Pacific Street Bridge and the Oxford South Bridge in Omaha, Nebraska were the two
first bridges using 0.7 in. (17.8 mm) prestressing strands fabricate pretensioned concrete bridge
girders. The current ACI 318 and AASHTO specifications regarding transfer length,
development length, and SS are only valid for 0.5 in. (12.7 mm) and 0.6 in. (15.2 mm) strands.
7
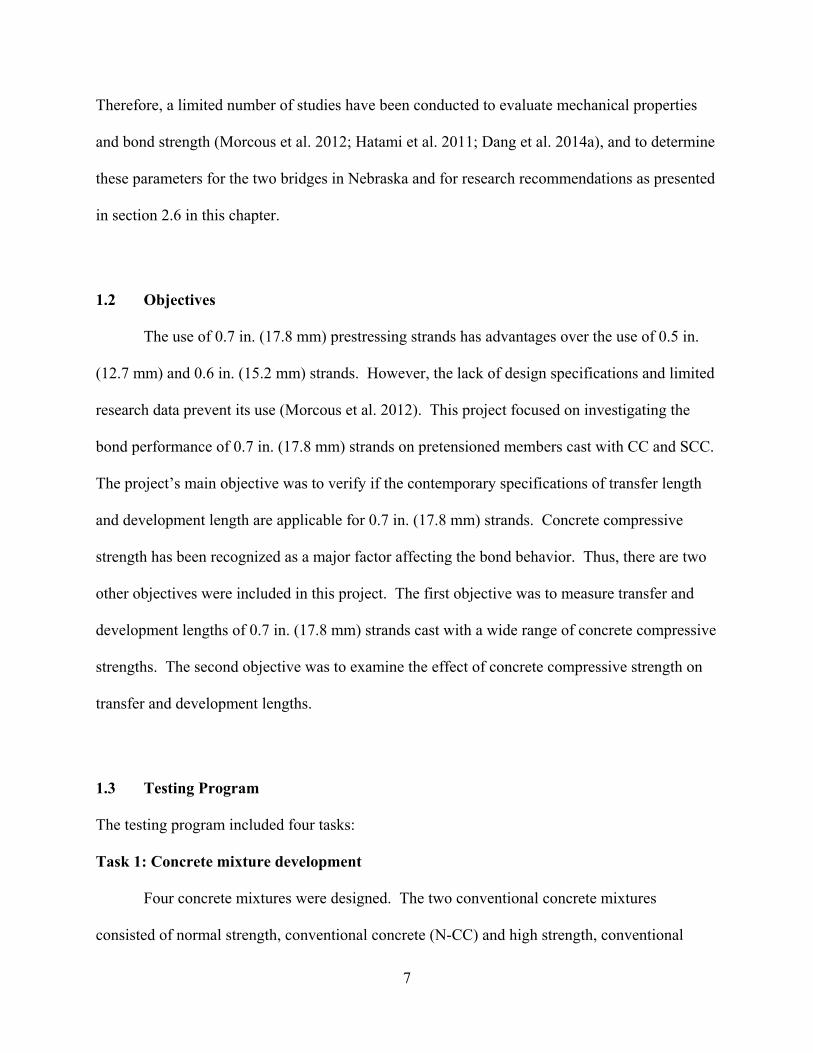
Therefore, a limited number of studies have been conducted to evaluate mechanical properties
and bond strength (Morcous et al. 2012; Hatami et al. 2011; Dang et al. 2014a), and to determine
these parameters for the two bridges in Nebraska and for research recommendations as presented
in section 2.6 in this chapter.
Objectives 1.2
The use of 0.7 in. (17.8 mm) prestressing strands has advantages over the use of 0.5 in.
(12.7 mm) and 0.6 in. (15.2 mm) strands. However, the lack of design specifications and limited
research data prevent its use (Morcous et al. 2012). This project focused on investigating the
bond performance of 0.7 in. (17.8 mm) strands on pretensioned members cast with CC and SCC.
The project’s main objective was to verify if the contemporary specifications of transfer length
and development length are applicable for 0.7 in. (17.8 mm) strands. Concrete compressive
strength has been recognized as a major factor affecting the bond behavior. Thus, there are two
other objectives were included in this project. The first objective was to measure transfer and
development lengths of 0.7 in. (17.8 mm) strands cast with a wide range of concrete compressive
strengths. The second objective was to examine the effect of concrete compressive strength on
transfer and development lengths.
Testing Program 1.3
The testing program included four tasks:
Task 1: Concrete mixture development
Four concrete mixtures were designed. The two conventional concrete mixtures
consisted of normal strength, conventional concrete (N-CC) and high strength, conventional
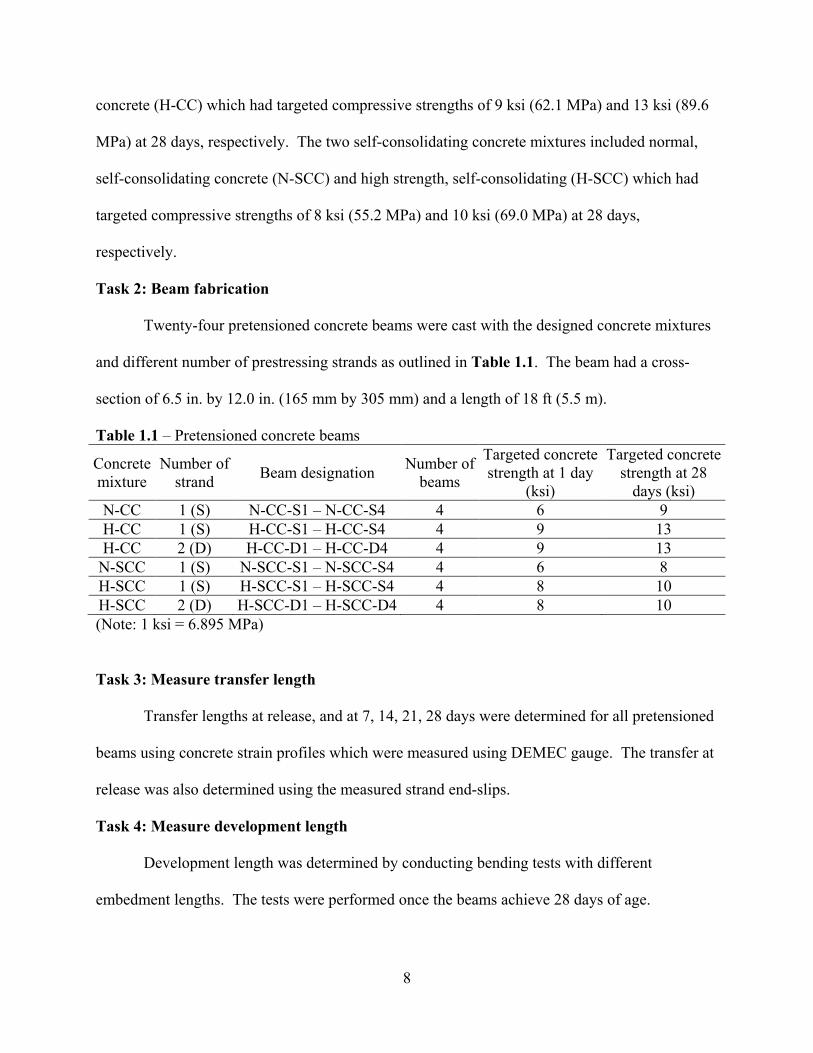
8
concrete (H-CC) which had targeted compressive strengths of 9 ksi (62.1 MPa) and 13 ksi (89.6
MPa) at 28 days, respectively. The two self-consolidating concrete mixtures included normal,
self-consolidating concrete (N-SCC) and high strength, self-consolidating (H-SCC) which had
targeted compressive strengths of 8 ksi (55.2 MPa) and 10 ksi (69.0 MPa) at 28 days,
respectively.
Task 2: Beam fabrication
Twenty-four pretensioned concrete beams were cast with the designed concrete mixtures
and different number of prestressing strands as outlined in Table 1.1. The beam had a cross-
section of 6.5 in. by 12.0 in. (165 mm by 305 mm) and a length of 18 ft (5.5 m).
Table 1.1 – Pretensioned concrete beams
Concrete mixture
Number of strand Beam designation Number of
beams
Targeted concrete strength at 1 day
(ksi)
Targeted concrete strength at 28
days (ksi) N-CC 1 (S) N-CC-S1 – N-CC-S4 4 6 9 H-CC 1 (S) H-CC-S1 – H-CC-S4 4 9 13 H-CC 2 (D) H-CC-D1 – H-CC-D4 4 9 13
N-SCC 1 (S) N-SCC-S1 – N-SCC-S4 4 6 8 H-SCC 1 (S) H-SCC-S1 – H-SCC-S4 4 8 10 H-SCC 2 (D) H-SCC-D1 – H-SCC-D4 4 8 10 (Note: 1 ksi = 6.895 MPa)
Task 3: Measure transfer length
Transfer lengths at release, and at 7, 14, 21, 28 days were determined for all pretensioned
beams using concrete strain profiles which were measured using DEMEC gauge. The transfer at
release was also determined using the measured strand end-slips.
Task 4: Measure development length
Development length was determined by conducting bending tests with different
embedment lengths. The tests were performed once the beams achieve 28 days of age.
9
: LITERATURE REVIEW CHAPTER 2
Introduction 2.1
This chapter presents fundamental information on the bond strength between prestressing
strands and concrete and pull-out tests to quantify the bond. Research on the transfer length and
development length using CC and SCC are also addressed. Benefits and applications of 0.7 in.
(17.8 mm) strands are shown at the end of this chapter.
Elements of Bond 2.2
Strand bond can be defined as the shearing stress at the interface between prestressing
strand and the surrounding concrete which ensures the transferring of prestress force from the
strands to the concrete. In other words, the bond ensures the prestressing strand and concrete
work as a composite material under external loading. When tensile stress occurs in the strand, it
typically moves in the same direction as the applied force. The relative movement of the strand
will be prevented by the bond of the two materials. If the bond is inadequate to prevent the
movement, a bond failure will occur due to excessive slippage of the prestressing strand. Janney
(1954) determined that the bond between prestressing strand and concrete can be addressed by
three following factors: (1) adhesion, (2) Hoyer’s effect, and (3) mechanical interlock.
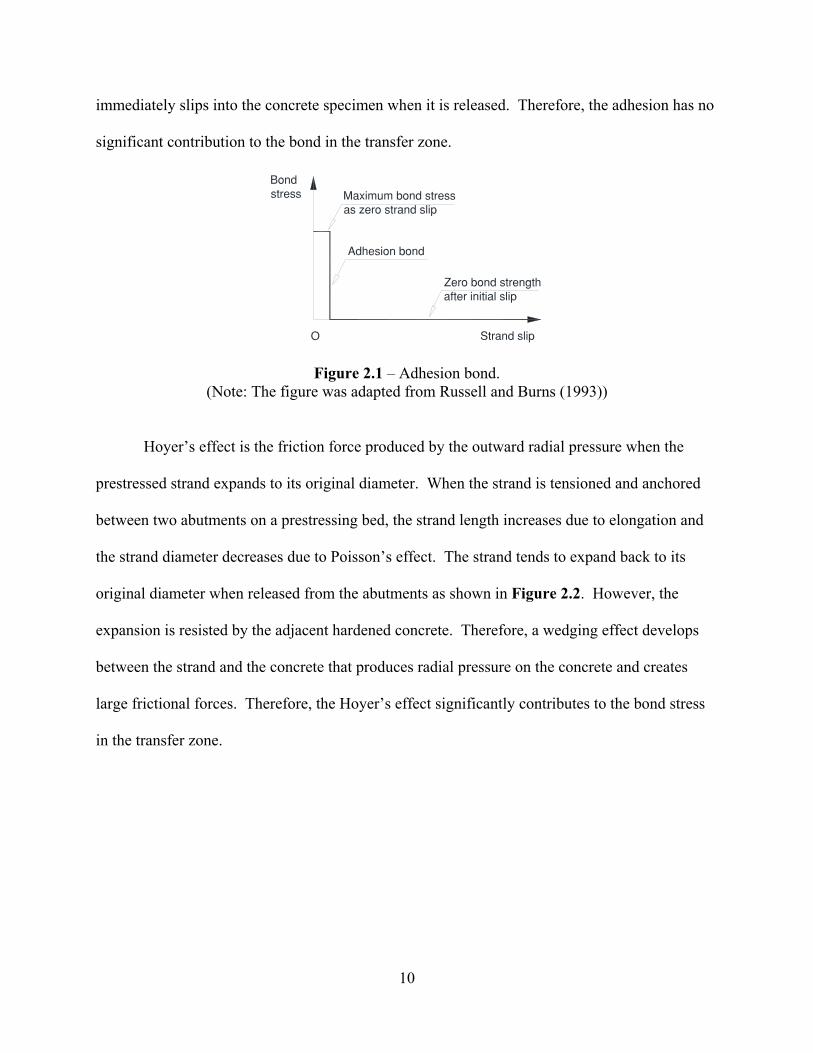
Adhesion is the chemical bond between a strand and concrete, and it is formed when
fresh concrete hardens. The bond due to adhesion is valid if there is no relative movement of the
strand and concrete as shown in Figure 2.1. Along the length of a prestressed concrete member,
the bond is resisted by adhesion, excluding the transfer zone (see Figure 1.1) because the strand
10
immediately slips into the concrete specimen when it is released. Therefore, the adhesion has no
significant contribution to the bond in the transfer zone.
Figure 2.1 – Adhesion bond. (Note: The figure was adapted from Russell and Burns (1993))
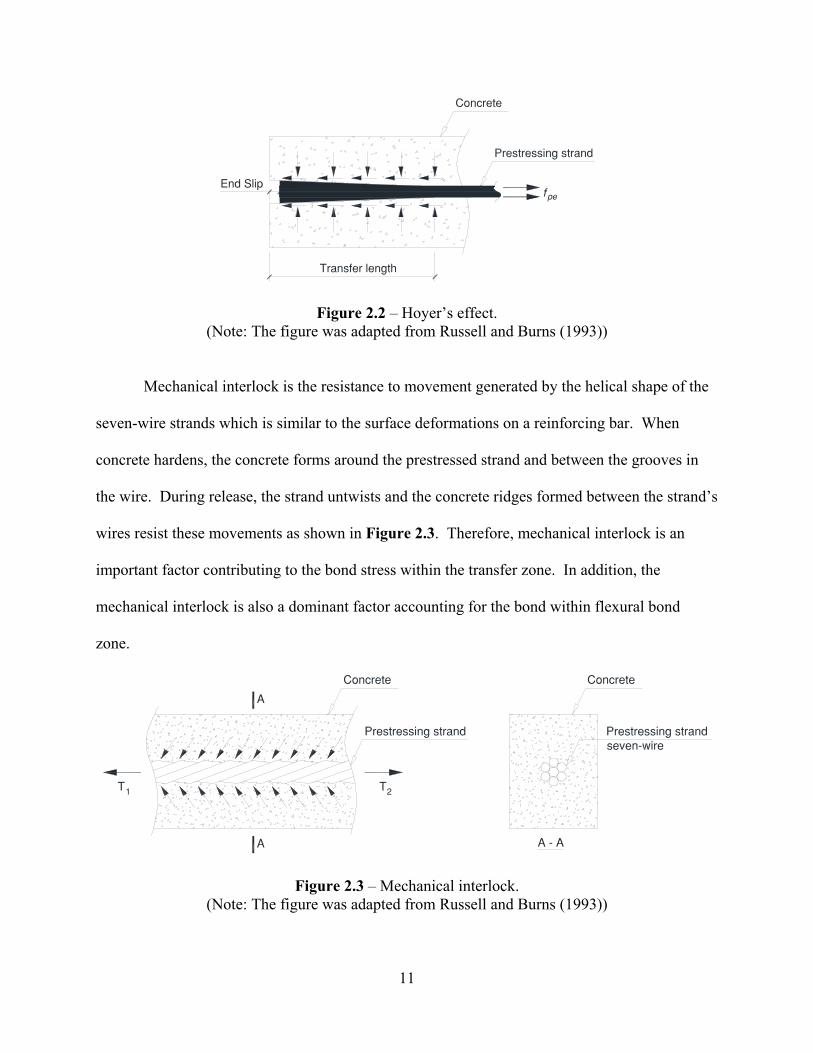
Hoyer’s effect is the friction force produced by the outward radial pressure when the
prestressed strand expands to its original diameter. When the strand is tensioned and anchored
between two abutments on a prestressing bed, the strand length increases due to elongation and
the strand diameter decreases due to Poisson’s effect. The strand tends to expand back to its
original diameter when released from the abutments as shown in Figure 2.2. However, the
expansion is resisted by the adjacent hardened concrete. Therefore, a wedging effect develops
between the strand and the concrete that produces radial pressure on the concrete and creates
large frictional forces. Therefore, the Hoyer’s effect significantly contributes to the bond stress
in the transfer zone.
11
Figure 2.2 – Hoyer’s effect. (Note: The figure was adapted from Russell and Burns (1993))
Mechanical interlock is the resistance to movement generated by the helical shape of the
seven-wire strands which is similar to the surface deformations on a reinforcing bar. When
concrete hardens, the concrete forms around the prestressed strand and between the grooves in
the wire. During release, the strand untwists and the concrete ridges formed between the strand’s
wires resist these movements as shown in Figure 2.3. Therefore, mechanical interlock is an
important factor contributing to the bond stress within the transfer zone. In addition, the
mechanical interlock is also a dominant factor accounting for the bond within flexural bond
zone.
Figure 2.3 – Mechanical interlock. (Note: The figure was adapted from Russell and Burns (1993))

12
Pull out Test 2.3
Many pull-out tests have been developed to assess strand bond including the Moustafa
Pull-out Bond Test, the Post Tensioning Institute (PTI) Bond Test, and the North American
Strand Producers Bond Test (hereafter referred as NASP) (Russell and Paulsgrove 1999a;
Russell and Paulsgrove 1999b; Russell and Brown 2004). The NASP was a modification of the
PTI Bond Test. This test was performed on mortar in order to increase dimensional stability and
reduce shrinkage when compared to the PTI test which used only a cement and water mixture
(mortar contains cement, fine aggregate, and water). The NASP test was evaluated as the most
reproducible and repeatable test to assess and qualify the bond properties of prestressing strands
through four rounds of testing (Ramirez and Russell 2008). During the fourth round of testing
(Russell 2006), the mortar strength was limited to 4.75 ± 0.25 ksi (32.7 ± 1.7 MPa) at the time of
testing (24 ± 2 hours after casting) to reduce pull-out force variation. The latest version of the
NASP is known as the Standard Test for Strand Bond (STSB) which has the same testing
specifications as the NASP. The STSB was adapted as the Standard Test Method for Evaluating
Bond of Seven-Wire Steel Prestressing Strand by ASTM A1081 (2012). Researchers have
indicated that the NASP/STSB pull-out forces not only provide a reliable assessment of bond
properties but also present a good correlation with transfer length (Ramirez and Russell 2008).
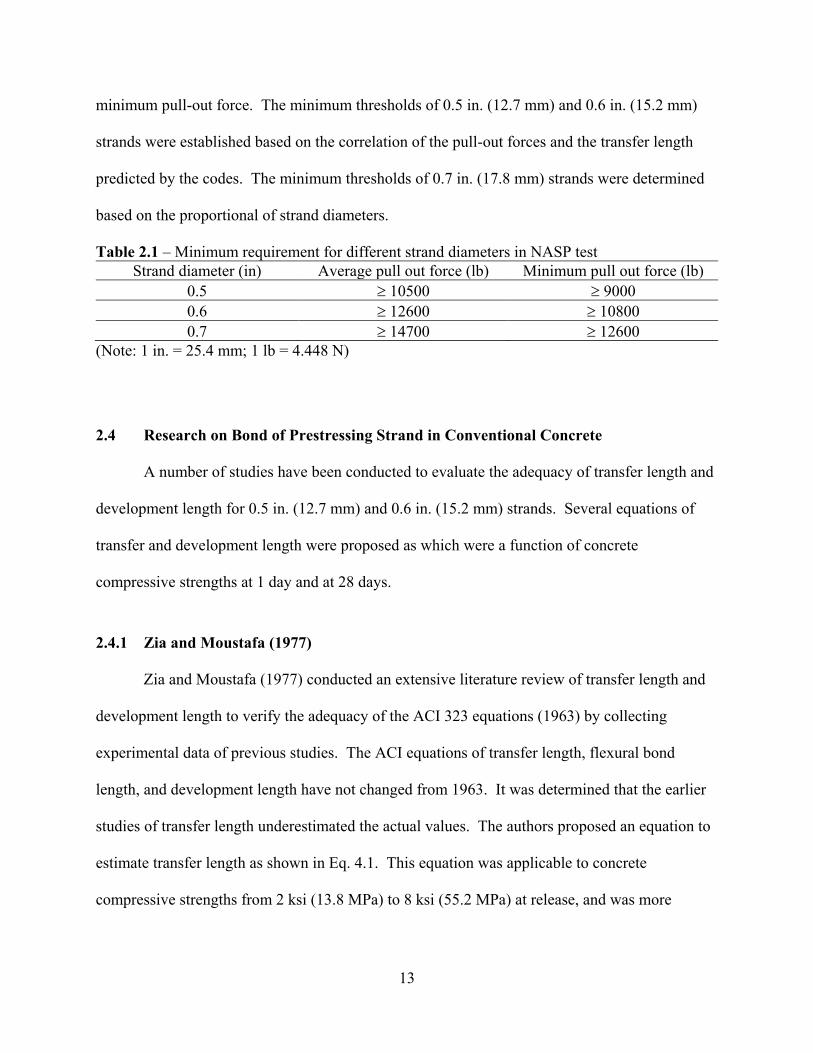
Minimum thresholds for NASP Bond Test pull-out force for different strand diameters
were established as shown in Table 2.1 (Ramirez and Russell 2008; Hatami et al. 2011; Morcous
et al. 2012). The table includes absolute minimum pull-out values as well as average minimum
pull-out values. The bond strength is considered adequate if testing results satisfy two
conditions; the pull-out force of at least six specimens is equal to or larger than the minimum
recommended average pull-out force, and no specimen exhibits a pull-out value less than the
13
minimum pull-out force. The minimum thresholds of 0.5 in. (12.7 mm) and 0.6 in. (15.2 mm)
strands were established based on the correlation of the pull-out forces and the transfer length
predicted by the codes. The minimum thresholds of 0.7 in. (17.8 mm) strands were determined
based on the proportional of strand diameters.
Table 2.1 – Minimum requirement for different strand diameters in NASP test Strand diameter (in) Average pull out force (lb) Minimum pull out force (lb)
0.5 ≥ 10500 ≥ 9000 0.6 ≥ 12600 ≥ 10800 0.7 ≥ 14700 ≥ 12600
(Note: 1 in. = 25.4 mm; 1 lb = 4.448 N)
Research on Bond of Prestressing Strand in Conventional Concrete 2.4
A number of studies have been conducted to evaluate the adequacy of transfer length and
development length for 0.5 in. (12.7 mm) and 0.6 in. (15.2 mm) strands. Several equations of
transfer and development length were proposed as which were a function of concrete
compressive strengths at 1 day and at 28 days.
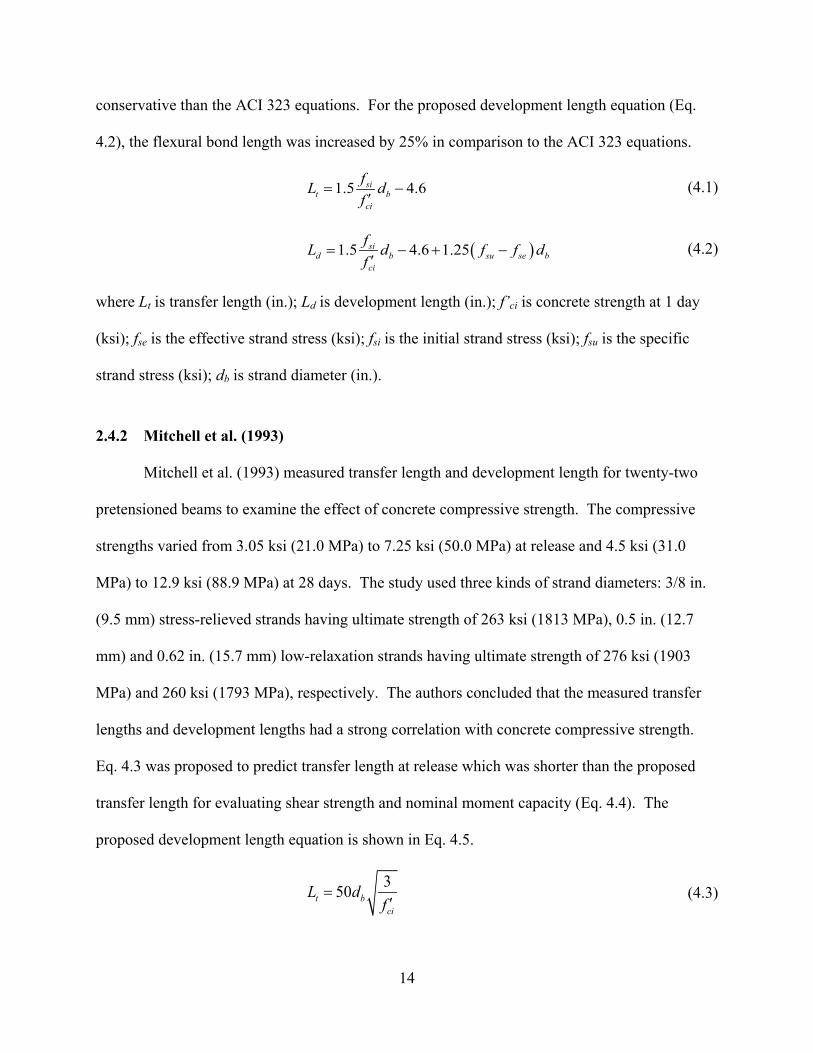
Zia and Moustafa (1977) 2.4.1
Zia and Moustafa (1977) conducted an extensive literature review of transfer length and
development length to verify the adequacy of the ACI 323 equations (1963) by collecting
experimental data of previous studies. The ACI equations of transfer length, flexural bond
length, and development length have not changed from 1963. It was determined that the earlier
studies of transfer length underestimated the actual values. The authors proposed an equation to
estimate transfer length as shown in Eq. 4.1. This equation was applicable to concrete
compressive strengths from 2 ksi (13.8 MPa) to 8 ksi (55.2 MPa) at release, and was more
14
conservative than the ACI 323 equations. For the proposed development length equation (Eq.
4.2), the flexural bond length was increased by 25% in comparison to the ACI 323 equations.
1.5 4.6sit b
ci
fL df
= −′
(4.1)
( )1.5 4.6 1.25sid b su se b
ci
fL d f f df
= − + −′
(4.2)
where Lt is transfer length (in.); Ld is development length (in.); f’ci is concrete strength at 1 day
(ksi); fse is the effective strand stress (ksi); fsi is the initial strand stress (ksi); fsu is the specific
strand stress (ksi); db is strand diameter (in.).
Mitchell et al. (1993) 2.4.2
Mitchell et al. (1993) measured transfer length and development length for twenty-two
pretensioned beams to examine the effect of concrete compressive strength. The compressive
strengths varied from 3.05 ksi (21.0 MPa) to 7.25 ksi (50.0 MPa) at release and 4.5 ksi (31.0
MPa) to 12.9 ksi (88.9 MPa) at 28 days. The study used three kinds of strand diameters: 3/8 in.
(9.5 mm) stress-relieved strands having ultimate strength of 263 ksi (1813 MPa), 0.5 in. (12.7
mm) and 0.62 in. (15.7 mm) low-relaxation strands having ultimate strength of 276 ksi (1903
MPa) and 260 ksi (1793 MPa), respectively. The authors concluded that the measured transfer
lengths and development lengths had a strong correlation with concrete compressive strength.
Eq. 4.3 was proposed to predict transfer length at release which was shorter than the proposed
transfer length for evaluating shear strength and nominal moment capacity (Eq. 4.4). The
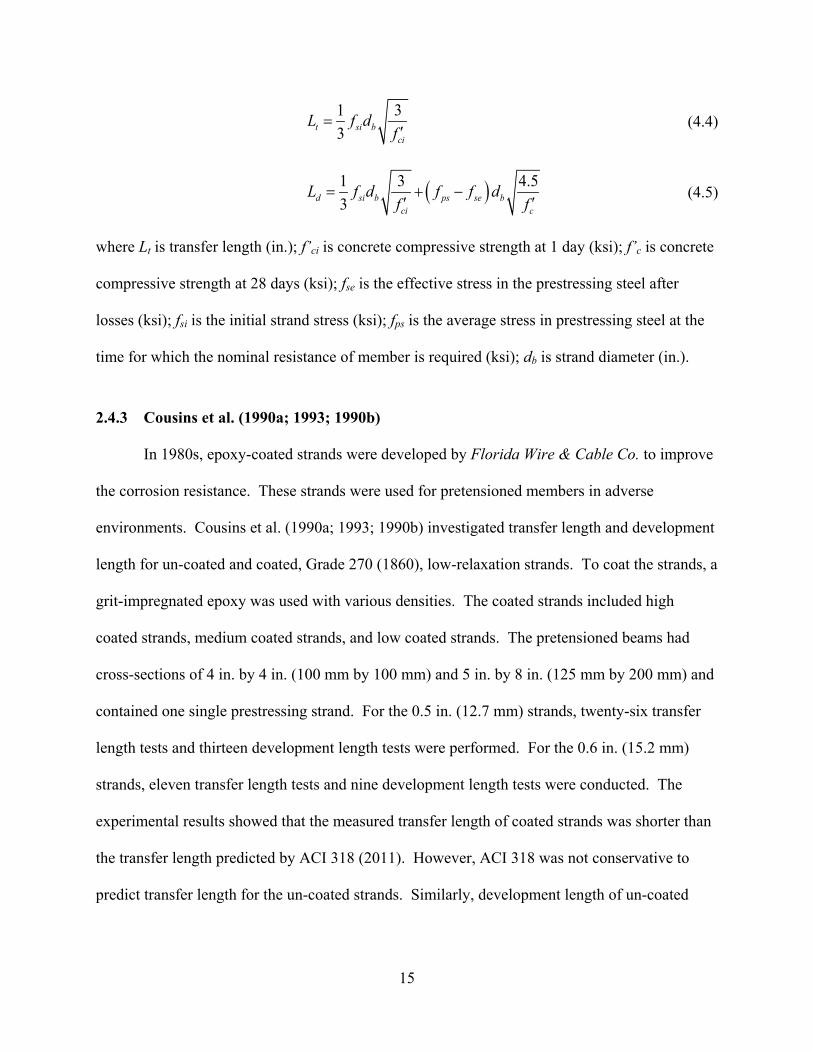
proposed development length equation is shown in Eq. 4.5.
350t bci
L df
=′
(4.3)
15
1 33t si b
ci
L f df
=′
(4.4)
( )1 3 4.53d si b ps se b
ci c
L f d f f df f
= + −′ ′
(4.5)
where Lt is transfer length (in.); f’ci is concrete compressive strength at 1 day (ksi); f’c is concrete
compressive strength at 28 days (ksi); fse is the effective stress in the prestressing steel after
losses (ksi); fsi is the initial strand stress (ksi); fps is the average stress in prestressing steel at the
time for which the nominal resistance of member is required (ksi); db is strand diameter (in.).
Cousins et al. (1990a; 1993; 1990b) 2.4.3
In 1980s, epoxy-coated strands were developed by Florida Wire & Cable Co. to improve
the corrosion resistance. These strands were used for pretensioned members in adverse
environments. Cousins et al. (1990a; 1993; 1990b) investigated transfer length and development
length for un-coated and coated, Grade 270 (1860), low-relaxation strands. To coat the strands, a
grit-impregnated epoxy was used with various densities. The coated strands included high
coated strands, medium coated strands, and low coated strands. The pretensioned beams had
cross-sections of 4 in. by 4 in. (100 mm by 100 mm) and 5 in. by 8 in. (125 mm by 200 mm) and
contained one single prestressing strand. For the 0.5 in. (12.7 mm) strands, twenty-six transfer
length tests and thirteen development length tests were performed. For the 0.6 in. (15.2 mm)
strands, eleven transfer length tests and nine development length tests were conducted. The
experimental results showed that the measured transfer length of coated strands was shorter than
the transfer length predicted by ACI 318 (2011). However, ACI 318 was not conservative to
predict transfer length for the un-coated strands. Similarly, development length of un-coated
16
strands was longer than that of coated strands for the same strand diameter, and greater than the
development length predicted by ACI 318.
Logan (1997) 2.4.4
Logan (1997) evaluated the variation in the bond performance of prestressing strands
produced by different manufacturers. The study collected 0.5 in. (12.7 mm) prestressing strands
from six pretensioned concrete producers from various locations of North America. The strand
quality was classified by the Moustafa Bond Test. Strands having pull-out forces greater than 36
kip (160 kN) were considered as high quality strands, and strands having pull-out forces less than
12 kip (53 kN) were considered as low quality strands. Ten pretensioned beams were cast for
each kind of strand to measure transfer length and development length. The measured transfer
length and development lengths were significantly different. The measured transfer and
development lengths of the high quality strands were shorter those predicted by ACI 318.
However, the measured transfer lengths of the poor quality strands was greater than the transfer
length predicted by ACI 318. Also, for the beams containing the poor quality strands, the
measured development lengths were greater than that predicted by ACI 318. These beams failed
by bond without visible warning.
Rose and Russell (1997) 2.4.5
Rose and Russell (1997) examined the effect of strand surface conditions on transfer
length. Their study examined 0.5 in. (12.7 mm), Grade 270 (1860), low-relaxation strands with
various strand surface conditions: as-received, cleaned, silane treated, and weathered. For the as-
received condition, the strands were collected from three different manufacturers. The cleaned
surface was achieved by washing strands with acid, rinsing with water, and drying. The silane
17
treated surface was prepared in a similar way to the cleaned surface, but included an additional
step of evenly spraying with silane. The weathered surface was attained by cleaning strands and
placing them in an environmental chamber of 73.4oF (23oC) and 75% of relative humidity for 3
days. Transfer lengths were estimated by measuring strand end slips at release of prestressing
strands. It was concluded that the weathered strands exhibited the shortest transfer length, and
the silane treated strands showed the longest transfer length. Transfer length results of cleaned
strands and as-received strands did not show significant differences.
Ramirez and Russell (2008) 2.4.6
Ramirez and Russell (2008) conducted an extensive study to investigate the effects
concrete compressive strength on transfer and development length. The 0.5 in. (12.7 mm) and
0.6 in. (15.2 mm), Grade 270 (1860), low-relaxation strands with various surface conditions were
used in the study. The concrete strengths varied from 4.0 ksi (27.6 MPa) to 10.0 ksi (68.9 MPa)
at 1 day, and from 6.0 ksi (41.4 MPa) to 15.0 ksi (103.4 MPa) at 28 days. Thirty-two rectangular
beams and 4 I beams were cast with 0.5 in. (12.7 mm) strands, and 11 rectangular beams and 4 I
beams were cast with 0.6 in. (15.2 mm) strands. The study determined a strong correlation in
which the increase of concrete compressive strength can shorten transfer length and development
length. For transfer length, the proposed equation included concrete compressive strength at 1
day as shown in Eq. 4.6. When the concrete strength at release is 4 ksi (27.6 MPa), the proposed
transfer length is equal to the transfer length predicted by AASHTO, 60db (where db is strand
diameter). In addition, the equation included a minimum value of transfer length, 40db (where
db is strand diameter), to guarantee a reasonable consideration of transfer length in design. For
development length, the proposed equation included concrete compressive strength at 28 days as
18
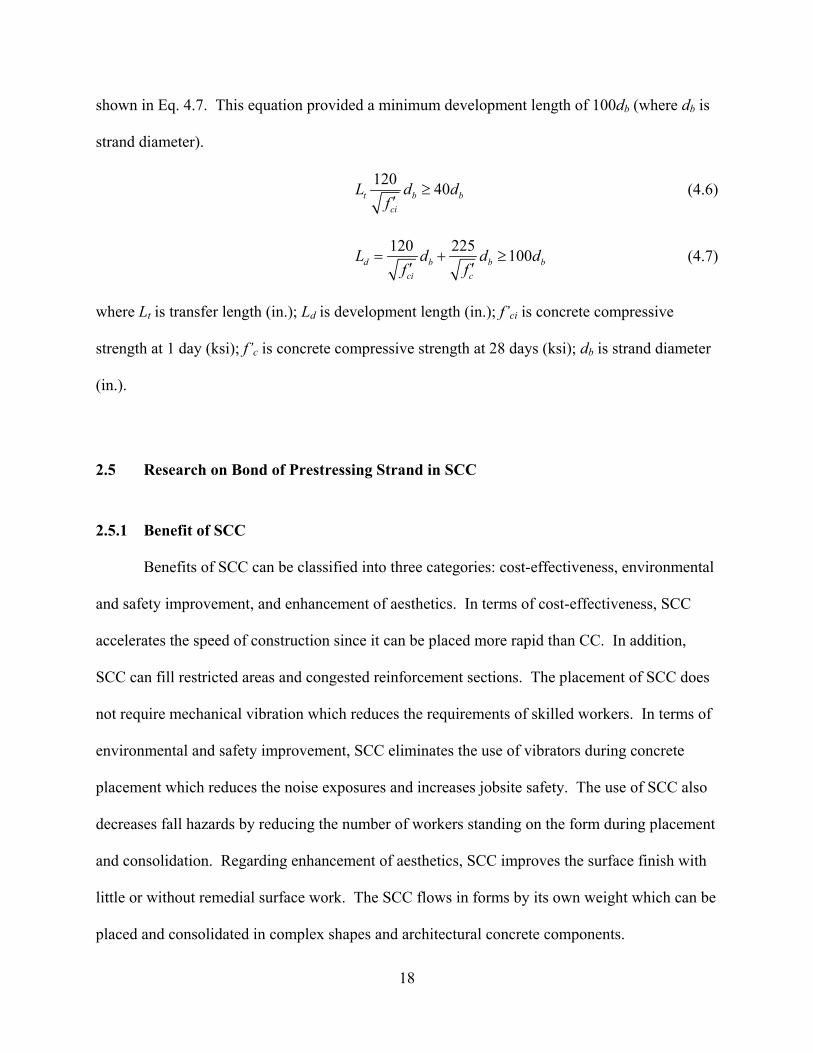
shown in Eq. 4.7. This equation provided a minimum development length of 100db (where db is
strand diameter).
120 40t b bci
L d df
≥′
(4.6)
120 225 100d b b bci c
L d d df f
= + ≥′ ′
(4.7)
where Lt is transfer length (in.); Ld is development length (in.); f’ci is concrete compressive
strength at 1 day (ksi); f’c is concrete compressive strength at 28 days (ksi); db is strand diameter
(in.).
Research on Bond of Prestressing Strand in SCC 2.5
Benefit of SCC 2.5.1
Benefits of SCC can be classified into three categories: cost-effectiveness, environmental
and safety improvement, and enhancement of aesthetics. In terms of cost-effectiveness, SCC
accelerates the speed of construction since it can be placed more rapid than CC. In addition,
SCC can fill restricted areas and congested reinforcement sections. The placement of SCC does
not require mechanical vibration which reduces the requirements of skilled workers. In terms of
environmental and safety improvement, SCC eliminates the use of vibrators during concrete
placement which reduces the noise exposures and increases jobsite safety. The use of SCC also
decreases fall hazards by reducing the number of workers standing on the form during placement
and consolidation. Regarding enhancement of aesthetics, SCC improves the surface finish with
little or without remedial surface work. The SCC flows in forms by its own weight which can be
placed and consolidated in complex shapes and architectural concrete components.
19
Engineering Properties 2.5.2
For SCC, the fresh properties are important and different from the other types of
concrete. The fresh properties of SCC mixture are characterized by three primary properties: (1)
filling ability, (2) stability, and (3) passing ability.
Filling ability refers to the ability to fill the formwork of concrete mixture. This ability is
characterized by two parameters: slump flow and T20 (T500). The slump flow test is used to
determine the horizontal flow property of SCC without obstructions (ASTM C1611 2014). This
test is similar to the slump test of CC (ASTM C143 2012). However, instead of measuring the
falling height of concrete as in the slump test, the slump flow test measures the spreading
diameter of the fresh concrete mixture. The ACI Committee 237 (2007) specifies a common
range of slump flow for SCC of 18 in. - 30 in. (450 mm - 750 mm). The required slump flow
depends on the particular application, but a range of slump flow of 24 in. - 27 in. (610 mm - 689
mm) is appropriate for the most applications (Koehler and Fowler 2007). During the slump flow
test, the time for the fresh concrete mixture to spread to 20 in. (500 mm) is measured. This
parameter is referred to the T20 (T500) which measures the flow rate of SCC. A high T20 (T500)
indicates the fresh concrete mixture has high viscosity and good stability. A fresh mixture
having T20 (T500) less than 2 seconds has low viscosity and greater than 5 seconds has high
viscosity (ACI Committee 237 2007). Generally, a T20 (T500) value in a range of 2 – 7 seconds is
appropriate for most applications (Koehler and Fowler 2007).
After the slump flow test is conducted, the slump flow paddy is observed and assigned a
number from 0 to 3 which represents the stability of the concrete mixture. This number is
termed as Visual Stability Index (VSI) (ASTM C1611 2014). A VSI value of 0 is assigned for a
highly stable concrete, 1 is assigned for a stable concrete, 2 is assigned for an unstable concrete,
20
and 3 is assigned for highly unstable concrete. A VSI value from 0 – 1 is acceptable in practice
(Koehler and Fowler 2007). To assist the VSI assignment, ASTM C1611 (2014) provides four
figures which illustrate the stability of concrete mixture corresponding with each VSI value.
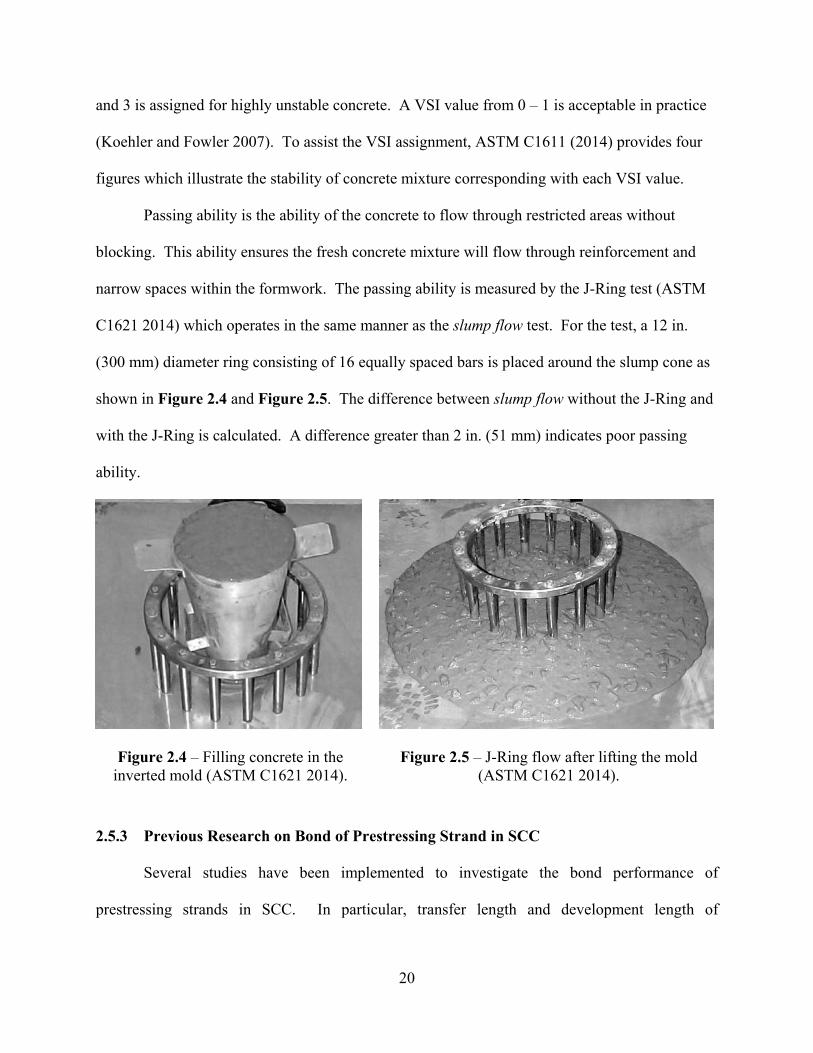
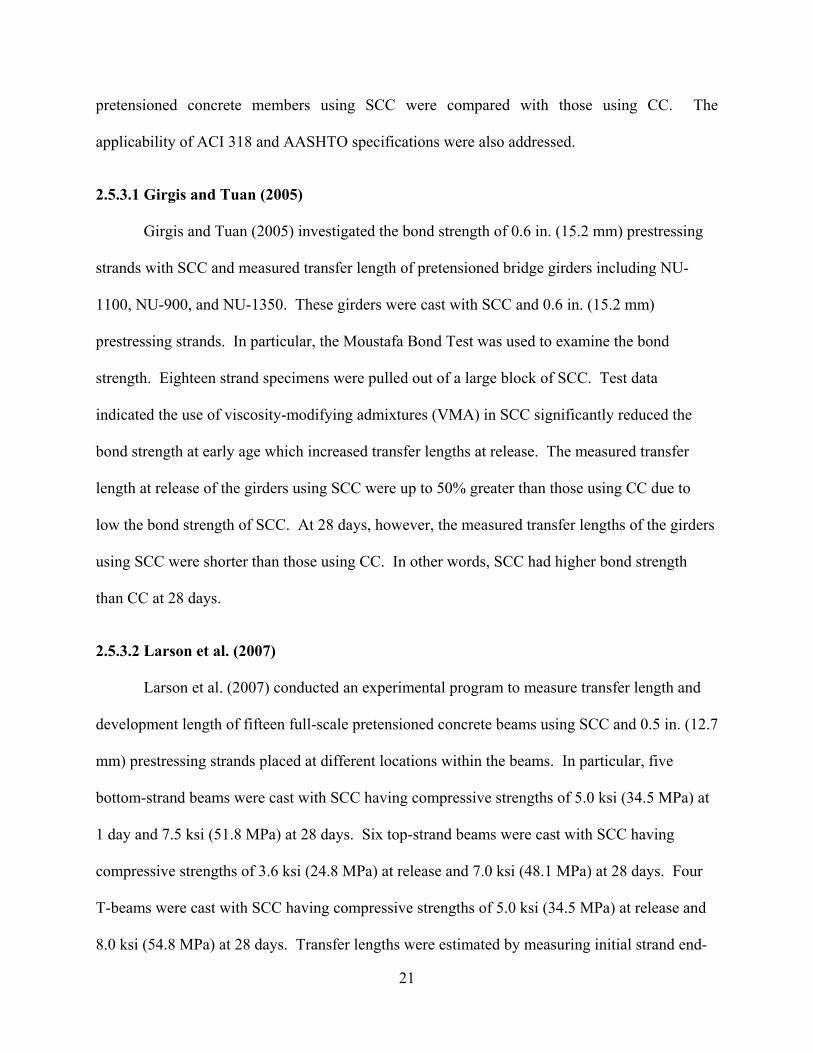
Passing ability is the ability of the concrete to flow through restricted areas without
blocking. This ability ensures the fresh concrete mixture will flow through reinforcement and
narrow spaces within the formwork. The passing ability is measured by the J-Ring test (ASTM
C1621 2014) which operates in the same manner as the slump flow test. For the test, a 12 in.
(300 mm) diameter ring consisting of 16 equally spaced bars is placed around the slump cone as
shown in Figure 2.4 and Figure 2.5. The difference between slump flow without the J-Ring and
with the J-Ring is calculated. A difference greater than 2 in. (51 mm) indicates poor passing
ability.
Figure 2.4 – Filling concrete in the inverted mold (ASTM C1621 2014).
Figure 2.5 – J-Ring flow after lifting the mold (ASTM C1621 2014).
Previous Research on Bond of Prestressing Strand in SCC 2.5.3
Several studies have been implemented to investigate the bond performance of
prestressing strands in SCC. In particular, transfer length and development length of
21
pretensioned concrete members using SCC were compared with those using CC. The
applicability of ACI 318 and AASHTO specifications were also addressed.
2.5.3.1 Girgis and Tuan (2005)
Girgis and Tuan (2005) investigated the bond strength of 0.6 in. (15.2 mm) prestressing
strands with SCC and measured transfer length of pretensioned bridge girders including NU-
1100, NU-900, and NU-1350. These girders were cast with SCC and 0.6 in. (15.2 mm)
prestressing strands. In particular, the Moustafa Bond Test was used to examine the bond
strength. Eighteen strand specimens were pulled out of a large block of SCC. Test data
indicated the use of viscosity-modifying admixtures (VMA) in SCC significantly reduced the
bond strength at early age which increased transfer lengths at release. The measured transfer
length at release of the girders using SCC were up to 50% greater than those using CC due to
low the bond strength of SCC. At 28 days, however, the measured transfer lengths of the girders
using SCC were shorter than those using CC. In other words, SCC had higher bond strength
than CC at 28 days.
2.5.3.2 Larson et al. (2007)
Larson et al. (2007) conducted an experimental program to measure transfer length and
development length of fifteen full-scale pretensioned concrete beams using SCC and 0.5 in. (12.7
mm) prestressing strands placed at different locations within the beams. In particular, five
bottom-strand beams were cast with SCC having compressive strengths of 5.0 ksi (34.5 MPa) at
1 day and 7.5 ksi (51.8 MPa) at 28 days. Six top-strand beams were cast with SCC having
compressive strengths of 3.6 ksi (24.8 MPa) at release and 7.0 ksi (48.1 MPa) at 28 days. Four
T-beams were cast with SCC having compressive strengths of 5.0 ksi (34.5 MPa) at release and
8.0 ksi (54.8 MPa) at 28 days. Transfer lengths were estimated by measuring initial strand end-
22
slip and Guyon’s empirical formula (1953) with a bond stress distribution coefficient of 2.0. The
test data indicated ACI 318 (2011) and AASHTO (2012) specifications are adequate to predict
transfer length at release and 21 days. Development lengths were quantified by conducting
bending texts for all beams. It was concluded that ACI 318 and AASHTO specifications are
conservative to predict development length for the proposed SCC mixtures and specimen
geometries.
2.5.3.3 Boehm et al. (2010)
Boehm et al. (2010) measured transfer length and development length for six full-scale
AASHTO Type I pretensioned girders using 0.5 in. (12.7 mm) prestressing strands. Three types
of concrete mixtures were used: (i) moderate-strength CC mixture, (ii) moderate-strength SCC
mixture, and (iii) high-strength SCC mixture. The moderate-strength concrete and high-strength
concrete had compressive strengths of 5.0 ksi (34.5 MPa) and 10.0 ksi (68.9 MPa) at 1 day,
respectively. Two girders were cast for each type of concrete. The measured transfer lengths
showed that there was no significant difference in bond strength between moderate-strength SCC
and moderate-strength CC. Transfer lengths measured on high-strength SCC were shorter than
those measured on moderate-strength SCC and CC due to the effect of concrete compressive
strength. Development length tests were conducted for all the girders by performing bending
tests with different embedment lengths. A bridge deck was placed on the top of the girder. The
test data indicated ACI 318 (2011) and AASHTO (2012) specifications are conservative to
predict development length pretensioned concrete members using SCC.
2.5.3.4 Staton et al. (2009)
Staton et al. (2009) measured the transfer length of 20 pretensioned concrete beams cast
with SCC and high-strength CC (HSC) and 0.6 in. (15.2 mm) prestressing strands. Eight beams
23
were cast with SCC using Type I cement (SCC-I) and having compressive strengths of 7.76 ksi
(52.5 MPa) at 1 day and 12.24 ksi (84.4 MPa) at 28 days. Six beams were cast with SCC using
Type III cement (SCC-III) and having compressive strengths of 7.54 ksi (52.0 MPa) at 1 day and
11.42 ksi (78.7 MPa) at 28 days. The remaining beams were cast with HSC having compressive
strengths of 9.22 ksi (63.6 MPa) at 1 day and 12.38 ksi (85.4 MPa) at 28 days. Transfer lengths
were measured at release, and at 3, 5, 7, 14, and 28 days. The study showed the measured
transfer lengths of SCC-I and HSC were similar at 28 days, and were slightly greater than SCC-
III. In addition, the measured transfer lengths for all pretensioned beams were approximately
60% of those predicted by ACI 318 (2011) and AASHTO (2012).
2.5.3.5 Floyd et al. (2011a)
Floyd et al. (2011a) conducted an extensive experimental program to investigate
development length of 20 pretensioned concrete beams cast with SCC and high-strength
concrete. Transfer lengths of these beams were measured by Staton et al. (2009) as presented in
Section 2.5.3.4. Development length was determined by performing bending tests with different
embedment lengths. The authors indicated that SCC-III and HSC had similar development
lengths and slightly shorter than those of SCC-I. ACI 318 (2011) and AASHTO (2012) equation
overestimated more than 60% of the measured development lengths of all beams.
2.5.3.6 Myers et al. (2012)
Myers et al. (2012) evaluated transfer length and development length of 0.5 in. (12.7 mm)
prestressing strands cast with CC and SCC. In particular, four concrete mixtures were used: (1)
normal-strength CC having compressive strengths of 4.81 ksi (33.2 MPa) at 1 day and 5.73 ksi
(39.5 MPa) at 28 days, (2) high-strength CC having compressive strengths of 5.67 ksi (39.1
MPa) at 1 day and 8.48 ksi (58.5 MPa) at 28 days, (3) normal-strength SCC having compressive
24
strengths of 5.66 ksi (39.0 MPa) at 1 day and 6.95 ksi (47.9 MPa) at 28 days, and (4) high-
strength SCC having compressive strengths of 6.33 ksi (43.6 MPa) at 1 day and 9.25 ksi (63.8
MPa) at 28 days. Three pretensioned concrete beams were fabricated for each type of concrete.
The measured transfer lengths of girders using SCC and CC showed no significant difference.
The measured transfer lengths were shorter for the beams high-strength concrete including CC
and SCC. Development length was determined by performing bending tests with different
embedment lengths. The test results indicated ACI 318 (2011) and AASHTO (2012)
specifications are conservative to predict development length for pretension concrete beams
using CC and SCC.
Research on Bond of 0.7 in. (17.8 mm) Prestressing Strand 2.6
Benefit of 0.7 in. (17.8 mm) strand 2.6.1
The use 0.7 in. (17.8 mm), Grade 270 (1860), prestressing strands has advantages over
the use of 0.5 in. (12.7 mm) and 0.6 in. (15.2 mm) strands. A 0.7 in. (17.8 mm) strand has a
cross-sectional area of 0.294 in.2 (189.7 mm2). Accordingly, tensioning a 0.7 in. (17.8 mm)
strand to 0.75fpu (where fpu is the ultimate strength of prestressing strand) results in a prestress
force of 60 kip (265 kN) which is 35% and 92% greater than the corresponding force of a 0.6 in.
(15.2 mm) and 0.5 in. (12.7 mm) strand, respectively. This increase in prestress force can
increase moment capacity, decrease girder depth, or reduce the required number of strands in the
girder.
Economic benefits are also realized by using 0.7 in. (17.8 mm) strands in bridge girders.
For instance, to achieve the same flexural capacity of a beam using 0.6 in (15.2 mm) strands,
fewer 0.7 in. (17.8 mm) strands and chucks are required. Akhnoukh (2008) suggested that a
25
girder using 0.7 in (17.8 mm) strands and a concrete compressive strength of 15 ksi (103 MPa)
can reduce by 14% of the material costs in comparison to a girder containing 0.6 in. (15.2 mm)
strands and a concrete compressive strength of 8 ksi (55 MPa). In addition, the use of large
diameter strands increases moment capacity, therefore fewer girders are required per span which
directly decreases construction budget and construction time.
Application of 0.7 in. (17.8 mm) strand in bridge construction 2.6.2
2.6.2.1 Pacific Street Bridge, Omaha, NE, USA
The Pacific Street Bridge (2008) is the first bridge in the world using 0.7 in (17.8 mm)
strands for pretensioned concrete girders (Schuler 2009). The bridge consists of six traffic lanes
with a total width of 108-ft 8-in. (33.1 m). This bridge has two identical spans of 98 ft (29.9 m).
Each span consists of ten NU-900 girders which are spaced at 10-ft 8-in. (3.3 m). The bridge
supported a continuous deck that was 8 in. (200 mm) thick and composed of concrete having a
compressive strength of 5.0 ksi (34.5 MPa) at 28 days. Thirty-six 0.6 in. (15.2 mm) mono
strands was post-tensioned along the deck.
The bridge was constructed using twenty 98-ft 4-in. (30.0 m) long NU-900 bridge girders
which were fabricated at Coreslab Structures, Omaha. These girders were cast using high
performance concrete having compressive strengths of 7.0 ksi (48.3 MPa) at 1 day and 10.0 ksi
(68.9 MPa) at 28 days. Each girder contained thirty 0.7 in. (17.8 mm), Grade 270 (1860)
prestressing strands which were spaced at 2.0 in. (51 mm) horizontally and 2.5 in. (64 mm)
vertically. These strands were tensioned up to 0.64fpu (where fpu is the ultimate strength of
prestressing strand). A full-scale test was conducted at the PKI Structural Laboratory of the
26
University of Nebraska-Lincoln in 2007 to study the girders performance before constructing the
project.
A 40 ft (12.2 m) long NU-900 girder was fabricated for the Pacific Street Bridge project
(Morcous et al. 2011b). This girder used concrete having a compressive strengths of 6.7 ksi
(46.2 MPa) at 1 day and 8.0 ksi (55.2 MPa) at 28 days. Twenty-four 0.7 in. (17.8 mm) strands
were placed at 2.2 in. (56 mm) horizontally and 2.25 in. (57 mm) vertically, and tensioned to
0.75fpu (where fpu is the ultimate strength of prestressing strand). The measured transfer length
was 35 in. (890 mm) which was equal to the predicted transfer length by ACI 318 and less than
the transfer length predicted by AASHTO (2012). The development length predicted by
AASHTO equation was 14 ft (4.3 m) which was included a multiplier of 1.6 for the beam having
a depth greater than 24 in. (610 mm). The bending test using the predicted development length
indicated that AASHTO equation is applicable and conservative to estimate development length
of 0.7 in. (17.8 mm) strands.
2.6.2.2 Oxford South Bridge, Omaha, NE, USA
The Oxford South Bridge was constructed in the spring of 2012 and completed in the fall
of 2013 (Morcous et al. 2013). The bridge includes five spans: 110 ft (33.5 m), 110 ft (33.5 m),
140 ft (42.7 m), 110 ft (33.5 m), 110 ft (33.5 m). This bridge has two traffic lanes with a total
width of 32 ft (9.8 m). There were two design plans developed for the bridge. The preliminary
design had 4 NU-1600 girders spaced at 9 ft (2.7 m). The 140 ft (42.7 m) span girder used forty-
two 0.6 in. (15.2 mm) strands, and the 110 ft (33.5 m) included twenty-six 0.6 in. (15.2 mm)
strands. The revised design used NU-1350 girders and 0.7 in. (17.8 mm) strands instead of NU-
1600 girders and 0.6 in. (15.2 mm) strands. The use of NU-1350 girders increased the vertical
27
clearance by 10 in. (250 mm), and the use of 0.7 in. (17.8 mm) decreased the required number of
prestressing strands.
The NU-1350 girder contained thirty-four 0.7 in. (17.8 mm), Grade 270 (1860)
prestressing strands for the 140 ft (42.7 m) span, and twenty-four 0.7 in. (17.8 mm), Grade 270
(1860) prestressing strand for the 110 ft (33.5 m) span. These strands were spaced at 2.0 in. by
2.0 in. (51 mm by 51 mm), and tensioned to 0.75fpu (where fpu is the ultimate strength of
prestressing strand). SCC was used for all girders. In particular, the 140 ft (42.7 m) girders used
concrete which had compressive strengths of 7.0 ksi (48.3 MPa) at 1 day and 9.0 ksi (62.1 MPa)
at 28 days. The 110 ft (33.5 m) used concrete which had compressive strengths of 6.0 ksi (41.4
MPa) at 1 day and 8.0 ksi (55.2 MPa) at 28 days.
Morcous et al. (2014) measured transfer length in three girder ends of the NU-1350 110 ft
(33.5 m) girders. Transfer length was determined by measuring concrete surface strains along
with 95% average maximum strain (AMS) method. The measured transfer lengths at release and
at 14 days were 32 in. (813 mm) and 36 in. (915 mm), respectively. The transfer length at 14
days was approximately with the transfer length predicted by ACI 318 (50db = 35 in. (890 mm)),
and less than the length predicted by AASHTO (60db = 42 in. (1070 mm)). At the end of
girders, there were no visible cracks at the transfer zone and in the area between prestressing
strands due to the use of 0.7 in. (17.8 mm) strands at a pacing of 2 in. by 2 in. (51 mm by 51
mm).
Previous Research on Bond of 0.7 in. (17.8 mm) strand 2.6.3
Several studies using 0.7 in. (17.8 mm), Grade 270 (1860), prestressing strands have been
conducted. These studies can be categorized into three groups: (1) mechanical and bond
properties (Morcous et al. 2012; Dang et al. 2014a; Hatami et al. 2011), (2) the required strand
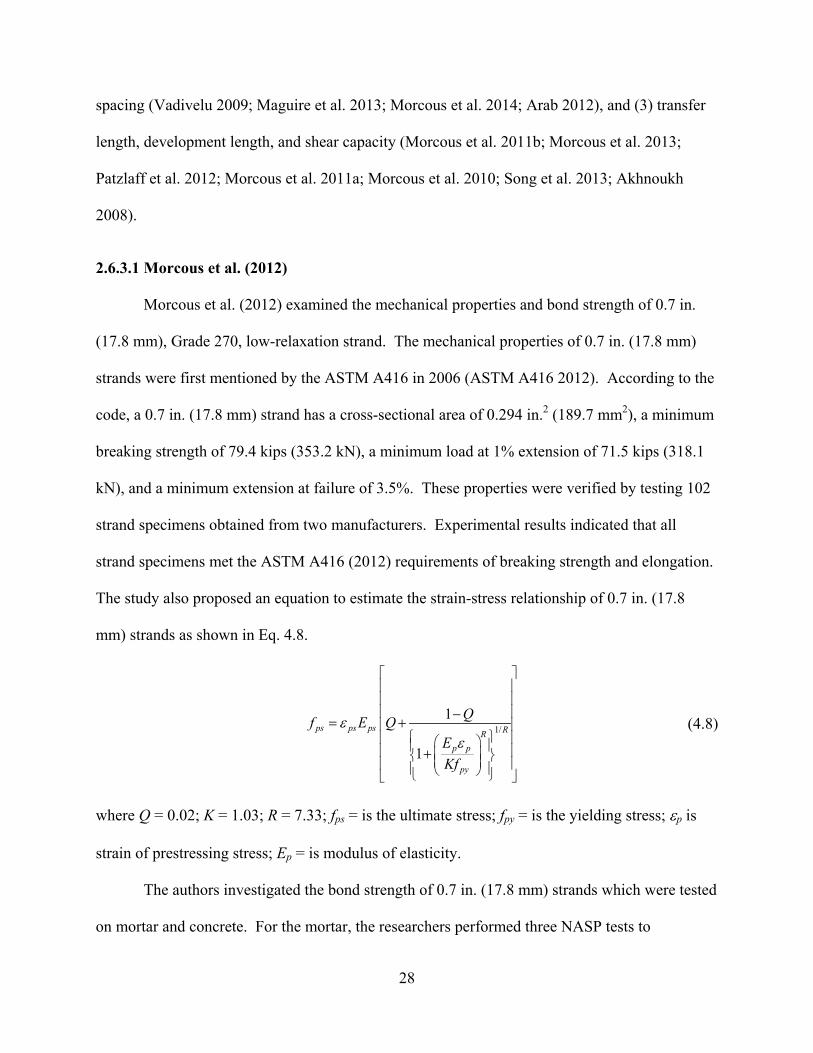
28
spacing (Vadivelu 2009; Maguire et al. 2013; Morcous et al. 2014; Arab 2012), and (3) transfer
length, development length, and shear capacity (Morcous et al. 2011b; Morcous et al. 2013;
Patzlaff et al. 2012; Morcous et al. 2011a; Morcous et al. 2010; Song et al. 2013; Akhnoukh
2008).
2.6.3.1 Morcous et al. (2012)
Morcous et al. (2012) examined the mechanical properties and bond strength of 0.7 in.
(17.8 mm), Grade 270, low-relaxation strand. The mechanical properties of 0.7 in. (17.8 mm)
strands were first mentioned by the ASTM A416 in 2006 (ASTM A416 2012). According to the
code, a 0.7 in. (17.8 mm) strand has a cross-sectional area of 0.294 in.2 (189.7 mm2), a minimum
breaking strength of 79.4 kips (353.2 kN), a minimum load at 1% extension of 71.5 kips (318.1
kN), and a minimum extension at failure of 3.5%. These properties were verified by testing 102
strand specimens obtained from two manufacturers. Experimental results indicated that all
strand specimens met the ASTM A416 (2012) requirements of breaking strength and elongation.
The study also proposed an equation to estimate the strain-stress relationship of 0.7 in. (17.8
mm) strands as shown in Eq. 4.8.
1/1
1
ps ps ps RRp p
py
Qf E QEKf
εε
−= +
+
(4.8)
where Q = 0.02; K = 1.03; R = 7.33; fps = is the ultimate stress; fpy = is the yielding stress; εp is
strain of prestressing stress; Ep = is modulus of elasticity.
The authors investigated the bond strength of 0.7 in. (17.8 mm) strands which were tested
on mortar and concrete. For the mortar, the researchers performed three NASP tests to
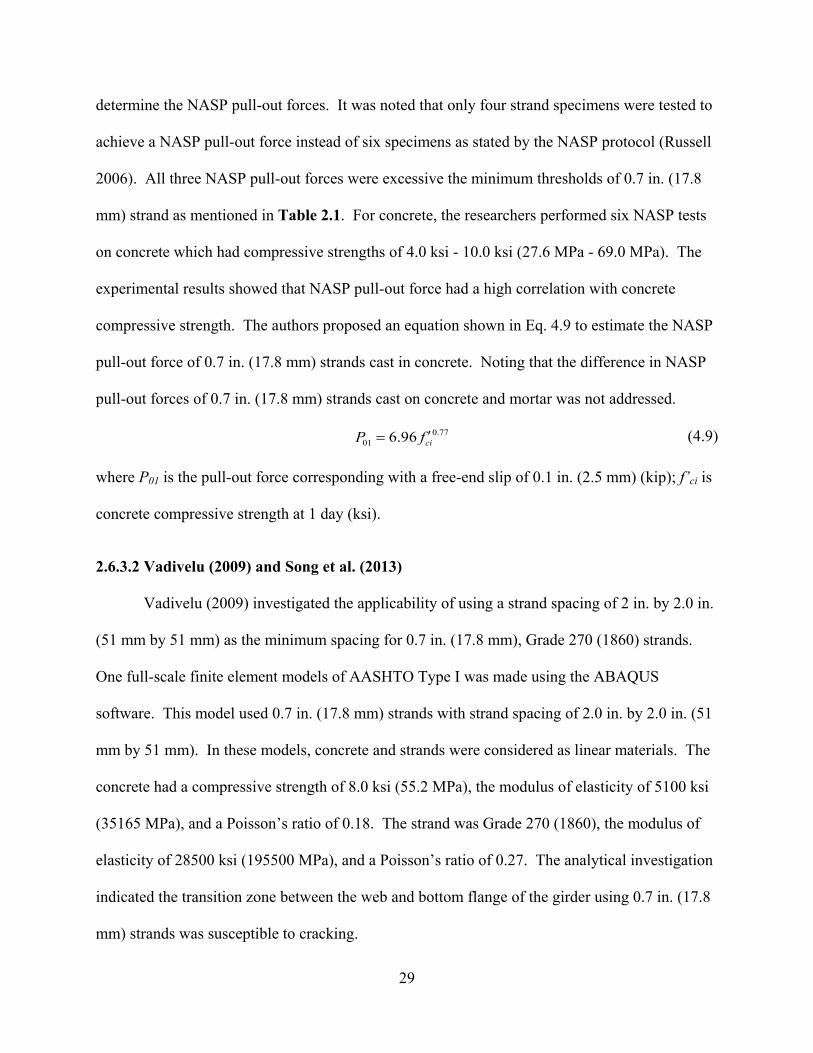
29
determine the NASP pull-out forces. It was noted that only four strand specimens were tested to
achieve a NASP pull-out force instead of six specimens as stated by the NASP protocol (Russell
2006). All three NASP pull-out forces were excessive the minimum thresholds of 0.7 in. (17.8
mm) strand as mentioned in Table 2.1. For concrete, the researchers performed six NASP tests
on concrete which had compressive strengths of 4.0 ksi - 10.0 ksi (27.6 MPa - 69.0 MPa). The
experimental results showed that NASP pull-out force had a high correlation with concrete
compressive strength. The authors proposed an equation shown in Eq. 4.9 to estimate the NASP
pull-out force of 0.7 in. (17.8 mm) strands cast in concrete. Noting that the difference in NASP
pull-out forces of 0.7 in. (17.8 mm) strands cast on concrete and mortar was not addressed.
0.7701 6.96 ciP f ′= (4.9)
where P01 is the pull-out force corresponding with a free-end slip of 0.1 in. (2.5 mm) (kip); f’ci is
concrete compressive strength at 1 day (ksi).
2.6.3.2 Vadivelu (2009) and Song et al. (2013)
Vadivelu (2009) investigated the applicability of using a strand spacing of 2 in. by 2.0 in.
(51 mm by 51 mm) as the minimum spacing for 0.7 in. (17.8 mm), Grade 270 (1860) strands.
One full-scale finite element models of AASHTO Type I was made using the ABAQUS
software. This model used 0.7 in. (17.8 mm) strands with strand spacing of 2.0 in. by 2.0 in. (51
mm by 51 mm). In these models, concrete and strands were considered as linear materials. The
concrete had a compressive strength of 8.0 ksi (55.2 MPa), the modulus of elasticity of 5100 ksi
(35165 MPa), and a Poisson’s ratio of 0.18. The strand was Grade 270 (1860), the modulus of
elasticity of 28500 ksi (195500 MPa), and a Poisson’s ratio of 0.27. The analytical investigation
indicated the transition zone between the web and bottom flange of the girder using 0.7 in. (17.8
mm) strands was susceptible to cracking.
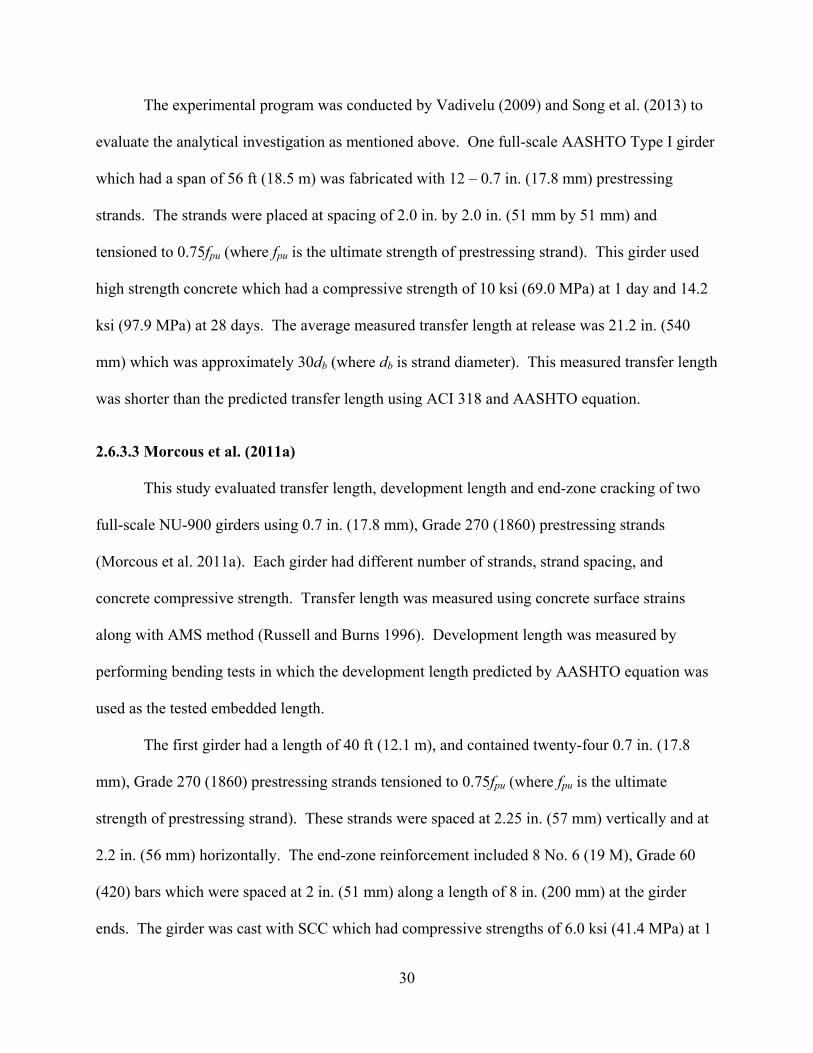
30
The experimental program was conducted by Vadivelu (2009) and Song et al. (2013) to
evaluate the analytical investigation as mentioned above. One full-scale AASHTO Type I girder
which had a span of 56 ft (18.5 m) was fabricated with 12 – 0.7 in. (17.8 mm) prestressing
strands. The strands were placed at spacing of 2.0 in. by 2.0 in. (51 mm by 51 mm) and
tensioned to 0.75fpu (where fpu is the ultimate strength of prestressing strand). This girder used
high strength concrete which had a compressive strength of 10 ksi (69.0 MPa) at 1 day and 14.2
ksi (97.9 MPa) at 28 days. The average measured transfer length at release was 21.2 in. (540
mm) which was approximately 30db (where db is strand diameter). This measured transfer length
was shorter than the predicted transfer length using ACI 318 and AASHTO equation.
2.6.3.3 Morcous et al. (2011a)
This study evaluated transfer length, development length and end-zone cracking of two
full-scale NU-900 girders using 0.7 in. (17.8 mm), Grade 270 (1860) prestressing strands
(Morcous et al. 2011a). Each girder had different number of strands, strand spacing, and
concrete compressive strength. Transfer length was measured using concrete surface strains
along with AMS method (Russell and Burns 1996). Development length was measured by
performing bending tests in which the development length predicted by AASHTO equation was
used as the tested embedded length.
The first girder had a length of 40 ft (12.1 m), and contained twenty-four 0.7 in. (17.8
mm), Grade 270 (1860) prestressing strands tensioned to 0.75fpu (where fpu is the ultimate
strength of prestressing strand). These strands were spaced at 2.25 in. (57 mm) vertically and at
2.2 in. (56 mm) horizontally. The end-zone reinforcement included 8 No. 6 (19 M), Grade 60
(420) bars which were spaced at 2 in. (51 mm) along a length of 8 in. (200 mm) at the girder
ends. The girder was cast with SCC which had compressive strengths of 6.0 ksi (41.4 MPa) at 1
31
day and 8.0 ksi (55.2 MPa) at 28 days. The measured transfer length was approximately 35 in.
(890 mm) which was approximately with the transfer length predicted by ACI 318 (2011) and
shorter than the transfer length predicted by AASHTO (2012). The first girder had visible cracks
at the web and the top flange after detensioning the prestressing strands.
The second girder had the same length and cross section with the first girder. This girder
contained thirty 0.7 in. (17.8 mm), Grade 270 (1860) prestressing strands tensioned to 0.66fpu
(where fpu is the ultimate strength of prestressing strand). This prestress was slightly less than
the prestress in the first girder because of the limited capacity of the prestressing bed. However,
these strands were placed at spacing of 2.0 in. by 2.0 in. (51 mm by 51 mm). The end-zone
reinforcement consisted of 4 No. 6 (No. 19), Grade 60 (420) bars which were spaced at 2 in. (51
mm) along a length of 8 in. (200 mm) at the girder ends. The second girder was cast with high
strength concrete which had compressive strengths of 12.0 ksi (82.7 MPa) at 1 day and 15.0 ksi
(103.4 MPa) at 28 days. The measured transfer length was 27 in. (690 mm) which was 30%
shorter than that of the first girder. The reduction in the measured transfer length in the second
girder can be attributed to the effect of concrete compressive strength. The second girder had no
visible cracks as the first girder.
For development length, both girders were able to achieve the nominal flexural strength
by using the development length predicted by AASHTO (2012) as the tested embedment length.
The study indicated the AASHTO specifications are adequate to predict transfer length and
development length of 0.7 in. (17.8 mm) prestressing strands.
2.6.3.4 Patzlaff et al. (2012)
This study examined the effect of confining reinforcement, and measured transfer length,
development length, and shear strength of pretensioned girders using 0.7 in. (17.8 mm), Grade
32
270 strands (Patzlaff et al. 2012). The experimental investigation included fabrication and
testing of 8 T-girders and 3 NU-1100 girders. Transfer length was measured using concrete
surface strains along with the AMS method. Development was measured for all girders by
performing bending tests with the predicted development length by AASHTO equation.
The T-girders had an overall depth of 24 in. (610 mm) and were 28 ft (8.53 m) in length.
These girders were cast with high strength concrete which had compressive strengths of 8.7 ksi -
9.6 ksi (60.0 MPa - 66.2 MPa) at 1 day, and 9.0 ksi - 13.5 ksi (62.1 MPa - 93.1 MPa) at 28 days.
Each girder contained 6 – 0.7 in. (17.8 mm), Grade 270 (1860) prestressing strands which were
tensioned to 0.75fpu (where fpu is the ultimate strength of prestressing strand). These strands were
place into two rows with a strand spacing of 2 in. by 2.0 in. (51 mm by 51 mm). The
confinement reinforcement was varied for each beam. The measured transfer lengths at release
varied from 19 in. to 25 in. ((475 mm to 625 mm), and the average transfer length was 23.3 in.
(532 mm). It was concluded that the amount and distribution of confinement reinforcement had
no significant influence on transfer length.
The NU-1100 girders had an overall depth of 43.3 in. (1,100 mm) and were 40-ft (12.19
m) in length. These girders were cast with SCC which had compressive strengths of 7.8 ksi (54
MPa) at 1 day and 10.0 ksi (69.0 MPa) at 28 days. Each girder contained 34 – 0.7 in. (17.8 mm),
Grade 270 (1860) prestressing strands which were tensioned up to 75% of the ultimate strength.
These strands were placed at spacing of 2.0 in. by 2.0 in. (51 mm by 51 mm). The confinement
reinforcement was placed according to requirement of 2008 Nebraska Department of Roads and
Bridge Operations and AASHTO LRFD 4th. Transfer length measurements were not conducted
for the I-girders.

33
Bending tests were used to evaluate development length for all T-girders and NU-1100
girders. The development length predicted by AASHTO equation was used as the embedded
length for the bending tests. A multiplier of 1.6 was used because the depths of these girders
were greater than 24 in. (610 mm). The experimental results indicated that all girders achieved
the nominal moment capacity by using the predicted development length. The authors
determined the amount of confinement reinforcement had no effect on the moment capacity, but
the distribution of confinement reinforcement enhanced the ductility of pretensioned girders.
2.6.3.5 Maguire et al. (2013)
The study presented the structural performance of 2 double-Tee girders using high
strength concrete, welded wire reinforcement, and 0.7 in. (17.8 mm), Grade 270 (1860)
prestressing strands (Maguire et al. 2013). Two full-scale 50 ft (15.24 m) in length double-Tee
girders were used to measure transfer length, development length, and shear strength. These
girders used SCC which had compressive strength of 12.0 ksi (83.0 MPa) at 1 day and 15.0 ksi
(103.0 MPa) at 28 days. Ten 0.7 in. (17.8 mm) prestressing strands were placed at spacing of 2
in. by 2.0 in. (51 mm by 51 mm) in each single-Tee of the girders. The strands were tensioned
up to 0.60fpu (where fpu is the ultimate strength of prestressing strand) of the ultimate stress
instead of 0.75fpu due to the limited capacity of prestressing bed.
Transfer length was measured using concrete surface strains along with the AMS method.
However, the concrete strain profiles were measured at the top flange of the double-Tee girders
instead of at the centroid of prestressing strands due to the presence of forms at the time of
release. The average measured transfer length at release was 16.5 in. (419 mm) which was less
than the transfer length predicted by ACI 318 (2011) and AASHTO (2012) equation, 35 in. (889
mm) and 42 in. (1067 mm), respectively. Bending tests were used to determine development
34
length. The development length predicted by AASHTO was used as the tested embedment
lengths. Experimental results indicated that the AASHTO equation is adequate to predict
development length of 0.7 in. (17.8 mm) strands.
2.6.3.6 Arab (2012)
This study used the finite element method to investigate an applicable spacing of 0.7 in.
(17.8 mm), Grade 270 (1860) prestressing strands (Arab 2012). The prestressing strands were
modeled as small elements which were accommodated in concrete host elements using two
techniques: (1) embedment technique and (2) extrusion technique. For the embedment
technique, the strand was modeled as truss elements which were only in compression or tension.
The displacement of the truss elements was dependent on the transitional degree of freedom of
the host elements. For the extrusion technique, the strand was modeled as solid elements which
were able to slip in the host elements. The slippage of the prestressing strand was dependent on
the friction between the prestressing strand and the adjacent concrete. Friction coefficients of 0.7
and 1.4 were used for the embedment technique. Based on the proposed techniques, the effects
of strand spacing and the amount of confinement reinforcement on the transfer length were
investigated on two finite element models: (1) a single prestressing strand embedded at the center
of a rectangular prism, (2) a group of nine prestressing strands embedded at the center of a larger
rectangular prism. The analytical results were compared with experimental results collected
from Akhnoukh’s study (2008).
The first finite element model aimed at evaluating the transfer length predicted by
AASHTO equation and the effect of confinement reinforcement on transfer length of 0.7 in.
(17.8 mm) prestressing strands. A single of prestressing strand was placed at the center of a
prism specimen of 7 in. by 7 in. by 96 in. (178 mm by 178 mm by 2438 mm). Four prism
35
specimens were modeled with different amounts of confinement reinforcement. The
confinement reinforcement consisted of No.3 bars which spaced at 3 in. (76 mm), 6 in. (152
mm), 9 in. (229 mm), and 12 in. (305 mm), respectively. The concrete which had compressive
strengths of 3.0 ksi (20.7 MPa) at 1 day was used for all specimens. The analytical results
achieved from the embedment technique and the extrusion technique were similar to the
experimental results of Akhnoukh’study (2008). It was determined that the amount of
confinement reinforcement had no significant effect on transfer length, and the average
anticipated transfer length varied from 24 in. (610 mm) to 42 in. (1,067 mm) which is shorter
than or equal to the transfer length predicted by AASHTO (2012).
The second finite element model investigated applicable strand spacing of 0.7 in. (17.8
mm) strands using the extrusion technique with different friction coefficients of 0.7 and 1.4. A
group of nine prestressing strands were modeled with different strand spacing and different
amounts of confinement reinforcement. The prism specimens were 11 in. by 11 in. by 240 in
(280 mm by 280 mm by 6096 mm). The prestressing strands were placed at spacing of 2.8 in. by
2.8 in. (71 mm by 71 mm) which is equivalent to four times the strand diameter, and 2.0 in. by
2.0 in. (51 mm by 51 mm) which is currently using for 0.6 in. (15.2 mm) strands. The concrete
had compressive strengths of 8.0 ksi (55.2 MPa) at 1 day. The analytical results indicated that
the difference in amount of confinement reinforcement had no effect on transfer length. For
strand spacing, it was determined that 0.7 in. (17.8 mm) prestressing strands can be placed at
spacing of 2.0 in. by 2.0 in. (51 mm by 51 mm) for concrete having compressive strengths of
10.0 ksi (68.9 MPa) or greater at the time of releasing of the strands.
36
Conclusion 2.7
The ACI 318 and AASHTO specifications of transfer length, development length, strand
spacing were established based on experimental results of pretensioned girders cast with 0.5 in.
(12.7 mm), Grade 250 (1760) prestressing strands and CC. These specifications were revised
when 0.6 in. (15.2 mm), Grade 270 (1860) strands were used in pretensioned members. The
revised specifications are used in current practice. A number of studies have been performed to
confirm the adequacy of the current specifications for 0.5 in. (12.7 mm) and 0.6 in. (15.2 mm)
strands. However, limited research has been conducted to investigate the applicability of the
current specifications for 0.7 in. (17.8 mm), Grade 270 (1860) prestressing strands.
In terms of concrete, SCC is a recent development in concrete industry, and has more
advanced features than CC. Several studies have been conducted to investigate the bond strength
of prestressing strands with SCC which may be greater, comparable, or lower than with CC.
This study provides a unique investigation regarding the transfer length, development length, and
applicable strand spacing of 0.7 in. (17.8 mm) prestressing strands. Both CC and SCC which
have a wide range of compressive strengths are investigated. Therefore, the results of this study
will further the application of SCC and 0.7 in. (17.8 mm) prestressing strands in bridge
construction.
Several studies have investigated transfer length, development length, and applicable
spacing of 0.7 in. (17.8 mm) strands as discussed in the introduction section. Most of these
studies were conducted on the members having a depth equal to or greater than 24 in. (610 mm)
which include a multiplier of 1.6 for the development equation. This study represented for the
members having a depth less than 24 in. (610 mm) in which the development length equation
would not include the multiplier. The measured transfer lengths for these members may be

37
longer than for the members having a depth equal to or greater than 24 in. (610 mm) (Russell and
Burns 1993).
38
: EXPERIMENTAL PROGRAM CHAPTER 3
Introduction 3.1
The experimental program consisted of five tasks. Task 1 focused on designing four
concrete mixtures including two normal strength and two high strength concrete mixtures. Task
2 aimed at quantifying the strand surface conditions using STSB. Task 3 consisted of fabricating
24 pretensioned concrete beams using the designed concrete mixtures. Task 4 measured transfer
lengths for all beams at release, and at 7, 14, 21, and 28 days. Strand end-slip was also measured
to determine transfer length at release. The final task concentrated on determining development
length by conducting bending tests after the beams had reached 28 days of age.
Mix design 3.2
Overview 3.2.1
High strength concrete is widely used in bridge construction. Russell et al. (1997)
recommended the concrete compressive strength used for bridge girders should be greater than 8
ksi (55.2 MPa). The researchers also indicated that the use of 0.7 in. (17.8 mm) prestressing
strands at spacing of 2.0 in. by 2.0 in. (51 mm by 51 mm) and concrete compressive strength of
10 ksi (69.0 MPa) in bulb-tee girder (BT-72) results in the longest span and the most cost-
effective design compared to the use of 0.5 in. (12.7 mm) and 0.6 in. (15.2 mm) strands.
Morcous et al. (2011a) determined that the use of 0.7 in. (17.8 mm) prestressing strands and high
strength concrete presents significant enhancements in bridge construction. These enhancements
include increasing moment capacity, lengthening girder span, or extending girder spacing.
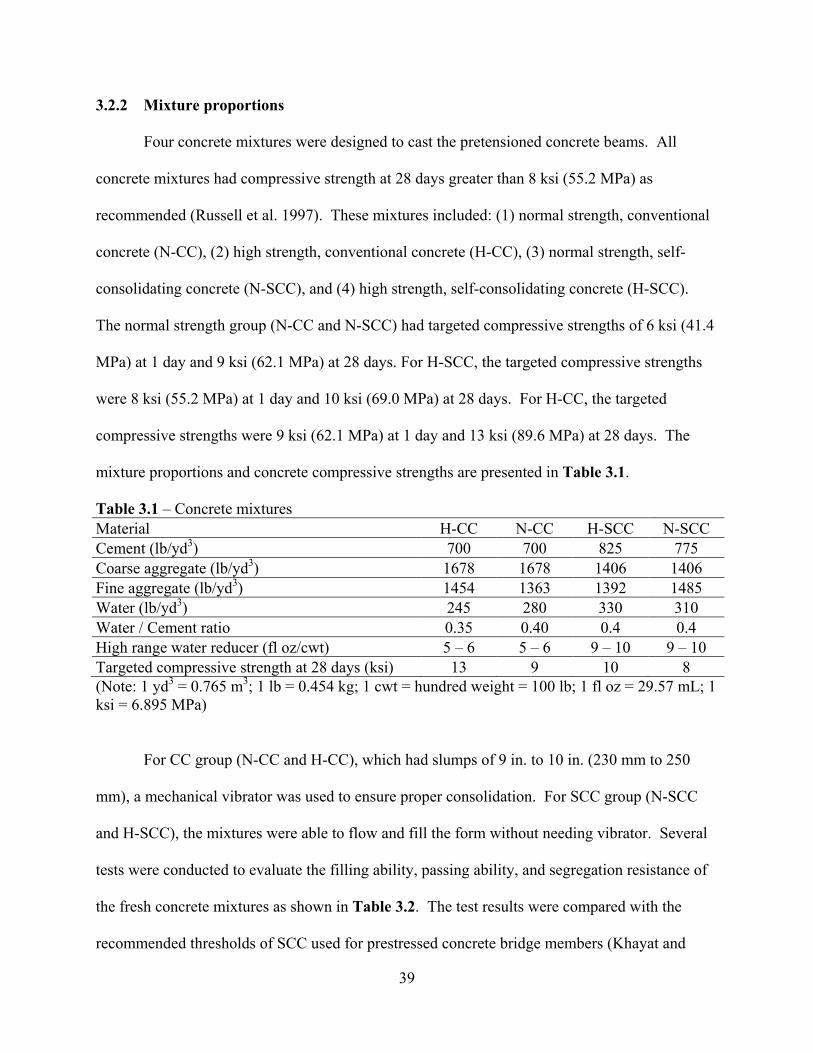
39
Mixture proportions 3.2.2
Four concrete mixtures were designed to cast the pretensioned concrete beams. All
concrete mixtures had compressive strength at 28 days greater than 8 ksi (55.2 MPa) as
recommended (Russell et al. 1997). These mixtures included: (1) normal strength, conventional
concrete (N-CC), (2) high strength, conventional concrete (H-CC), (3) normal strength, self-
consolidating concrete (N-SCC), and (4) high strength, self-consolidating concrete (H-SCC).
The normal strength group (N-CC and N-SCC) had targeted compressive strengths of 6 ksi (41.4
MPa) at 1 day and 9 ksi (62.1 MPa) at 28 days. For H-SCC, the targeted compressive strengths
were 8 ksi (55.2 MPa) at 1 day and 10 ksi (69.0 MPa) at 28 days. For H-CC, the targeted
compressive strengths were 9 ksi (62.1 MPa) at 1 day and 13 ksi (89.6 MPa) at 28 days. The
mixture proportions and concrete compressive strengths are presented in Table 3.1.
Table 3.1 – Concrete mixtures Material H-CC N-CC H-SCC N-SCC Cement (lb/yd3) 700 700 825 775 Coarse aggregate (lb/yd3) 1678 1678 1406 1406 Fine aggregate (lb/yd3) 1454 1363 1392 1485 Water (lb/yd3) 245 280 330 310 Water / Cement ratio 0.35 0.40 0.4 0.4 High range water reducer (fl oz/cwt) 5 – 6 5 – 6 9 – 10 9 – 10 Targeted compressive strength at 28 days (ksi) 13 9 10 8 (Note: 1 yd3 = 0.765 m3; 1 lb = 0.454 kg; 1 cwt = hundred weight = 100 lb; 1 fl oz = 29.57 mL; 1 ksi = 6.895 MPa)
For CC group (N-CC and H-CC), which had slumps of 9 in. to 10 in. (230 mm to 250
mm), a mechanical vibrator was used to ensure proper consolidation. For SCC group (N-SCC
and H-SCC), the mixtures were able to flow and fill the form without needing vibrator. Several
tests were conducted to evaluate the filling ability, passing ability, and segregation resistance of
the fresh concrete mixtures as shown in Table 3.2. The test results were compared with the
recommended thresholds of SCC used for prestressed concrete bridge members (Khayat and
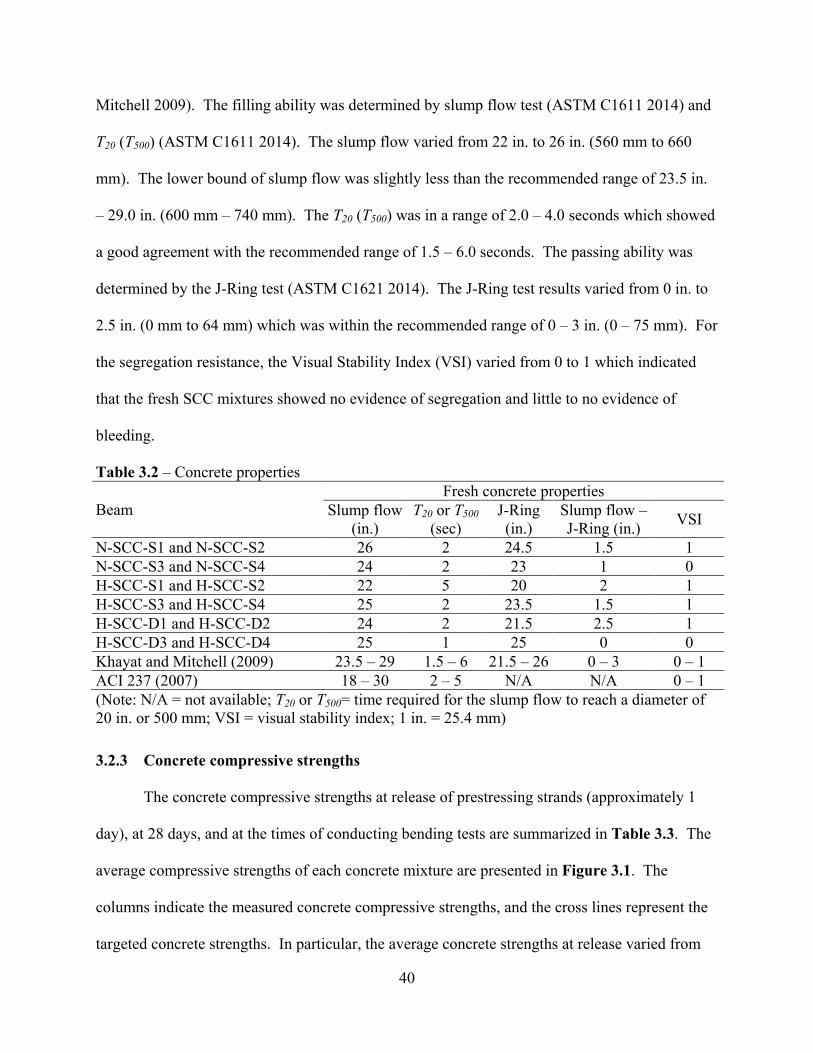
40
Mitchell 2009). The filling ability was determined by slump flow test (ASTM C1611 2014) and
T20 (T500) (ASTM C1611 2014). The slump flow varied from 22 in. to 26 in. (560 mm to 660
mm). The lower bound of slump flow was slightly less than the recommended range of 23.5 in.
– 29.0 in. (600 mm – 740 mm). The T20 (T500) was in a range of 2.0 – 4.0 seconds which showed
a good agreement with the recommended range of 1.5 – 6.0 seconds. The passing ability was
determined by the J-Ring test (ASTM C1621 2014). The J-Ring test results varied from 0 in. to
2.5 in. (0 mm to 64 mm) which was within the recommended range of 0 – 3 in. (0 – 75 mm). For
the segregation resistance, the Visual Stability Index (VSI) varied from 0 to 1 which indicated
that the fresh SCC mixtures showed no evidence of segregation and little to no evidence of
bleeding.
Table 3.2 – Concrete properties
Beam Fresh concrete properties
Slump flow (in.)
T20 or T500 (sec)
J-Ring (in.)
Slump flow – J-Ring (in.) VSI
N-SCC-S1 and N-SCC-S2 26 2 24.5 1.5 1 N-SCC-S3 and N-SCC-S4 24 2 23 1 0 H-SCC-S1 and H-SCC-S2 22 5 20 2 1 H-SCC-S3 and H-SCC-S4 25 2 23.5 1.5 1 H-SCC-D1 and H-SCC-D2 24 2 21.5 2.5 1 H-SCC-D3 and H-SCC-D4 25 1 25 0 0 Khayat and Mitchell (2009) 23.5 – 29 1.5 – 6 21.5 – 26 0 – 3 0 – 1 ACI 237 (2007) 18 – 30 2 – 5 N/A N/A 0 – 1 (Note: N/A = not available; T20 or T500= time required for the slump flow to reach a diameter of 20 in. or 500 mm; VSI = visual stability index; 1 in. = 25.4 mm)
Concrete compressive strengths 3.2.3
The concrete compressive strengths at release of prestressing strands (approximately 1
day), at 28 days, and at the times of conducting bending tests are summarized in Table 3.3. The
average compressive strengths of each concrete mixture are presented in Figure 3.1. The
columns indicate the measured concrete compressive strengths, and the cross lines represent the
targeted concrete strengths. In particular, the average concrete strengths at release varied from
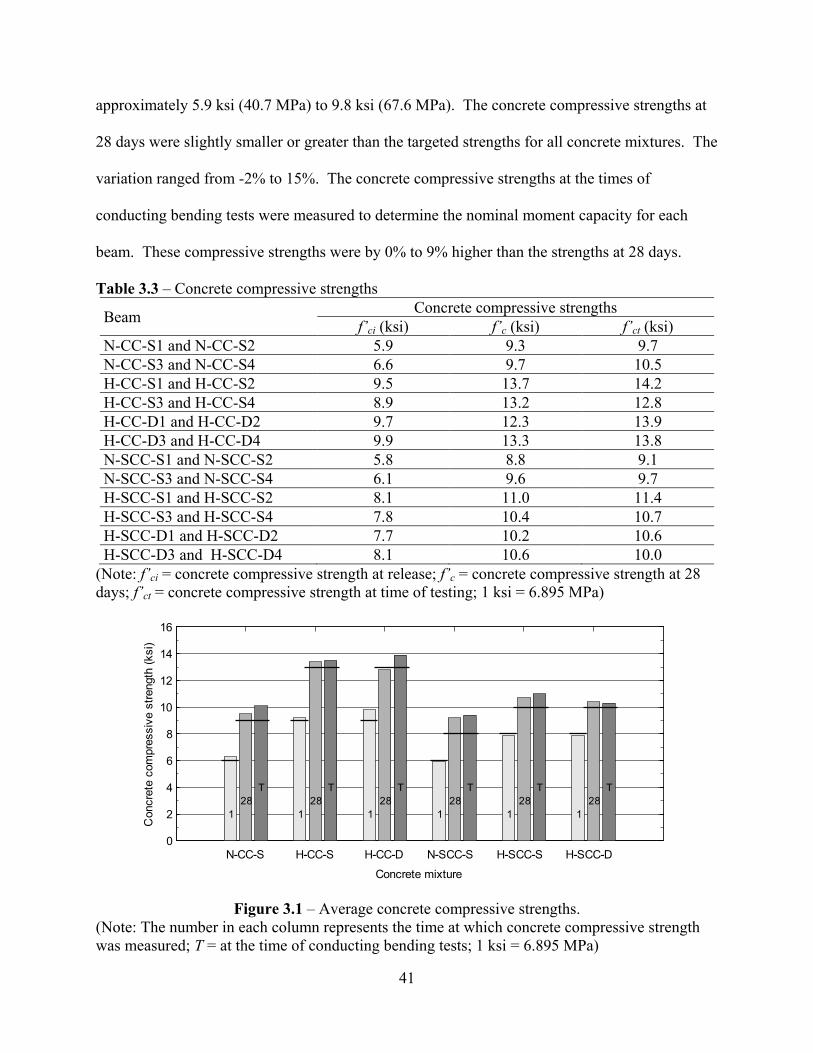
41
approximately 5.9 ksi (40.7 MPa) to 9.8 ksi (67.6 MPa). The concrete compressive strengths at
28 days were slightly smaller or greater than the targeted strengths for all concrete mixtures. The
variation ranged from -2% to 15%. The concrete compressive strengths at the times of
conducting bending tests were measured to determine the nominal moment capacity for each
beam. These compressive strengths were by 0% to 9% higher than the strengths at 28 days.
Table 3.3 – Concrete compressive strengths
Beam Concrete compressive strengths f’ci (ksi) f’c (ksi) f’ct (ksi)
N-CC-S1 and N-CC-S2 5.9 9.3 9.7 N-CC-S3 and N-CC-S4 6.6 9.7 10.5 H-CC-S1 and H-CC-S2 9.5 13.7 14.2 H-CC-S3 and H-CC-S4 8.9 13.2 12.8 H-CC-D1 and H-CC-D2 9.7 12.3 13.9 H-CC-D3 and H-CC-D4 9.9 13.3 13.8 N-SCC-S1 and N-SCC-S2 5.8 8.8 9.1 N-SCC-S3 and N-SCC-S4 6.1 9.6 9.7 H-SCC-S1 and H-SCC-S2 8.1 11.0 11.4 H-SCC-S3 and H-SCC-S4 7.8 10.4 10.7 H-SCC-D1 and H-SCC-D2 7.7 10.2 10.6 H-SCC-D3 and H-SCC-D4 8.1 10.6 10.0
(Note: f’ci = concrete compressive strength at release; f’c = concrete compressive strength at 28 days; f’ct = concrete compressive strength at time of testing; 1 ksi = 6.895 MPa)
Figure 3.1 – Average concrete compressive strengths. (Note: The number in each column represents the time at which concrete compressive strength was measured; T = at the time of conducting bending tests; 1 ksi = 6.895 MPa)
0
2
4
6
8
10
12
14
16
128
T
128
T
128
T
128
T
128
T
128
T
N-CC-S H-CC-S H-CC-D N-SCC-S H-SCC-S H-SCC-D
Concrete mixture
Con
cret
e co
mpr
essi
ve s
treng
th (k
si)
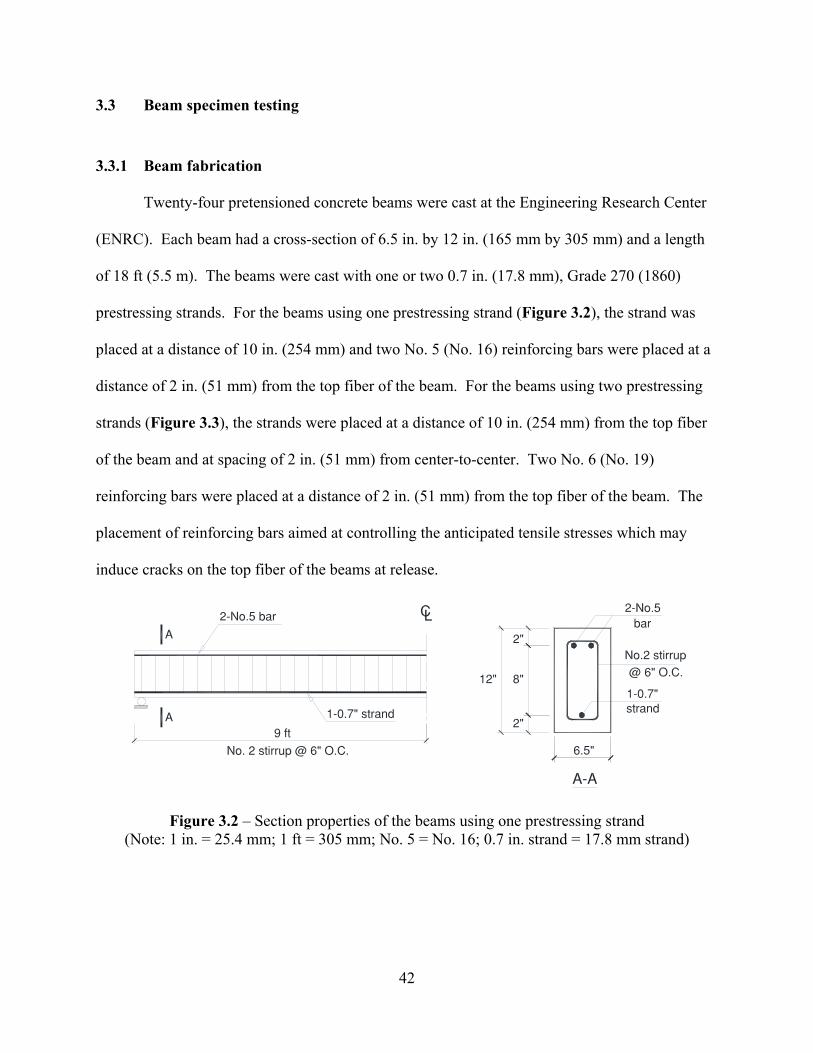
42
Beam specimen testing 3.3
Beam fabrication 3.3.1
Twenty-four pretensioned concrete beams were cast at the Engineering Research Center
(ENRC). Each beam had a cross-section of 6.5 in. by 12 in. (165 mm by 305 mm) and a length
of 18 ft (5.5 m). The beams were cast with one or two 0.7 in. (17.8 mm), Grade 270 (1860)
prestressing strands. For the beams using one prestressing strand (Figure 3.2), the strand was
placed at a distance of 10 in. (254 mm) and two No. 5 (No. 16) reinforcing bars were placed at a
distance of 2 in. (51 mm) from the top fiber of the beam. For the beams using two prestressing
strands (Figure 3.3), the strands were placed at a distance of 10 in. (254 mm) from the top fiber
of the beam and at spacing of 2 in. (51 mm) from center-to-center. Two No. 6 (No. 19)
reinforcing bars were placed at a distance of 2 in. (51 mm) from the top fiber of the beam. The
placement of reinforcing bars aimed at controlling the anticipated tensile stresses which may
induce cracks on the top fiber of the beams at release.
Figure 3.2 – Section properties of the beams using one prestressing strand (Note: 1 in. = 25.4 mm; 1 ft = 305 mm; No. 5 = No. 16; 0.7 in. strand = 17.8 mm strand)
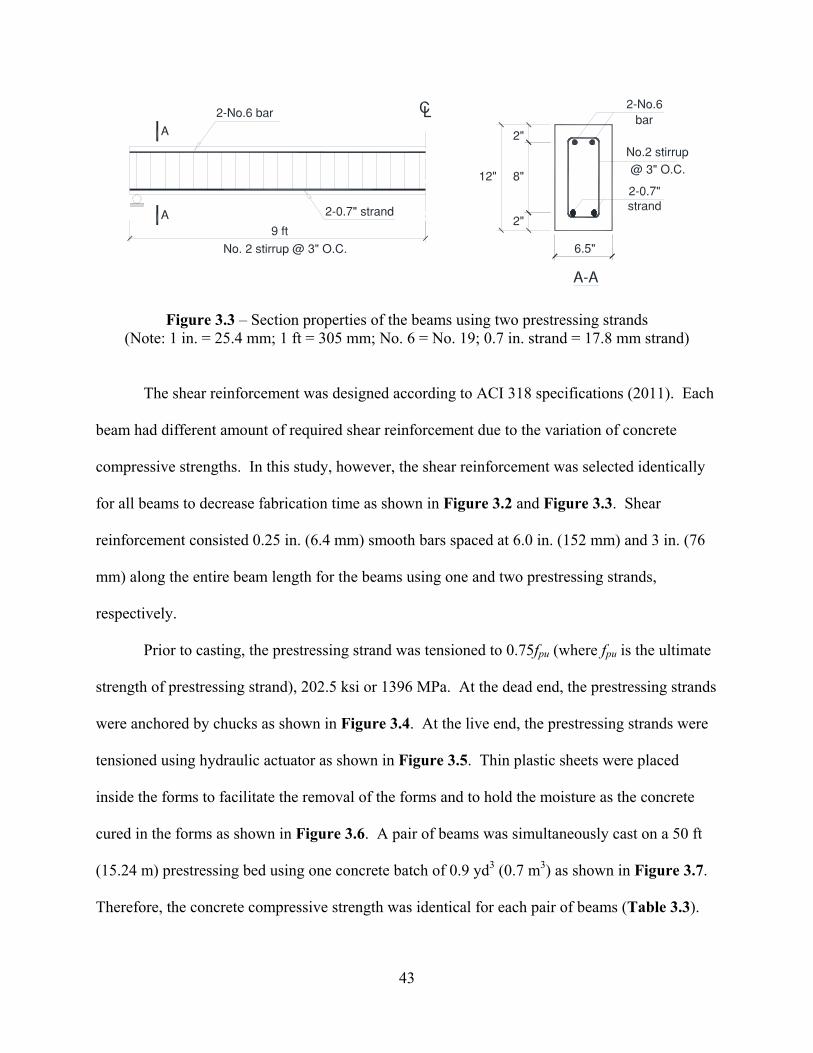
43
Figure 3.3 – Section properties of the beams using two prestressing strands (Note: 1 in. = 25.4 mm; 1 ft = 305 mm; No. 6 = No. 19; 0.7 in. strand = 17.8 mm strand)
The shear reinforcement was designed according to ACI 318 specifications (2011). Each
beam had different amount of required shear reinforcement due to the variation of concrete
compressive strengths. In this study, however, the shear reinforcement was selected identically
for all beams to decrease fabrication time as shown in Figure 3.2 and Figure 3.3. Shear
reinforcement consisted 0.25 in. (6.4 mm) smooth bars spaced at 6.0 in. (152 mm) and 3 in. (76
mm) along the entire beam length for the beams using one and two prestressing strands,
respectively.
Prior to casting, the prestressing strand was tensioned to 0.75fpu (where fpu is the ultimate
strength of prestressing strand), 202.5 ksi or 1396 MPa. At the dead end, the prestressing strands
were anchored by chucks as shown in Figure 3.4. At the live end, the prestressing strands were
tensioned using hydraulic actuator as shown in Figure 3.5. Thin plastic sheets were placed
inside the forms to facilitate the removal of the forms and to hold the moisture as the concrete
cured in the forms as shown in Figure 3.6. A pair of beams was simultaneously cast on a 50 ft
(15.24 m) prestressing bed using one concrete batch of 0.9 yd3 (0.7 m3) as shown in Figure 3.7.
Therefore, the concrete compressive strength was identical for each pair of beams (Table 3.3).
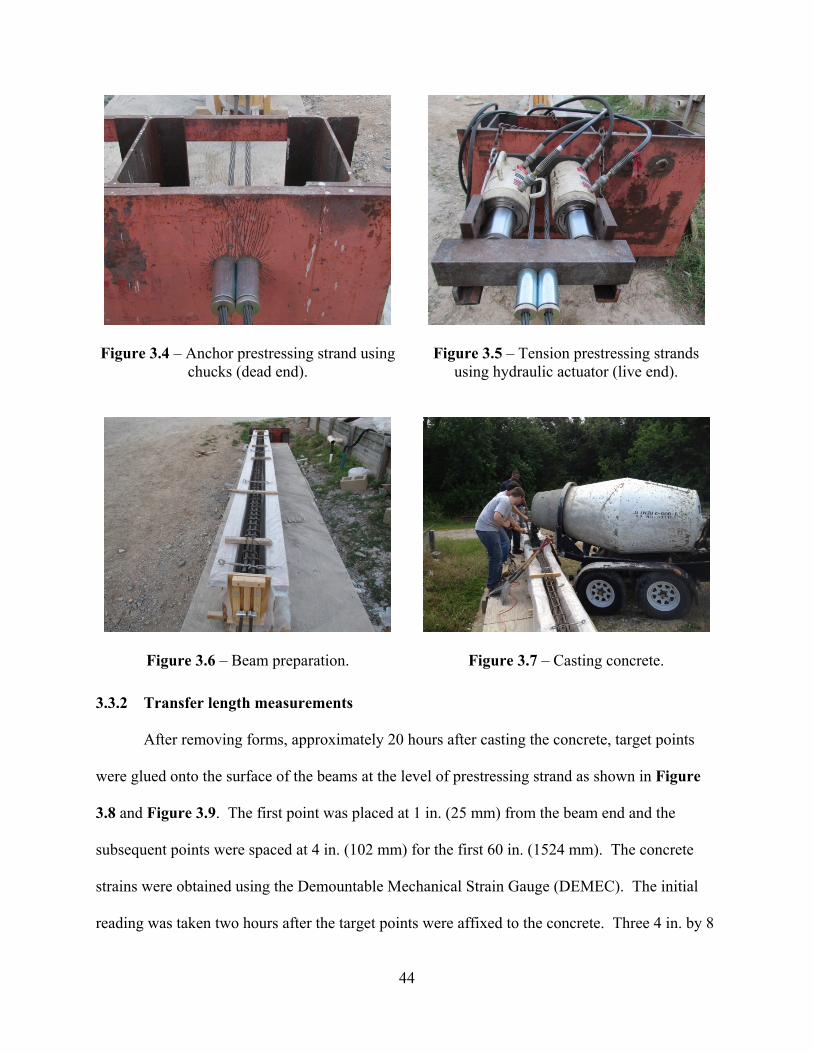
44
Figure 3.4 – Anchor prestressing strand using chucks (dead end).
Figure 3.5 – Tension prestressing strands using hydraulic actuator (live end).
Figure 3.6 – Beam preparation.
Figure 3.7 – Casting concrete.
Transfer length measurements 3.3.2
After removing forms, approximately 20 hours after casting the concrete, target points
were glued onto the surface of the beams at the level of prestressing strand as shown in Figure
3.8 and Figure 3.9. The first point was placed at 1 in. (25 mm) from the beam end and the
subsequent points were spaced at 4 in. (102 mm) for the first 60 in. (1524 mm). The concrete
strains were obtained using the Demountable Mechanical Strain Gauge (DEMEC). The initial
reading was taken two hours after the target points were affixed to the concrete. Three 4 in. by 8
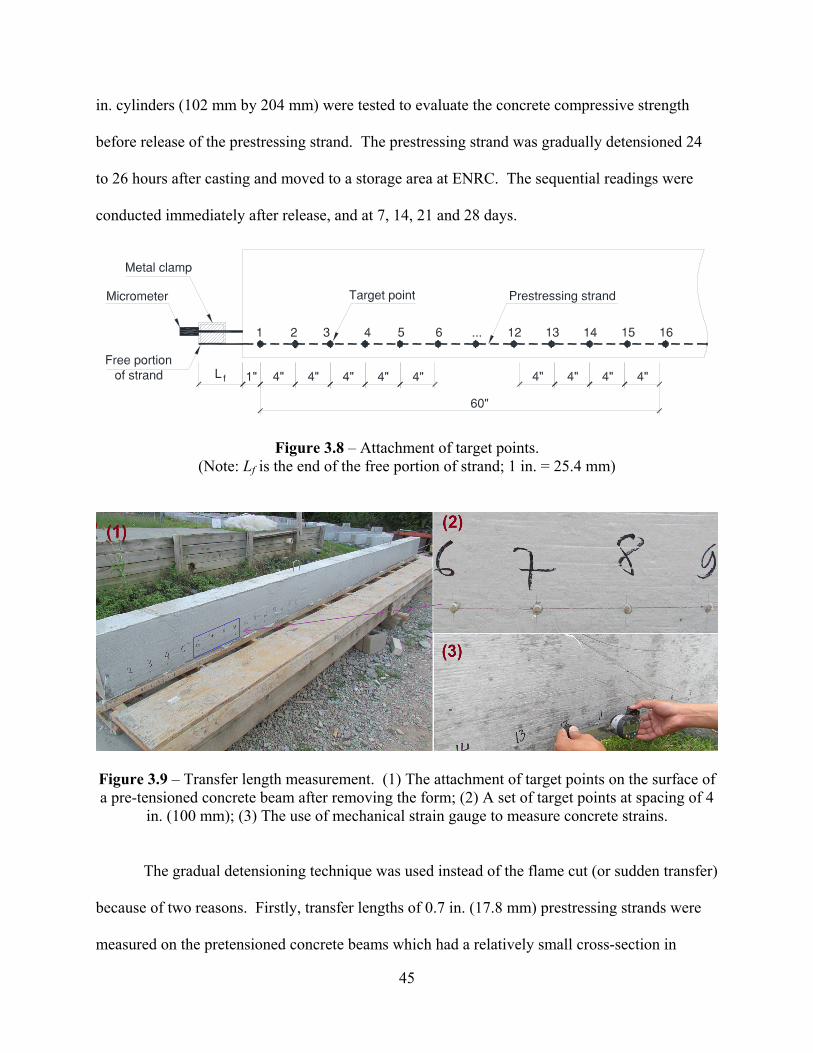
45
in. cylinders (102 mm by 204 mm) were tested to evaluate the concrete compressive strength
before release of the prestressing strand. The prestressing strand was gradually detensioned 24
to 26 hours after casting and moved to a storage area at ENRC. The sequential readings were
conducted immediately after release, and at 7, 14, 21 and 28 days.
Figure 3.8 – Attachment of target points. (Note: Lf is the end of the free portion of strand; 1 in. = 25.4 mm)
Figure 3.9 – Transfer length measurement. (1) The attachment of target points on the surface of a pre-tensioned concrete beam after removing the form; (2) A set of target points at spacing of 4
in. (100 mm); (3) The use of mechanical strain gauge to measure concrete strains.
The gradual detensioning technique was used instead of the flame cut (or sudden transfer)
because of two reasons. Firstly, transfer lengths of 0.7 in. (17.8 mm) prestressing strands were
measured on the pretensioned concrete beams which had a relatively small cross-section in
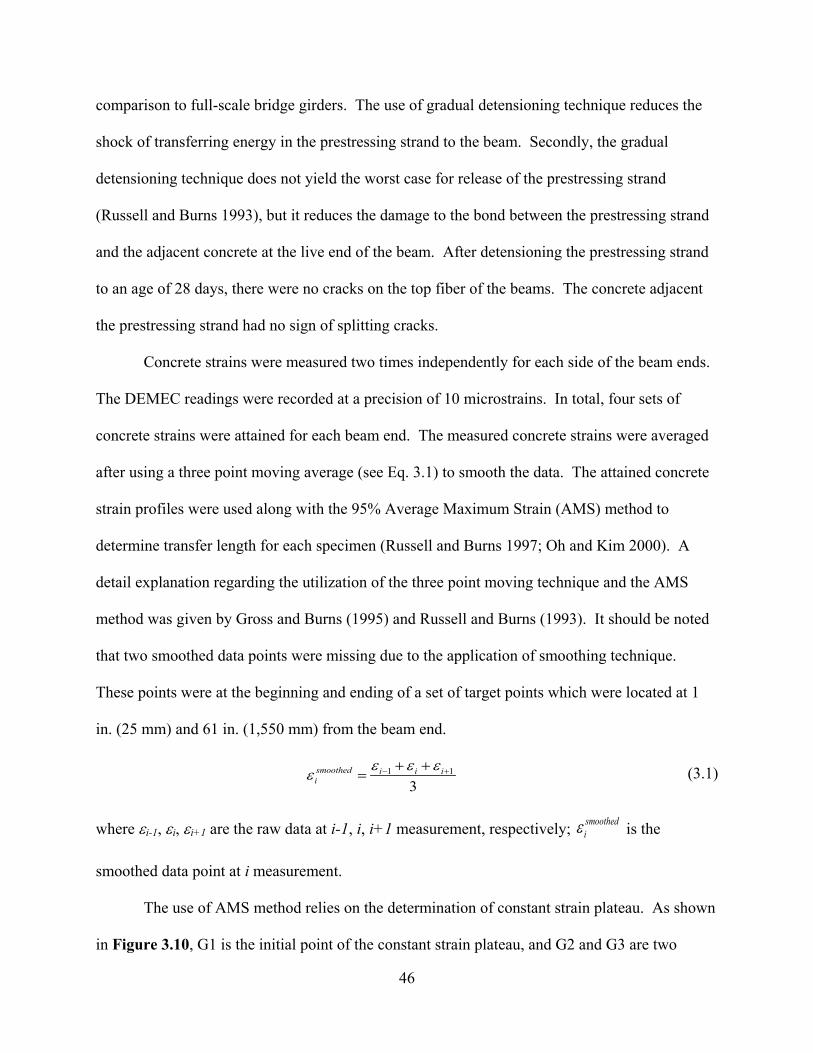
46
comparison to full-scale bridge girders. The use of gradual detensioning technique reduces the
shock of transferring energy in the prestressing strand to the beam. Secondly, the gradual
detensioning technique does not yield the worst case for release of the prestressing strand
(Russell and Burns 1993), but it reduces the damage to the bond between the prestressing strand
and the adjacent concrete at the live end of the beam. After detensioning the prestressing strand
to an age of 28 days, there were no cracks on the top fiber of the beams. The concrete adjacent
the prestressing strand had no sign of splitting cracks.
Concrete strains were measured two times independently for each side of the beam ends.
The DEMEC readings were recorded at a precision of 10 microstrains. In total, four sets of
concrete strains were attained for each beam end. The measured concrete strains were averaged
after using a three point moving average (see Eq. 3.1) to smooth the data. The attained concrete
strain profiles were used along with the 95% Average Maximum Strain (AMS) method to
determine transfer length for each specimen (Russell and Burns 1997; Oh and Kim 2000). A
detail explanation regarding the utilization of the three point moving technique and the AMS
method was given by Gross and Burns (1995) and Russell and Burns (1993). It should be noted
that two smoothed data points were missing due to the application of smoothing technique.
These points were at the beginning and ending of a set of target points which were located at 1
in. (25 mm) and 61 in. (1,550 mm) from the beam end.
1 1
3smoothed i i ii
ε ε εε − ++ += (3.1)
where εi-1, εi, εi+1 are the raw data at i-1, i, i+1 measurement, respectively; smoothediε is the
smoothed data point at i measurement.
The use of AMS method relies on the determination of constant strain plateau. As shown
in Figure 3.10, G1 is the initial point of the constant strain plateau, and G2 and G3 are two
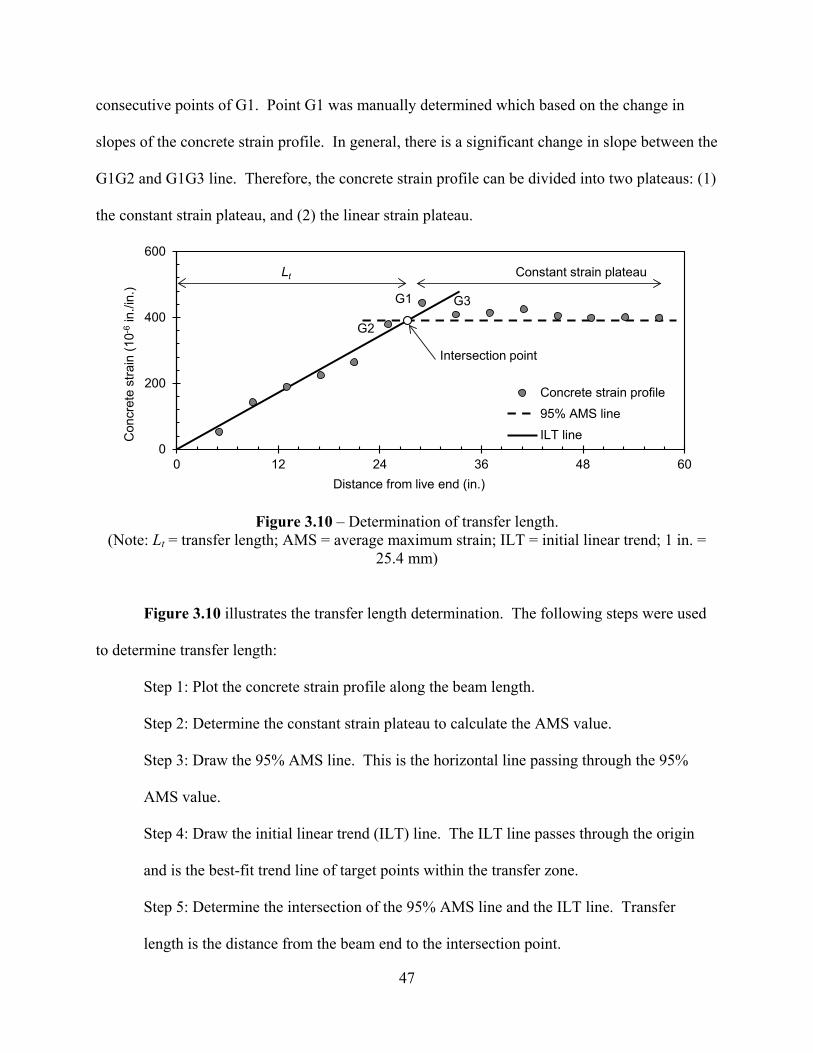
47
consecutive points of G1. Point G1 was manually determined which based on the change in
slopes of the concrete strain profile. In general, there is a significant change in slope between the
G1G2 and G1G3 line. Therefore, the concrete strain profile can be divided into two plateaus: (1)
the constant strain plateau, and (2) the linear strain plateau.
Figure 3.10 – Determination of transfer length. (Note: Lt = transfer length; AMS = average maximum strain; ILT = initial linear trend; 1 in. =
25.4 mm)
Figure 3.10 illustrates the transfer length determination. The following steps were used
to determine transfer length:
Step 1: Plot the concrete strain profile along the beam length.
Step 2: Determine the constant strain plateau to calculate the AMS value.
Step 3: Draw the 95% AMS line. This is the horizontal line passing through the 95%
AMS value.
Step 4: Draw the initial linear trend (ILT) line. The ILT line passes through the origin
and is the best-fit trend line of target points within the transfer zone.
Step 5: Determine the intersection of the 95% AMS line and the ILT line. Transfer
length is the distance from the beam end to the intersection point.
0
200
400
600
0 12 24 36 48 60
Con
cret
e st
rain
(10-6
in./i
n.)
Distance from live end (in.)
Concrete strain profile95% AMS lineILT line
Intersection point
Lt Constant strain plateau
G1
G2
G3
48
Previous studies used the distance from the beam end to intersection of the concrete strain
profile with the 95% AMS line as the defined transfer length (Gross and Burns 1995; Staton et
al. 2009; Floyd et al. 2011b; Dang et al. 2014b). The advantage of using the ILT in determining
transfer length is to reduce the effect of strain fluctuation near the end of transfer zone (Meyer et
al. 2002) and to give more precise and consistent results (Carroll 2009). Each target point within
the transfer zone has the same contribution in defining the ILT line. The use of the intersection
of the 95% AMS line and the ILT line has been implemented to estimate transfer length in
several studies (Morcous et al. 2011b; Maguire 2009; Patzlaff 2010; Morcous et al. 2013;
Morcous et al. 2014) and has been applied in this study.
Strand end-slip measurement 3.3.3
In order to measure strand end-slip, a metal clamp was attached to the prestressing strand
as shown in Figure 3.11. The initial and subsequent readings were conducted at the same time
concrete surface strains were measured. The nominal end-slip (δn) was computed as the
difference between the initial reading and the subsequent reading. Initial strand end-slip (δ) was
determined by subtracting the elastic shortening (ES) of the free strand portion from the nominal
end slip using Eq. 3.2 and 3.3.
pj f
p
f LES
E= (3.2)
n ESδ δ= − (3.3)
where ES is the elastic shortening of the free portion of strand; Lf the length of the free portion of
strand as shown in Figure 3.8; fpj is the jacking stress; Ep is the modulus of elasticity of
prestressing strand; δn is the nominal strand end-slip; δ is the initial strand end-slip.
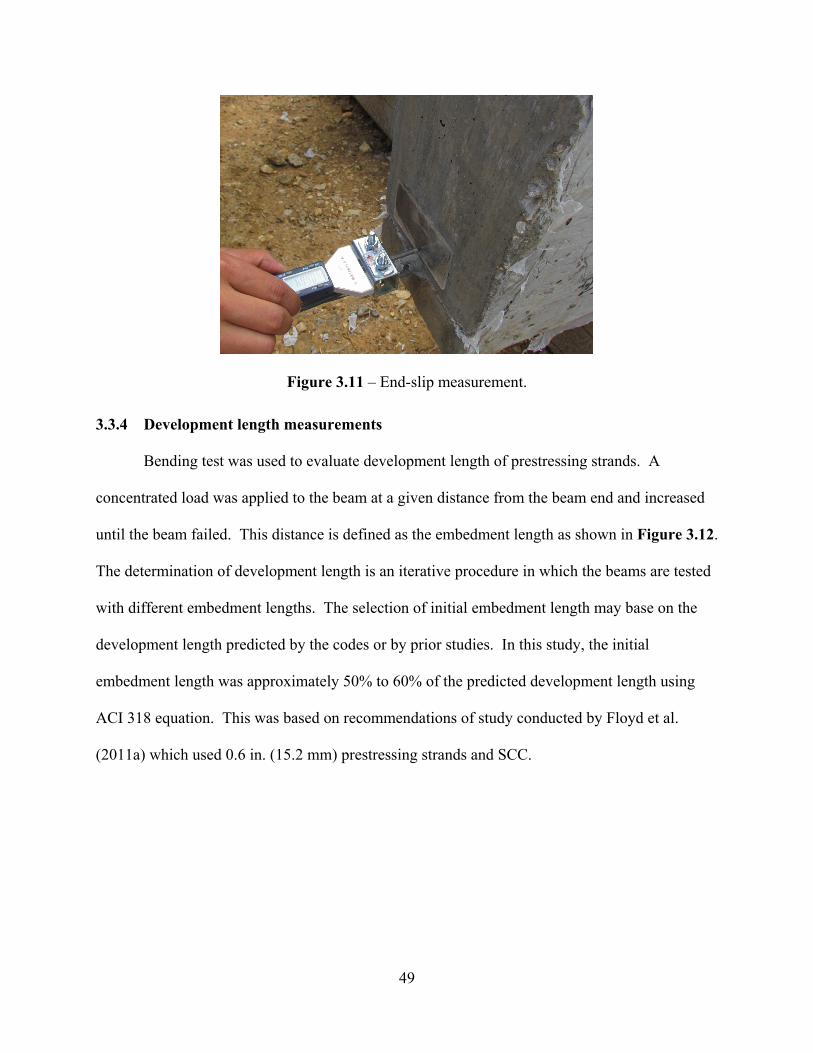
49
Figure 3.11 – End-slip measurement.
Development length measurements 3.3.4
Bending test was used to evaluate development length of prestressing strands. A
concentrated load was applied to the beam at a given distance from the beam end and increased
until the beam failed. This distance is defined as the embedment length as shown in Figure 3.12.
The determination of development length is an iterative procedure in which the beams are tested
with different embedment lengths. The selection of initial embedment length may base on the
development length predicted by the codes or by prior studies. In this study, the initial
embedment length was approximately 50% to 60% of the predicted development length using
ACI 318 equation. This was based on recommendations of study conducted by Floyd et al.
(2011a) which used 0.6 in. (15.2 mm) prestressing strands and SCC.
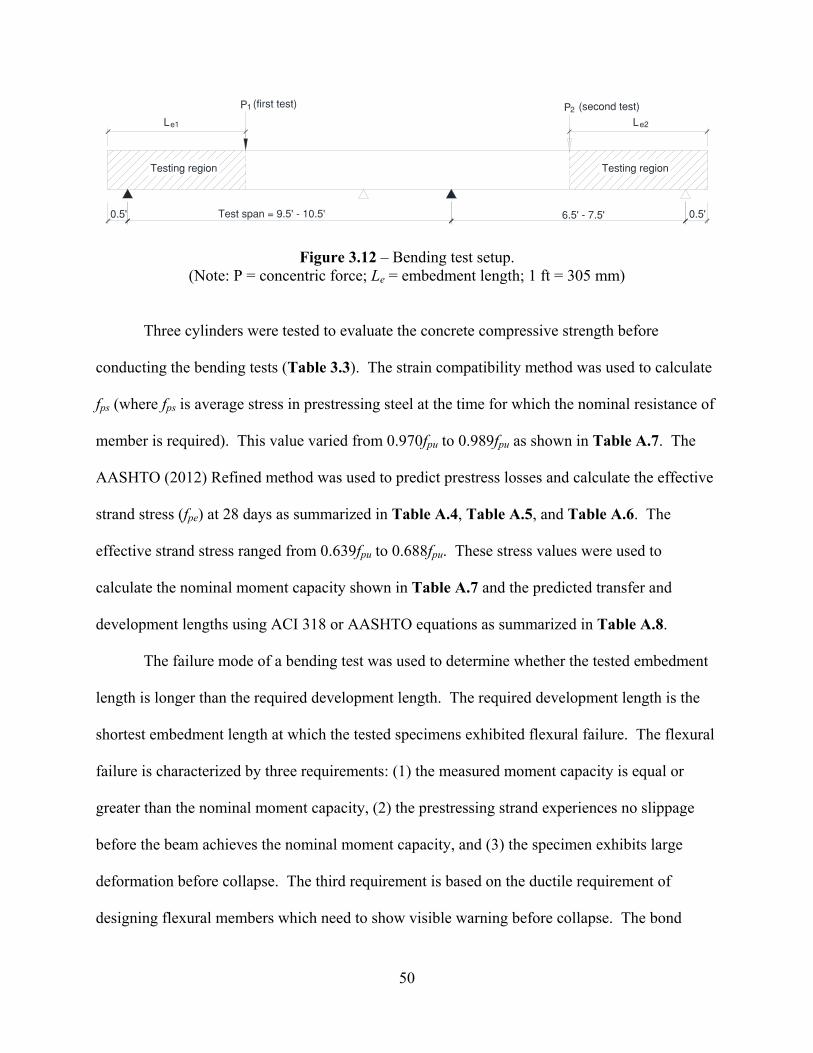
50
Figure 3.12 – Bending test setup. (Note: P = concentric force; Le = embedment length; 1 ft = 305 mm)
Three cylinders were tested to evaluate the concrete compressive strength before
conducting the bending tests (Table 3.3). The strain compatibility method was used to calculate
fps (where fps is average stress in prestressing steel at the time for which the nominal resistance of
member is required). This value varied from 0.970fpu to 0.989fpu as shown in Table A.7. The
AASHTO (2012) Refined method was used to predict prestress losses and calculate the effective
strand stress (fpe) at 28 days as summarized in Table A.4, Table A.5, and Table A.6. The
effective strand stress ranged from 0.639fpu to 0.688fpu. These stress values were used to
calculate the nominal moment capacity shown in Table A.7 and the predicted transfer and
development lengths using ACI 318 or AASHTO equations as summarized in Table A.8.
The failure mode of a bending test was used to determine whether the tested embedment
length is longer than the required development length. The required development length is the
shortest embedment length at which the tested specimens exhibited flexural failure. The flexural
failure is characterized by three requirements: (1) the measured moment capacity is equal or
greater than the nominal moment capacity, (2) the prestressing strand experiences no slippage
before the beam achieves the nominal moment capacity, and (3) the specimen exhibits large
deformation before collapse. The third requirement is based on the ductile requirement of
designing flexural members which need to show visible warning before collapse. The bond
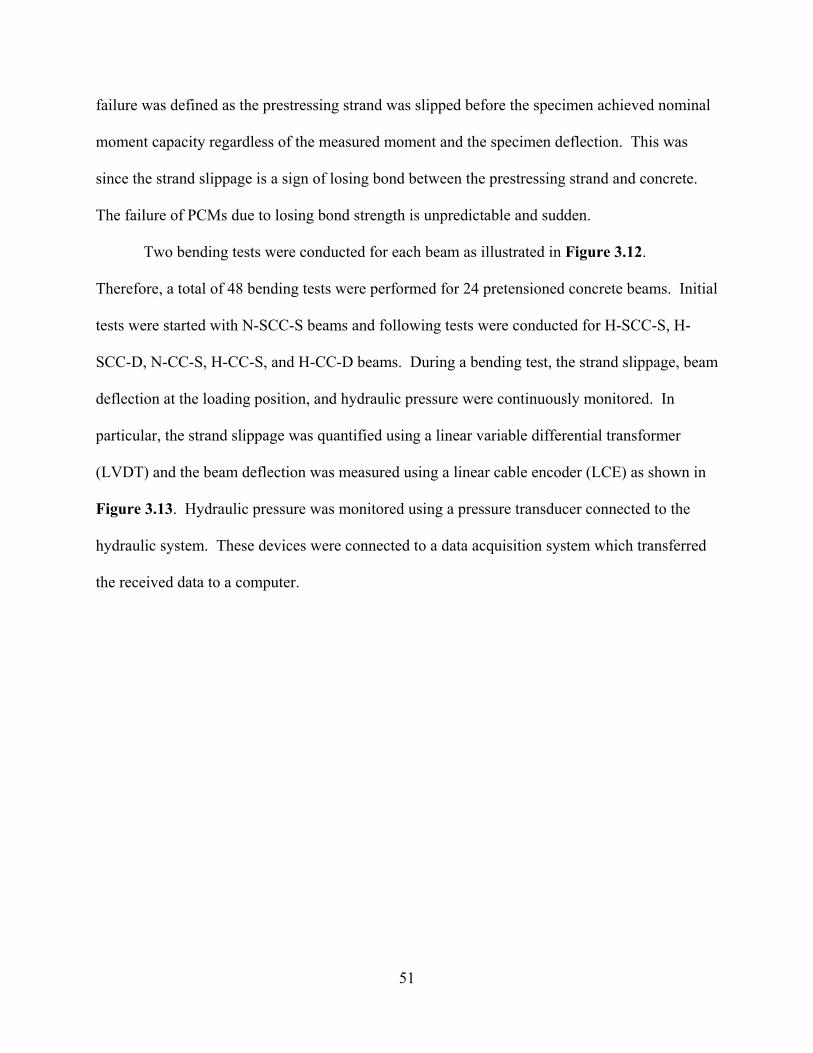
51
failure was defined as the prestressing strand was slipped before the specimen achieved nominal
moment capacity regardless of the measured moment and the specimen deflection. This was
since the strand slippage is a sign of losing bond between the prestressing strand and concrete.
The failure of PCMs due to losing bond strength is unpredictable and sudden.
Two bending tests were conducted for each beam as illustrated in Figure 3.12.
Therefore, a total of 48 bending tests were performed for 24 pretensioned concrete beams. Initial
tests were started with N-SCC-S beams and following tests were conducted for H-SCC-S, H-
SCC-D, N-CC-S, H-CC-S, and H-CC-D beams. During a bending test, the strand slippage, beam
deflection at the loading position, and hydraulic pressure were continuously monitored. In
particular, the strand slippage was quantified using a linear variable differential transformer
(LVDT) and the beam deflection was measured using a linear cable encoder (LCE) as shown in
Figure 3.13. Hydraulic pressure was monitored using a pressure transducer connected to the
hydraulic system. These devices were connected to a data acquisition system which transferred
the received data to a computer.
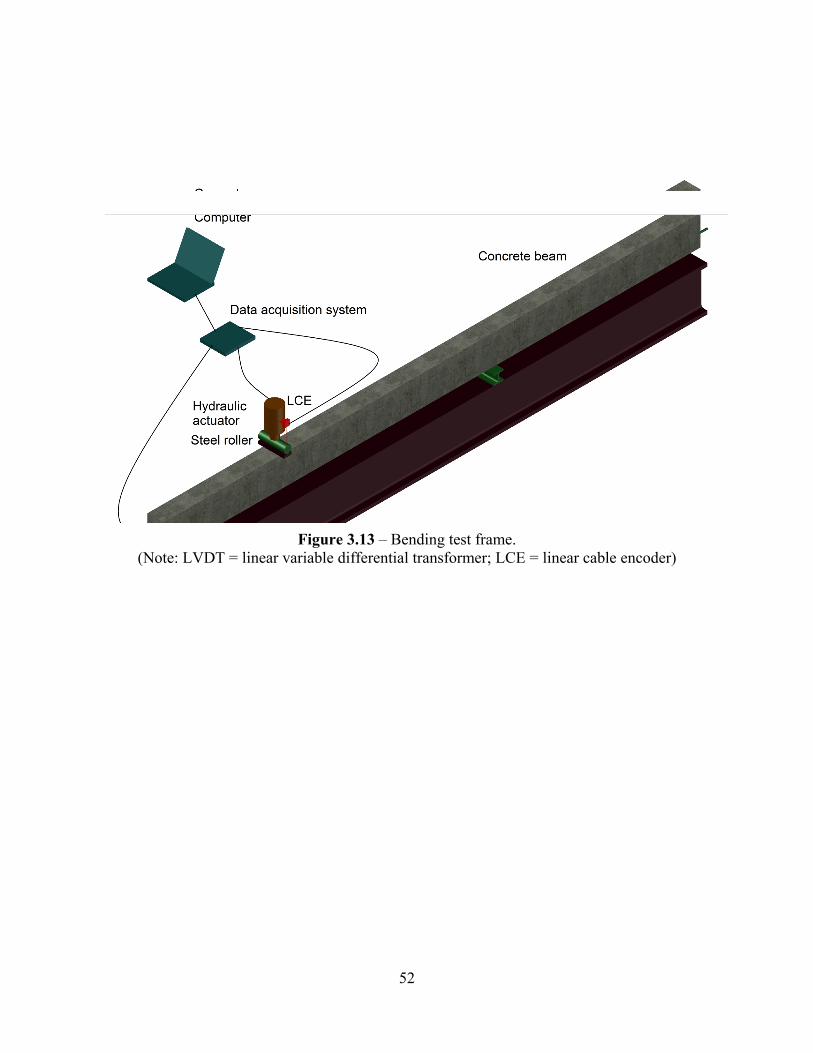
52
Figure 3.13 – Bending test frame.
(Note: LVDT = linear variable differential transformer; LCE = linear cable encoder)
53
: TRANSFER LENGTH RESULTS CHAPTER 4
This chapter presents the measured transfer lengths and strand end-slips of 24
pretensioned concrete beams. The beams were fabricated with conventional concrete and self-
consolidating concrete. The concrete strengths at 1 day ranged from 5.9 ksi to 9.8 ksi (40.7 MPa
to 67.6 MPa). Transfer lengths were determined using concrete surface strains along with the
Average Maximum Strain method. Initial strand end-slips were also measured for predicting
transfer length at release using an empirical formula. Experimental results indicated ACI 318
and AASHTO specifications are applicable for estimating transfer length of 0.7 in. (17.8 mm)
strands at release and at 28 days. A coefficient of 2.38 was the most appropriate value for
estimating transfer lengths at release from initial strand end-slips.
Measured transfer lengths 4.1
Figure 4.1 shows the determination of transfer lengths at the live end of beam N-CC-2 at
release and at 28 days. As shown in the figure, the concrete strain profiles fluctuated near the
end of transfer zone, so it was not suitable to use this region for determining transfer length. The
ILT line, however, best represents that strain measured by the target points within the transfer
zone. The measured transfer length using this technique may be more or less than that using the
first technique which used the distance from the beam end to intersection of the concrete strain
profile with the 95% AMS line as the defined transfer length. The differences are dependent
upon the fluctuation of the concrete strain profiles. The determination of transfer lengths for
remaining beams is shown in Appendix B.1.
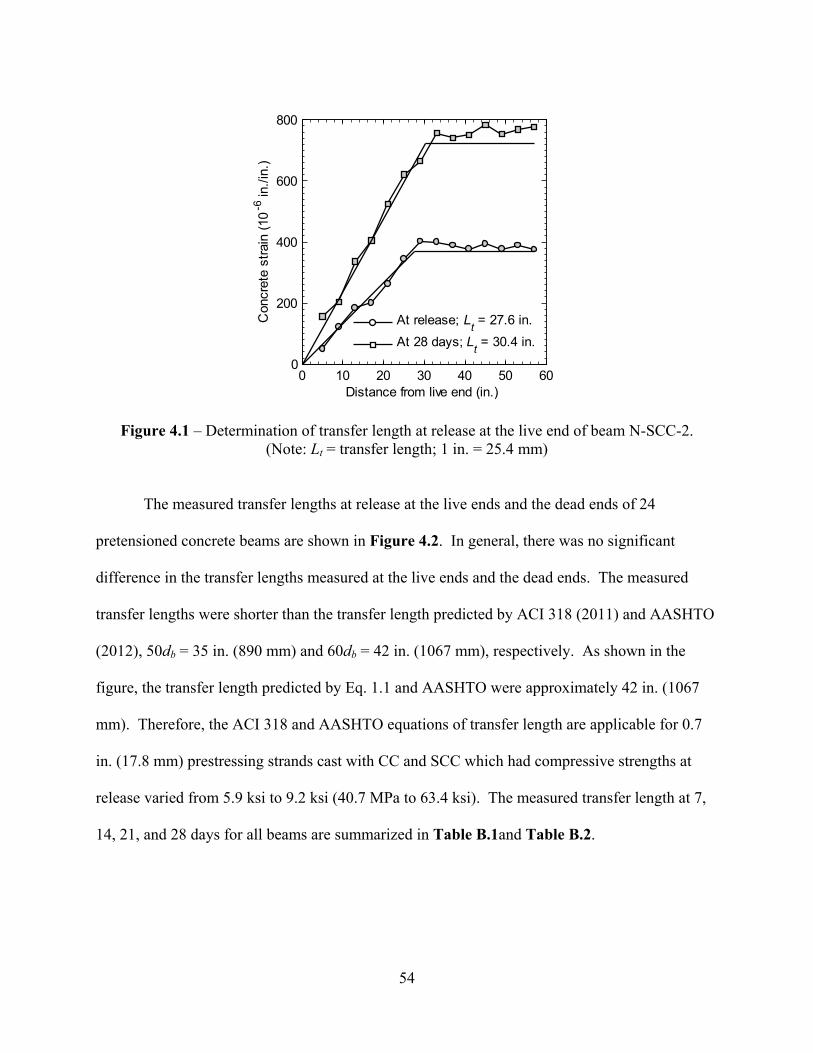
54
Figure 4.1 – Determination of transfer length at release at the live end of beam N-SCC-2. (Note: Lt = transfer length; 1 in. = 25.4 mm)
The measured transfer lengths at release at the live ends and the dead ends of 24
pretensioned concrete beams are shown in Figure 4.2. In general, there was no significant
difference in the transfer lengths measured at the live ends and the dead ends. The measured
transfer lengths were shorter than the transfer length predicted by ACI 318 (2011) and AASHTO
(2012), 50db = 35 in. (890 mm) and 60db = 42 in. (1067 mm), respectively. As shown in the
figure, the transfer length predicted by Eq. 1.1 and AASHTO were approximately 42 in. (1067
mm). Therefore, the ACI 318 and AASHTO equations of transfer length are applicable for 0.7
in. (17.8 mm) prestressing strands cast with CC and SCC which had compressive strengths at
release varied from 5.9 ksi to 9.2 ksi (40.7 MPa to 63.4 ksi). The measured transfer length at 7,
14, 21, and 28 days for all beams are summarized in Table B.1and Table B.2.
0 10 20 30 40 50 600
200
400
600
800
Distance from live end (in.)
Con
cret
e st
rain
(10
-6 in
./in.
)
At release; Lt = 27.6 in.At 28 days; Lt = 30.4 in.

55
Figure 4.2 – Transfer length at release at the live ends and dead ends of 24 pretensioned concrete beams.
(Note: db = strand diameter; 1 in. = 25.4 mm)
Statistical transfer lengths 4.2
For a given beam group, the measured transfer lengths were assumed to be normally
distributed. This assumption was applicable for the beams using the same type of prestressing
strands and casting procedures. Figure 4.3 shows the normal distribution of transfer lengths
obtained from N-CC-S beams which had an average concrete compressive strength of 6.3 ksi
0 12 24 36 48
N-CC-S1N-CC-S2N-CC-S3N-CC-S4H-CC-S1H-CC-S2H-CC-S3H-CC-S4H-CC-D1H-CC-D2H-CC-D3H-CC-D4N-SCC-S1N-SCC-S2N-SCC-S3N-SCC-S4H-SCC-S1H-SCC-S2H-SCC-S3H-SCC-S4H-SCC-D1H-SCC-D2H-SCC-D3H-SCC-D4
Beam length (in.)
Bea
m
168180192204216 Beam length (in.)
168 180 192 204 216
012243648
N-CC-S1N-CC-S2N-CC-S3N-CC-S4H-CC-S1H-CC-S2H-CC-S3H-CC-S4H-CC-D1H-CC-D2H-CC-D3H-CC-D4N-SCC-S1N-SCC-S2N-SCC-S3N-SCC-S4H-SCC-S1H-SCC-S2H-SCC-S3H-SCC-S4H-SCC-D1H-SCC-D2H-SCC-D3H-SCC-D4
Bea
m
Live endDead endEq. 1a50db
60db
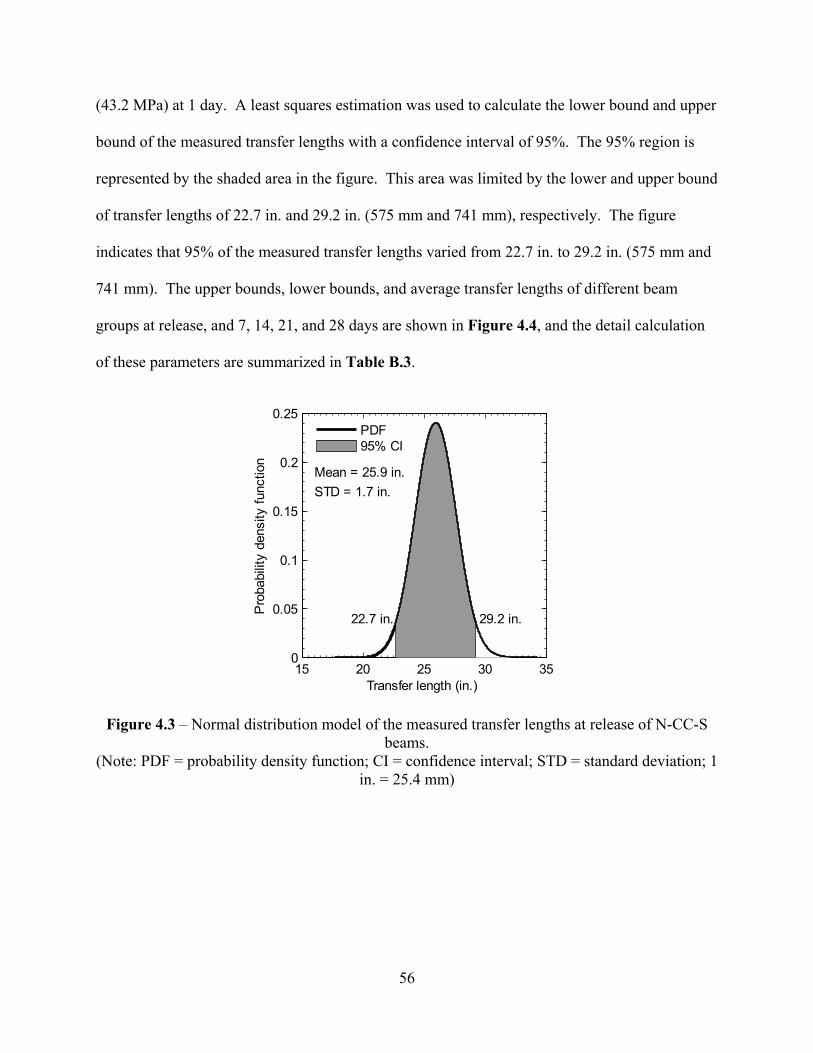
56
(43.2 MPa) at 1 day. A least squares estimation was used to calculate the lower bound and upper
bound of the measured transfer lengths with a confidence interval of 95%. The 95% region is
represented by the shaded area in the figure. This area was limited by the lower and upper bound
of transfer lengths of 22.7 in. and 29.2 in. (575 mm and 741 mm), respectively. The figure
indicates that 95% of the measured transfer lengths varied from 22.7 in. to 29.2 in. (575 mm and
741 mm). The upper bounds, lower bounds, and average transfer lengths of different beam
groups at release, and 7, 14, 21, and 28 days are shown in Figure 4.4, and the detail calculation
of these parameters are summarized in Table B.3.
Figure 4.3 – Normal distribution model of the measured transfer lengths at release of N-CC-S beams.
(Note: PDF = probability density function; CI = confidence interval; STD = standard deviation; 1 in. = 25.4 mm)
15 20 25 30 350
0.05
0.1
0.15
0.2
0.25
Mean = 25.9 in.STD = 1.7 in.
22.7 in. 29.2 in.
Transfer length (in.)
Pro
babi
lity
dens
ity fu
nctio
n
PDF95% CI
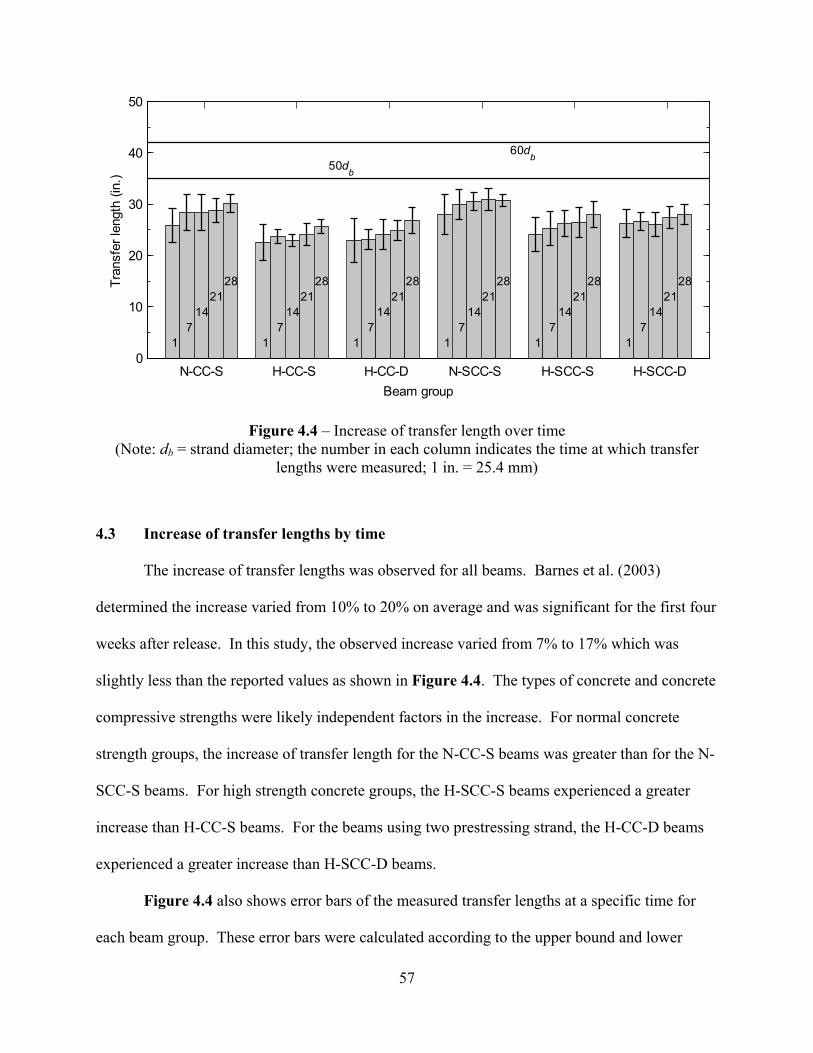
57
Figure 4.4 – Increase of transfer length over time (Note: db = strand diameter; the number in each column indicates the time at which transfer
lengths were measured; 1 in. = 25.4 mm)
Increase of transfer lengths by time 4.3
The increase of transfer lengths was observed for all beams. Barnes et al. (2003)
determined the increase varied from 10% to 20% on average and was significant for the first four
weeks after release. In this study, the observed increase varied from 7% to 17% which was
slightly less than the reported values as shown in Figure 4.4. The types of concrete and concrete
compressive strengths were likely independent factors in the increase. For normal concrete
strength groups, the increase of transfer length for the N-CC-S beams was greater than for the N-
SCC-S beams. For high strength concrete groups, the H-SCC-S beams experienced a greater
increase than H-CC-S beams. For the beams using two prestressing strand, the H-CC-D beams
experienced a greater increase than H-SCC-D beams.
Figure 4.4 also shows error bars of the measured transfer lengths at a specific time for
each beam group. These error bars were calculated according to the upper bound and lower
0
10
20
30
40
50
N-CC-S H-CC-S H-CC-D N-SCC-S H-SCC-S H-SCC-D
17
1421
28
17
1421
28
17
1421
28
17
1421
28
17
1421
28
17
1421
28
50db
60db
Beam group
Tran
sfer
leng
th (i
n.)
58
bound of a normal distribution with a confidence interval of 95%. As shown in the figure, the
ACI 318 equation (50db) and AASHTO equation (60db) overestimate the upper bounds of
measured transfer lengths at 28 days. The transfer length predicted by ACI 318 equation (Eq.
1.1) was approximate with the transfer length predicted by AASHTO equation. In summary, the
current specifications are applicable to predict transfer lengths of 0.7 in. (17.8 mm), Grade 270
(1860) prestressing strands for the first 28 days.
Transfer length comparison of CC and SCC 4.4
In this study, the N-CC-S and N-SCC-S beams had similar compressive strengths at
release of 6.3 ksi (43.4 MPa) and 5.9 ksi (40.7 MPa), respectively. The difference in these
strengths was approximately 7%, therefore, it was appropriate to compare the measured transfer
lengths regardless of the effect of concrete compressive strength. The measured transfer lengths
of these beams at release and at 28 days are shown in Figure 4.4. At release, the beams using
SCC exhibited greater transfer lengths than those of the beams using CC. This finding was
similar to the conclusion determined by Girgis and Tuan (2005). The average and maximum
difference were 8% and 21%, respectively. At 28 days, however, transfer lengths measured on
the beams using SCC and CC were similar. This indicated that the bond strength of prestressing
strands with SCC was lower than that with CC at early age. At 28 days, however, there was no
difference in the bond strength of prestressing strands with SCC and CC.
Effect of strand spacing 4.5
The effect of strand spacing on the measured transfer lengths are shown in Figure 4.5.
The average transfer length of H-CC-D and H-CC-S beams was similar regardless of the
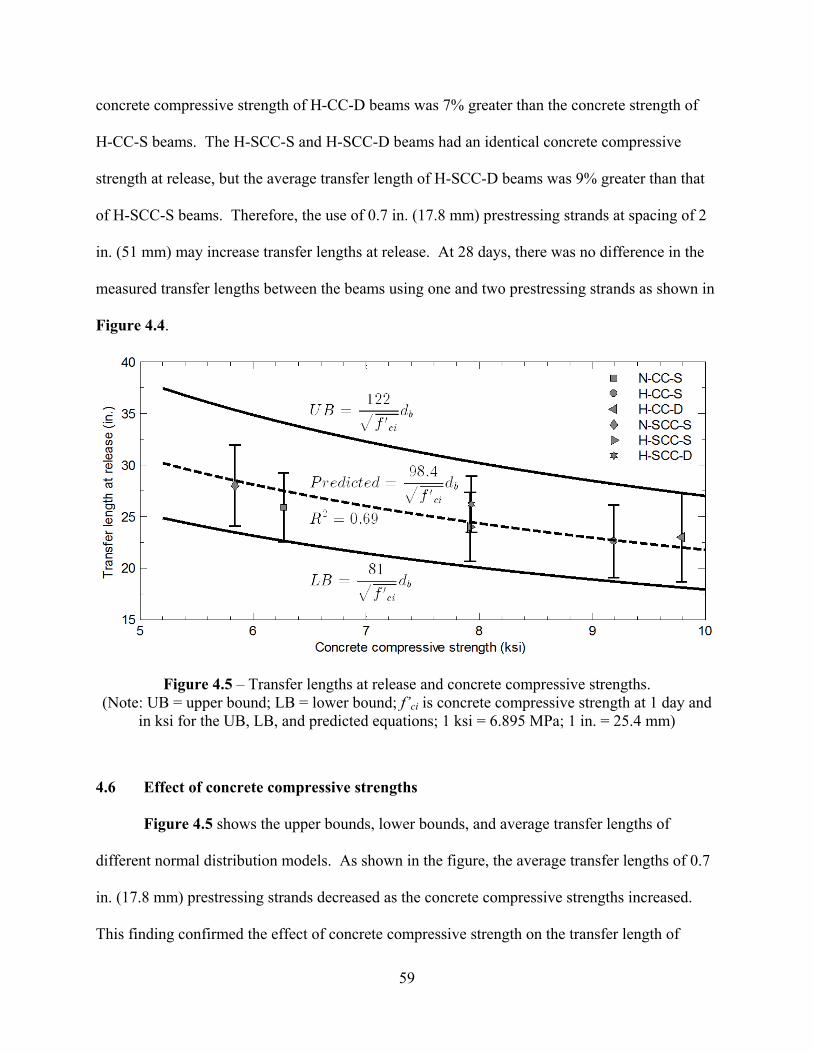
59
concrete compressive strength of H-CC-D beams was 7% greater than the concrete strength of
H-CC-S beams. The H-SCC-S and H-SCC-D beams had an identical concrete compressive
strength at release, but the average transfer length of H-SCC-D beams was 9% greater than that
of H-SCC-S beams. Therefore, the use of 0.7 in. (17.8 mm) prestressing strands at spacing of 2
in. (51 mm) may increase transfer lengths at release. At 28 days, there was no difference in the
measured transfer lengths between the beams using one and two prestressing strands as shown in
Figure 4.4.
Figure 4.5 – Transfer lengths at release and concrete compressive strengths. (Note: UB = upper bound; LB = lower bound; f’ci is concrete compressive strength at 1 day and
in ksi for the UB, LB, and predicted equations; 1 ksi = 6.895 MPa; 1 in. = 25.4 mm)
Effect of concrete compressive strengths 4.6
Figure 4.5 shows the upper bounds, lower bounds, and average transfer lengths of
different normal distribution models. As shown in the figure, the average transfer lengths of 0.7
in. (17.8 mm) prestressing strands decreased as the concrete compressive strengths increased.
This finding confirmed the effect of concrete compressive strength on the transfer length of
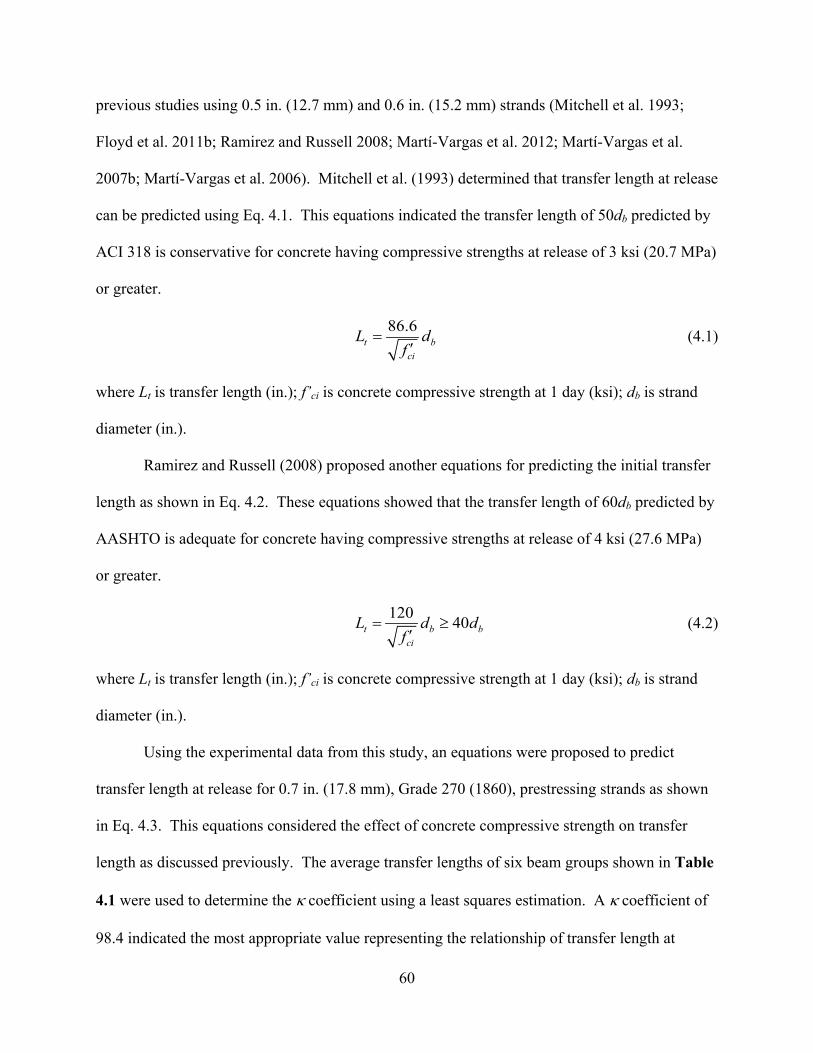
60
previous studies using 0.5 in. (12.7 mm) and 0.6 in. (15.2 mm) strands (Mitchell et al. 1993;
Floyd et al. 2011b; Ramirez and Russell 2008; Martí-Vargas et al. 2012; Martí-Vargas et al.
2007b; Martí-Vargas et al. 2006). Mitchell et al. (1993) determined that transfer length at release
can be predicted using Eq. 4.1. This equations indicated the transfer length of 50db predicted by
ACI 318 is conservative for concrete having compressive strengths at release of 3 ksi (20.7 MPa)
or greater.
86.6t b
ci
L df
=′
(4.1)
where Lt is transfer length (in.); f’ci is concrete compressive strength at 1 day (ksi); db is strand
diameter (in.).
Ramirez and Russell (2008) proposed another equations for predicting the initial transfer
length as shown in Eq. 4.2. These equations showed that the transfer length of 60db predicted by
AASHTO is adequate for concrete having compressive strengths at release of 4 ksi (27.6 MPa)
or greater.
120 40t b bci
L d df
= ≥′
(4.2)
where Lt is transfer length (in.); f’ci is concrete compressive strength at 1 day (ksi); db is strand
diameter (in.).
Using the experimental data from this study, an equations were proposed to predict
transfer length at release for 0.7 in. (17.8 mm), Grade 270 (1860), prestressing strands as shown
in Eq. 4.3. This equations considered the effect of concrete compressive strength on transfer
length as discussed previously. The average transfer lengths of six beam groups shown in Table
4.1 were used to determine the κ coefficient using a least squares estimation. A κ coefficient of
98.4 indicated the most appropriate value representing the relationship of transfer length at
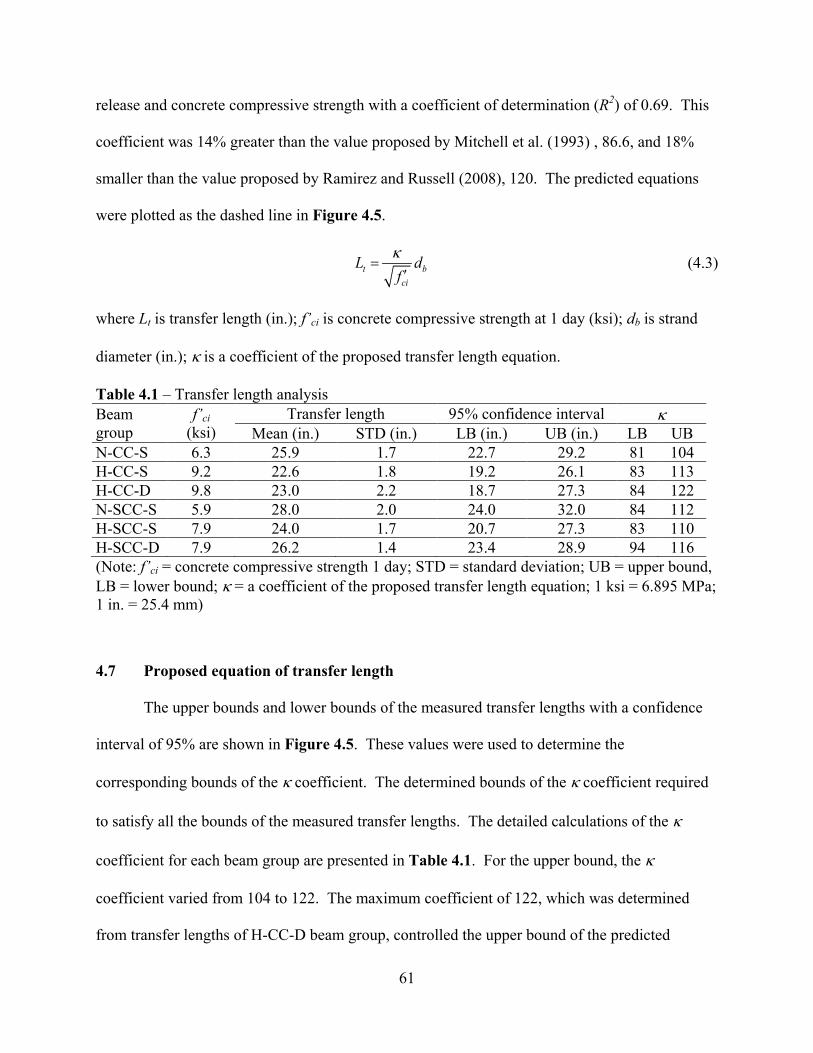
61
release and concrete compressive strength with a coefficient of determination (R2) of 0.69. This
coefficient was 14% greater than the value proposed by Mitchell et al. (1993) , 86.6, and 18%
smaller than the value proposed by Ramirez and Russell (2008), 120. The predicted equations
were plotted as the dashed line in Figure 4.5.
t bci
L df
κ=
′ (4.3)
where Lt is transfer length (in.); f’ci is concrete compressive strength at 1 day (ksi); db is strand
diameter (in.); κ is a coefficient of the proposed transfer length equation.
Table 4.1 – Transfer length analysis Beam group
f’ci (ksi)
Transfer length 95% confidence interval κ Mean (in.) STD (in.) LB (in.) UB (in.) LB UB
N-CC-S 6.3 25.9 1.7 22.7 29.2 81 104 H-CC-S 9.2 22.6 1.8 19.2 26.1 83 113 H-CC-D 9.8 23.0 2.2 18.7 27.3 84 122 N-SCC-S 5.9 28.0 2.0 24.0 32.0 84 112 H-SCC-S 7.9 24.0 1.7 20.7 27.3 83 110 H-SCC-D 7.9 26.2 1.4 23.4 28.9 94 116 (Note: f’ci = concrete compressive strength 1 day; STD = standard deviation; UB = upper bound, LB = lower bound; κ = a coefficient of the proposed transfer length equation; 1 ksi = 6.895 MPa; 1 in. = 25.4 mm)
Proposed equation of transfer length 4.7
The upper bounds and lower bounds of the measured transfer lengths with a confidence
interval of 95% are shown in Figure 4.5. These values were used to determine the
corresponding bounds of the κ coefficient. The determined bounds of the κ coefficient required
to satisfy all the bounds of the measured transfer lengths. The detailed calculations of the κ
coefficient for each beam group are presented in Table 4.1. For the upper bound, the κ
coefficient varied from 104 to 122. The maximum coefficient of 122, which was determined
from transfer lengths of H-CC-D beam group, controlled the upper bound of the predicted
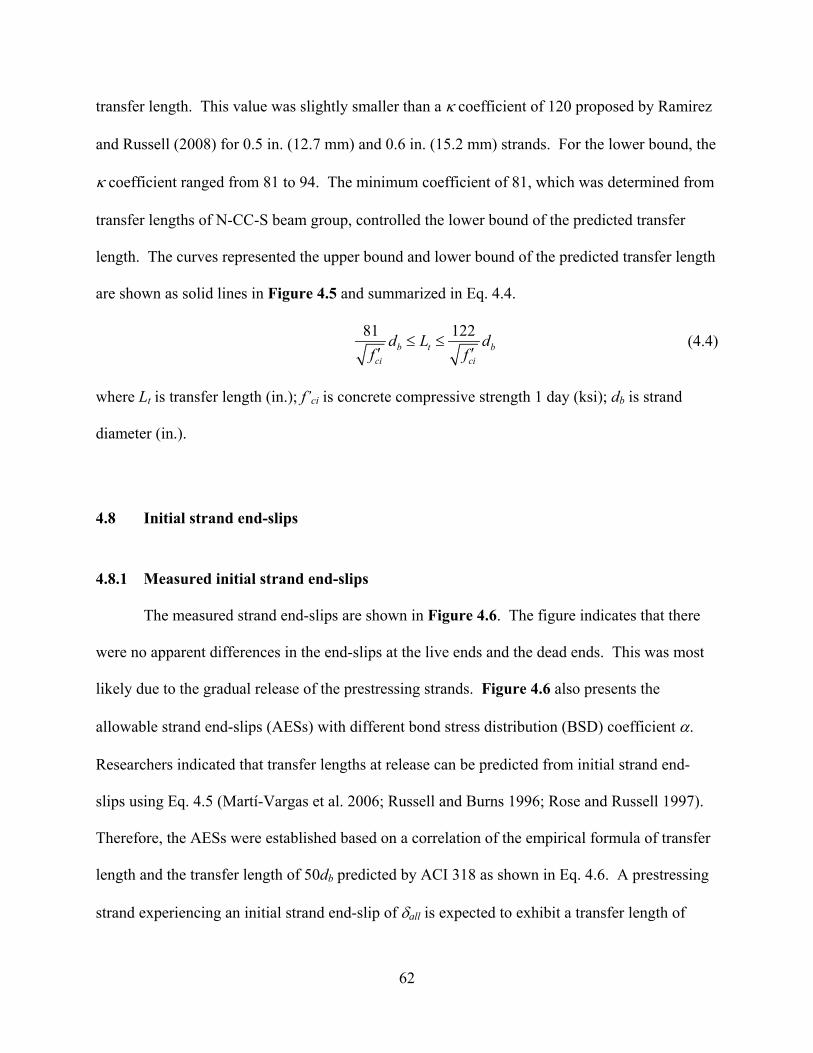
62
transfer length. This value was slightly smaller than a κ coefficient of 120 proposed by Ramirez
and Russell (2008) for 0.5 in. (12.7 mm) and 0.6 in. (15.2 mm) strands. For the lower bound, the
κ coefficient ranged from 81 to 94. The minimum coefficient of 81, which was determined from
transfer lengths of N-CC-S beam group, controlled the lower bound of the predicted transfer
length. The curves represented the upper bound and lower bound of the predicted transfer length
are shown as solid lines in Figure 4.5 and summarized in Eq. 4.4.
81 122b t b
ci ci
d L df f
≤ ≤′ ′
(4.4)
where Lt is transfer length (in.); f’ci is concrete compressive strength 1 day (ksi); db is strand
diameter (in.).
Initial strand end-slips 4.8
Measured initial strand end-slips 4.8.1
The measured strand end-slips are shown in Figure 4.6. The figure indicates that there
were no apparent differences in the end-slips at the live ends and the dead ends. This was most
likely due to the gradual release of the prestressing strands. Figure 4.6 also presents the
allowable strand end-slips (AESs) with different bond stress distribution (BSD) coefficient α.
Researchers indicated that transfer lengths at release can be predicted from initial strand end-
slips using Eq. 4.5 (Martí-Vargas et al. 2006; Russell and Burns 1996; Rose and Russell 1997).
Therefore, the AESs were established based on a correlation of the empirical formula of transfer
length and the transfer length of 50db predicted by ACI 318 as shown in Eq. 4.6. A prestressing
strand experiencing an initial strand end-slip of δall is expected to exhibit a transfer length of
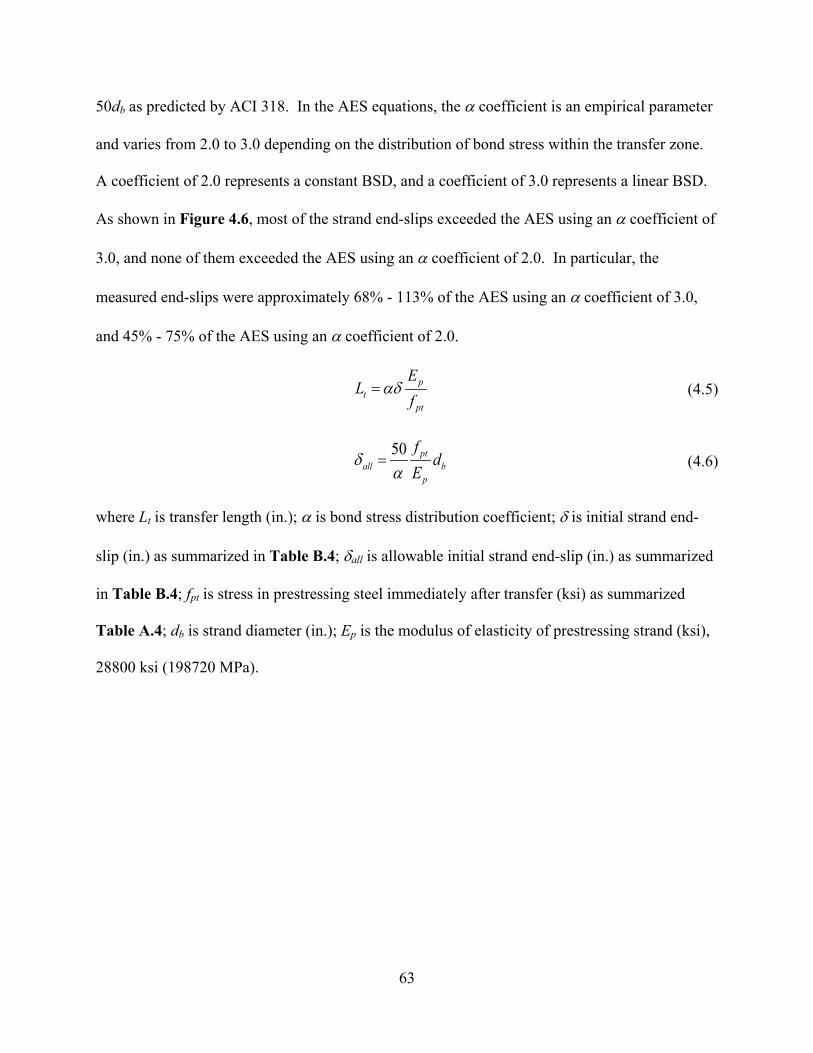
63
50db as predicted by ACI 318. In the AES equations, the α coefficient is an empirical parameter
and varies from 2.0 to 3.0 depending on the distribution of bond stress within the transfer zone.
A coefficient of 2.0 represents a constant BSD, and a coefficient of 3.0 represents a linear BSD.
As shown in Figure 4.6, most of the strand end-slips exceeded the AES using an α coefficient of
3.0, and none of them exceeded the AES using an α coefficient of 2.0. In particular, the
measured end-slips were approximately 68% - 113% of the AES using an α coefficient of 3.0,
and 45% - 75% of the AES using an α coefficient of 2.0.
pt
pt
EL
fαδ= (4.5)
50 ptall b
p
fd
Eδ
α= (4.6)
where Lt is transfer length (in.); α is bond stress distribution coefficient; δ is initial strand end-
slip (in.) as summarized in Table B.4; δall is allowable initial strand end-slip (in.) as summarized
in Table B.4; fpt is stress in prestressing steel immediately after transfer (ksi) as summarized
Table A.4; db is strand diameter (in.); Ep is the modulus of elasticity of prestressing strand (ksi),
28800 ksi (198720 MPa).
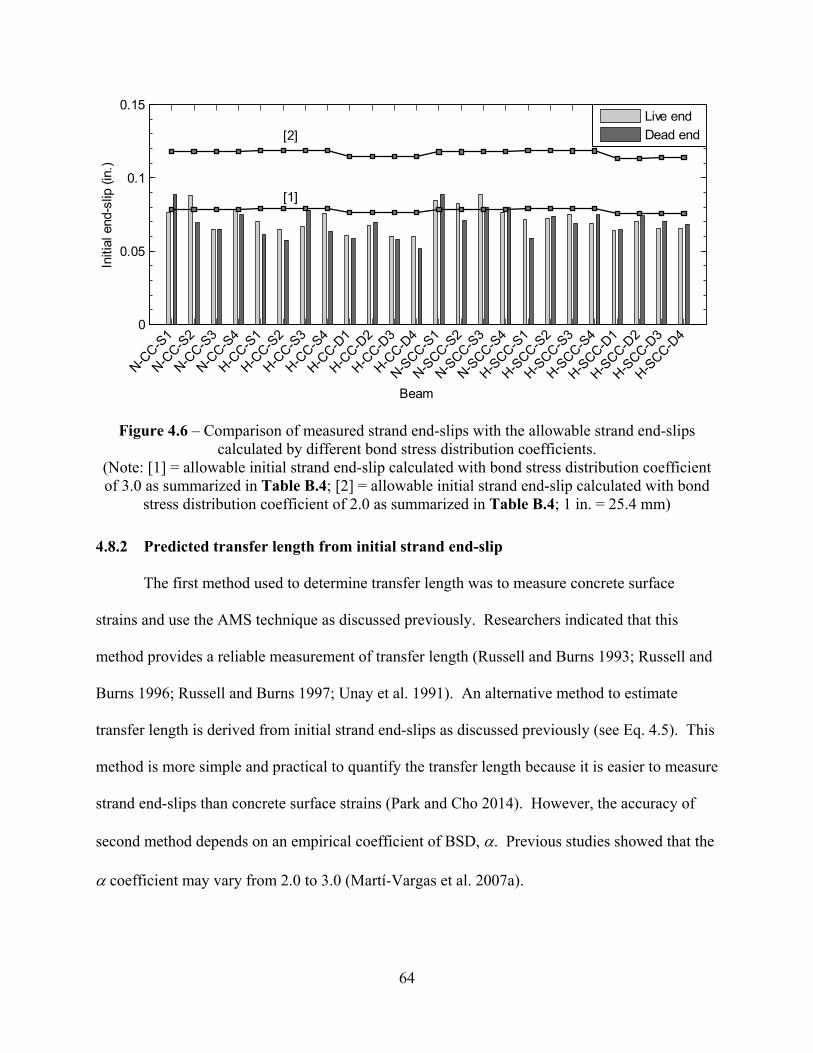
64
Figure 4.6 – Comparison of measured strand end-slips with the allowable strand end-slips calculated by different bond stress distribution coefficients.
(Note: [1] = allowable initial strand end-slip calculated with bond stress distribution coefficient of 3.0 as summarized in Table B.4; [2] = allowable initial strand end-slip calculated with bond
stress distribution coefficient of 2.0 as summarized in Table B.4; 1 in. = 25.4 mm)
Predicted transfer length from initial strand end-slip 4.8.2
The first method used to determine transfer length was to measure concrete surface
strains and use the AMS technique as discussed previously. Researchers indicated that this
method provides a reliable measurement of transfer length (Russell and Burns 1993; Russell and
Burns 1996; Russell and Burns 1997; Unay et al. 1991). An alternative method to estimate
transfer length is derived from initial strand end-slips as discussed previously (see Eq. 4.5). This
method is more simple and practical to quantify the transfer length because it is easier to measure
strand end-slips than concrete surface strains (Park and Cho 2014). However, the accuracy of
second method depends on an empirical coefficient of BSD, α. Previous studies showed that the
α coefficient may vary from 2.0 to 3.0 (Martí-Vargas et al. 2007a).
0
0.05
0.1
0.15
[1]
[2]
N-CC-S
1
N-CC-S
2
N-CC-S
3
N-CC-S
4
H-CC-S
1
H-CC-S
2
H-CC-S
3
H-CC-S
4
H-CC-D
1
H-CC-D
2
H-CC-D
3
H-CC-D
4
N-SCC-S
1
N-SCC-S
2
N-SCC-S
3
N-SCC-S
4
H-SCC-S
1
H-SCC-S
2
H-SCC-S
3
H-SCC-S
4
H-SCC-D
1
H-SCC-D
2
H-SCC-D
3
H-SCC-D
4
Initi
al e
nd-s
lip (i
n.)
Beam
Live endDead end
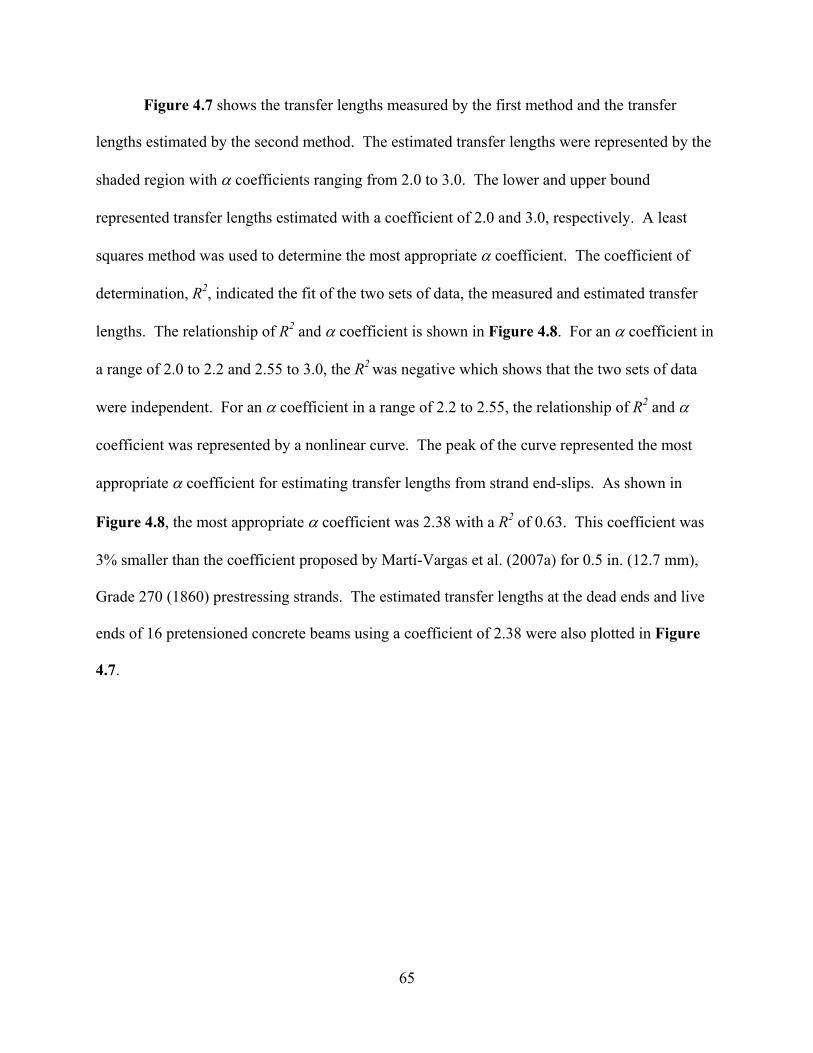
65
Figure 4.7 shows the transfer lengths measured by the first method and the transfer
lengths estimated by the second method. The estimated transfer lengths were represented by the
shaded region with α coefficients ranging from 2.0 to 3.0. The lower and upper bound
represented transfer lengths estimated with a coefficient of 2.0 and 3.0, respectively. A least
squares method was used to determine the most appropriate α coefficient. The coefficient of
determination, R2, indicated the fit of the two sets of data, the measured and estimated transfer
lengths. The relationship of R2 and α coefficient is shown in Figure 4.8. For an α coefficient in
a range of 2.0 to 2.2 and 2.55 to 3.0, the R2 was negative which shows that the two sets of data
were independent. For an α coefficient in a range of 2.2 to 2.55, the relationship of R2 and α
coefficient was represented by a nonlinear curve. The peak of the curve represented the most
appropriate α coefficient for estimating transfer lengths from strand end-slips. As shown in
Figure 4.8, the most appropriate α coefficient was 2.38 with a R2 of 0.63. This coefficient was
3% smaller than the coefficient proposed by Martí-Vargas et al. (2007a) for 0.5 in. (12.7 mm),
Grade 270 (1860) prestressing strands. The estimated transfer lengths at the dead ends and live
ends of 16 pretensioned concrete beams using a coefficient of 2.38 were also plotted in Figure
4.7.
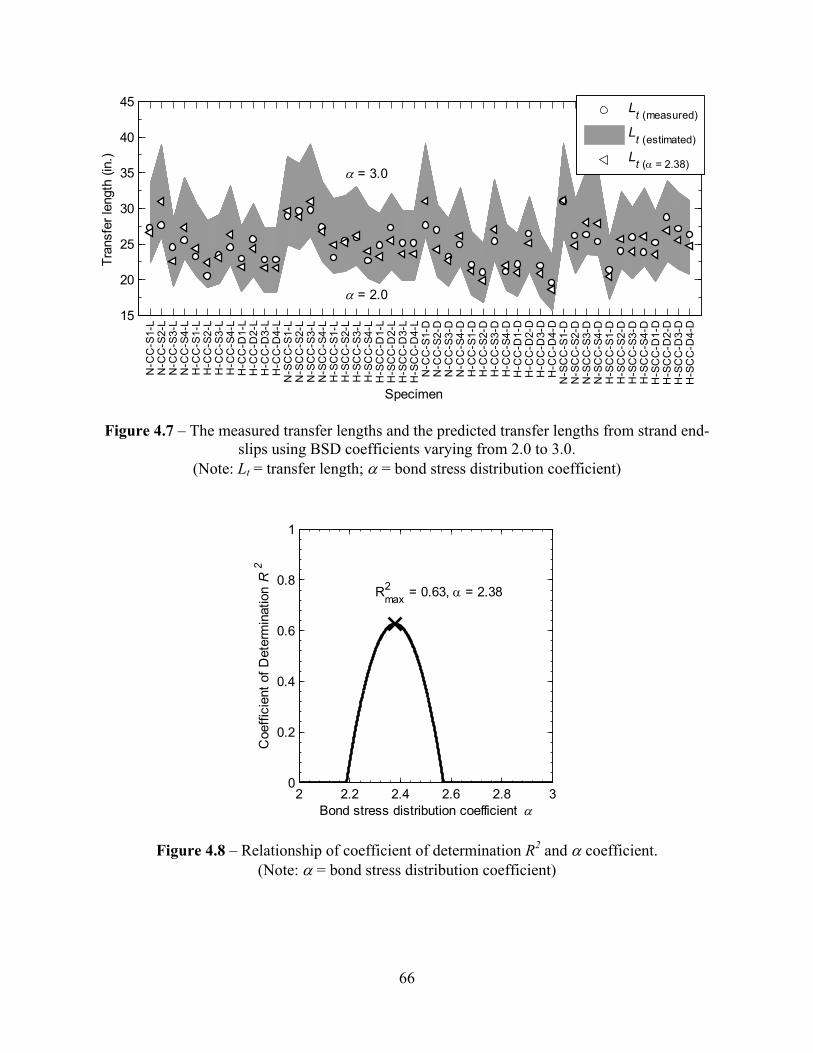
66
Figure 4.7 – The measured transfer lengths and the predicted transfer lengths from strand end-slips using BSD coefficients varying from 2.0 to 3.0.
(Note: Lt = transfer length; α = bond stress distribution coefficient)
Figure 4.8 – Relationship of coefficient of determination R2 and α coefficient. (Note: α = bond stress distribution coefficient)
15
20
25
30
35
40
45
α = 3.0
α = 2.0
N-C
C-S
1-L
N-C
C-S
2-L
N-C
C-S
3-L
N-C
C-S
4-L
H-C
C-S
1-L
H-C
C-S
2-L
H-C
C-S
3-L
H-C
C-S
4-L
H-C
C-D
1-L
H-C
C-D
2-L
H-C
C-D
3-L
H-C
C-D
4-L
N-S
CC
-S1-
LN
-SC
C-S
2-L
N-S
CC
-S3-
LN
-SC
C-S
4-L
H-S
CC
-S1-
LH
-SC
C-S
2-L
H-S
CC
-S3-
LH
-SC
C-S
4-L
H-S
CC
-D1-
LH
-SC
C-D
2-L
H-S
CC
-D3-
LH
-SC
C-D
4-L
N-C
C-S
1-D
N-C
C-S
2-D
N-C
C-S
3-D
N-C
C-S
4-D
H-C
C-S
1-D
H-C
C-S
2-D
H-C
C-S
3-D
H-C
C-S
4-D
H-C
C-D
1-D
H-C
C-D
2-D
H-C
C-D
3-D
H-C
C-D
4-D
N-S
CC
-S1-
DN
-SC
C-S
2-D
N-S
CC
-S3-
DN
-SC
C-S
4-D
H-S
CC
-S1-
DH
-SC
C-S
2-D
H-S
CC
-S3-
DH
-SC
C-S
4-D
H-S
CC
-D1-
DH
-SC
C-D
2-D
H-S
CC
-D3-
DH
-SC
C-D
4-D
Tran
sfer
leng
th (i
n.)
Specimen
Lt (measured)
Lt (estimated)
Lt (α = 2.38)
2 2.2 2.4 2.6 2.8 30
0.2
0.4
0.6
0.8
1
R2max = 0.63, α = 2.38
Bond stress distribution coefficient α
Coe
ffici
ent o
f Det
erm
inat
ion
R 2
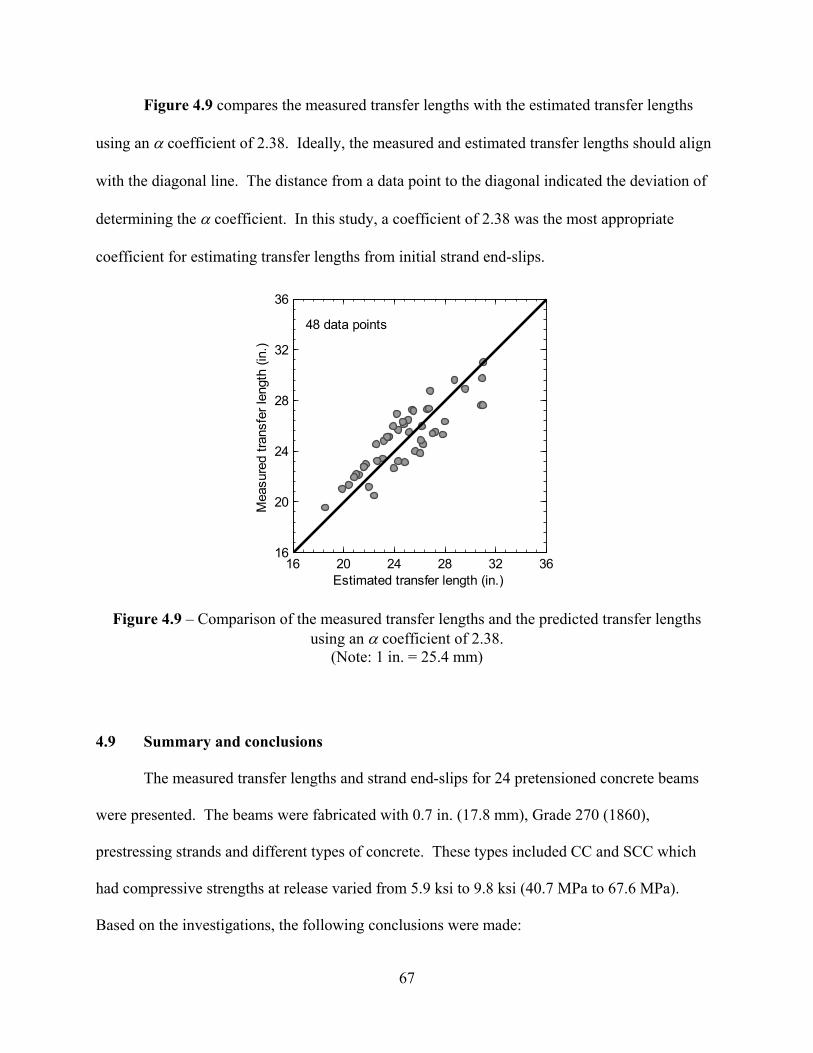
67
Figure 4.9 compares the measured transfer lengths with the estimated transfer lengths
using an α coefficient of 2.38. Ideally, the measured and estimated transfer lengths should align
with the diagonal line. The distance from a data point to the diagonal indicated the deviation of
determining the α coefficient. In this study, a coefficient of 2.38 was the most appropriate
coefficient for estimating transfer lengths from initial strand end-slips.
Figure 4.9 – Comparison of the measured transfer lengths and the predicted transfer lengths using an α coefficient of 2.38.
(Note: 1 in. = 25.4 mm)
Summary and conclusions 4.9
The measured transfer lengths and strand end-slips for 24 pretensioned concrete beams
were presented. The beams were fabricated with 0.7 in. (17.8 mm), Grade 270 (1860),
prestressing strands and different types of concrete. These types included CC and SCC which
had compressive strengths at release varied from 5.9 ksi to 9.8 ksi (40.7 MPa to 67.6 MPa).
Based on the investigations, the following conclusions were made:
16 20 24 28 32 3616
20
24
28
32
36
48 data points
Estimated transfer length (in.)
Mea
sure
d tra
nsfe
r len
gth
(in.)
68
1. The average measured transfer lengths at release varied from 23 in. to 28 in. (584 mm to
710 mm). The experimental results confirmed the effect of concrete compressive
strength on transfer length of prestressing strands. The increase of concrete compressive
strength can shorten the transfer length.
2. At early ages, the bond strength between the prestressing strands with SCC was lower
with CC. At 28 days, however, the bond strength between prestressing strands with CC
and SCC was similar.
3. Transfer lengths increased by 7% to 17% during the first 28 days after casting. The
increase was independent of concrete compressive strengths and type of concrete. The
average measured transfer lengths at 28 days varied from 26 in. to 31 in. (660 mm to 790
mm)
4. The beams using two prestressing strands at spacing of 2.0 in. (51 mm) had greater
transfer lengths at release than the beams using one prestressing strand. At 28 days, the
measured transfer lengths were similar for the beams using one and two prestressing
strands.
5. The lower and upper bound of the measured transfer lengths were proposed (Eq. 4.4).
The lower bound should be used to check allowable stresses at release. The upper bound
should be used when determining shear strength and moment capacity.
6. A concrete compressive strength at release of 8 ksi (55.2 MPa) was adequate for
detensioning 0.7 in. (17.8 mm) strands placed at spacing of 2.0 in. (51 mm).
7. The ACI 318 and ASSHTO specifications of transfer length are applicable for 0.7 in.
(17.8 mm) prestressing strands cast with the CC and SCC mixtures used in this study.
69
8. The measured initial strand end-slips may be less or greater than the AESs calculated
with different BSD coefficients. There was no apparent difference in the strand end-slips
measured at the live ends and the dead ends.
9. Transfer lengths at release can be estimated from initial strand end-slips using an
empirical formula. A coefficient of 2.38 was the most appropriate value for estimating
the transfer length with a coefficient of determination of 0.69.

70
: DEVELOPMENT LENGTH RESULTS CHAPTER 5
This chapter presents the measured development length of 0.7 in. (17.8 mm) prestressing
strands for 24 pretensioned concrete beams. The beams were fabricated with conventional
concrete or self-consolidating concrete. The concrete compressive strengths at 28 days varied
from 9.2 ksi to 13.4 ksi (63.4 MPa to 92.4 MPa). The development length was determined by
conducting bending test with different embedment lengths. The experimental results indicated
the measured development length did not show a good correlation with concrete compressive
strengths. The ACI 318 equations significantly over-predicted the measured flexural bond length
and development length. A simple equation was proposed for predicting development length of
0.7 in. (17.8 mm) prestressing strands.
Measured development lengths 5.1
N-SCC-S beams 5.1.1
The bending test results of N-SCC-S beams are presented in Figure 5.1 and Appendix
C.1.1. In the figure, three parameters are presented for a bending test. The first column was the
ratio of the maximum measured moment capacity (Mmax) and nominal moment capacity (Mn).
The second column was the ratio of the measured moment (Mslip) and nominal moment capacity
when the prestressing strand exhibited the initial slippage recorded by LVDT. If the prestressing
strand exhibited no slippage, a text of “No Slip” is shown instead of the second column. The
tested embedment length is shown as a solid circle. In the figure, the specimens were arranged
according to the order of conducted bending tests.
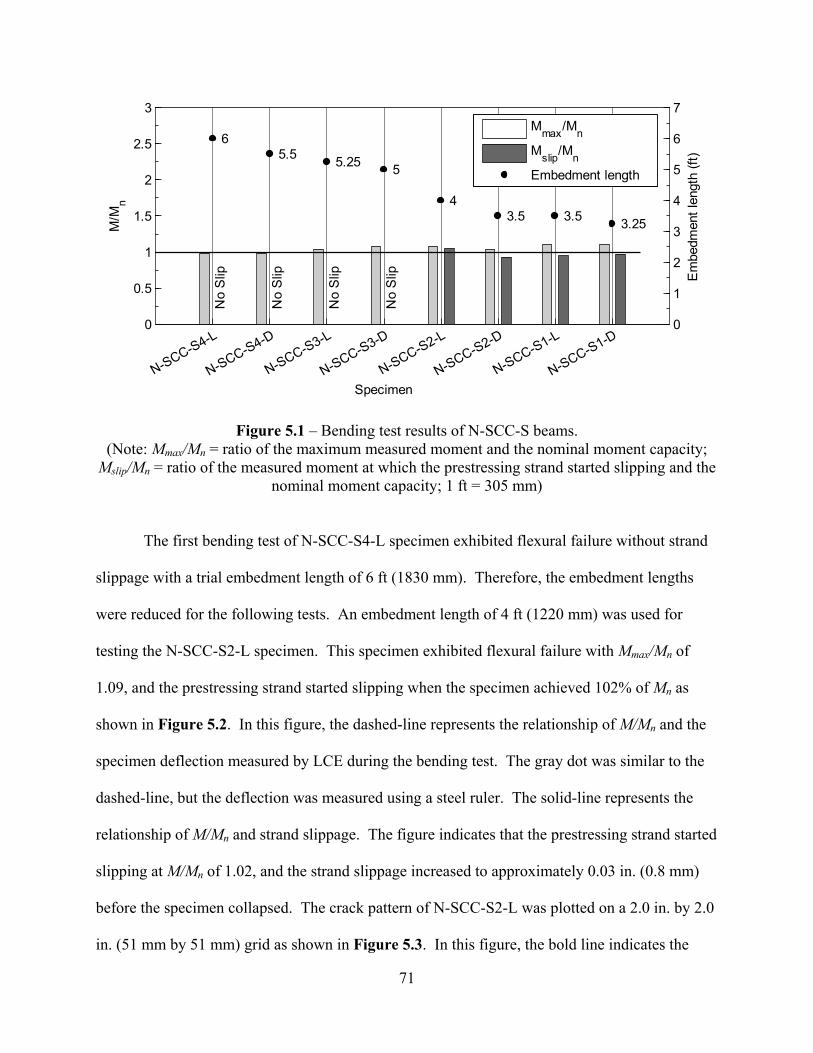
71
Figure 5.1 – Bending test results of N-SCC-S beams. (Note: Mmax/Mn = ratio of the maximum measured moment and the nominal moment capacity;
Mslip/Mn = ratio of the measured moment at which the prestressing strand started slipping and the nominal moment capacity; 1 ft = 305 mm)
The first bending test of N-SCC-S4-L specimen exhibited flexural failure without strand
slippage with a trial embedment length of 6 ft (1830 mm). Therefore, the embedment lengths
were reduced for the following tests. An embedment length of 4 ft (1220 mm) was used for
testing the N-SCC-S2-L specimen. This specimen exhibited flexural failure with Mmax/Mn of
1.09, and the prestressing strand started slipping when the specimen achieved 102% of Mn as
shown in Figure 5.2. In this figure, the dashed-line represents the relationship of M/Mn and the
specimen deflection measured by LCE during the bending test. The gray dot was similar to the
dashed-line, but the deflection was measured using a steel ruler. The solid-line represents the
relationship of M/Mn and strand slippage. The figure indicates that the prestressing strand started
slipping at M/Mn of 1.02, and the strand slippage increased to approximately 0.03 in. (0.8 mm)
before the specimen collapsed. The crack pattern of N-SCC-S2-L was plotted on a 2.0 in. by 2.0
in. (51 mm by 51 mm) grid as shown in Figure 5.3. In this figure, the bold line indicates the
0
0.5
1
1.5
2
2.5
3
No
Slip
No
Slip
No
Slip
No
Slip
N-SCC-S4-L
N-SCC-S4-D
N-SCC-S3-L
N-SCC-S3-D
N-SCC-S2-L
N-SCC-S2-D
N-SCC-S1-L
N-SCC-S1-D
M/M
n
Specimen
0
1
2
3
4
5
6
7
65.5 5.25 5
43.5 3.5 3.25
Em
bedm
ent l
engt
h (ft
)
Mmax/Mn
Mslip/Mn
Embedment length
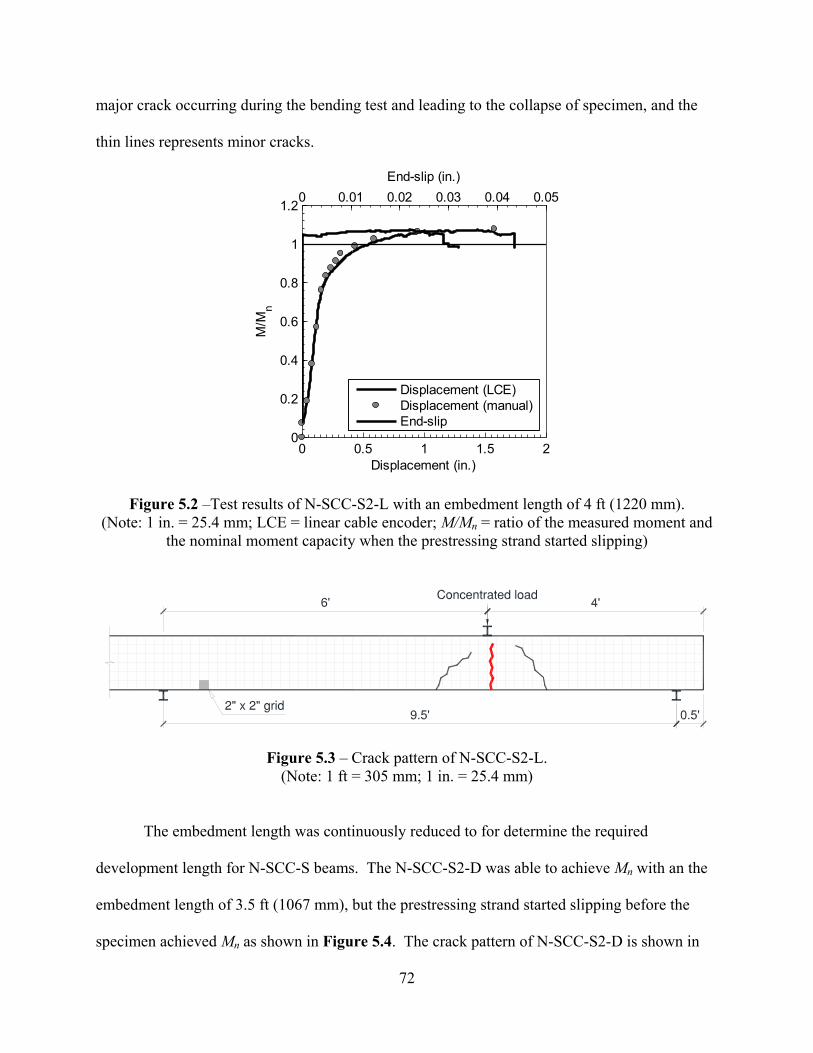
72
major crack occurring during the bending test and leading to the collapse of specimen, and the
thin lines represents minor cracks.
Figure 5.2 –Test results of N-SCC-S2-L with an embedment length of 4 ft (1220 mm). (Note: 1 in. = 25.4 mm; LCE = linear cable encoder; M/Mn = ratio of the measured moment and
the nominal moment capacity when the prestressing strand started slipping)
Figure 5.3 – Crack pattern of N-SCC-S2-L. (Note: 1 ft = 305 mm; 1 in. = 25.4 mm)
The embedment length was continuously reduced to for determine the required
development length for N-SCC-S beams. The N-SCC-S2-D was able to achieve Mn with an the
embedment length of 3.5 ft (1067 mm), but the prestressing strand started slipping before the
specimen achieved Mn as shown in Figure 5.4. The crack pattern of N-SCC-S2-D is shown in
0 0.5 1 1.5 20
0.2
0.4
0.6
0.8
1
1.2
Displacement (in.)
M/M
n
0 0.01 0.02 0.03 0.04 0.05End-slip (in.)
Displacement (LCE)Displacement (manual)End-slip
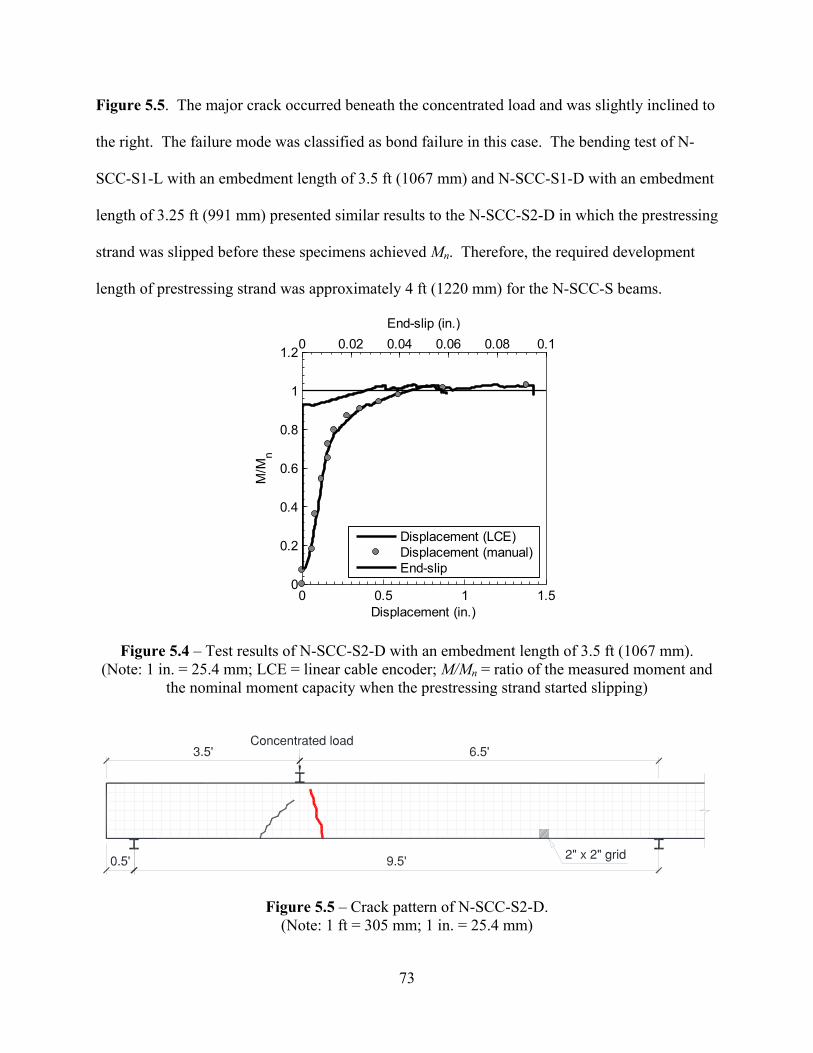
73
Figure 5.5. The major crack occurred beneath the concentrated load and was slightly inclined to
the right. The failure mode was classified as bond failure in this case. The bending test of N-
SCC-S1-L with an embedment length of 3.5 ft (1067 mm) and N-SCC-S1-D with an embedment
length of 3.25 ft (991 mm) presented similar results to the N-SCC-S2-D in which the prestressing
strand was slipped before these specimens achieved Mn. Therefore, the required development
length of prestressing strand was approximately 4 ft (1220 mm) for the N-SCC-S beams.
Figure 5.4 – Test results of N-SCC-S2-D with an embedment length of 3.5 ft (1067 mm). (Note: 1 in. = 25.4 mm; LCE = linear cable encoder; M/Mn = ratio of the measured moment and
the nominal moment capacity when the prestressing strand started slipping)
Figure 5.5 – Crack pattern of N-SCC-S2-D. (Note: 1 ft = 305 mm; 1 in. = 25.4 mm)
0 0.5 1 1.50
0.2
0.4
0.6
0.8
1
1.2
Displacement (in.)
M/M
n
0 0.02 0.04 0.06 0.08 0.1End-slip (in.)
Displacement (LCE)Displacement (manual)End-slip
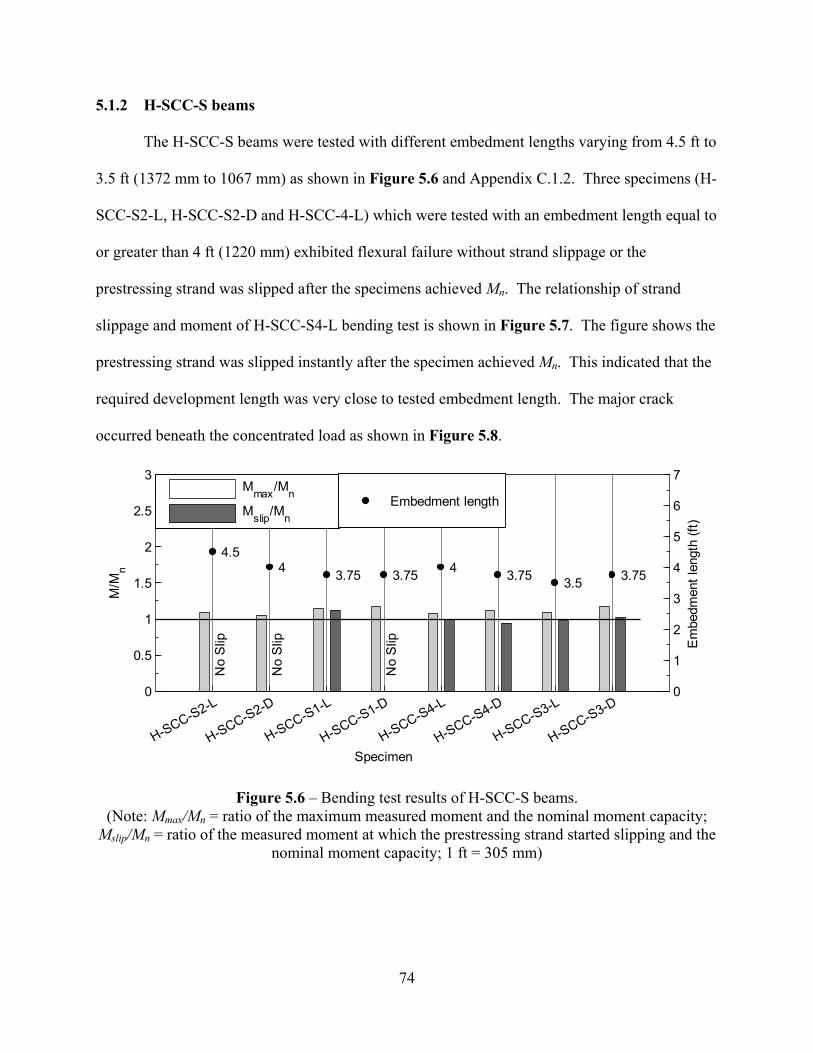
74
H-SCC-S beams 5.1.2
The H-SCC-S beams were tested with different embedment lengths varying from 4.5 ft to
3.5 ft (1372 mm to 1067 mm) as shown in Figure 5.6 and Appendix C.1.2. Three specimens (H-
SCC-S2-L, H-SCC-S2-D and H-SCC-4-L) which were tested with an embedment length equal to
or greater than 4 ft (1220 mm) exhibited flexural failure without strand slippage or the
prestressing strand was slipped after the specimens achieved Mn. The relationship of strand
slippage and moment of H-SCC-S4-L bending test is shown in Figure 5.7. The figure shows the
prestressing strand was slipped instantly after the specimen achieved Mn. This indicated that the
required development length was very close to tested embedment length. The major crack
occurred beneath the concentrated load as shown in Figure 5.8.
Figure 5.6 – Bending test results of H-SCC-S beams. (Note: Mmax/Mn = ratio of the maximum measured moment and the nominal moment capacity;
Mslip/Mn = ratio of the measured moment at which the prestressing strand started slipping and the nominal moment capacity; 1 ft = 305 mm)
0
0.5
1
1.5
2
2.5
3
No
Slip
No
Slip
No
Slip
H-SCC-S2-L
H-SCC-S2-D
H-SCC-S1-L
H-SCC-S1-D
H-SCC-S4-L
H-SCC-S4-D
H-SCC-S3-L
H-SCC-S3-D
M/M
n
Specimen
0
1
2
3
4
5
6
7
4.54 3.75 3.75 4 3.75 3.5 3.75
Em
bedm
ent l
engt
h (ft
)
Mmax/Mn
Mslip/MnEmbedment length
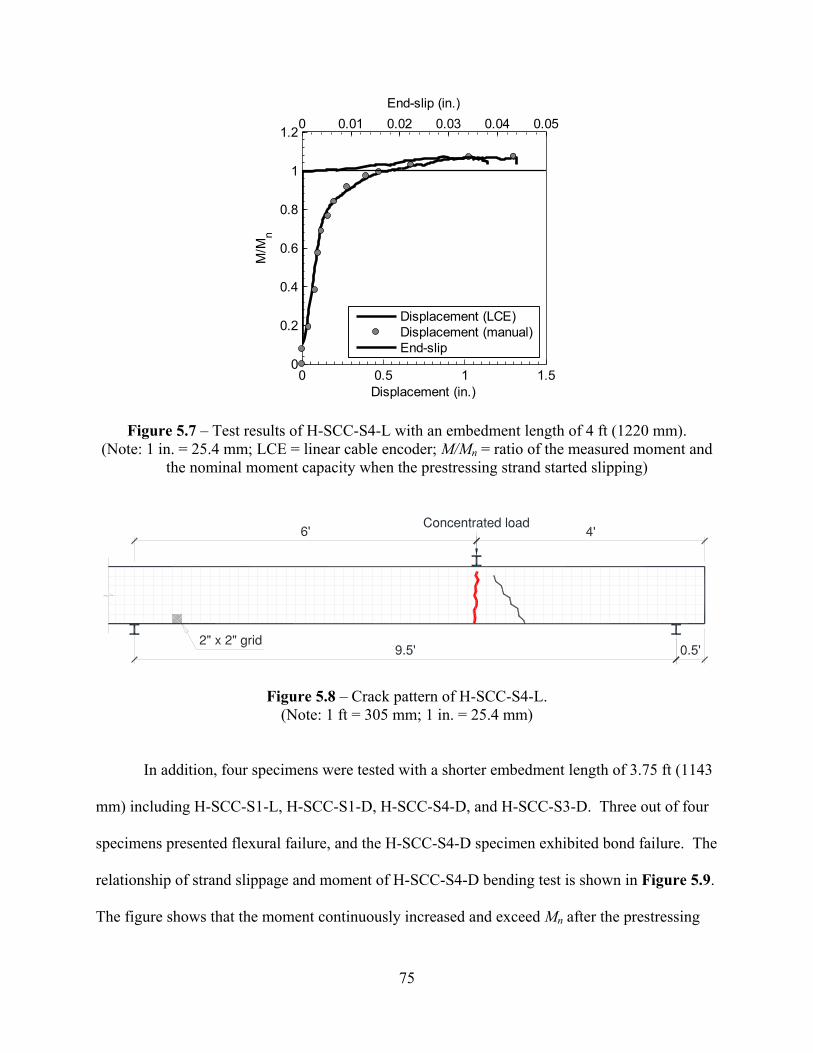
75
Figure 5.7 – Test results of H-SCC-S4-L with an embedment length of 4 ft (1220 mm). (Note: 1 in. = 25.4 mm; LCE = linear cable encoder; M/Mn = ratio of the measured moment and
the nominal moment capacity when the prestressing strand started slipping)
Figure 5.8 – Crack pattern of H-SCC-S4-L. (Note: 1 ft = 305 mm; 1 in. = 25.4 mm)
In addition, four specimens were tested with a shorter embedment length of 3.75 ft (1143
mm) including H-SCC-S1-L, H-SCC-S1-D, H-SCC-S4-D, and H-SCC-S3-D. Three out of four
specimens presented flexural failure, and the H-SCC-S4-D specimen exhibited bond failure. The
relationship of strand slippage and moment of H-SCC-S4-D bending test is shown in Figure 5.9.
The figure shows that the moment continuously increased and exceed Mn after the prestressing
0 0.5 1 1.50
0.2
0.4
0.6
0.8
1
1.2
Displacement (in.)
M/M
n
0 0.01 0.02 0.03 0.04 0.05End-slip (in.)
Displacement (LCE)Displacement (manual)End-slip
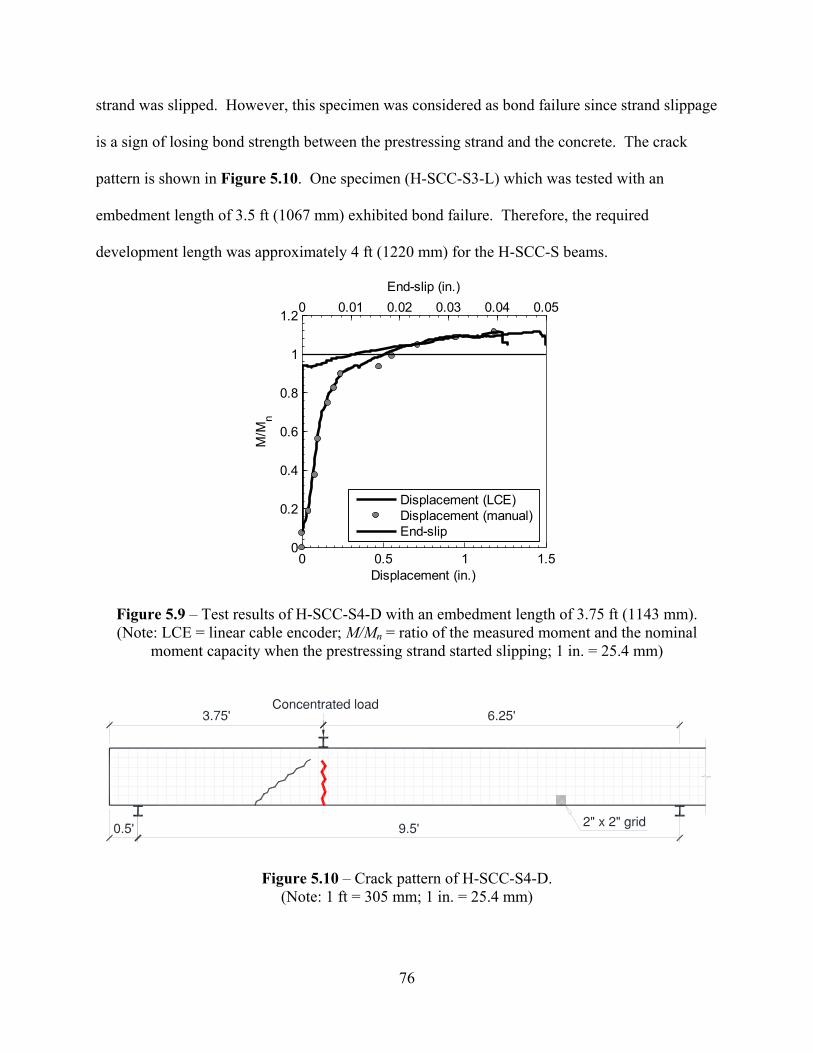
76
strand was slipped. However, this specimen was considered as bond failure since strand slippage
is a sign of losing bond strength between the prestressing strand and the concrete. The crack
pattern is shown in Figure 5.10. One specimen (H-SCC-S3-L) which was tested with an
embedment length of 3.5 ft (1067 mm) exhibited bond failure. Therefore, the required
development length was approximately 4 ft (1220 mm) for the H-SCC-S beams.
Figure 5.9 – Test results of H-SCC-S4-D with an embedment length of 3.75 ft (1143 mm). (Note: LCE = linear cable encoder; M/Mn = ratio of the measured moment and the nominal
moment capacity when the prestressing strand started slipping; 1 in. = 25.4 mm)
Figure 5.10 – Crack pattern of H-SCC-S4-D. (Note: 1 ft = 305 mm; 1 in. = 25.4 mm)
0 0.5 1 1.50
0.2
0.4
0.6
0.8
1
1.2
Displacement (in.)
M/M
n
0 0.01 0.02 0.03 0.04 0.05End-slip (in.)
Displacement (LCE)Displacement (manual)End-slip
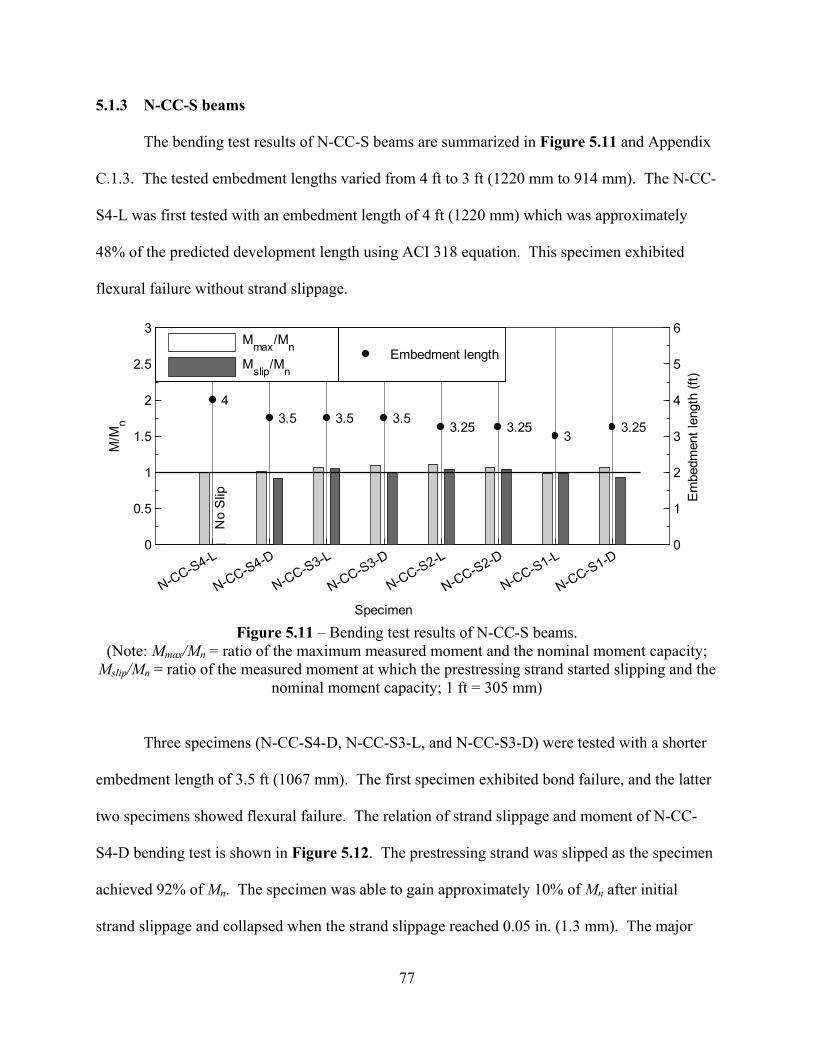
77
N-CC-S beams 5.1.3
The bending test results of N-CC-S beams are summarized in Figure 5.11 and Appendix
C.1.3. The tested embedment lengths varied from 4 ft to 3 ft (1220 mm to 914 mm). The N-CC-
S4-L was first tested with an embedment length of 4 ft (1220 mm) which was approximately
48% of the predicted development length using ACI 318 equation. This specimen exhibited
flexural failure without strand slippage.
Figure 5.11 – Bending test results of N-CC-S beams.
(Note: Mmax/Mn = ratio of the maximum measured moment and the nominal moment capacity; Mslip/Mn = ratio of the measured moment at which the prestressing strand started slipping and the
nominal moment capacity; 1 ft = 305 mm)
Three specimens (N-CC-S4-D, N-CC-S3-L, and N-CC-S3-D) were tested with a shorter
embedment length of 3.5 ft (1067 mm). The first specimen exhibited bond failure, and the latter
two specimens showed flexural failure. The relation of strand slippage and moment of N-CC-
S4-D bending test is shown in Figure 5.12. The prestressing strand was slipped as the specimen
achieved 92% of Mn. The specimen was able to gain approximately 10% of Mn after initial
strand slippage and collapsed when the strand slippage reached 0.05 in. (1.3 mm). The major
0
0.5
1
1.5
2
2.5
3
No
Slip
N-CC-S4-L
N-CC-S4-D
N-CC-S3-L
N-CC-S3-D
N-CC-S2-L
N-CC-S2-D
N-CC-S1-L
N-CC-S1-D
M/M
n
Specimen
0
1
2
3
4
5
6
43.5 3.5 3.5
3.25 3.253
3.25
Em
bedm
ent l
engt
h (ft
)
Mmax/Mn
Mslip/MnEmbedment length
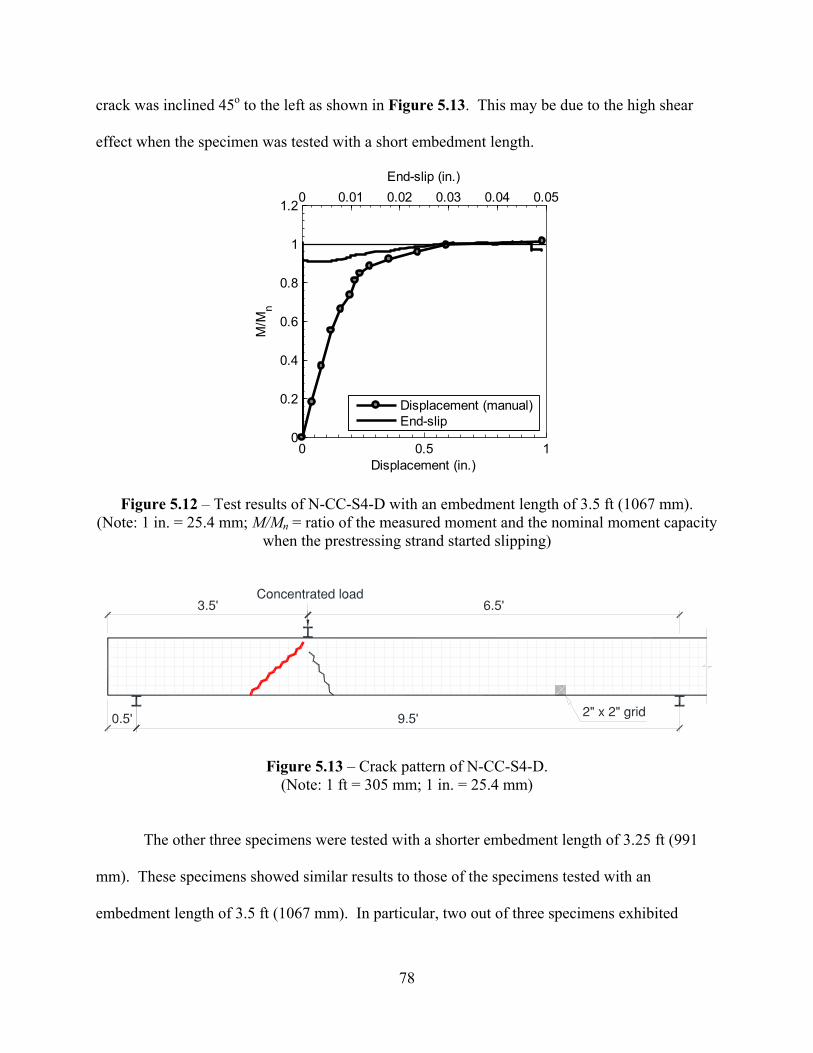
78
crack was inclined 45o to the left as shown in Figure 5.13. This may be due to the high shear
effect when the specimen was tested with a short embedment length.
Figure 5.12 – Test results of N-CC-S4-D with an embedment length of 3.5 ft (1067 mm). (Note: 1 in. = 25.4 mm; M/Mn = ratio of the measured moment and the nominal moment capacity
when the prestressing strand started slipping)
Figure 5.13 – Crack pattern of N-CC-S4-D. (Note: 1 ft = 305 mm; 1 in. = 25.4 mm)
The other three specimens were tested with a shorter embedment length of 3.25 ft (991
mm). These specimens showed similar results to those of the specimens tested with an
embedment length of 3.5 ft (1067 mm). In particular, two out of three specimens exhibited
0 0.5 10
0.2
0.4
0.6
0.8
1
1.2
Displacement (in.)
M/M
n
0 0.01 0.02 0.03 0.04 0.05End-slip (in.)
Displacement (manual)End-slip
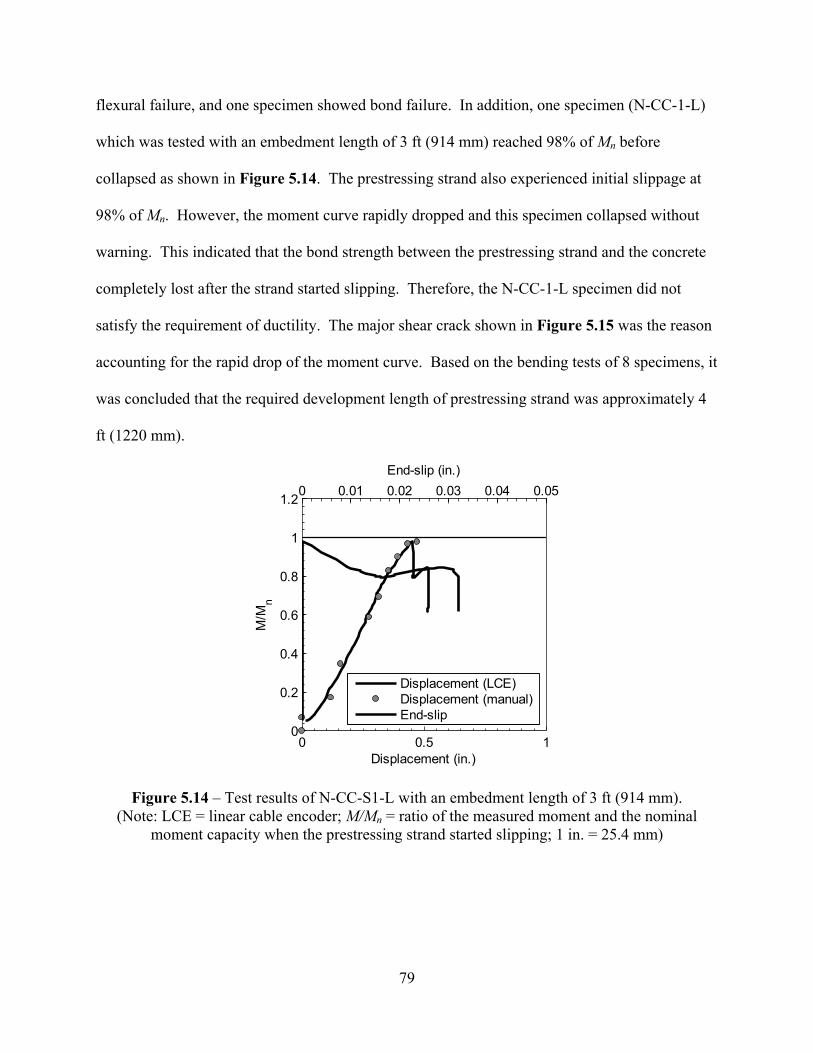
79
flexural failure, and one specimen showed bond failure. In addition, one specimen (N-CC-1-L)
which was tested with an embedment length of 3 ft (914 mm) reached 98% of Mn before
collapsed as shown in Figure 5.14. The prestressing strand also experienced initial slippage at
98% of Mn. However, the moment curve rapidly dropped and this specimen collapsed without
warning. This indicated that the bond strength between the prestressing strand and the concrete
completely lost after the strand started slipping. Therefore, the N-CC-1-L specimen did not
satisfy the requirement of ductility. The major shear crack shown in Figure 5.15 was the reason
accounting for the rapid drop of the moment curve. Based on the bending tests of 8 specimens, it
was concluded that the required development length of prestressing strand was approximately 4
ft (1220 mm).
Figure 5.14 – Test results of N-CC-S1-L with an embedment length of 3 ft (914 mm). (Note: LCE = linear cable encoder; M/Mn = ratio of the measured moment and the nominal
moment capacity when the prestressing strand started slipping; 1 in. = 25.4 mm)
0 0.5 10
0.2
0.4
0.6
0.8
1
1.2
Displacement (in.)
M/M
n
0 0.01 0.02 0.03 0.04 0.05End-slip (in.)
Displacement (LCE)Displacement (manual)End-slip
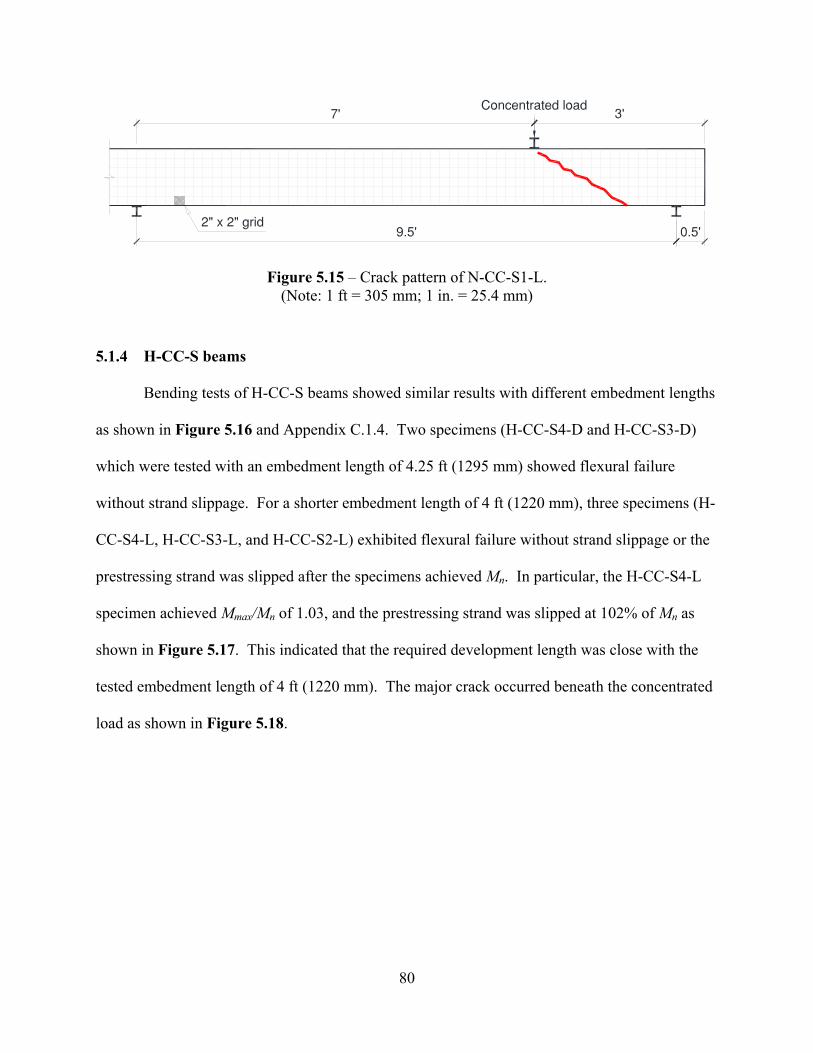
80
Figure 5.15 – Crack pattern of N-CC-S1-L. (Note: 1 ft = 305 mm; 1 in. = 25.4 mm)
H-CC-S beams 5.1.4
Bending tests of H-CC-S beams showed similar results with different embedment lengths
as shown in Figure 5.16 and Appendix C.1.4. Two specimens (H-CC-S4-D and H-CC-S3-D)
which were tested with an embedment length of 4.25 ft (1295 mm) showed flexural failure
without strand slippage. For a shorter embedment length of 4 ft (1220 mm), three specimens (H-
CC-S4-L, H-CC-S3-L, and H-CC-S2-L) exhibited flexural failure without strand slippage or the
prestressing strand was slipped after the specimens achieved Mn. In particular, the H-CC-S4-L
specimen achieved Mmax/Mn of 1.03, and the prestressing strand was slipped at 102% of Mn as
shown in Figure 5.17. This indicated that the required development length was close with the
tested embedment length of 4 ft (1220 mm). The major crack occurred beneath the concentrated
load as shown in Figure 5.18.
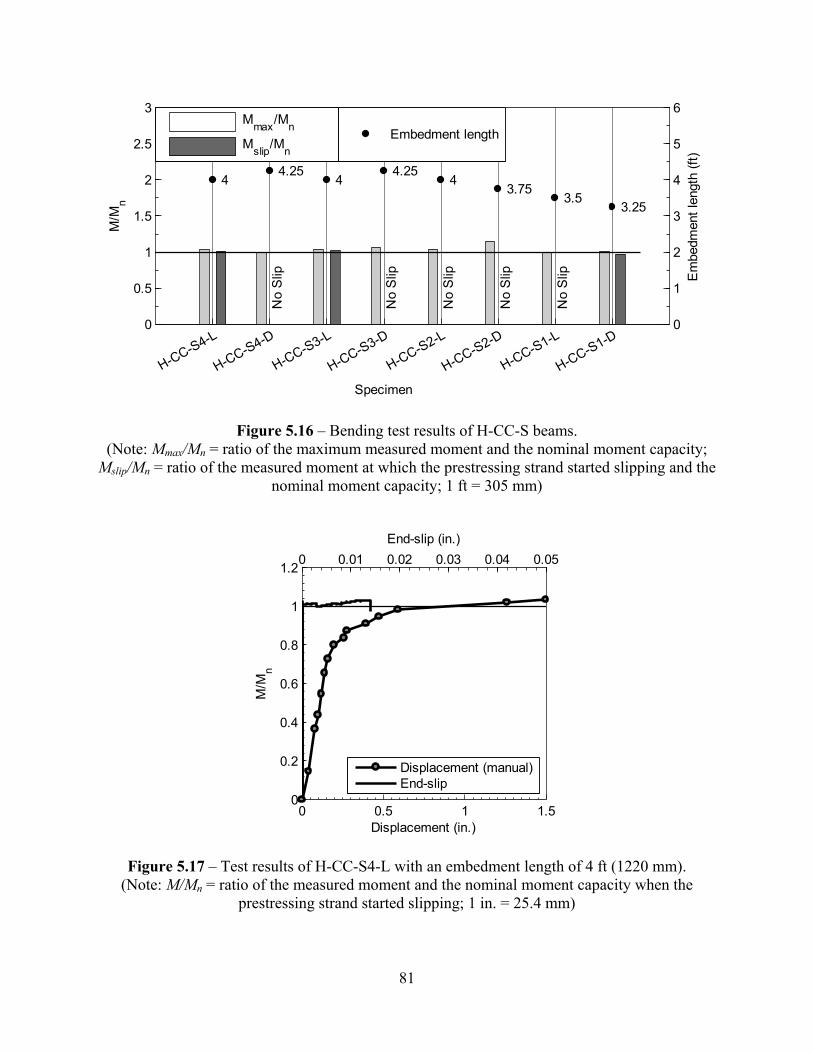
81
Figure 5.16 – Bending test results of H-CC-S beams. (Note: Mmax/Mn = ratio of the maximum measured moment and the nominal moment capacity;
Mslip/Mn = ratio of the measured moment at which the prestressing strand started slipping and the nominal moment capacity; 1 ft = 305 mm)
Figure 5.17 – Test results of H-CC-S4-L with an embedment length of 4 ft (1220 mm). (Note: M/Mn = ratio of the measured moment and the nominal moment capacity when the
prestressing strand started slipping; 1 in. = 25.4 mm)
0
0.5
1
1.5
2
2.5
3
No
Slip
No
Slip
No
Slip
No
Slip
No
Slip
H-CC-S4-L
H-CC-S4-D
H-CC-S3-L
H-CC-S3-D
H-CC-S2-L
H-CC-S2-D
H-CC-S1-L
H-CC-S1-D
M/M
n
Specimen
0
1
2
3
4
5
6
44.25
44.25
43.75
3.53.25
Em
bedm
ent l
engt
h (ft
)
Mmax/Mn
Mslip/MnEmbedment length
0 0.5 1 1.50
0.2
0.4
0.6
0.8
1
1.2
Displacement (in.)
M/M
n
0 0.01 0.02 0.03 0.04 0.05End-slip (in.)
Displacement (manual)End-slip
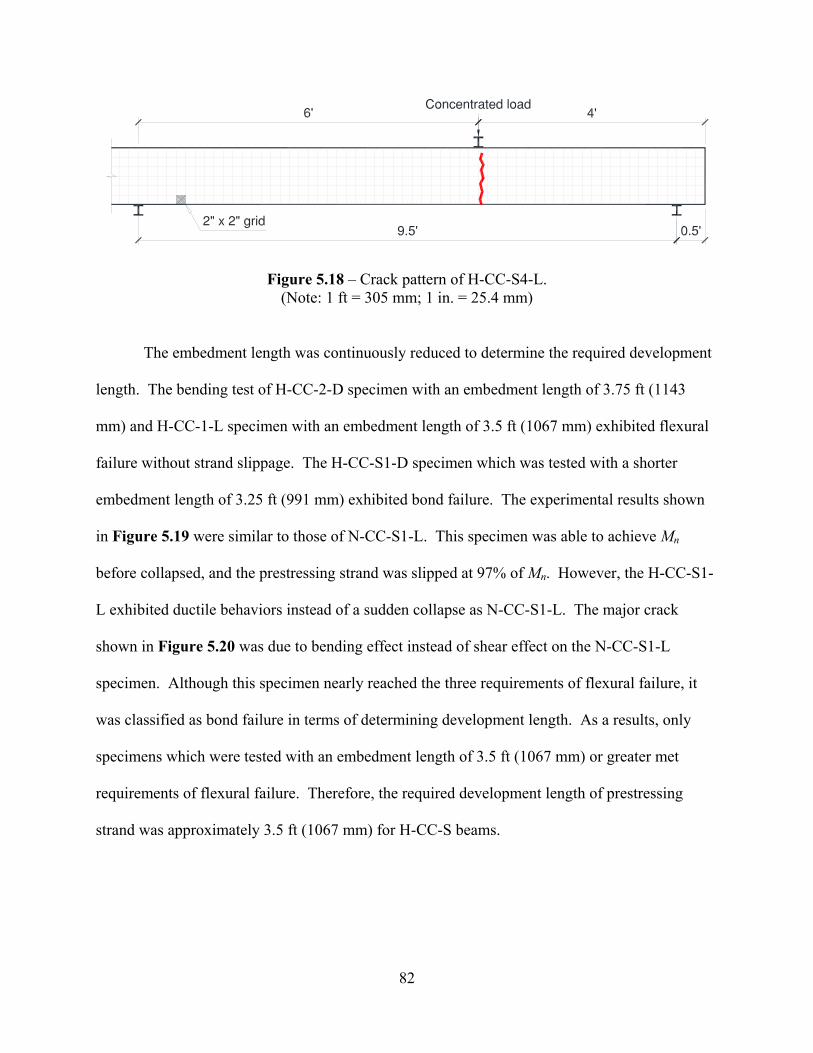
82
Figure 5.18 – Crack pattern of H-CC-S4-L. (Note: 1 ft = 305 mm; 1 in. = 25.4 mm)
The embedment length was continuously reduced to determine the required development
length. The bending test of H-CC-2-D specimen with an embedment length of 3.75 ft (1143
mm) and H-CC-1-L specimen with an embedment length of 3.5 ft (1067 mm) exhibited flexural
failure without strand slippage. The H-CC-S1-D specimen which was tested with a shorter
embedment length of 3.25 ft (991 mm) exhibited bond failure. The experimental results shown
in Figure 5.19 were similar to those of N-CC-S1-L. This specimen was able to achieve Mn
before collapsed, and the prestressing strand was slipped at 97% of Mn. However, the H-CC-S1-
L exhibited ductile behaviors instead of a sudden collapse as N-CC-S1-L. The major crack
shown in Figure 5.20 was due to bending effect instead of shear effect on the N-CC-S1-L
specimen. Although this specimen nearly reached the three requirements of flexural failure, it
was classified as bond failure in terms of determining development length. As a results, only
specimens which were tested with an embedment length of 3.5 ft (1067 mm) or greater met
requirements of flexural failure. Therefore, the required development length of prestressing
strand was approximately 3.5 ft (1067 mm) for H-CC-S beams.
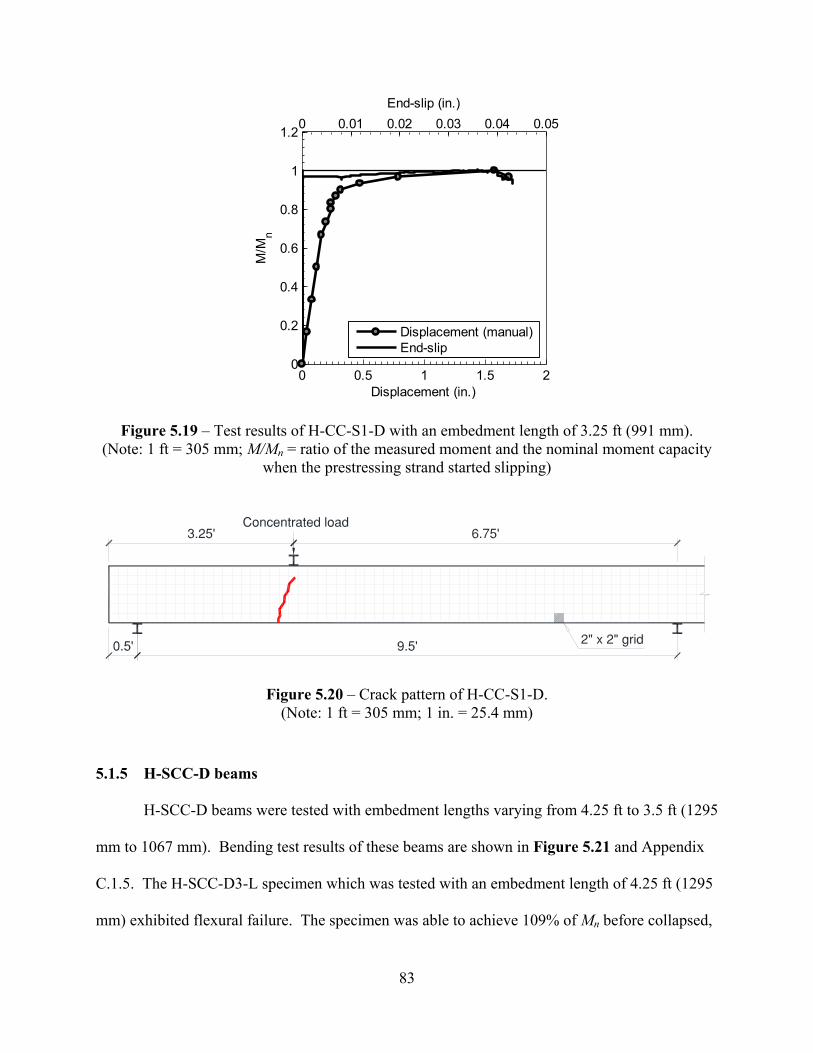
83
Figure 5.19 – Test results of H-CC-S1-D with an embedment length of 3.25 ft (991 mm). (Note: 1 ft = 305 mm; M/Mn = ratio of the measured moment and the nominal moment capacity
when the prestressing strand started slipping)
Figure 5.20 – Crack pattern of H-CC-S1-D. (Note: 1 ft = 305 mm; 1 in. = 25.4 mm)
H-SCC-D beams 5.1.5
H-SCC-D beams were tested with embedment lengths varying from 4.25 ft to 3.5 ft (1295
mm to 1067 mm). Bending test results of these beams are shown in Figure 5.21 and Appendix
C.1.5. The H-SCC-D3-L specimen which was tested with an embedment length of 4.25 ft (1295
mm) exhibited flexural failure. The specimen was able to achieve 109% of Mn before collapsed,
0 0.5 1 1.5 20
0.2
0.4
0.6
0.8
1
1.2
Displacement (in.)
M/M
n
0 0.01 0.02 0.03 0.04 0.05End-slip (in.)
Displacement (manual)End-slip
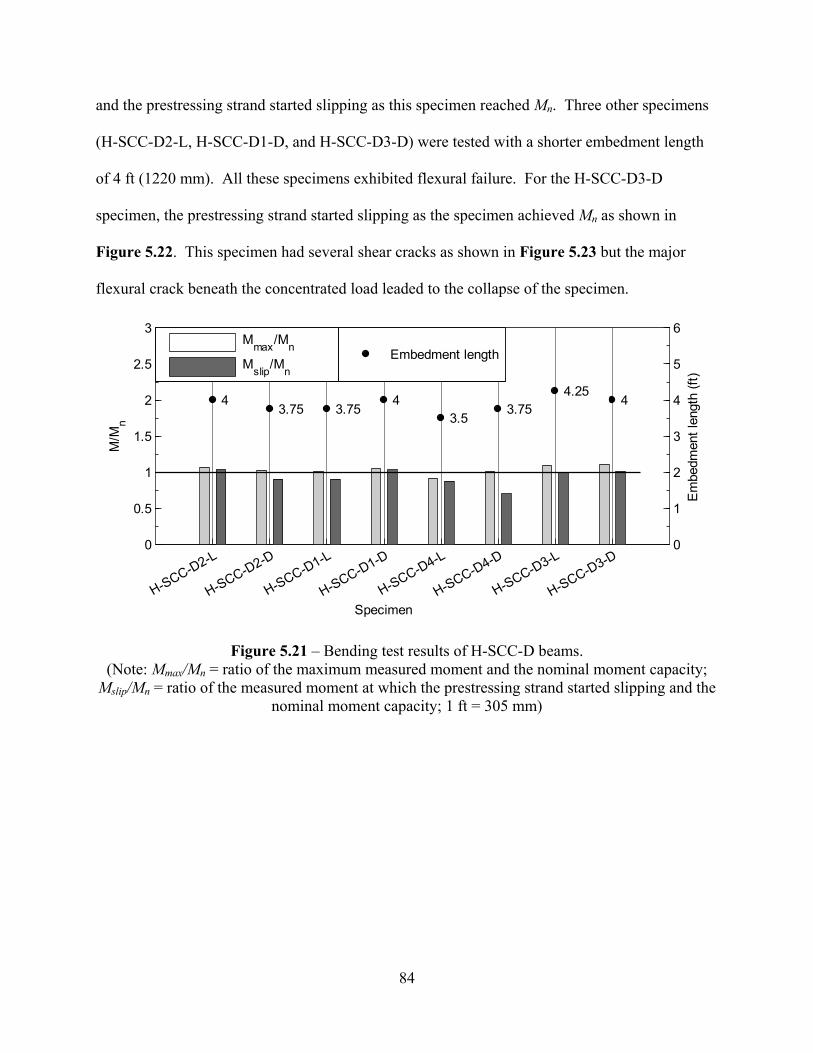
84
and the prestressing strand started slipping as this specimen reached Mn. Three other specimens
(H-SCC-D2-L, H-SCC-D1-D, and H-SCC-D3-D) were tested with a shorter embedment length
of 4 ft (1220 mm). All these specimens exhibited flexural failure. For the H-SCC-D3-D
specimen, the prestressing strand started slipping as the specimen achieved Mn as shown in
Figure 5.22. This specimen had several shear cracks as shown in Figure 5.23 but the major
flexural crack beneath the concentrated load leaded to the collapse of the specimen.
Figure 5.21 – Bending test results of H-SCC-D beams. (Note: Mmax/Mn = ratio of the maximum measured moment and the nominal moment capacity;
Mslip/Mn = ratio of the measured moment at which the prestressing strand started slipping and the nominal moment capacity; 1 ft = 305 mm)
0
0.5
1
1.5
2
2.5
3
H-SCC-D2-L
H-SCC-D2-D
H-SCC-D1-L
H-SCC-D1-D
H-SCC-D4-L
H-SCC-D4-D
H-SCC-D3-L
H-SCC-D3-D
M/M
n
Specimen
0
1
2
3
4
5
6
43.75 3.75
43.5
3.754.25
4
Em
bedm
ent l
engt
h (ft
)
Mmax/Mn
Mslip/MnEmbedment length
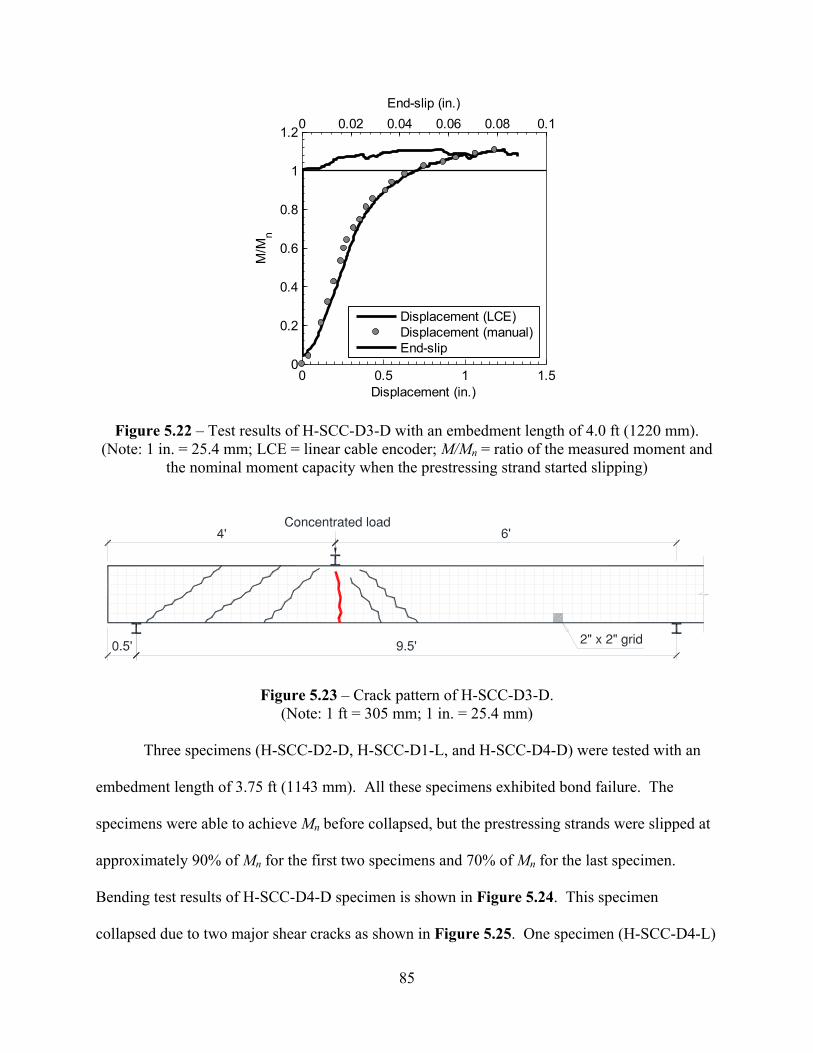
85
Figure 5.22 – Test results of H-SCC-D3-D with an embedment length of 4.0 ft (1220 mm). (Note: 1 in. = 25.4 mm; LCE = linear cable encoder; M/Mn = ratio of the measured moment and
the nominal moment capacity when the prestressing strand started slipping)
Figure 5.23 – Crack pattern of H-SCC-D3-D. (Note: 1 ft = 305 mm; 1 in. = 25.4 mm)
Three specimens (H-SCC-D2-D, H-SCC-D1-L, and H-SCC-D4-D) were tested with an
embedment length of 3.75 ft (1143 mm). All these specimens exhibited bond failure. The
specimens were able to achieve Mn before collapsed, but the prestressing strands were slipped at
approximately 90% of Mn for the first two specimens and 70% of Mn for the last specimen.
Bending test results of H-SCC-D4-D specimen is shown in Figure 5.24. This specimen
collapsed due to two major shear cracks as shown in Figure 5.25. One specimen (H-SCC-D4-L)
0 0.5 1 1.50
0.2
0.4
0.6
0.8
1
1.2
Displacement (in.)
M/M
n
0 0.02 0.04 0.06 0.08 0.1End-slip (in.)
Displacement (LCE)Displacement (manual)End-slip
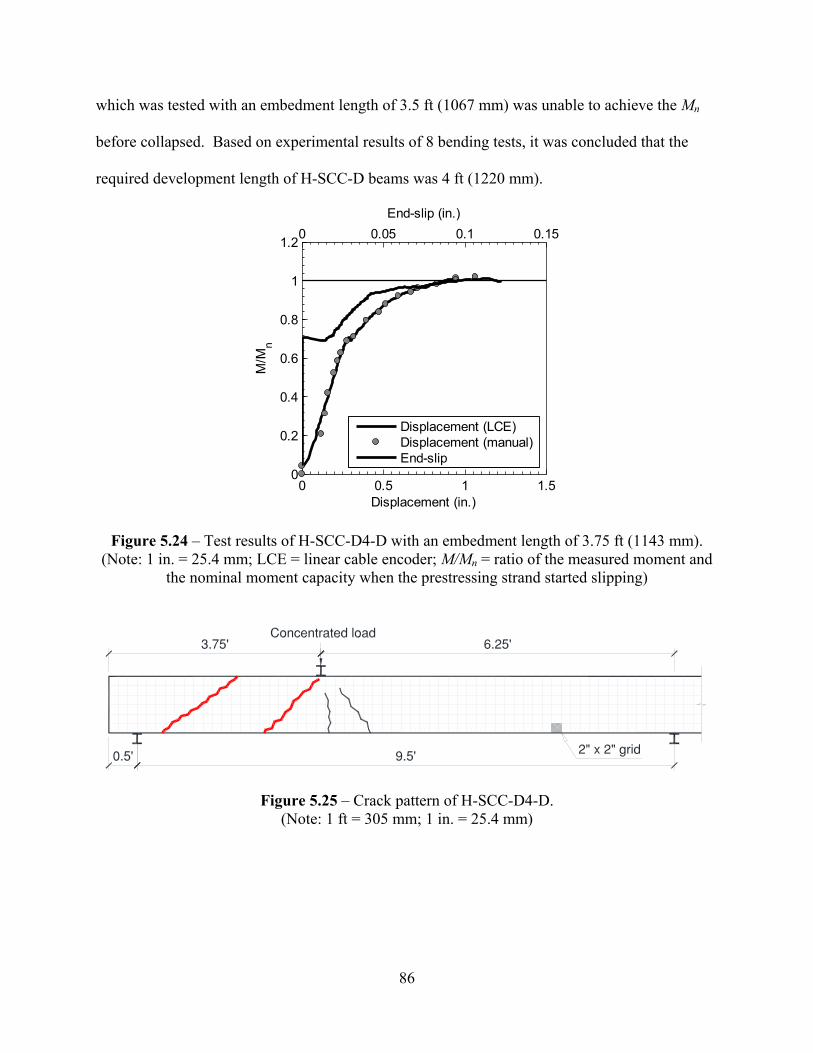
86
which was tested with an embedment length of 3.5 ft (1067 mm) was unable to achieve the Mn
before collapsed. Based on experimental results of 8 bending tests, it was concluded that the
required development length of H-SCC-D beams was 4 ft (1220 mm).
Figure 5.24 – Test results of H-SCC-D4-D with an embedment length of 3.75 ft (1143 mm). (Note: 1 in. = 25.4 mm; LCE = linear cable encoder; M/Mn = ratio of the measured moment and
the nominal moment capacity when the prestressing strand started slipping)
Figure 5.25 – Crack pattern of H-SCC-D4-D. (Note: 1 ft = 305 mm; 1 in. = 25.4 mm)
0 0.5 1 1.50
0.2
0.4
0.6
0.8
1
1.2
Displacement (in.)
M/M
n
0 0.05 0.1 0.15End-slip (in.)
Displacement (LCE)Displacement (manual)End-slip
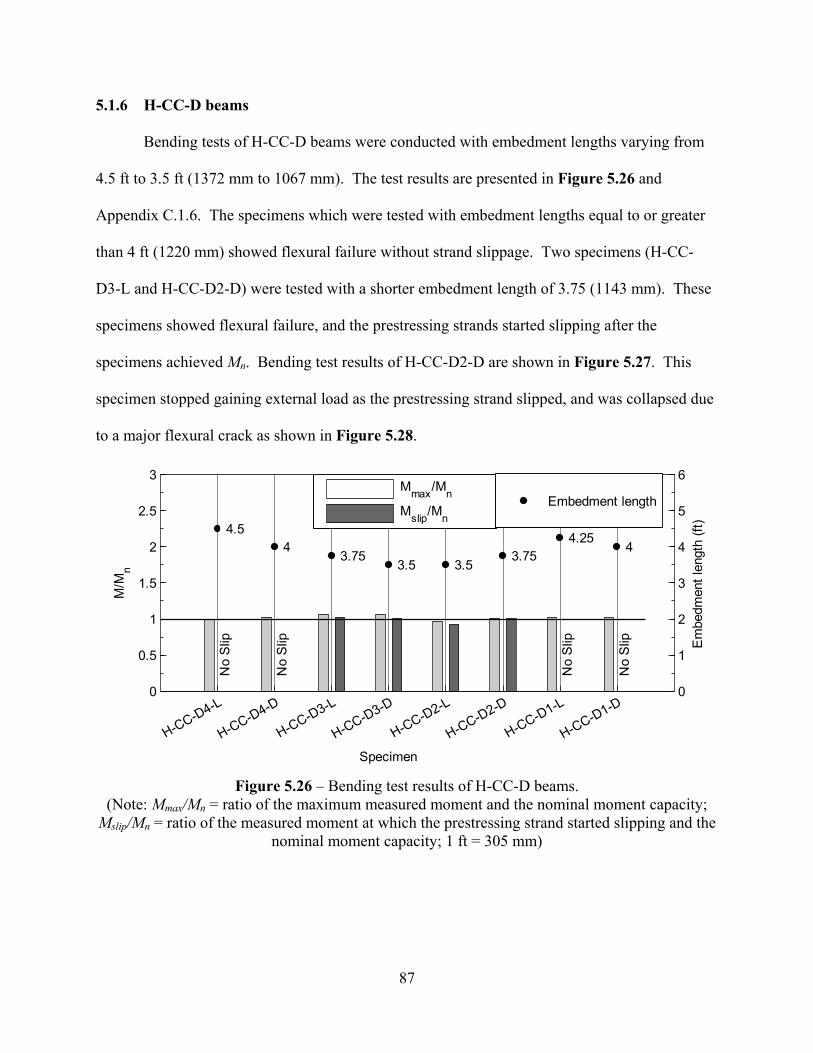
87
H-CC-D beams 5.1.6
Bending tests of H-CC-D beams were conducted with embedment lengths varying from
4.5 ft to 3.5 ft (1372 mm to 1067 mm). The test results are presented in Figure 5.26 and
Appendix C.1.6. The specimens which were tested with embedment lengths equal to or greater
than 4 ft (1220 mm) showed flexural failure without strand slippage. Two specimens (H-CC-
D3-L and H-CC-D2-D) were tested with a shorter embedment length of 3.75 (1143 mm). These
specimens showed flexural failure, and the prestressing strands started slipping after the
specimens achieved Mn. Bending test results of H-CC-D2-D are shown in Figure 5.27. This
specimen stopped gaining external load as the prestressing strand slipped, and was collapsed due
to a major flexural crack as shown in Figure 5.28.
Figure 5.26 – Bending test results of H-CC-D beams.
(Note: Mmax/Mn = ratio of the maximum measured moment and the nominal moment capacity; Mslip/Mn = ratio of the measured moment at which the prestressing strand started slipping and the
nominal moment capacity; 1 ft = 305 mm)
0
0.5
1
1.5
2
2.5
3
No
Slip
No
Slip
No
Slip
No
Slip
H-CC-D4-L
H-CC-D4-D
H-CC-D3-L
H-CC-D3-D
H-CC-D2-L
H-CC-D2-D
H-CC-D1-L
H-CC-D1-D
M/M
n
Specimen
0
1
2
3
4
5
6
4.54
3.753.5 3.5
3.754.25
4
Em
bedm
ent l
engt
h (ft
)
Mmax/Mn
Mslip/MnEmbedment length
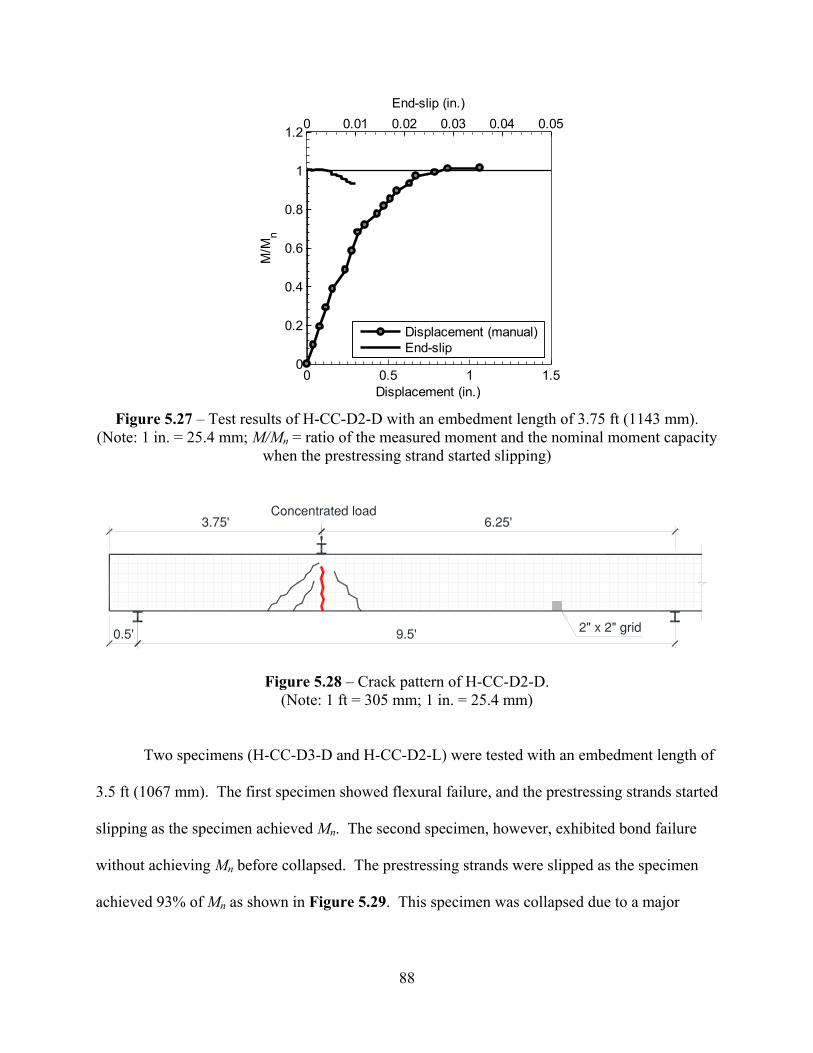
88
Figure 5.27 – Test results of H-CC-D2-D with an embedment length of 3.75 ft (1143 mm).
(Note: 1 in. = 25.4 mm; M/Mn = ratio of the measured moment and the nominal moment capacity when the prestressing strand started slipping)
Figure 5.28 – Crack pattern of H-CC-D2-D. (Note: 1 ft = 305 mm; 1 in. = 25.4 mm)
Two specimens (H-CC-D3-D and H-CC-D2-L) were tested with an embedment length of
3.5 ft (1067 mm). The first specimen showed flexural failure, and the prestressing strands started
slipping as the specimen achieved Mn. The second specimen, however, exhibited bond failure
without achieving Mn before collapsed. The prestressing strands were slipped as the specimen
achieved 93% of Mn as shown in Figure 5.29. This specimen was collapsed due to a major
0 0.5 1 1.50
0.2
0.4
0.6
0.8
1
1.2
Displacement (in.)
M/M
n
0 0.01 0.02 0.03 0.04 0.05End-slip (in.)
Displacement (manual)End-slip
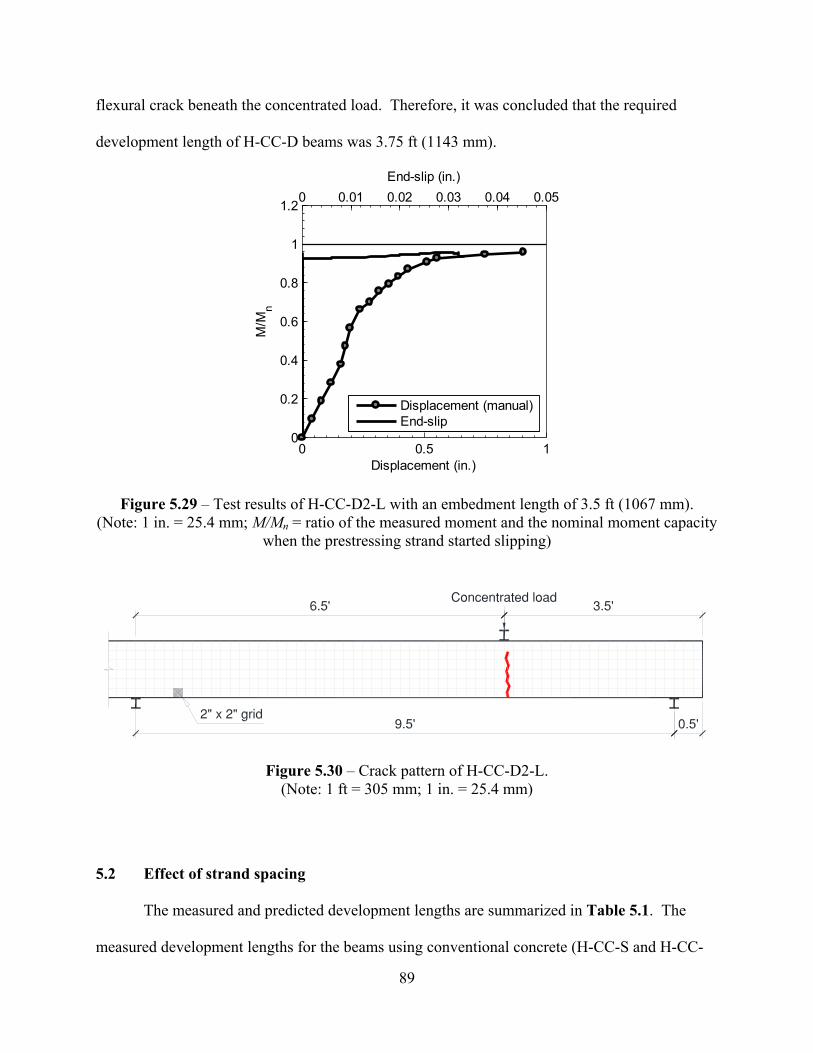
89
flexural crack beneath the concentrated load. Therefore, it was concluded that the required
development length of H-CC-D beams was 3.75 ft (1143 mm).
Figure 5.29 – Test results of H-CC-D2-L with an embedment length of 3.5 ft (1067 mm). (Note: 1 in. = 25.4 mm; M/Mn = ratio of the measured moment and the nominal moment capacity
when the prestressing strand started slipping)
Figure 5.30 – Crack pattern of H-CC-D2-L. (Note: 1 ft = 305 mm; 1 in. = 25.4 mm)
Effect of strand spacing 5.2
The measured and predicted development lengths are summarized in Table 5.1. The
measured development lengths for the beams using conventional concrete (H-CC-S and H-CC-
0 0.5 10
0.2
0.4
0.6
0.8
1
1.2
Displacement (in.)
M/M
n
0 0.01 0.02 0.03 0.04 0.05End-slip (in.)
Displacement (manual)End-slip
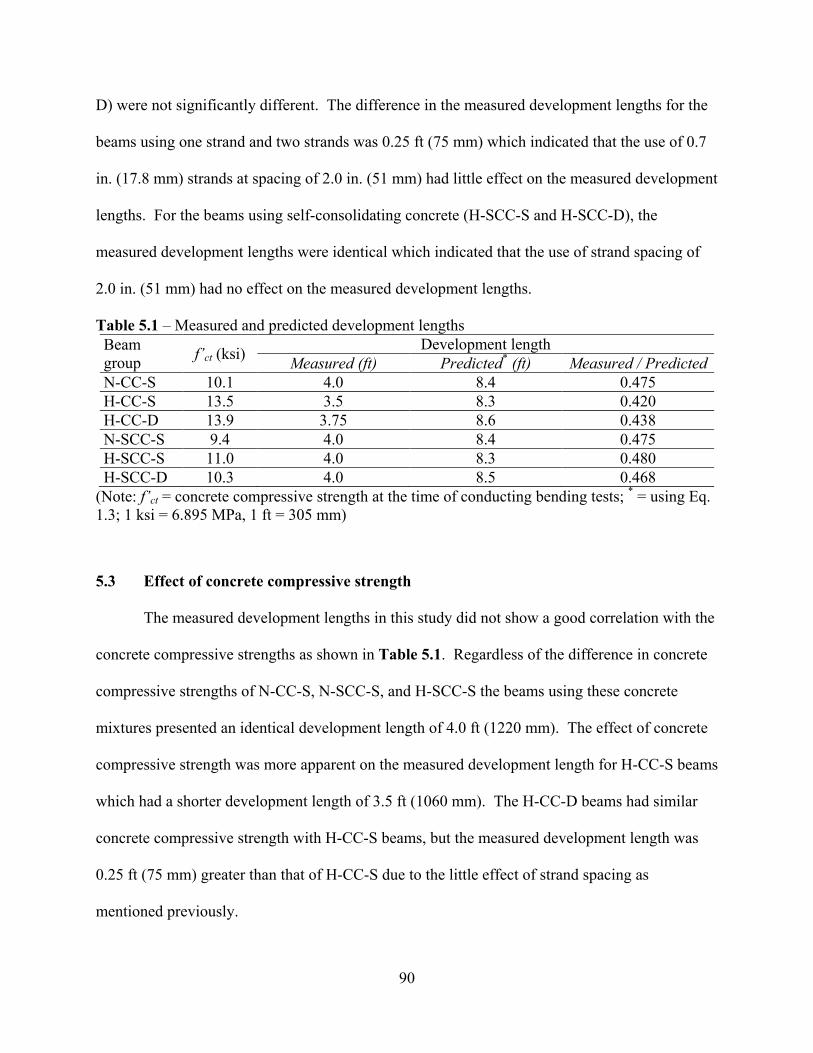
90
D) were not significantly different. The difference in the measured development lengths for the
beams using one strand and two strands was 0.25 ft (75 mm) which indicated that the use of 0.7
in. (17.8 mm) strands at spacing of 2.0 in. (51 mm) had little effect on the measured development
lengths. For the beams using self-consolidating concrete (H-SCC-S and H-SCC-D), the
measured development lengths were identical which indicated that the use of strand spacing of
2.0 in. (51 mm) had no effect on the measured development lengths.
Table 5.1 – Measured and predicted development lengths Beam group f’ct (ksi) Development length
Measured (ft) Predicted* (ft) Measured / Predicted N-CC-S 10.1 4.0 8.4 0.475 H-CC-S 13.5 3.5 8.3 0.420 H-CC-D 13.9 3.75 8.6 0.438 N-SCC-S 9.4 4.0 8.4 0.475 H-SCC-S 11.0 4.0 8.3 0.480 H-SCC-D 10.3 4.0 8.5 0.468
(Note: f’ct = concrete compressive strength at the time of conducting bending tests; * = using Eq. 1.3; 1 ksi = 6.895 MPa, 1 ft = 305 mm)
Effect of concrete compressive strength 5.3
The measured development lengths in this study did not show a good correlation with the
concrete compressive strengths as shown in Table 5.1. Regardless of the difference in concrete
compressive strengths of N-CC-S, N-SCC-S, and H-SCC-S the beams using these concrete
mixtures presented an identical development length of 4.0 ft (1220 mm). The effect of concrete
compressive strength was more apparent on the measured development length for H-CC-S beams
which had a shorter development length of 3.5 ft (1060 mm). The H-CC-D beams had similar
concrete compressive strength with H-CC-S beams, but the measured development length was
0.25 ft (75 mm) greater than that of H-CC-S due to the little effect of strand spacing as
mentioned previously.
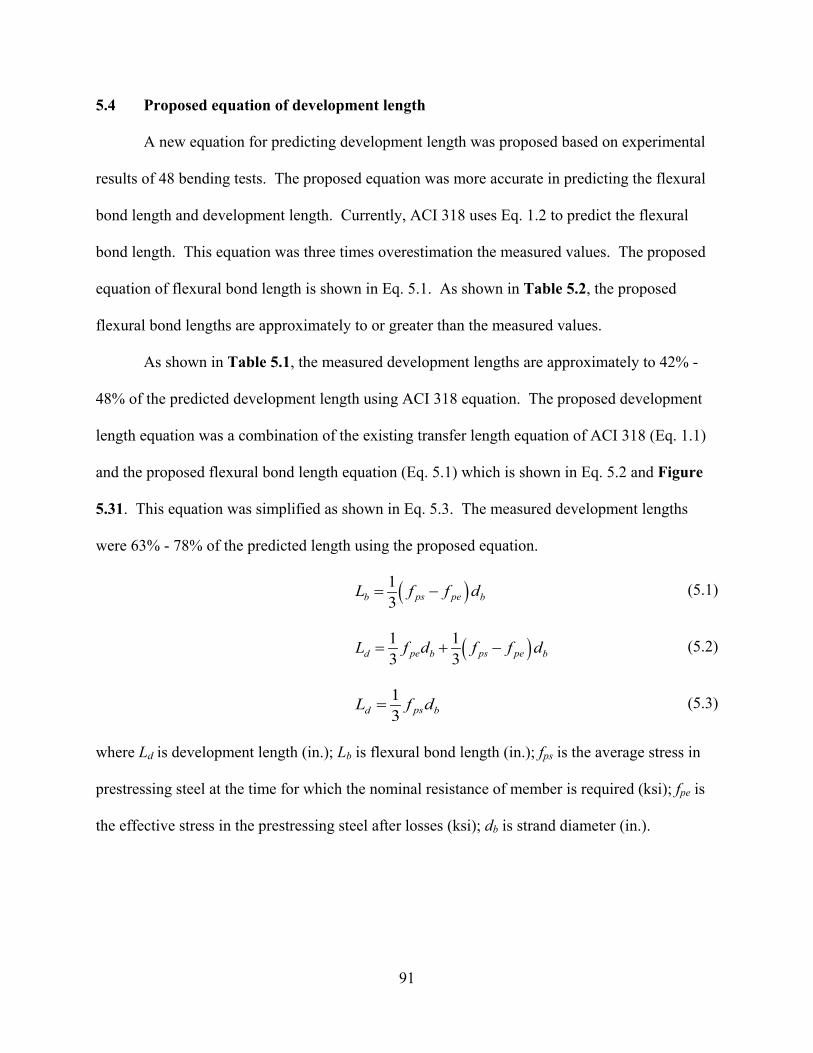
91
Proposed equation of development length 5.4
A new equation for predicting development length was proposed based on experimental
results of 48 bending tests. The proposed equation was more accurate in predicting the flexural
bond length and development length. Currently, ACI 318 uses Eq. 1.2 to predict the flexural
bond length. This equation was three times overestimation the measured values. The proposed
equation of flexural bond length is shown in Eq. 5.1. As shown in Table 5.2, the proposed
flexural bond lengths are approximately to or greater than the measured values.
As shown in Table 5.1, the measured development lengths are approximately to 42% -
48% of the predicted development length using ACI 318 equation. The proposed development
length equation was a combination of the existing transfer length equation of ACI 318 (Eq. 1.1)
and the proposed flexural bond length equation (Eq. 5.1) which is shown in Eq. 5.2 and Figure
5.31. This equation was simplified as shown in Eq. 5.3. The measured development lengths
were 63% - 78% of the predicted length using the proposed equation.
( )13 ps peb bL f f d= − (5.1)
( )1 13 3pe ps ped b bL f d f f d= + − (5.2)
13 psd bL f d= (5.3)
where Ld is development length (in.); Lb is flexural bond length (in.); fps is the average stress in
prestressing steel at the time for which the nominal resistance of member is required (ksi); fpe is
the effective stress in the prestressing steel after losses (ksi); db is strand diameter (in.).
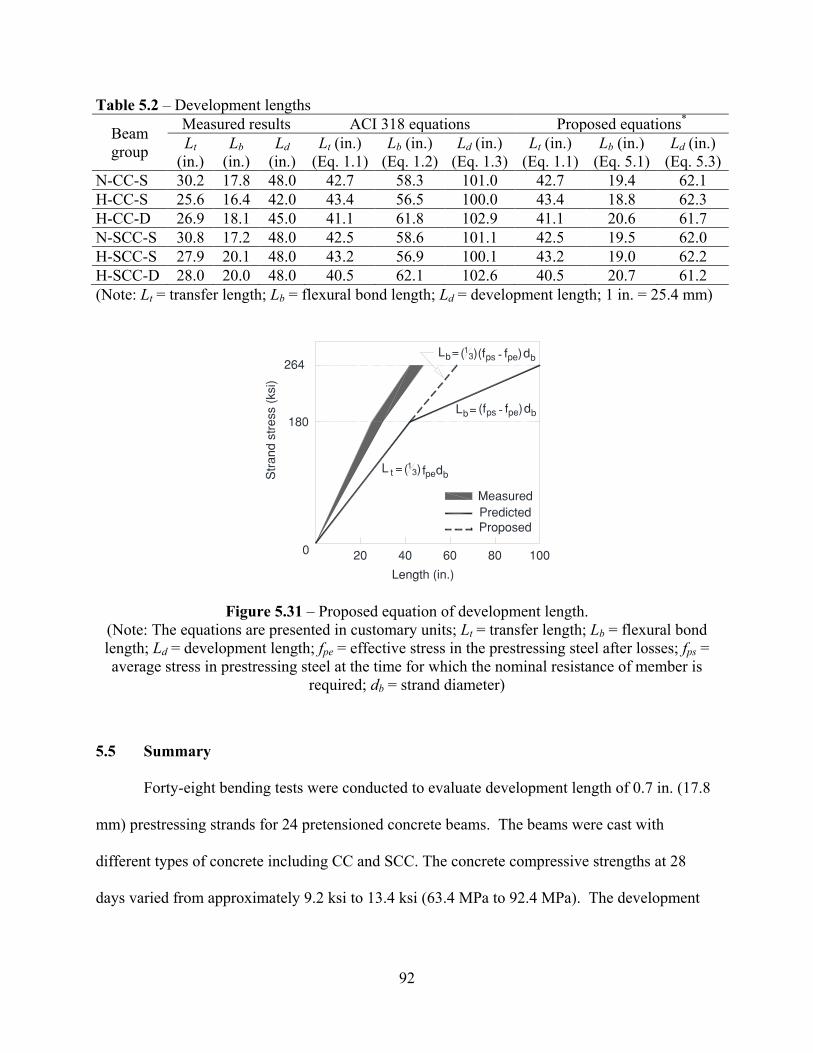
92
Table 5.2 – Development lengths
Beam group
Measured results ACI 318 equations Proposed equations* Lt
(in.) Lb
(in.) Ld
(in.) Lt (in.)
(Eq. 1.1) Lb (in.)
(Eq. 1.2) Ld (in.)
(Eq. 1.3) Lt (in.)
(Eq. 1.1) Lb (in.)
(Eq. 5.1) Ld (in.)
(Eq. 5.3) N-CC-S 30.2 17.8 48.0 42.7 58.3 101.0 42.7 19.4 62.1 H-CC-S 25.6 16.4 42.0 43.4 56.5 100.0 43.4 18.8 62.3 H-CC-D 26.9 18.1 45.0 41.1 61.8 102.9 41.1 20.6 61.7 N-SCC-S 30.8 17.2 48.0 42.5 58.6 101.1 42.5 19.5 62.0 H-SCC-S 27.9 20.1 48.0 43.2 56.9 100.1 43.2 19.0 62.2 H-SCC-D 28.0 20.0 48.0 40.5 62.1 102.6 40.5 20.7 61.2 (Note: Lt = transfer length; Lb = flexural bond length; Ld = development length; 1 in. = 25.4 mm)
Figure 5.31 – Proposed equation of development length. (Note: The equations are presented in customary units; Lt = transfer length; Lb = flexural bond length; Ld = development length; fpe = effective stress in the prestressing steel after losses; fps = average stress in prestressing steel at the time for which the nominal resistance of member is
required; db = strand diameter)
Summary 5.5
Forty-eight bending tests were conducted to evaluate development length of 0.7 in. (17.8
mm) prestressing strands for 24 pretensioned concrete beams. The beams were cast with
different types of concrete including CC and SCC. The concrete compressive strengths at 28
days varied from approximately 9.2 ksi to 13.4 ksi (63.4 MPa to 92.4 MPa). The development
93
length was determined by conducting bending tests with different embedment lengths. Based on
the experimental investigation, the following conclusions were made:
1. The measured development lengths of 0.7 in. (17.8 mm) prestressing strands varied from
3.5 ft to 4 ft (1067 mm to 1220 mm). These lengths were approximately 42% to 48% of
the predicted development lengths using ACI 318 equation.
2. Concrete compressive strength had little effect on the measured development lengths.
The N-CC-S, N-SCC-S, and H-SCC-S beams had an identical development length of 4 ft
(1220 mm) regardless of the difference in concrete compressive strengths. The H-CC-S
beams which used higher concrete compressive strength had a shorter development
length of 3.5 ft (1070 mm).
3. The use of strand spacing of 2.0 in. (51 mm) had little to no effect on the measured
development length of 0.7 in. (17.8 mm) prestressing strands. ACI 318 equation is
applicable to predicted development length of 0.7 in. (17.8 mm) prestressing strands
placed at spacing of 2.0 in. (51 mm).
4. The ACI 318 equation significantly over-predicted the measured flexural bond lengths.
A new equation of flexural bond length was proposed based on the experimental results
(Eq. 5.1). This equation was more appropriate for predicting the flexural bond lengths of
0.7 in. (17.8 mm) prestressing strands.
5. A new equation of development length of 0.7 in. (17.8 mm) prestressing strand was
proposed (Eq. 5.3). The measured development lengths were approximately from 67% to
78% the predicted development length using the proposed equation. The over-prediction
accounted for the limited experimental data in this study.
94
: SUMMARY AND CONCLUSIONS CHAPTER 6
Summary 6.1
This study measured transfer and development lengths and evaluated applicable strand
spacing of 0.7 in. (17.8 mm), Grade 270 (1860) prestressing strands for 24 pretensioned concrete
beams. Twelve beams were cast with normal strength and high strength conventional concrete.
The other beams were cast with normal strength and high strength self-consolidating concrete.
The concrete mixtures had a wide range of compressive strengths which varied from 5.9 ksi to
9.8 ksi (40.7 MPa to 67.6 MPa) at 1 day, and 9.2 ksi to 13.4 ksi (62.4 MPa to 92.5 MPa) at 28
days. In terms of number of prestressing strands, 16 beams were cast with one prestressing
strand, and 8 beams were cast with two prestressing strands. The beams using one strand
provided comparable data to evaluate the effect of strand spacing on transfer end development
lengths.
Transfer lengths were measured at release (approximately 1 day), and at 7, 14, 21, 28
days. Transfer lengths were determined using concrete strain profiles along with 95% AMS
method. The measured transfer lengths were analyzed and compared with the current
specifications. The effects of concrete compressive strength, types of concrete, and strand
spacing on the measured transfer lengths were evaluated. A new equation was proposed to
estimate transfer length at release based on a least square estimation method. Initial strand end-
slips were measured at release of prestressing strands. The measured end-slips were compared
with the allowable initial end-slips and analyzed to propose a coefficient for an existing
empirical formula to predict transfer lengths at release.
95
Development lengths were measured by conducting 48 bending tests with different
embedment lengths. The development length determination based on failure modes of the tested
specimens. For the specimen exhibited flexural failure, the tested embedment length is equal to
or greater than the development length. The effects of concrete compressive strength and strand
spacing on the measured development lengths were evaluated. The experimental data were
analyzed to propose a new equation for predicting development length of 0.7 in. (17.8 mm)
prestressing strands.
Conclusion 6.2
Transfer length 6.2.1
1. The average measured transfer lengths at release varied from 23 in. to 28 in. (584 mm to
710 mm). The experimental results confirmed the effect of concrete compressive
strength on transfer length of prestressing strands. The increase of concrete compressive
strength can shorten the transfer length.
2. At early ages, the bond strength between the prestressing strands with SCC was lower
with CC. At 28 days, however, the bond strength between prestressing strands with CC
and SCC was similar.
3. Transfer lengths increased by 7% to 17% during the first 28 days after casting. The
increase was independent of concrete compressive strengths and types of concrete. The
measured transfer lengths at 28 days varied from 26 in. to 31 in. (660 mm to 790 mm).
4. The lower and upper bound of the measured transfer lengths were proposed (Eq. 4.4).
The lower bound should be used to check allowable stresses at release. The upper bound
should be used when determining shear strength and moment capacity.
96
5. A concrete compressive strength at release of 8 ksi (55.2 MPa) was adequate for
detensioning 0.7 in. (17.8 mm) strands placed at spacing of 2.0 in. (51 mm).
6. The ACI 318 and ASSHTO specifications of transfer length are applicable for 0.7 in.
(17.8 mm) prestressing strands cast with the CC and SCC mixtures used in this study.
7. The measured initial strand end-slips may be less or greater than the AESs calculated
with different BSD coefficients. There were no apparent differences between the strand
end-slips at the live ends and the dead ends.
8. Transfer lengths at release can be estimated from initial strand end-slips using an
empirical formula. A coefficient of 2.38 was the most appropriate value for estimating
the transfer length with a coefficient of determination of 0.63.
Development length 6.2.2
1. The measured development lengths of 0.7 in. (17.8 mm) prestressing strands varied from
3.5 ft to 4 ft (1067 mm to 1220 mm). These lengths were approximately to 42% - 48% of
the predicted development lengths using ACI 318 equation.
2. Concrete compressive strength had little effect on the measured development lengths.
The N-CC-S, N-SCC-S, and H-SCC-S beams had an identical development length of 4 ft
(1220 mm) regardless of the difference in concrete compressive strengths. The H-CC-S
beams which used higher concrete compressive strength had a shorter development
length of 3.5 ft (1070 mm).
3. The ACI 318 equation significantly over-predicted the measured flexural bond lengths.
A new equation of flexural bond length was proposed based on the experimental results
(Eq. 5.1). This equation was more appropriate for predicting the flexural bond lengths of
0.7 in. (17.8 mm) prestressing strands.
97
4. A new equation of development length of 0.7 in. (17.8 mm) prestressing strand was
proposed (Eq. 5.3). The measured development lengths were approximately from 67% to
78% the predicted development length using the proposed equation. The over-prediction
accounted for the limited experimental data in this study.
Strand spacing 6.2.3
1. The use of strand spacing of 2.0 in. (51 mm) had little effect on the measured transfer
lengths at release, and no effect on the measured transfer length at 28 days. This
conclusion was applicable for concrete which had compressive strengths of 8 ksi (55.2
MPa) or greater at 1 day.
2. The use of strand spacing of 2.0 in. (51 mm) had little to no effect on the measured
development lengths of 0.7 in. (17.8 mm) prestressing strands. This conclusion was
applicable for high strength concrete which had compressive strengths of 10 ksi (69.0
MPa) or greater at 28 days.
98
REFERENCES
AASHTO. (2012). "LRFD Specifications for Highway Bridges." American Association of State Highway and Transportation Officials, Washington D.C.
ACI Committee 237. (2007). "Self-Consolidating Concrete." American Concrete Institute, Farmington Hills, MI.
ACI Committee 318. (2011). "Building Code Requirements for Structural Concrete (ACI 318-11) and Commentary (ACI 318R-11)." ACI 318, Farmington Hills, MI.
ACI Committee 323. (1963). "Building Code Requirements for Structural Concrete (ACI 318-63) and Commentary (ACI 318R-63)." ACI 318-63, Detroit, MI.
Akhnoukh, A. K. (2008). "Development of high performance precast/prestressed bridge girders". Ph.D. The University of Nebraska - Lincoln, United States -- Nebraska.
Arab, A. A. (2012). "Finite Element Modeling of Pretensioned Concrete Girders: A Methodological Approach with Applications in Large Strands and End Zone Cracking". Ph.D. The George Washington University, United States -- District of Columbia.
ASTM A1081. (2012). "Standard Test Method for Evaluating Bond of Seven-Wire Steel Prestressing Strand." West Conshohocken, PA.
ASTM A416. (2012). "Standard Specification for Steel Strand, Uncoated Seven-Wire for Prestressed Concrete." West Conshohocken, PA.
ASTM C143. (2012). "Standard Test Method for Slump of Hydraulic-Cement Concrete." West Conshohocken, PA.
ASTM C1611. (2014). "Standard Test Method for Slump Flow of Self-Consolidating Concrete." West Conshohocken, PA.
ASTM C1621. (2014). "Standard Test Method for Passing Ability of Self-Consolidating Concrete by J-Ring." West Conshohocken, PA.
Barnes, R. W., Burns, N. H., and Kreger, M. E. (1999). "Development Length of 0.6-Inch Prestressing Strand in Standard I-Shaped Pretensioned Concrete Beams." Rep. No. 1388-1, Center for Transportation Research, The University of Texas at Austin, Texas Department of Transportation.
Barnes, R. W., Grove, J. W., and Burns, N. H. (2003). "Experimental assessment of factors affecting transfer length." ACI Struct.J., 100(6), 740-748.
Boehm, K. M., Barnes, R. W., and Schindler, A. K. (2010). "Performance of Self-consolidating Concrete in Prestressed Girders." Rep. No. FHWA/ALDOT 930-602, Alabama Department of Transportation, Alabama.
99
Buckner, C. D. (1995). "A review of strand development length for pretensioned concrete members." PCI J., 40(2), 84-99.
Carroll, J. C. (2009). "Grade 300 Prestressing Strand and the Effect of Vertical Casting Position". Ph.D. Virginia Polytechnic Institute and State University, United States -- Virginia.
Cousins, T. E., Johnston, D. W., and Zia, P. (1990a). "Transfer and Development Length of Epoxy-Coated and Uncoated Prestressing Strands." PCI Journal, 35(3), 92-106.
Cousins, T. E., Stallings, J. M., and Simmons, M. B. (1993). "Effect of Strand Spacing on Development of Prestressing Strand." Rep. No. Research Report, Alaska Department of Transportation and Public Facilities, Alaska.
Cousins, T. E., Johnsone, D. W., and Zia, P. (1990b). "Transfer length of epoxy-coated prestressing strand." ACI Mater.J., 87(3), 193-203.
Cousins, T. E., Stallings, J. M., and Simmons, M. B. (1994). "Reduced strand spacing in pretensioned, prestressed members." ACI Struct.J., 91(3), 277-286.
Dang, C. N., Murray, C. D., Floyd, R. W., Micah Hale, W., and Martí-Vargas, J. R. (2014a). "Analysis of bond stress distribution for prestressing strand by Standard Test for Strand Bond." Eng.Struct., 72 152-159.
Dang, C. N., Murray, C. D., Floyd, R. W., Micah Hale, W., and Martí-Vargas, J. R. (2014b). "A Correlation of Strand Surface Quality to Transfer Length." ACI Struct.J., 111(5), 1245-1252.
Deatherage, J. H., Burdette, E. G., and Chew, C. K. (1994). "Development length and lateral spacing requirements of prestressing strand for prestressed concrete bridge girders." PCI J., 39(1), 70-83.
Floyd, R. W., Ruiz, E. D., Do, N. H., Staton, B. W., and Hale, W. M. (2011a). "Development lengths of high-strength self-consolidating concrete beams." PCI J., 56(1), 36-53.
Floyd, R. W., Howland, M. B., and Micah Hale, W. (2011b). "Evaluation of strand bond equations for prestressed members cast with self-consolidating concrete." Eng.Struct., 33(10), 2879-2887.
Gilbert, R. I., and Mickleborough, N. C. (1990). Design of prestressed concrete.
Girgis, A. F. M., and Tuan, C. Y. (2005). "Bond Strength and Transfer Length of Pre-tensioned Bridge Girders Cast with Self-Consolidating Concrete." PCI J., 72-87.
Gross, S. P., and Burns, N. H. (1995). "Transfer and development length of 15.2 mm (0.6 in.) diameter prestressing strand in high performance concrete: results of the Hoblitzell-Buckner beam tests." Rep. No. FHWA/TX-97/580-2, Center for Transportation Research, Texas.
100
Guyon, Y. (1953). "Pretensioned Concrete: Theoretical and Experimental Study." Paris, France.
Hatami, A., Morcous, G., Hanna, K. E., and Tadros, M. K. (2011). "Evaluating the Bond of 0.7-in. Diameter Prestressing Strands for Concrete Bridge Girders." TRB, (11-2104), 1-13.
Janney, J. R. (1954). "Nature of bond in pre-tensioned prestressed concrete." ACI Journal, .
Khayat, K., and Mitchell, D. (2009). "Self-consolidating concrete for precast, prestressed concrete bridge elements." Rep. No. NCHRP-628, Transportation Research Board, Washington, D.C.
Koehler, E. P., and Fowler, D. W. (2007). "Inspection Manual for Self-consolidating Concrete in Precast Members." Rep. No. TxDOT Project 0-5134, Center for Transportation Research, Texas.
Lane, S., and Rekenthaler Jr, D. (1998). "The Ties That Bind: The 10-Year Fight for 0.6-Inch Diameter Strands." Public Roads, 61(5), 27-29.
Larson, K. H., Peterman, R. J., and Esmaeily, A. (2007). "Bond characteristics of self-consolidating concrete for prestressed bridge girders." PCI J., 52(4), 44-57.
Logan, D. R. (1997). "Acceptance criteria for bond quality of strand for pretensioned prestressed concrete applications." PCI J., 42(2), 52-90.
Maguire, M. (2009). "Impact of 0.7 inch diameter prestressing strands in bridge girders". Master. University of Nebraska--Lincoln, .
Maguire, M., Morcous, G., and Tadros, M. (2013). "Structural Performance of Precast/Prestressed Bridge Double-Tee Girders Made of High-Strength Concrete, Welded Wire Reinforcement, and 18-mm-Diameter Strands." J.Bridge Eng., 18(10), 1053-1061.
Martí-Vargas, J. R., Arbelaez, C. A., Serna-Ros, P., and Castro-Bugallo, C. (2007a). "Reliability of transfer length estimation from strand end slip." ACI Struct.J., 104(4), 487-494.
Martí-Vargas, J. R., Arbelaez, C. A., Serna-Ros, P., Fernandez-Prada, M. A., and Miguel-Sosa, P. F. (2006). "Transfer and development lengths of concentrically prestressed concrete." PCI Journal, 51(5), 74-85.
Martí-Vargas, J. R., Arbelaez, C. A., Serna-Ros, P., Navarro-Gregori, J., and Pallares-Rubio, L. (2007b). "Analytical model for transfer length prediction of 13 mm prestressing strand." Structural Engineering & Mechanics, 26(2), 211-229.
Martí-Vargas, J. R., Serna, P., Navarro-Gregori, J., and Bonet, J. L. (2012). "Effects of concrete composition on transmission length of prestressing strands." Construction and Building Materials, 27(1), 350-356.
101
Meyer, K. F., Kahn, L. F., La, J. S., and Kurtis, K. E. (2002). "Transfer and Development Length of High Strength Lightweight Concrete Precast Prestressed Bridge Girders." Rep. No. 02-5, Georgia Department of Transportation, Georgia.
Mitchell, D., Cook, W. D., Khan, A. A., and Tham, T. (1993). "Influence of High Strength Concrete on Transfer and Development Length of Pretensioning Strand." PCI J., 38(3), 52-66.
Morcous, G., Hanna, K., and Tadros, M. K. (2011a). "Use of 0.7-in.-diameter strands in pretensioned bridge girders." PCI J., 56(4), 65-82.
Morcous, G., Hanna, K., and Tadros, M. K. (2011b). "Impact of 0.7 Inch Diameter Strands on NU I-Girders." Rep. No. P311, Nebraska Department of Roads (NDOR), Nebraska.
Morcous, G., Hatami, A., Maguire, M., Hanna, K., and Tadros, M. (2012). "Mechanical and Bond Properties of 18-mm- (0.7-in.-) Diameter Prestressing Strands." Journal of Materials in Civil Engineering, 24(6), 735-744.
Morcous, G., Asaad, S., and Hatami, A. (2013). "Implementation of 0.7 in. Diameter Strands in Prestressed Concrete Girders." Rep. No. SPR-P1(13) M333, Nebraska Department of Roads, Nebraska.
Morcous, G., Assad, S., Hatami, A., and Tadros, M. K. (2014). "Implementation of 0.7 in. diameter strands at 2.0× 2.0 in. spacing in pretensioned bridge girders." PCI J., 59(3), 145-158.
Morcous, G., Hanna, K., and Tadros, M. K. (2010). "Transfer and Development Length of 0.7-in.(17.8-mm) Diameter Strands in Pretensioned Concrete Bridge Girders." HPC Bridge Views, (64), 7-9.
Myers, J. J., Volz, J. S., Sells, E., Porterfield, K., Looney, T., Tucker, B., and Holman, K. (2012). "Report B: Self‐Consolidating Concrete (SCC) for Infrastructure Elements: Bond, Transfer Length, and Development Length of Prestressing Strand in SCC." Rep. No. CMR 13-003, Missouri Department of Transportation, Missouri University of Science and Technology.
Oh, B. H., and Kim, E. S. (2000). "Realistic evaluation of transfer lengths in pretensioned, prestressed concrete members." ACI Struct.J., 97(6), 821-830.
Okamura, H., and Ouchi, M. (2003). "Self-compacting concrete." Journal of Advanced Concrete Technology, 1(1), 5-15.
Okamura, H., Ozawa, K., and Ouchi, M. (2000). "Self-compacting concrete." Structural Concrete, 1(1), 3-17.
Park, H., and Cho, J. (2014). "Bond-Slip-Strain Relationship in Transfer Zone of Pretensioned Concrete Elements." ACI Struct.J., 111(3), 503-514.
102
Patzlaff, Q., Morcous, G., Hanna, K., and Tadros, M. (2012). "Bottom Flange Confinement Reinforcement in Precast Prestressed Concrete Bridge Girders." J.Bridge Eng., 17(4), 607-616.
Patzlaff, Q. (2010). "Impact of bottom flange confinement reinforcement on performance of prestressed concrete bridge girders". Master. University of Nebraska -- Lincoln, .
Precast-Prestressed Concrete Institute. (2010). PCI Design Handbook: Precast and Prestressed Concrete. PCI, Chicago.
Ramirez, J. A., and Russell, B. W. (2008). "Transfer, development, and splice length for strand/reinforcement in high strength concrete." Rep. No. NCHRP 603, Transportation Research Board, Washington, D.C.
Rose, D., and Russell, B. (1997). "Investigation of standardized tests to measure the bond performance of prestressing strand." PCI J., 42(4), 56-80.
Russell, B. W. (2006). "NASP Round IV Strand Bond Testing." Rep. No. Final Report, OK.
Russell, B. W., and Brown, M. D. (2004). "Evaluation of Test Methods in Assessing Bond Quality of Prestressing Strands." Rep. No. Final Report, Oklahoma State University, Stillwater, OK.
Russell, B. W., and Burns, N. (1997). "Measurement of Transfer Lengths on Pretensioned Concrete Elements." J.Struct.Eng., 123(5), 541-549.
Russell, B. W., and Paulsgrove, G. A. (1999a). "Assessing Repeatability and Reproducibility of the Moustafa Test, the PTI Bond Test and the NASP Bond Test." Rep. No. Final Report 99-04, The University of Oklahoma, Fears Structural Engineering Laboratory, Norman, OK.
Russell, B. W., and Paulsgrove, G. A. (1999b). "NASP Strand Bond Testing Round One Pull-Out Tests and Friction Bond Tests of Untensioned Strand." Rep. No. Final Report 99-03, The University of Oklahoma, Fears Structural Engineering Laboratory, Norman, OK.
Russell, B. W., and Burns, N. H. (1996). "Measured transfer lengths of 0.5 and 0.6 in. strands in pretensioned concrete." PCI J., 41(5), 44-65.
Russell, B. W., and Burns, N. H. (1993). "Design Guidelines For Transfer, Development And Debonding Of Large Diameter Seven Wire Strands In Pretensioned Concrete Girders." Rep. No. FHWA/TX-93+1210-5F, Texas Department of Transportation, Austin.
Russell, H., Volz, J., and Bruce, R. N. (1997). "Optimized Sections for High-Strength Concrete Bridge Girders." Rep. No. FHWA-RD-95-180, Transportation Research Board, Washington, D.C.
Schuler, G. (2009). "Producer’s Experience with 10,000 psi Concrete and 0.7-in. Diameter Strands." HPC Bridge Views, (54), 9-11.
103
Shahawy, M. A., Issa, M., and Batchelor, B. (1992). "Strand transfer lengths in full scale AASHTO prestressed concrete girders." PCI J., 37(3), 84-96.
Song, W., Ma, Z. J., Vadivelu, J., and Burdette, E. G. (2013). "Transfer Length and Splitting Force Calculation for Pretensioned Concrete Girders with High-Capacity Strands." J.Bridge Eng., 19(7), 1-8.
Staton, B. W., Do, N. H., Ruiz, E. D., and Hale, W. M. (2009). "Transfer lengths of prestressed beams cast with self-consolidating concrete." PCI J., 54(2), 64-83.
Unay, I. O., Russell, B., Burns, N., and Kreger, M. (1991). "Measurement of transfer length on prestressing strands in prestressed concrete specimens." Rep. No. 1210-1, Federal Highway Administration, Austin.
Vadivelu, J. (2009). "Impact of Larger Diameter Strands on AASHTO/PCI Bulb-Tees". Master. University of Tennessee, TN.
Zia, P., and Mostafa, T. (1977). "Development length of prestressing strands." PCI Journal, 22(5), 54-65.
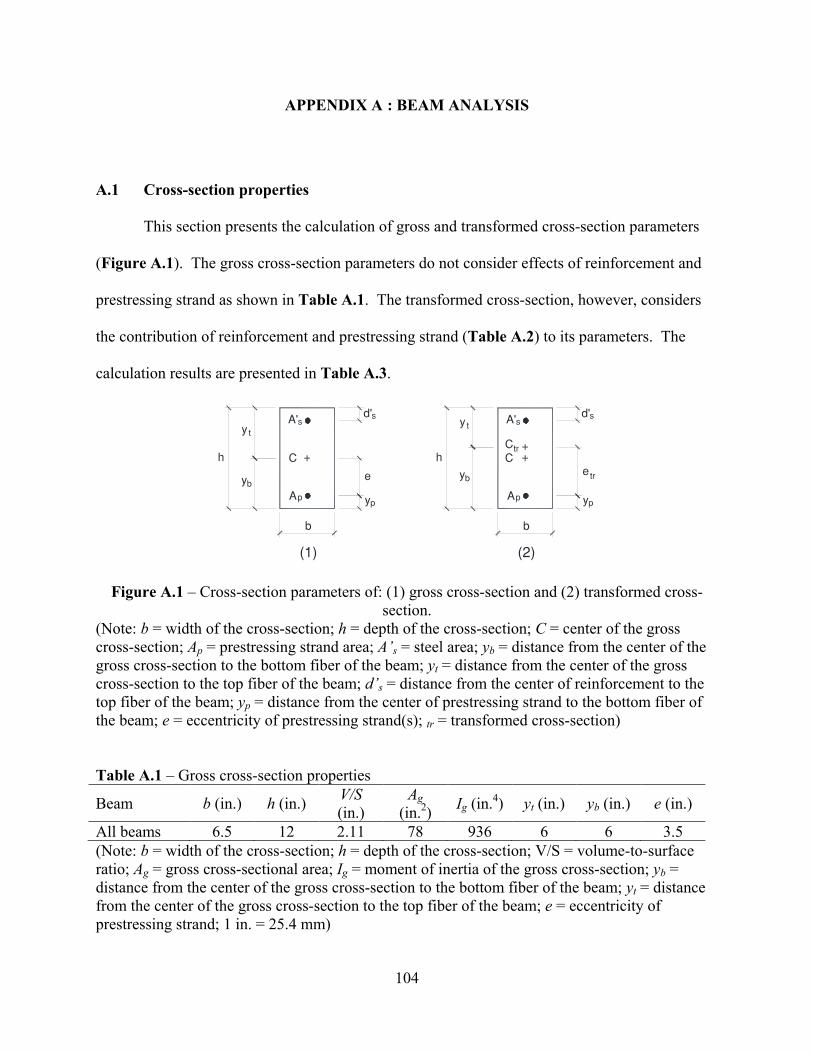
104
APPENDIX A : BEAM ANALYSIS
A.1 Cross-section properties
This section presents the calculation of gross and transformed cross-section parameters
(Figure A.1). The gross cross-section parameters do not consider effects of reinforcement and
prestressing strand as shown in Table A.1. The transformed cross-section, however, considers
the contribution of reinforcement and prestressing strand (Table A.2) to its parameters. The
calculation results are presented in Table A.3.
Figure A.1 – Cross-section parameters of: (1) gross cross-section and (2) transformed cross-section.
(Note: b = width of the cross-section; h = depth of the cross-section; C = center of the gross cross-section; Ap = prestressing strand area; A’s = steel area; yb = distance from the center of the gross cross-section to the bottom fiber of the beam; yt = distance from the center of the gross cross-section to the top fiber of the beam; d’s = distance from the center of reinforcement to the top fiber of the beam; yp = distance from the center of prestressing strand to the bottom fiber of the beam; e = eccentricity of prestressing strand(s); tr = transformed cross-section)
Table A.1 – Gross cross-section properties
Beam b (in.) h (in.) V/S (in.)
Ag (in.2) Ig (in.4) yt (in.) yb (in.) e (in.)
All beams 6.5 12 2.11 78 936 6 6 3.5 (Note: b = width of the cross-section; h = depth of the cross-section; V/S = volume-to-surface ratio; Ag = gross cross-sectional area; Ig = moment of inertia of the gross cross-section; yb = distance from the center of the gross cross-section to the bottom fiber of the beam; yt = distance from the center of the gross cross-section to the top fiber of the beam; e = eccentricity of prestressing strand; 1 in. = 25.4 mm)
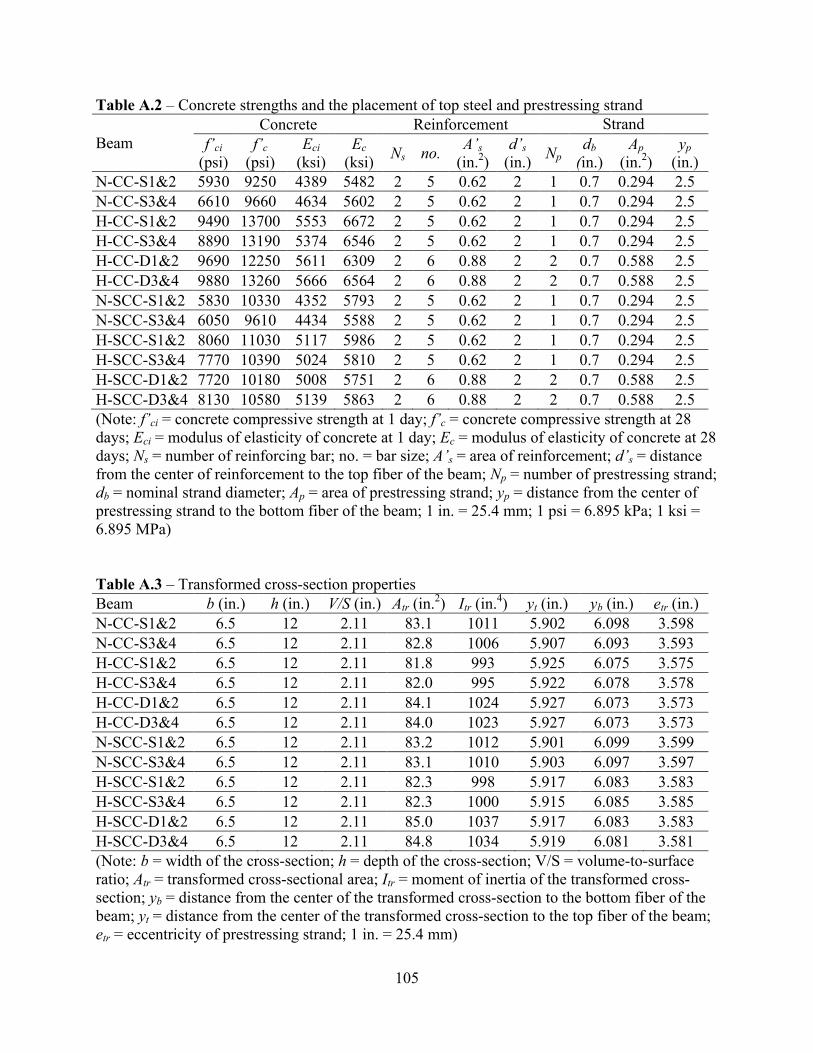
105
Table A.2 – Concrete strengths and the placement of top steel and prestressing strand
Beam Concrete Reinforcement Strand
f’ci (psi)
f’c (psi)
Eci (ksi)
Ec (ksi) Ns no. A’s
(in.2) d’s
(in.) Np db
(in.) Ap
(in.2) yp
(in.) N-CC-S1&2 5930 9250 4389 5482 2 5 0.62 2 1 0.7 0.294 2.5 N-CC-S3&4 6610 9660 4634 5602 2 5 0.62 2 1 0.7 0.294 2.5 H-CC-S1&2 9490 13700 5553 6672 2 5 0.62 2 1 0.7 0.294 2.5 H-CC-S3&4 8890 13190 5374 6546 2 5 0.62 2 1 0.7 0.294 2.5 H-CC-D1&2 9690 12250 5611 6309 2 6 0.88 2 2 0.7 0.588 2.5 H-CC-D3&4 9880 13260 5666 6564 2 6 0.88 2 2 0.7 0.588 2.5 N-SCC-S1&2 5830 10330 4352 5793 2 5 0.62 2 1 0.7 0.294 2.5 N-SCC-S3&4 6050 9610 4434 5588 2 5 0.62 2 1 0.7 0.294 2.5 H-SCC-S1&2 8060 11030 5117 5986 2 5 0.62 2 1 0.7 0.294 2.5 H-SCC-S3&4 7770 10390 5024 5810 2 5 0.62 2 1 0.7 0.294 2.5 H-SCC-D1&2 7720 10180 5008 5751 2 6 0.88 2 2 0.7 0.588 2.5 H-SCC-D3&4 8130 10580 5139 5863 2 6 0.88 2 2 0.7 0.588 2.5 (Note: f’ci = concrete compressive strength at 1 day; f’c = concrete compressive strength at 28 days; Eci = modulus of elasticity of concrete at 1 day; Ec = modulus of elasticity of concrete at 28 days; Ns = number of reinforcing bar; no. = bar size; A’s = area of reinforcement; d’s = distance from the center of reinforcement to the top fiber of the beam; Np = number of prestressing strand; db = nominal strand diameter; Ap = area of prestressing strand; yp = distance from the center of prestressing strand to the bottom fiber of the beam; 1 in. = 25.4 mm; 1 psi = 6.895 kPa; 1 ksi = 6.895 MPa)
Table A.3 – Transformed cross-section properties Beam b (in.) h (in.) V/S (in.) Atr (in.2) Itr (in.4) yt (in.) yb (in.) etr (in.) N-CC-S1&2 6.5 12 2.11 83.1 1011 5.902 6.098 3.598 N-CC-S3&4 6.5 12 2.11 82.8 1006 5.907 6.093 3.593 H-CC-S1&2 6.5 12 2.11 81.8 993 5.925 6.075 3.575 H-CC-S3&4 6.5 12 2.11 82.0 995 5.922 6.078 3.578 H-CC-D1&2 6.5 12 2.11 84.1 1024 5.927 6.073 3.573 H-CC-D3&4 6.5 12 2.11 84.0 1023 5.927 6.073 3.573 N-SCC-S1&2 6.5 12 2.11 83.2 1012 5.901 6.099 3.599 N-SCC-S3&4 6.5 12 2.11 83.1 1010 5.903 6.097 3.597 H-SCC-S1&2 6.5 12 2.11 82.3 998 5.917 6.083 3.583 H-SCC-S3&4 6.5 12 2.11 82.3 1000 5.915 6.085 3.585 H-SCC-D1&2 6.5 12 2.11 85.0 1037 5.917 6.083 3.583 H-SCC-D3&4 6.5 12 2.11 84.8 1034 5.919 6.081 3.581 (Note: b = width of the cross-section; h = depth of the cross-section; V/S = volume-to-surface ratio; Atr = transformed cross-sectional area; Itr = moment of inertia of the transformed cross-section; yb = distance from the center of the transformed cross-section to the bottom fiber of the beam; yt = distance from the center of the transformed cross-section to the top fiber of the beam; etr = eccentricity of prestressing strand; 1 in. = 25.4 mm)
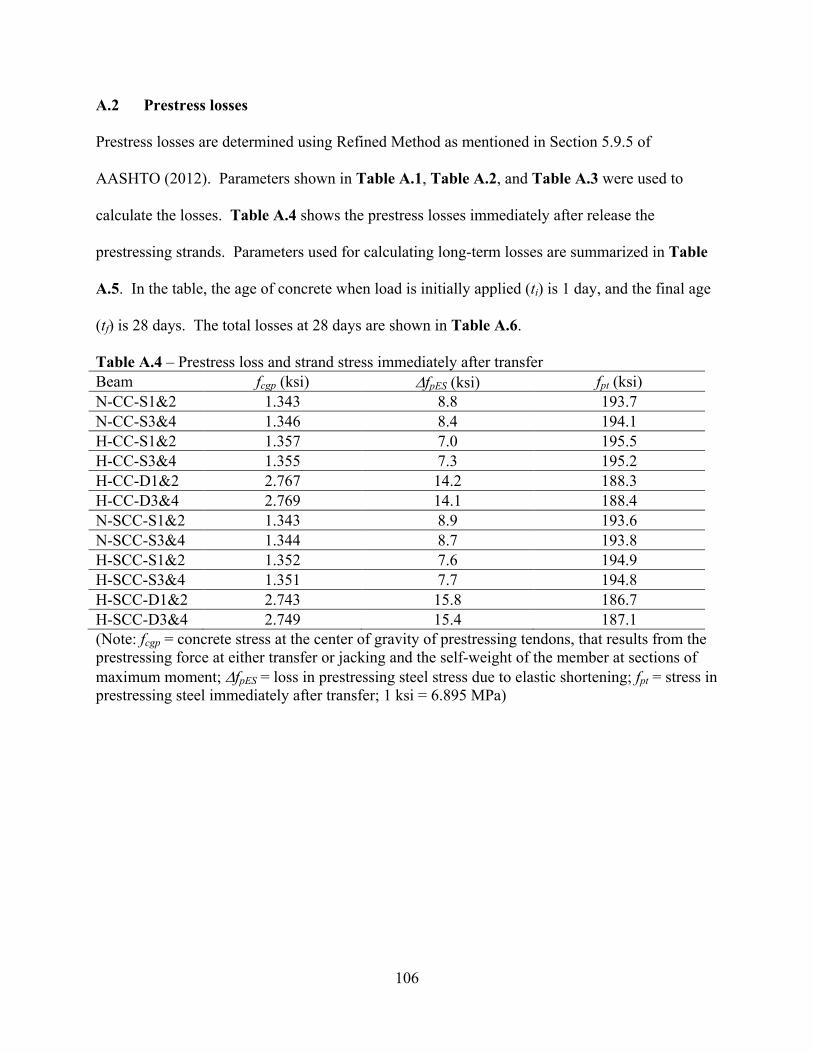
106
A.2 Prestress losses
Prestress losses are determined using Refined Method as mentioned in Section 5.9.5 of
AASHTO (2012). Parameters shown in Table A.1, Table A.2, and Table A.3 were used to
calculate the losses. Table A.4 shows the prestress losses immediately after release the
prestressing strands. Parameters used for calculating long-term losses are summarized in Table
A.5. In the table, the age of concrete when load is initially applied (ti) is 1 day, and the final age
(tf) is 28 days. The total losses at 28 days are shown in Table A.6.
Table A.4 – Prestress loss and strand stress immediately after transfer Beam fcgp (ksi) ∆fpES (ksi) fpt (ksi) N-CC-S1&2 1.343 8.8 193.7 N-CC-S3&4 1.346 8.4 194.1 H-CC-S1&2 1.357 7.0 195.5 H-CC-S3&4 1.355 7.3 195.2 H-CC-D1&2 2.767 14.2 188.3 H-CC-D3&4 2.769 14.1 188.4 N-SCC-S1&2 1.343 8.9 193.6 N-SCC-S3&4 1.344 8.7 193.8 H-SCC-S1&2 1.352 7.6 194.9 H-SCC-S3&4 1.351 7.7 194.8 H-SCC-D1&2 2.743 15.8 186.7 H-SCC-D3&4 2.749 15.4 187.1 (Note: fcgp = concrete stress at the center of gravity of prestressing tendons, that results from the prestressing force at either transfer or jacking and the self-weight of the member at sections of maximum moment; ∆fpES = loss in prestressing steel stress due to elastic shortening; fpt = stress in prestressing steel immediately after transfer; 1 ksi = 6.895 MPa)
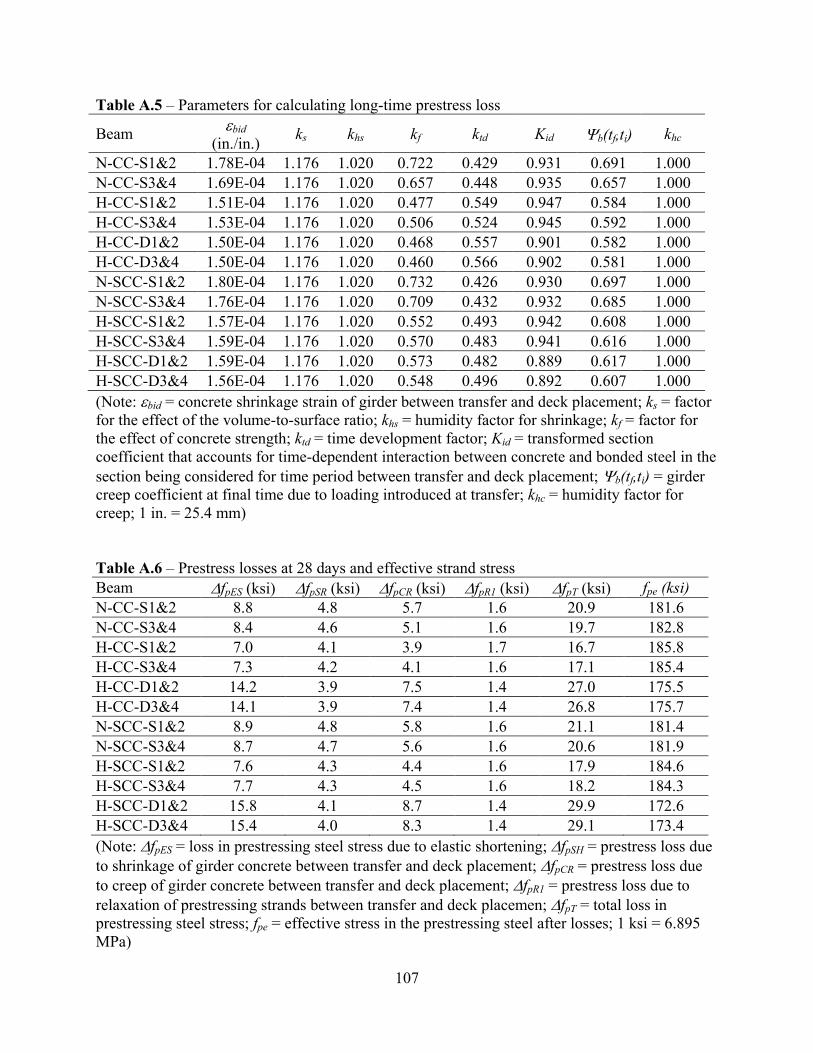
107
Table A.5 – Parameters for calculating long-time prestress loss
Beam εbid (in./in.) ks khs kf ktd Kid Ψb(tf,ti) khc
N-CC-S1&2 1.78E-04 1.176 1.020 0.722 0.429 0.931 0.691 1.000 N-CC-S3&4 1.69E-04 1.176 1.020 0.657 0.448 0.935 0.657 1.000 H-CC-S1&2 1.51E-04 1.176 1.020 0.477 0.549 0.947 0.584 1.000 H-CC-S3&4 1.53E-04 1.176 1.020 0.506 0.524 0.945 0.592 1.000 H-CC-D1&2 1.50E-04 1.176 1.020 0.468 0.557 0.901 0.582 1.000 H-CC-D3&4 1.50E-04 1.176 1.020 0.460 0.566 0.902 0.581 1.000 N-SCC-S1&2 1.80E-04 1.176 1.020 0.732 0.426 0.930 0.697 1.000 N-SCC-S3&4 1.76E-04 1.176 1.020 0.709 0.432 0.932 0.685 1.000 H-SCC-S1&2 1.57E-04 1.176 1.020 0.552 0.493 0.942 0.608 1.000 H-SCC-S3&4 1.59E-04 1.176 1.020 0.570 0.483 0.941 0.616 1.000 H-SCC-D1&2 1.59E-04 1.176 1.020 0.573 0.482 0.889 0.617 1.000 H-SCC-D3&4 1.56E-04 1.176 1.020 0.548 0.496 0.892 0.607 1.000 (Note: εbid = concrete shrinkage strain of girder between transfer and deck placement; ks = factor for the effect of the volume-to-surface ratio; khs = humidity factor for shrinkage; kf = factor for the effect of concrete strength; ktd = time development factor; Kid = transformed section coefficient that accounts for time-dependent interaction between concrete and bonded steel in the section being considered for time period between transfer and deck placement; Ψb(tf,ti) = girder creep coefficient at final time due to loading introduced at transfer; khc = humidity factor for creep; 1 in. = 25.4 mm)
Table A.6 – Prestress losses at 28 days and effective strand stress Beam ∆fpES (ksi) ∆fpSR (ksi) ∆fpCR (ksi) ∆fpR1 (ksi) ∆fpT (ksi) fpe (ksi) N-CC-S1&2 8.8 4.8 5.7 1.6 20.9 181.6 N-CC-S3&4 8.4 4.6 5.1 1.6 19.7 182.8 H-CC-S1&2 7.0 4.1 3.9 1.7 16.7 185.8 H-CC-S3&4 7.3 4.2 4.1 1.6 17.1 185.4 H-CC-D1&2 14.2 3.9 7.5 1.4 27.0 175.5 H-CC-D3&4 14.1 3.9 7.4 1.4 26.8 175.7 N-SCC-S1&2 8.9 4.8 5.8 1.6 21.1 181.4 N-SCC-S3&4 8.7 4.7 5.6 1.6 20.6 181.9 H-SCC-S1&2 7.6 4.3 4.4 1.6 17.9 184.6 H-SCC-S3&4 7.7 4.3 4.5 1.6 18.2 184.3 H-SCC-D1&2 15.8 4.1 8.7 1.4 29.9 172.6 H-SCC-D3&4 15.4 4.0 8.3 1.4 29.1 173.4 (Note: ∆fpES = loss in prestressing steel stress due to elastic shortening; ∆fpSH = prestress loss due to shrinkage of girder concrete between transfer and deck placement; ∆fpCR = prestress loss due to creep of girder concrete between transfer and deck placement; ∆fpR1 = prestress loss due to relaxation of prestressing strands between transfer and deck placemen; ∆fpT = total loss in prestressing steel stress; fpe = effective stress in the prestressing steel after losses; 1 ksi = 6.895 MPa)
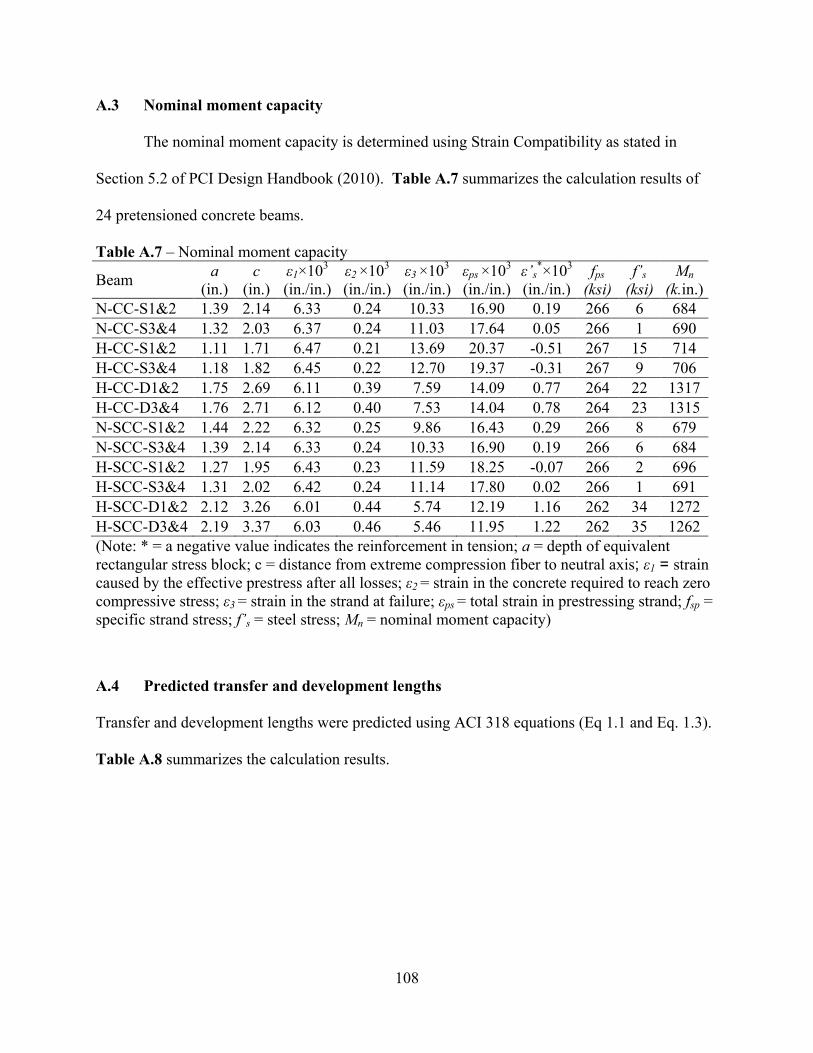
108
A.3 Nominal moment capacity
The nominal moment capacity is determined using Strain Compatibility as stated in
Section 5.2 of PCI Design Handbook (2010). Table A.7 summarizes the calculation results of
24 pretensioned concrete beams.
Table A.7 – Nominal moment capacity
Beam a (in.)
c (in.)
ε1×10³ (in./in.)
ε2 ×10³
(in./in.) ε3 ×10³
(in./in.) εps ×103
(in./in.) ε’s*×103
(in./in.) fps
(ksi) f’s
(ksi) Mn
(k.in.) N-CC-S1&2 1.39 2.14 6.33 0.24 10.33 16.90 0.19 266 6 684 N-CC-S3&4 1.32 2.03 6.37 0.24 11.03 17.64 0.05 266 1 690 H-CC-S1&2 1.11 1.71 6.47 0.21 13.69 20.37 -0.51 267 15 714 H-CC-S3&4 1.18 1.82 6.45 0.22 12.70 19.37 -0.31 267 9 706 H-CC-D1&2 1.75 2.69 6.11 0.39 7.59 14.09 0.77 264 22 1317 H-CC-D3&4 1.76 2.71 6.12 0.40 7.53 14.04 0.78 264 23 1315 N-SCC-S1&2 1.44 2.22 6.32 0.25 9.86 16.43 0.29 266 8 679 N-SCC-S3&4 1.39 2.14 6.33 0.24 10.33 16.90 0.19 266 6 684 H-SCC-S1&2 1.27 1.95 6.43 0.23 11.59 18.25 -0.07 266 2 696 H-SCC-S3&4 1.31 2.02 6.42 0.24 11.14 17.80 0.02 266 1 691 H-SCC-D1&2 2.12 3.26 6.01 0.44 5.74 12.19 1.16 262 34 1272 H-SCC-D3&4 2.19 3.37 6.03 0.46 5.46 11.95 1.22 262 35 1262 (Note: * = a negative value indicates the reinforcement in tension; a = depth of equivalent rectangular stress block; c = distance from extreme compression fiber to neutral axis; ε1 = strain caused by the effective prestress after all losses; ε2 = strain in the concrete required to reach zero compressive stress; ε3 = strain in the strand at failure; εps = total strain in prestressing strand; fsp = specific strand stress; f’s = steel stress; Mn = nominal moment capacity)
A.4 Predicted transfer and development lengths
Transfer and development lengths were predicted using ACI 318 equations (Eq 1.1 and Eq. 1.3).
Table A.8 summarizes the calculation results.
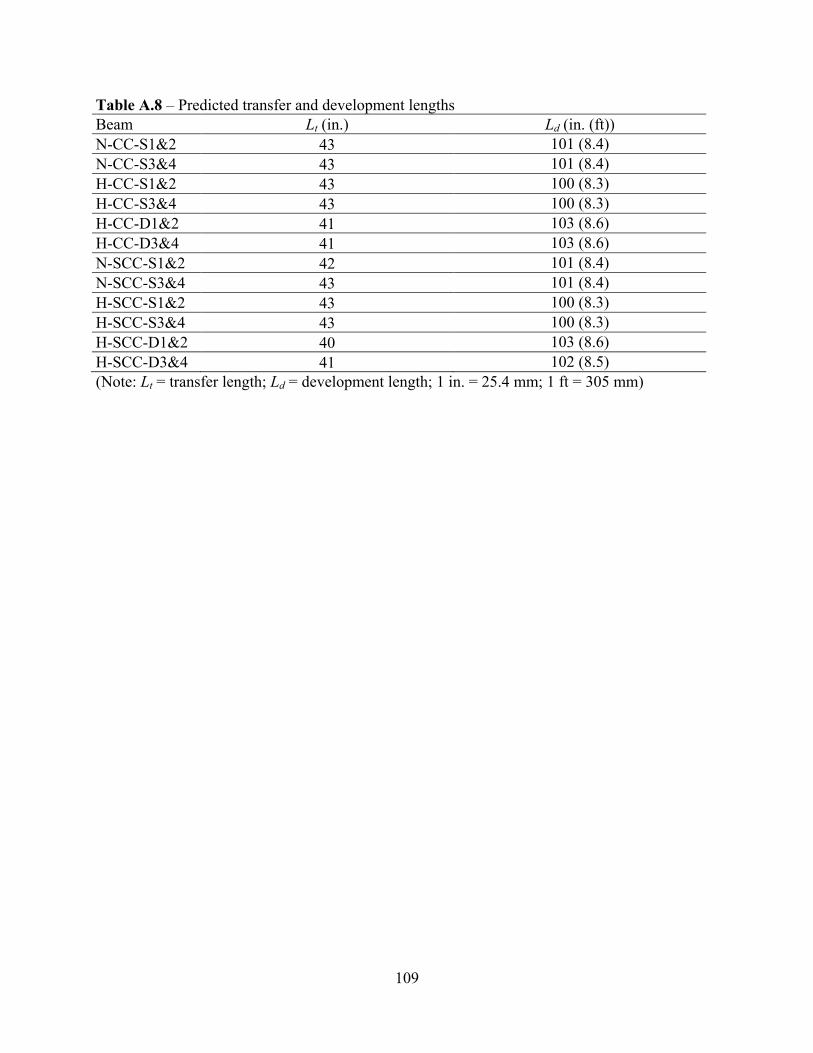
109
Table A.8 – Predicted transfer and development lengths Beam Lt (in.) Ld (in. (ft)) N-CC-S1&2 43 101 (8.4) N-CC-S3&4 43 101 (8.4) H-CC-S1&2 43 100 (8.3) H-CC-S3&4 43 100 (8.3) H-CC-D1&2 41 103 (8.6) H-CC-D3&4 41 103 (8.6) N-SCC-S1&2 42 101 (8.4) N-SCC-S3&4 43 101 (8.4) H-SCC-S1&2 43 100 (8.3) H-SCC-S3&4 43 100 (8.3) H-SCC-D1&2 40 103 (8.6) H-SCC-D3&4 41 102 (8.5) (Note: Lt = transfer length; Ld = development length; 1 in. = 25.4 mm; 1 ft = 305 mm)
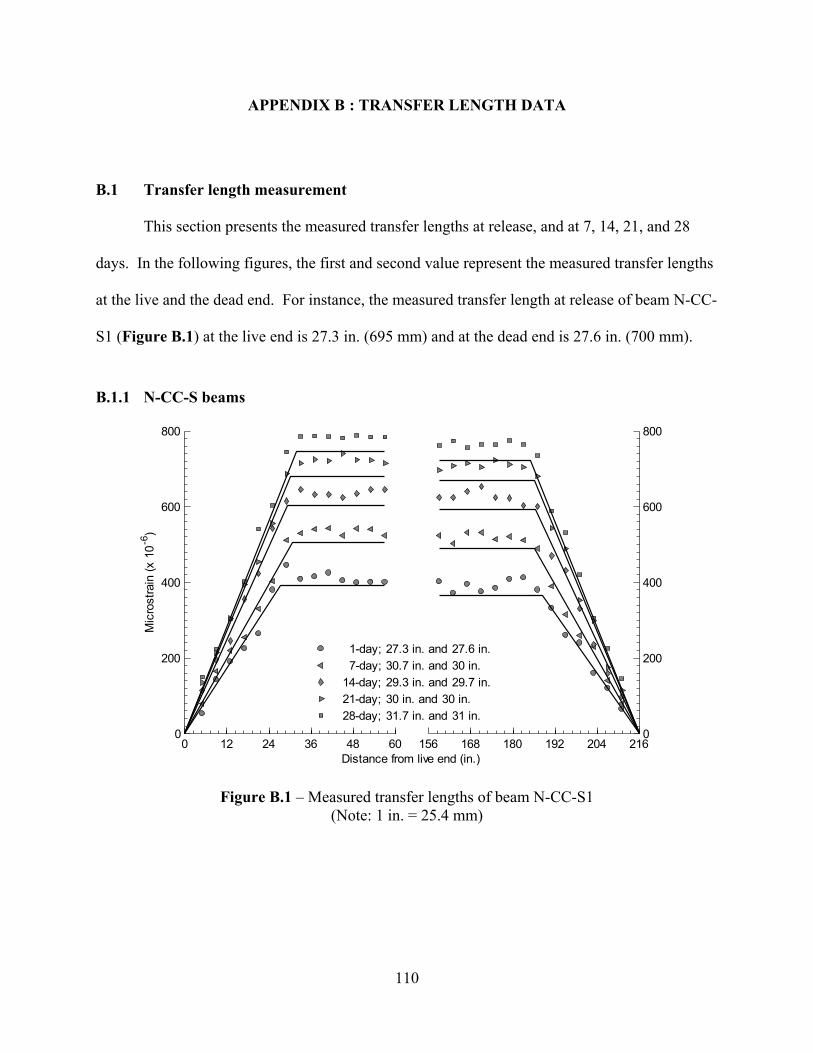
110
APPENDIX B : TRANSFER LENGTH DATA
B.1 Transfer length measurement
This section presents the measured transfer lengths at release, and at 7, 14, 21, and 28
days. In the following figures, the first and second value represent the measured transfer lengths
at the live and the dead end. For instance, the measured transfer length at release of beam N-CC-
S1 (Figure B.1) at the live end is 27.3 in. (695 mm) and at the dead end is 27.6 in. (700 mm).
B.1.1 N-CC-S beams
0 12 24 36 48 600
200
400
600
800
Distance from live end (in.)
Mic
rost
rain
(x 1
0-6)
156 168 180 192 204 2160
200
400
600
800
1-day; 27.3 in. and 27.6 in. 7-day; 30.7 in. and 30 in.14-day; 29.3 in. and 29.7 in.21-day; 30 in. and 30 in.28-day; 31.7 in. and 31 in.
Figure B.1 – Measured transfer lengths of beam N-CC-S1 (Note: 1 in. = 25.4 mm)
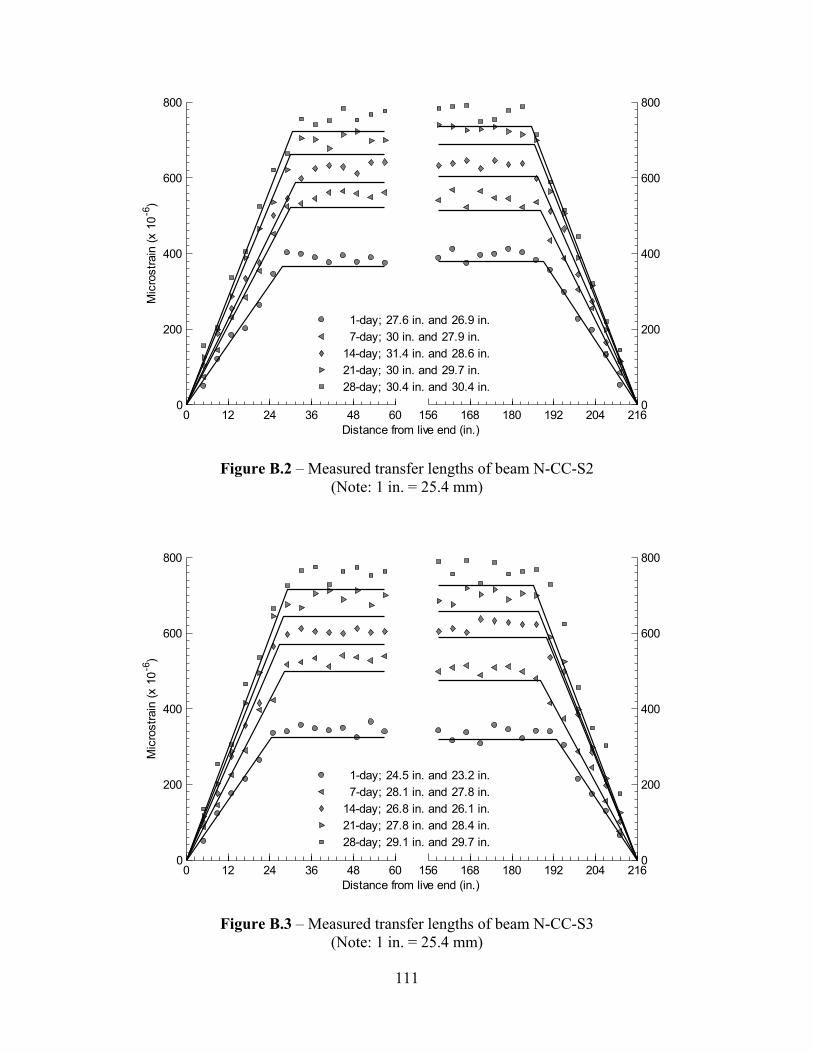
111
Figure B.2 – Measured transfer lengths of beam N-CC-S2 (Note: 1 in. = 25.4 mm)
Figure B.3 – Measured transfer lengths of beam N-CC-S3 (Note: 1 in. = 25.4 mm)
0 12 24 36 48 600
200
400
600
800
Distance from live end (in.)
Mic
rost
rain
(x 1
0-6)
156 168 180 192 204 2160
200
400
600
800
1-day; 27.6 in. and 26.9 in. 7-day; 30 in. and 27.9 in.14-day; 31.4 in. and 28.6 in.21-day; 30 in. and 29.7 in.28-day; 30.4 in. and 30.4 in.
0 12 24 36 48 600
200
400
600
800
Distance from live end (in.)
Mic
rost
rain
(x 1
0-6)
156 168 180 192 204 2160
200
400
600
800
1-day; 24.5 in. and 23.2 in. 7-day; 28.1 in. and 27.8 in.14-day; 26.8 in. and 26.1 in.21-day; 27.8 in. and 28.4 in.28-day; 29.1 in. and 29.7 in.
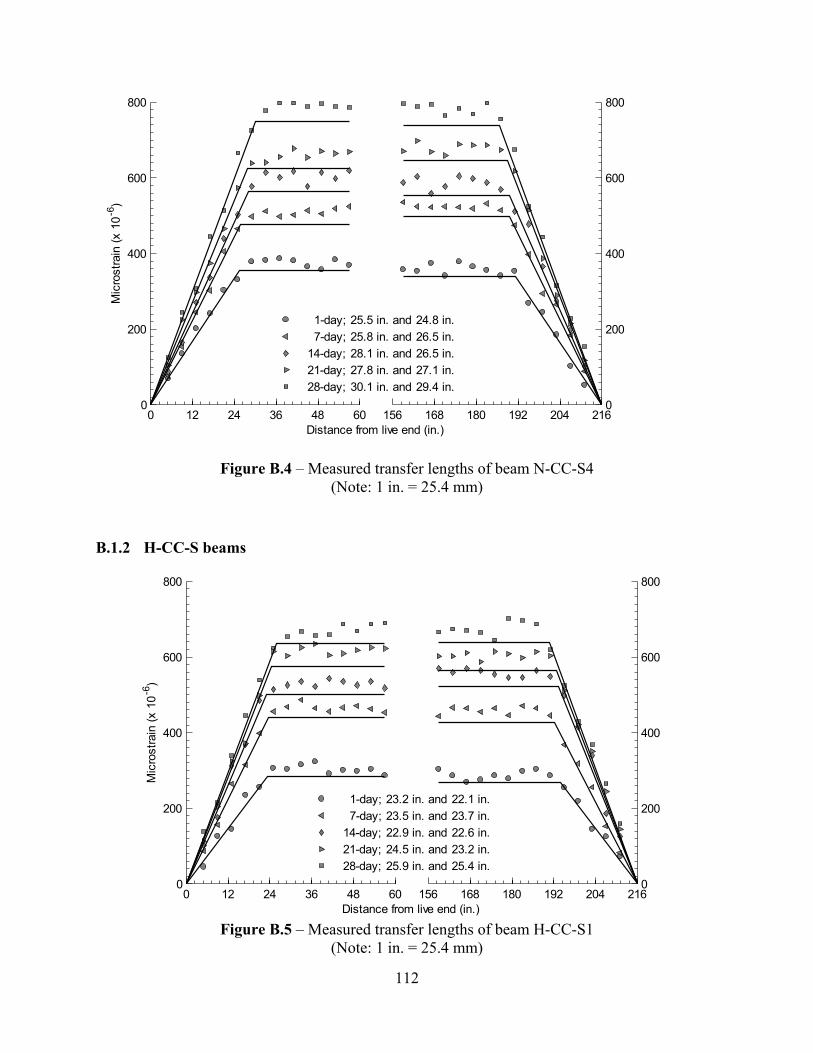
112
Figure B.4 – Measured transfer lengths of beam N-CC-S4 (Note: 1 in. = 25.4 mm)
B.1.2 H-CC-S beams
Figure B.5 – Measured transfer lengths of beam H-CC-S1
(Note: 1 in. = 25.4 mm)
0 12 24 36 48 600
200
400
600
800
Distance from live end (in.)
Mic
rost
rain
(x 1
0-6)
156 168 180 192 204 2160
200
400
600
800
1-day; 25.5 in. and 24.8 in. 7-day; 25.8 in. and 26.5 in.14-day; 28.1 in. and 26.5 in.21-day; 27.8 in. and 27.1 in.28-day; 30.1 in. and 29.4 in.
0 12 24 36 48 600
200
400
600
800
Distance from live end (in.)
Mic
rost
rain
(x 1
0-6)
156 168 180 192 204 2160
200
400
600
800
1-day; 23.2 in. and 22.1 in. 7-day; 23.5 in. and 23.7 in.14-day; 22.9 in. and 22.6 in.21-day; 24.5 in. and 23.2 in.28-day; 25.9 in. and 25.4 in.
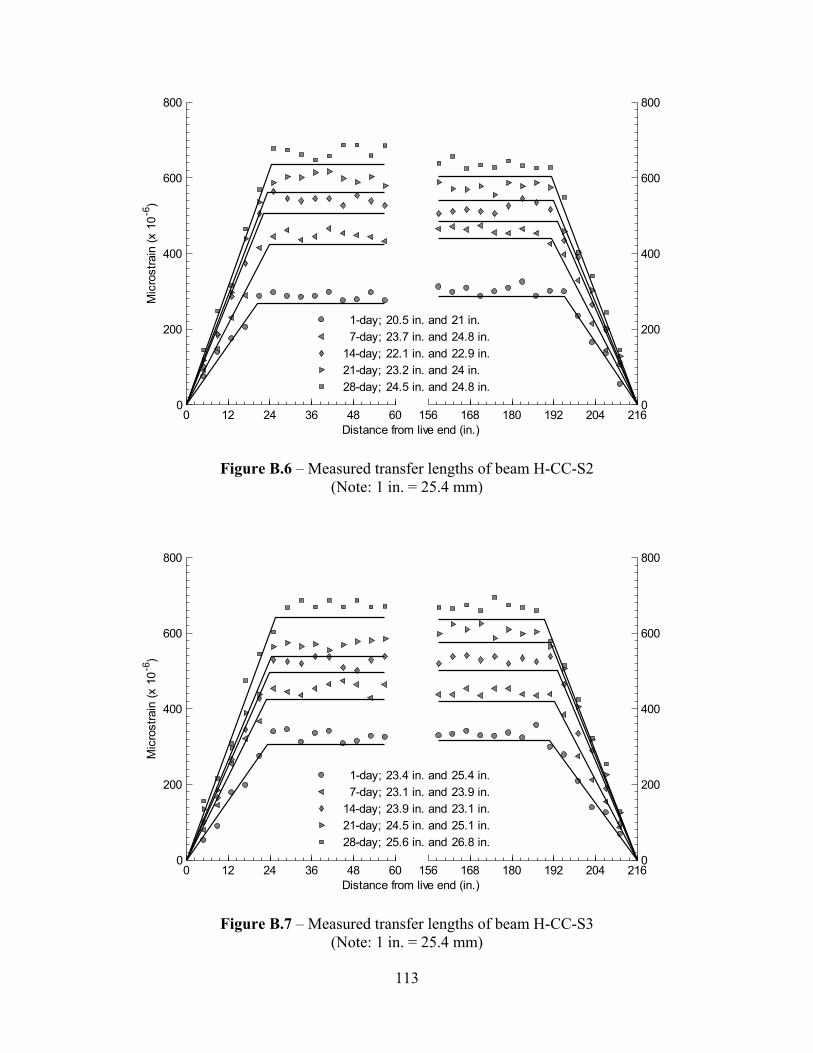
113
Figure B.6 – Measured transfer lengths of beam H-CC-S2 (Note: 1 in. = 25.4 mm)
Figure B.7 – Measured transfer lengths of beam H-CC-S3 (Note: 1 in. = 25.4 mm)
0 12 24 36 48 600
200
400
600
800
Distance from live end (in.)
Mic
rost
rain
(x 1
0-6)
156 168 180 192 204 2160
200
400
600
800
1-day; 20.5 in. and 21 in. 7-day; 23.7 in. and 24.8 in.14-day; 22.1 in. and 22.9 in.21-day; 23.2 in. and 24 in.28-day; 24.5 in. and 24.8 in.
0 12 24 36 48 600
200
400
600
800
Distance from live end (in.)
Mic
rost
rain
(x 1
0-6)
156 168 180 192 204 2160
200
400
600
800
1-day; 23.4 in. and 25.4 in. 7-day; 23.1 in. and 23.9 in.14-day; 23.9 in. and 23.1 in.21-day; 24.5 in. and 25.1 in.28-day; 25.6 in. and 26.8 in.
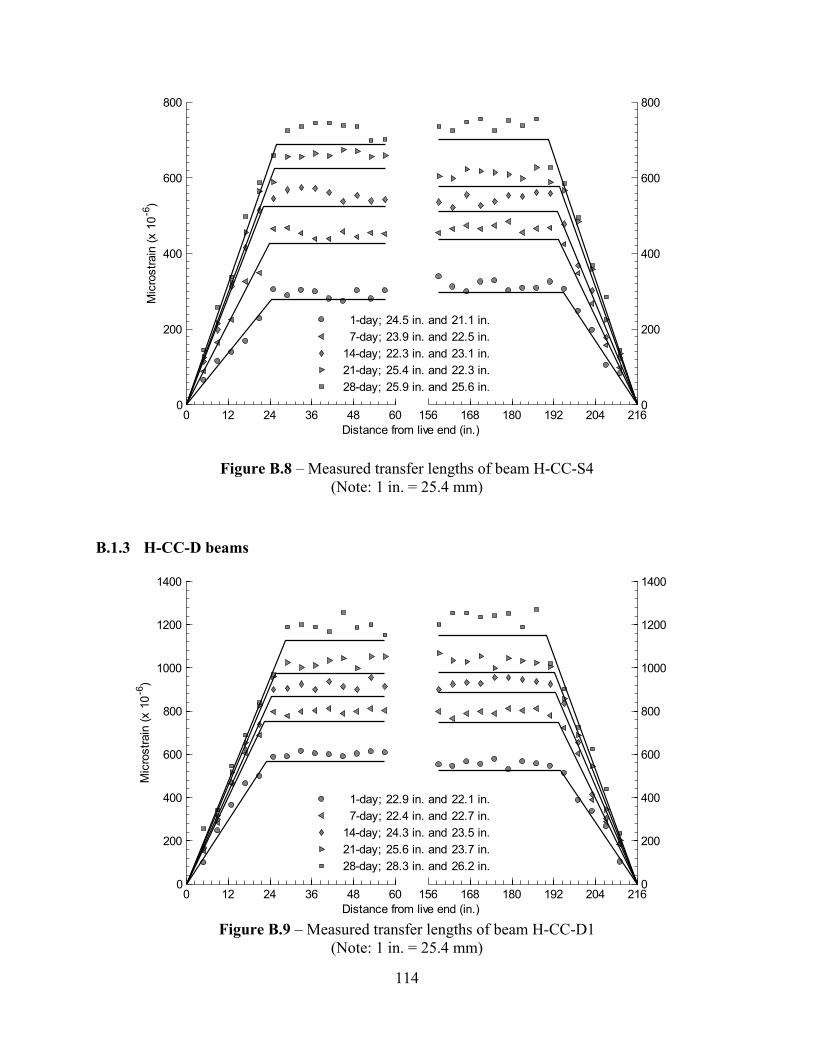
114
Figure B.8 – Measured transfer lengths of beam H-CC-S4 (Note: 1 in. = 25.4 mm)
B.1.3 H-CC-D beams
Figure B.9 – Measured transfer lengths of beam H-CC-D1
(Note: 1 in. = 25.4 mm)
0 12 24 36 48 600
200
400
600
800
Distance from live end (in.)
Mic
rost
rain
(x 1
0-6)
156 168 180 192 204 2160
200
400
600
800
1-day; 24.5 in. and 21.1 in. 7-day; 23.9 in. and 22.5 in.14-day; 22.3 in. and 23.1 in.21-day; 25.4 in. and 22.3 in.28-day; 25.9 in. and 25.6 in.
0 12 24 36 48 600
200
400
600
800
1000
1200
1400
Distance from live end (in.)
Mic
rost
rain
(x 1
0-6)
156 168 180 192 204 2160
200
400
600
800
1000
1200
1400
1-day; 22.9 in. and 22.1 in. 7-day; 22.4 in. and 22.7 in.14-day; 24.3 in. and 23.5 in.21-day; 25.6 in. and 23.7 in.28-day; 28.3 in. and 26.2 in.
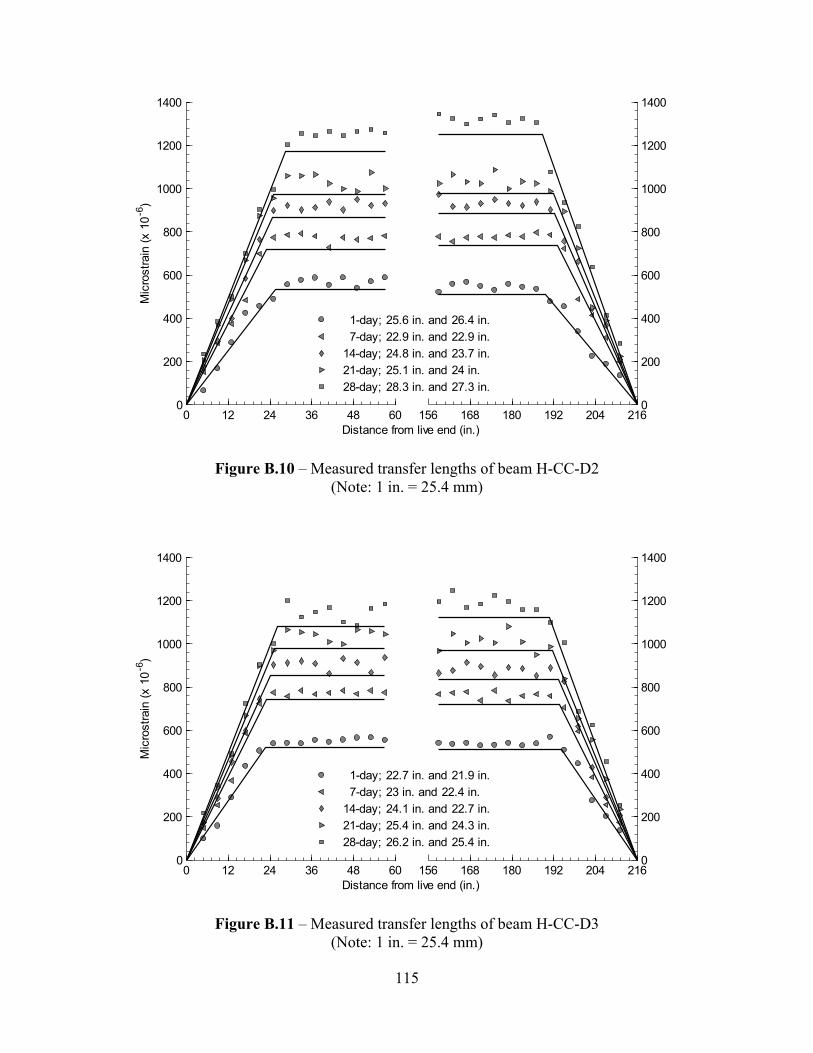
115
Figure B.10 – Measured transfer lengths of beam H-CC-D2 (Note: 1 in. = 25.4 mm)
Figure B.11 – Measured transfer lengths of beam H-CC-D3 (Note: 1 in. = 25.4 mm)
0 12 24 36 48 600
200
400
600
800
1000
1200
1400
Distance from live end (in.)
Mic
rost
rain
(x 1
0-6)
156 168 180 192 204 2160
200
400
600
800
1000
1200
1400
1-day; 25.6 in. and 26.4 in. 7-day; 22.9 in. and 22.9 in.14-day; 24.8 in. and 23.7 in.21-day; 25.1 in. and 24 in.28-day; 28.3 in. and 27.3 in.
0 12 24 36 48 600
200
400
600
800
1000
1200
1400
Distance from live end (in.)
Mic
rost
rain
(x 1
0-6)
156 168 180 192 204 2160
200
400
600
800
1000
1200
1400
1-day; 22.7 in. and 21.9 in. 7-day; 23 in. and 22.4 in.14-day; 24.1 in. and 22.7 in.21-day; 25.4 in. and 24.3 in.28-day; 26.2 in. and 25.4 in.
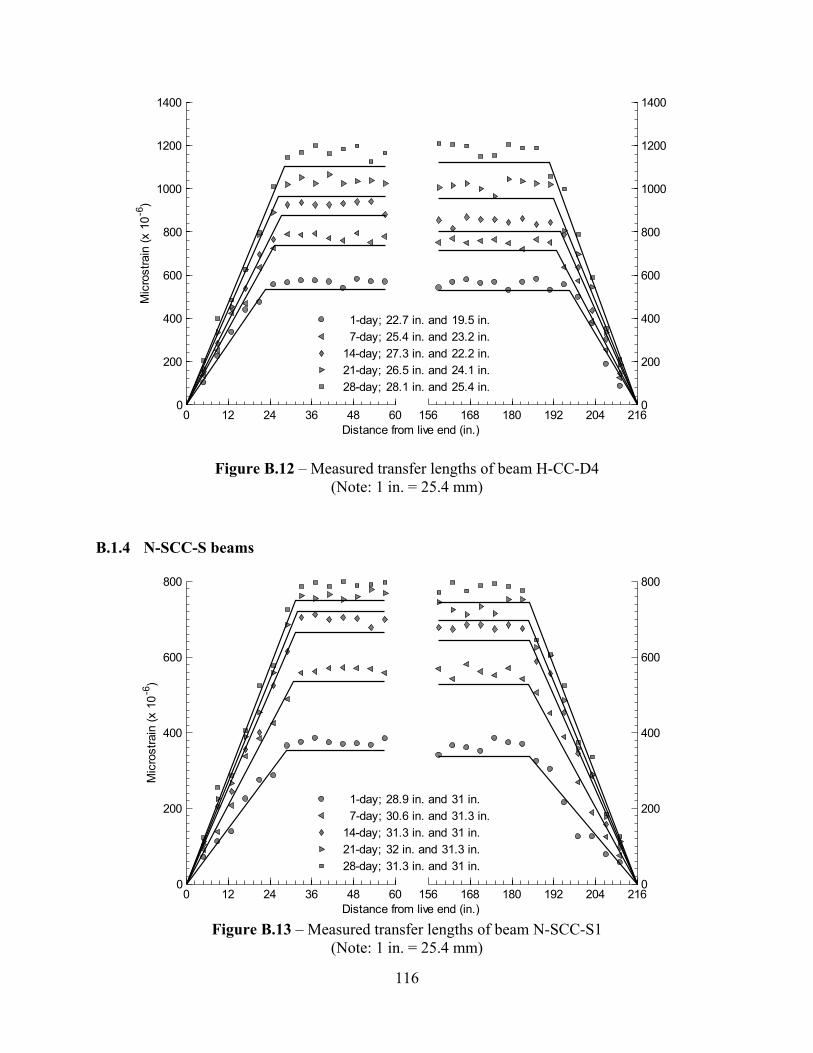
116
Figure B.12 – Measured transfer lengths of beam H-CC-D4 (Note: 1 in. = 25.4 mm)
B.1.4 N-SCC-S beams
Figure B.13 – Measured transfer lengths of beam N-SCC-S1
(Note: 1 in. = 25.4 mm)
0 12 24 36 48 600
200
400
600
800
1000
1200
1400
Distance from live end (in.)
Mic
rost
rain
(x 1
0-6)
156 168 180 192 204 2160
200
400
600
800
1000
1200
1400
1-day; 22.7 in. and 19.5 in. 7-day; 25.4 in. and 23.2 in.14-day; 27.3 in. and 22.2 in.21-day; 26.5 in. and 24.1 in.28-day; 28.1 in. and 25.4 in.
0 12 24 36 48 600
200
400
600
800
Distance from live end (in.)
Mic
rost
rain
(x 1
0-6)
156 168 180 192 204 2160
200
400
600
800
1-day; 28.9 in. and 31 in. 7-day; 30.6 in. and 31.3 in.14-day; 31.3 in. and 31 in.21-day; 32 in. and 31.3 in.28-day; 31.3 in. and 31 in.
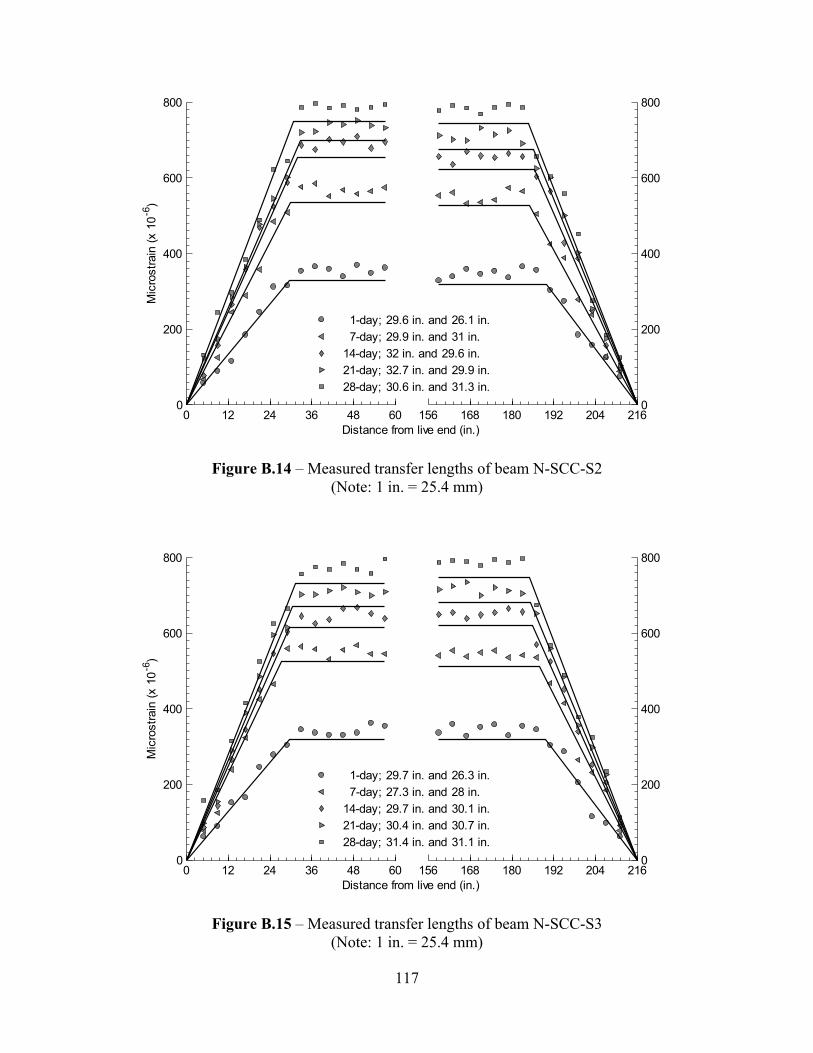
117
Figure B.14 – Measured transfer lengths of beam N-SCC-S2 (Note: 1 in. = 25.4 mm)
Figure B.15 – Measured transfer lengths of beam N-SCC-S3 (Note: 1 in. = 25.4 mm)
0 12 24 36 48 600
200
400
600
800
Distance from live end (in.)
Mic
rost
rain
(x 1
0-6)
156 168 180 192 204 2160
200
400
600
800
1-day; 29.6 in. and 26.1 in. 7-day; 29.9 in. and 31 in.14-day; 32 in. and 29.6 in.21-day; 32.7 in. and 29.9 in.28-day; 30.6 in. and 31.3 in.
0 12 24 36 48 600
200
400
600
800
Distance from live end (in.)
Mic
rost
rain
(x 1
0-6)
156 168 180 192 204 2160
200
400
600
800
1-day; 29.7 in. and 26.3 in. 7-day; 27.3 in. and 28 in.14-day; 29.7 in. and 30.1 in.21-day; 30.4 in. and 30.7 in.28-day; 31.4 in. and 31.1 in.
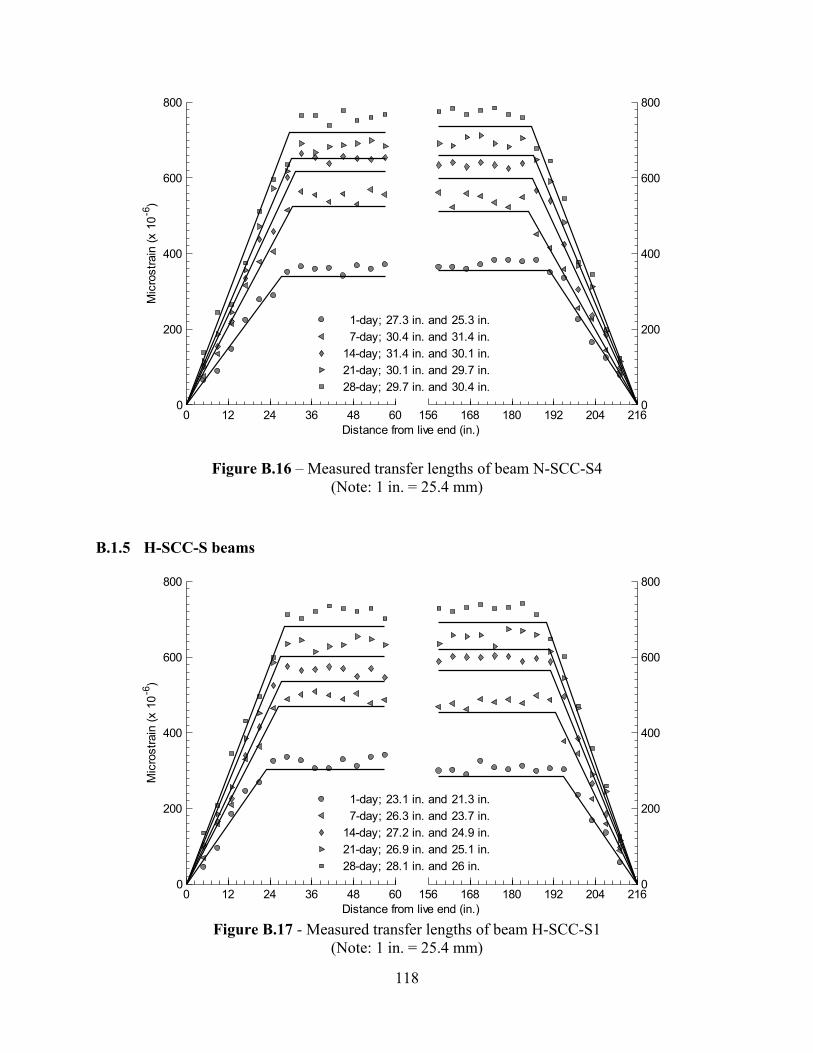
118
Figure B.16 – Measured transfer lengths of beam N-SCC-S4 (Note: 1 in. = 25.4 mm)
B.1.5 H-SCC-S beams
Figure B.17 - Measured transfer lengths of beam H-SCC-S1
(Note: 1 in. = 25.4 mm)
0 12 24 36 48 600
200
400
600
800
Distance from live end (in.)
Mic
rost
rain
(x 1
0-6)
156 168 180 192 204 2160
200
400
600
800
1-day; 27.3 in. and 25.3 in. 7-day; 30.4 in. and 31.4 in.14-day; 31.4 in. and 30.1 in.21-day; 30.1 in. and 29.7 in.28-day; 29.7 in. and 30.4 in.
0 12 24 36 48 600
200
400
600
800
Distance from live end (in.)
Mic
rost
rain
(x 1
0-6)
156 168 180 192 204 2160
200
400
600
800
1-day; 23.1 in. and 21.3 in. 7-day; 26.3 in. and 23.7 in.14-day; 27.2 in. and 24.9 in.21-day; 26.9 in. and 25.1 in.28-day; 28.1 in. and 26 in.
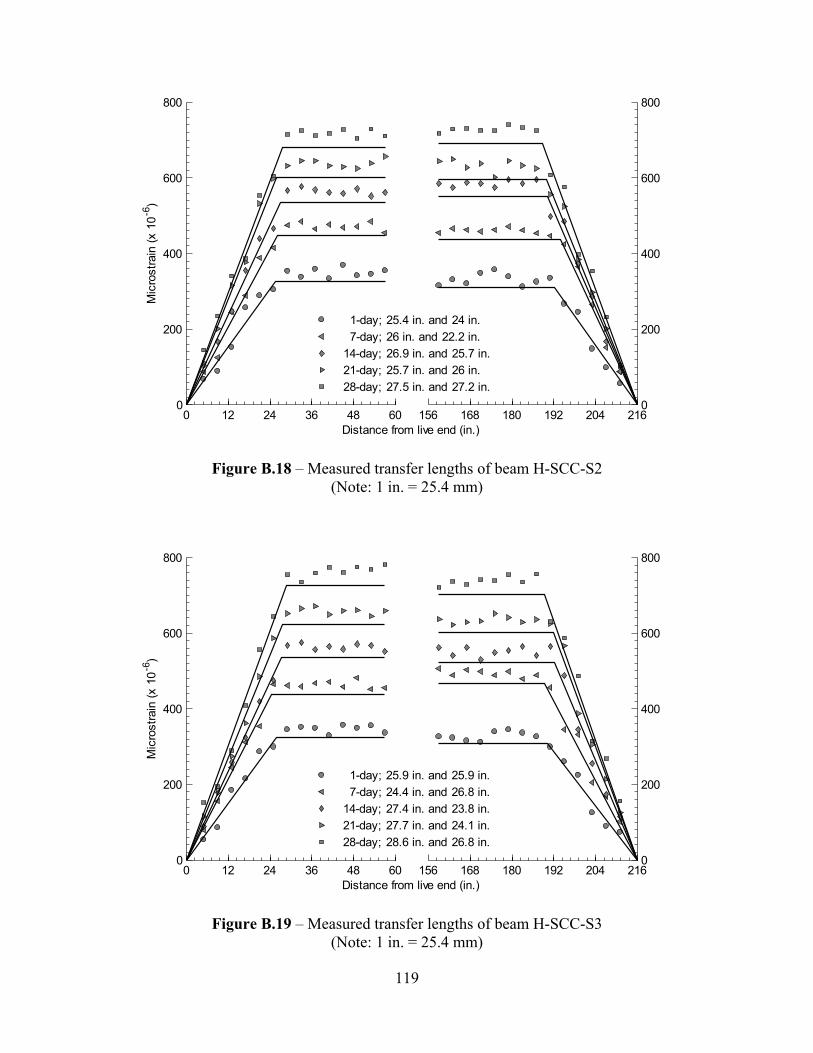
119
Figure B.18 – Measured transfer lengths of beam H-SCC-S2 (Note: 1 in. = 25.4 mm)
Figure B.19 – Measured transfer lengths of beam H-SCC-S3 (Note: 1 in. = 25.4 mm)
0 12 24 36 48 600
200
400
600
800
Distance from live end (in.)
Mic
rost
rain
(x 1
0-6)
156 168 180 192 204 2160
200
400
600
800
1-day; 25.4 in. and 24 in. 7-day; 26 in. and 22.2 in.14-day; 26.9 in. and 25.7 in.21-day; 25.7 in. and 26 in.28-day; 27.5 in. and 27.2 in.
0 12 24 36 48 600
200
400
600
800
Distance from live end (in.)
Mic
rost
rain
(x 1
0-6)
156 168 180 192 204 2160
200
400
600
800
1-day; 25.9 in. and 25.9 in. 7-day; 24.4 in. and 26.8 in.14-day; 27.4 in. and 23.8 in.21-day; 27.7 in. and 24.1 in.28-day; 28.6 in. and 26.8 in.
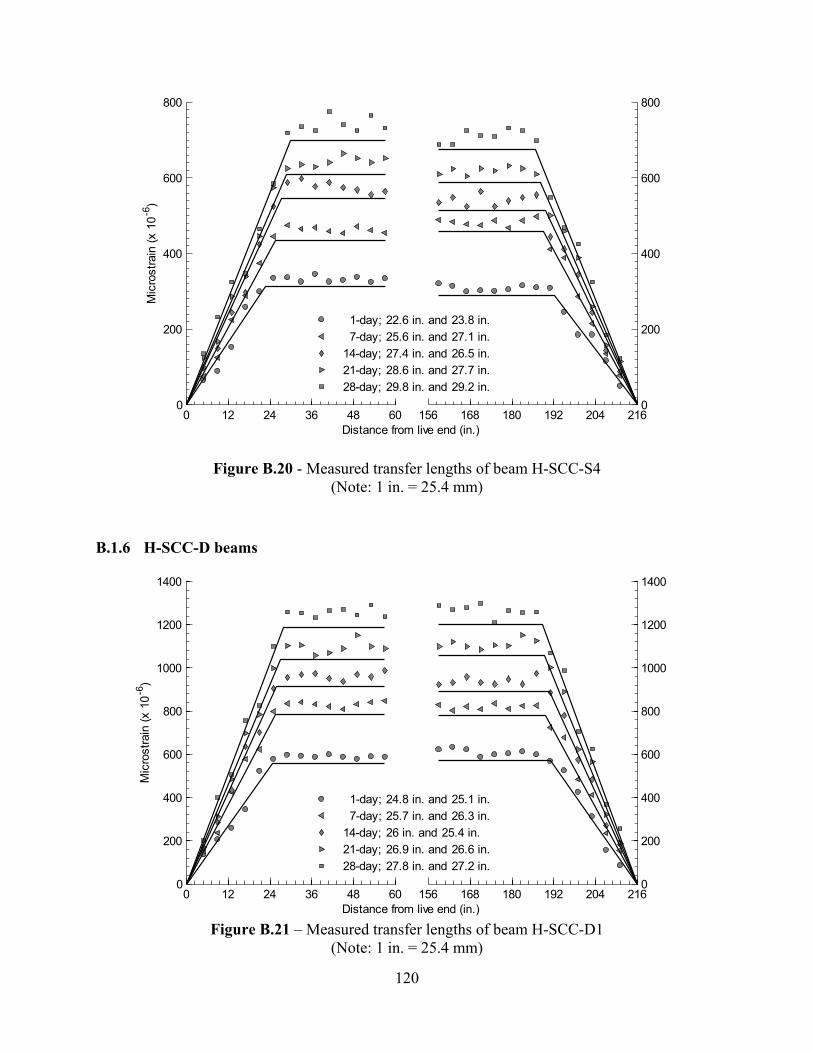
120
Figure B.20 - Measured transfer lengths of beam H-SCC-S4 (Note: 1 in. = 25.4 mm)
B.1.6 H-SCC-D beams
Figure B.21 – Measured transfer lengths of beam H-SCC-D1
(Note: 1 in. = 25.4 mm)
0 12 24 36 48 600
200
400
600
800
Distance from live end (in.)
Mic
rost
rain
(x 1
0-6)
156 168 180 192 204 2160
200
400
600
800
1-day; 22.6 in. and 23.8 in. 7-day; 25.6 in. and 27.1 in.14-day; 27.4 in. and 26.5 in.21-day; 28.6 in. and 27.7 in.28-day; 29.8 in. and 29.2 in.
0 12 24 36 48 600
200
400
600
800
1000
1200
1400
Distance from live end (in.)
Mic
rost
rain
(x 1
0-6)
156 168 180 192 204 2160
200
400
600
800
1000
1200
1400
1-day; 24.8 in. and 25.1 in. 7-day; 25.7 in. and 26.3 in.14-day; 26 in. and 25.4 in.21-day; 26.9 in. and 26.6 in.28-day; 27.8 in. and 27.2 in.
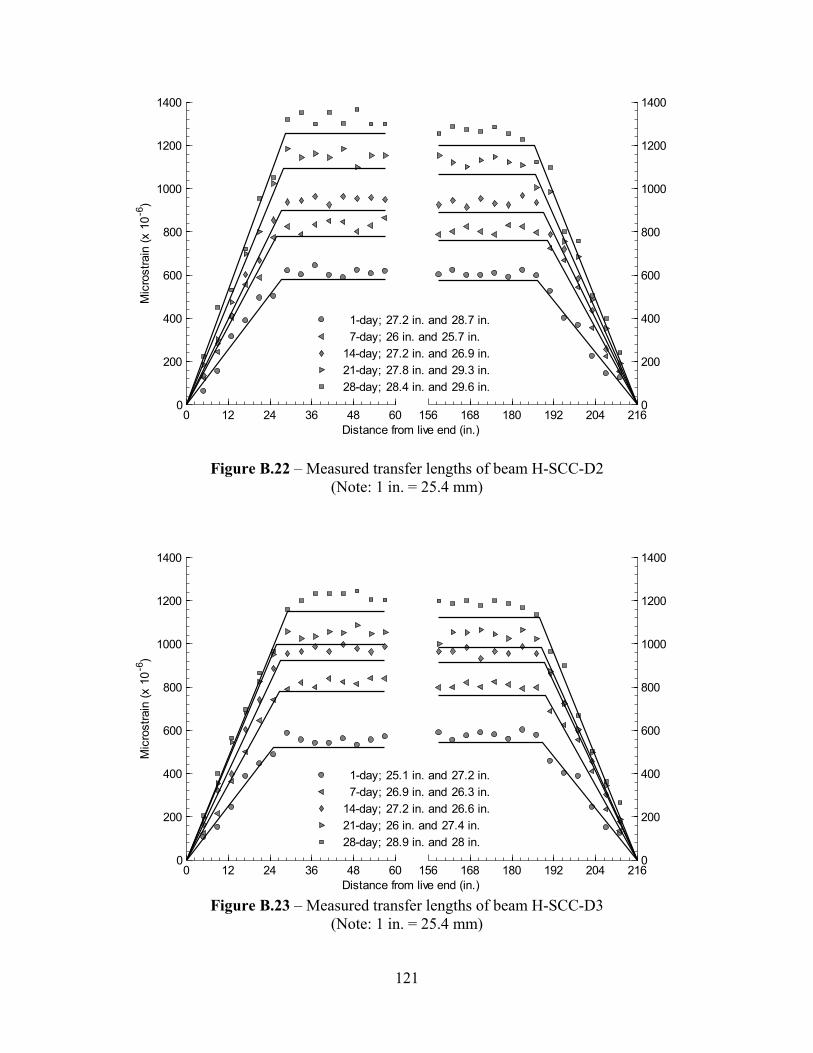
121
Figure B.22 – Measured transfer lengths of beam H-SCC-D2 (Note: 1 in. = 25.4 mm)
Figure B.23 – Measured transfer lengths of beam H-SCC-D3
(Note: 1 in. = 25.4 mm)
0 12 24 36 48 600
200
400
600
800
1000
1200
1400
Distance from live end (in.)
Mic
rost
rain
(x 1
0-6)
156 168 180 192 204 2160
200
400
600
800
1000
1200
1400
1-day; 27.2 in. and 28.7 in. 7-day; 26 in. and 25.7 in.14-day; 27.2 in. and 26.9 in.21-day; 27.8 in. and 29.3 in.28-day; 28.4 in. and 29.6 in.
0 12 24 36 48 600
200
400
600
800
1000
1200
1400
Distance from live end (in.)
Mic
rost
rain
(x 1
0-6)
156 168 180 192 204 2160
200
400
600
800
1000
1200
1400
1-day; 25.1 in. and 27.2 in. 7-day; 26.9 in. and 26.3 in.14-day; 27.2 in. and 26.6 in.21-day; 26 in. and 27.4 in.28-day; 28.9 in. and 28 in.
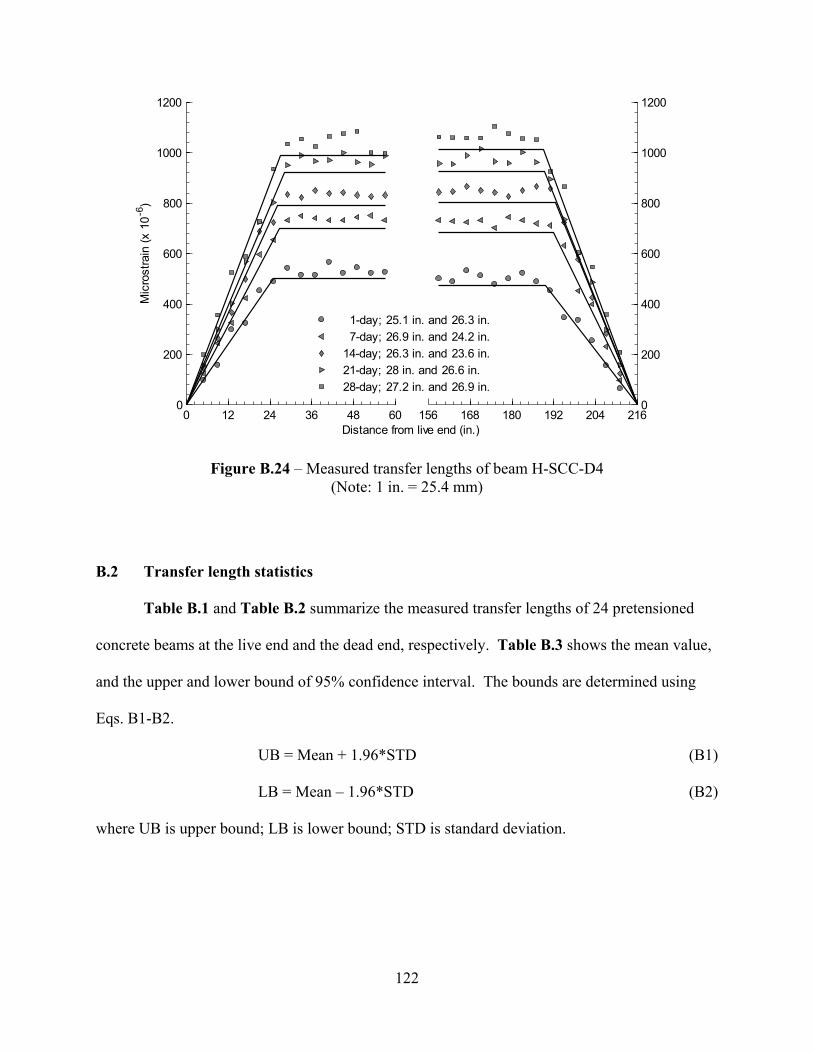
122
Figure B.24 – Measured transfer lengths of beam H-SCC-D4 (Note: 1 in. = 25.4 mm)
B.2 Transfer length statistics
Table B.1 and Table B.2 summarize the measured transfer lengths of 24 pretensioned
concrete beams at the live end and the dead end, respectively. Table B.3 shows the mean value,
and the upper and lower bound of 95% confidence interval. The bounds are determined using
Eqs. B1-B2.
UB = Mean + 1.96*STD (B1)
LB = Mean – 1.96*STD (B2)
where UB is upper bound; LB is lower bound; STD is standard deviation.
0 12 24 36 48 600
200
400
600
800
1000
1200
Distance from live end (in.)
Mic
rost
rain
(x 1
0-6)
156 168 180 192 204 2160
200
400
600
800
1000
1200
1-day; 25.1 in. and 26.3 in. 7-day; 26.9 in. and 24.2 in.14-day; 26.3 in. and 23.6 in.21-day; 28 in. and 26.6 in.28-day; 27.2 in. and 26.9 in.
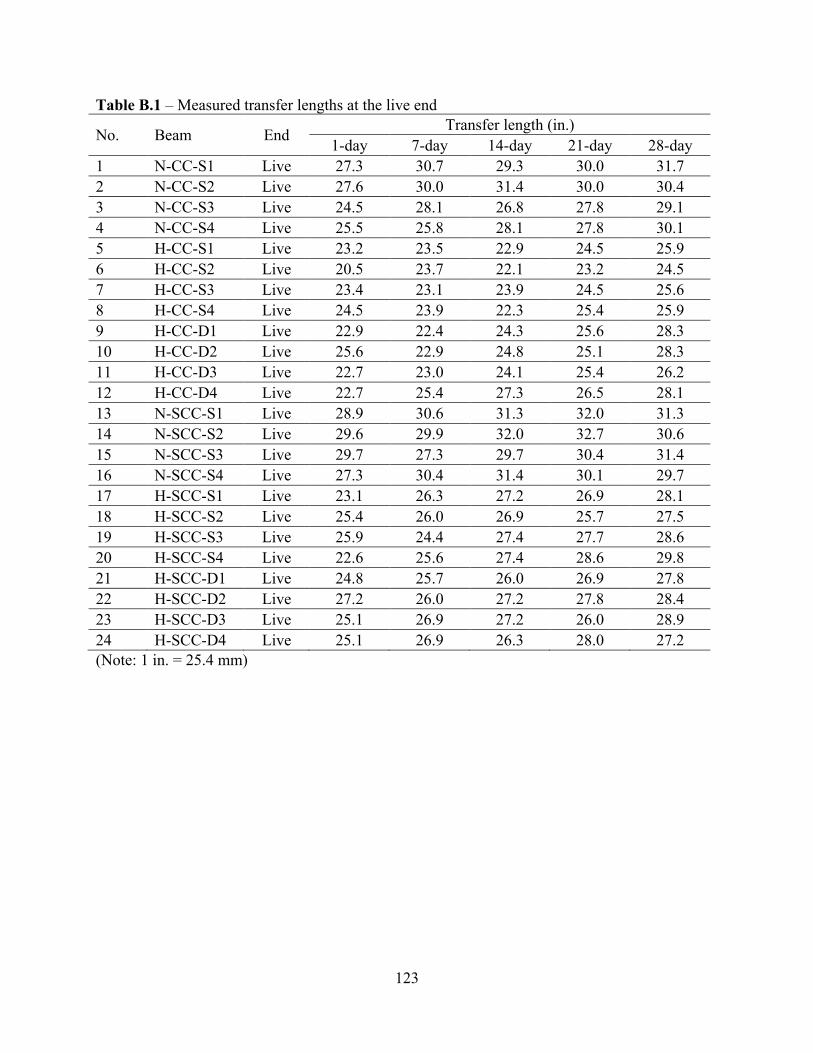
123
Table B.1 – Measured transfer lengths at the live end
No. Beam End Transfer length (in.) 1-day 7-day 14-day 21-day 28-day
1 N-CC-S1 Live 27.3 30.7 29.3 30.0 31.7 2 N-CC-S2 Live 27.6 30.0 31.4 30.0 30.4 3 N-CC-S3 Live 24.5 28.1 26.8 27.8 29.1 4 N-CC-S4 Live 25.5 25.8 28.1 27.8 30.1 5 H-CC-S1 Live 23.2 23.5 22.9 24.5 25.9 6 H-CC-S2 Live 20.5 23.7 22.1 23.2 24.5 7 H-CC-S3 Live 23.4 23.1 23.9 24.5 25.6 8 H-CC-S4 Live 24.5 23.9 22.3 25.4 25.9 9 H-CC-D1 Live 22.9 22.4 24.3 25.6 28.3 10 H-CC-D2 Live 25.6 22.9 24.8 25.1 28.3 11 H-CC-D3 Live 22.7 23.0 24.1 25.4 26.2 12 H-CC-D4 Live 22.7 25.4 27.3 26.5 28.1 13 N-SCC-S1 Live 28.9 30.6 31.3 32.0 31.3 14 N-SCC-S2 Live 29.6 29.9 32.0 32.7 30.6 15 N-SCC-S3 Live 29.7 27.3 29.7 30.4 31.4 16 N-SCC-S4 Live 27.3 30.4 31.4 30.1 29.7 17 H-SCC-S1 Live 23.1 26.3 27.2 26.9 28.1 18 H-SCC-S2 Live 25.4 26.0 26.9 25.7 27.5 19 H-SCC-S3 Live 25.9 24.4 27.4 27.7 28.6 20 H-SCC-S4 Live 22.6 25.6 27.4 28.6 29.8 21 H-SCC-D1 Live 24.8 25.7 26.0 26.9 27.8 22 H-SCC-D2 Live 27.2 26.0 27.2 27.8 28.4 23 H-SCC-D3 Live 25.1 26.9 27.2 26.0 28.9 24 H-SCC-D4 Live 25.1 26.9 26.3 28.0 27.2 (Note: 1 in. = 25.4 mm)
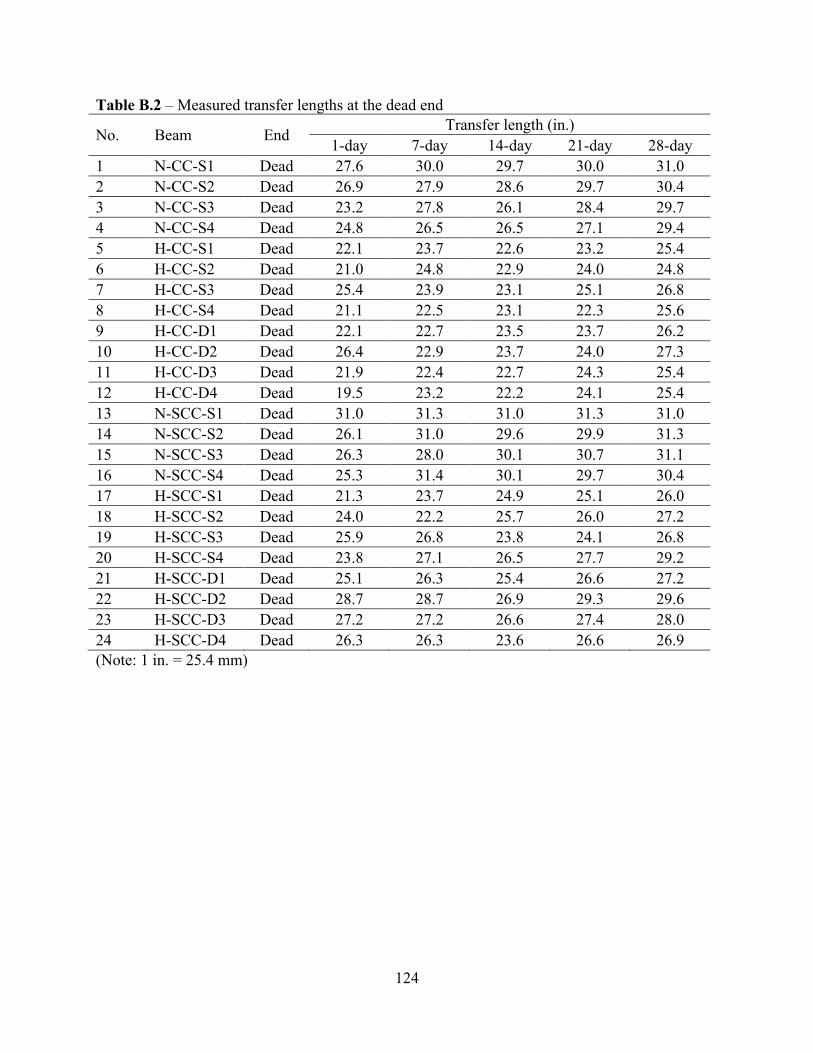
124
Table B.2 – Measured transfer lengths at the dead end
No. Beam End Transfer length (in.) 1-day 7-day 14-day 21-day 28-day
1 N-CC-S1 Dead 27.6 30.0 29.7 30.0 31.0 2 N-CC-S2 Dead 26.9 27.9 28.6 29.7 30.4 3 N-CC-S3 Dead 23.2 27.8 26.1 28.4 29.7 4 N-CC-S4 Dead 24.8 26.5 26.5 27.1 29.4 5 H-CC-S1 Dead 22.1 23.7 22.6 23.2 25.4 6 H-CC-S2 Dead 21.0 24.8 22.9 24.0 24.8 7 H-CC-S3 Dead 25.4 23.9 23.1 25.1 26.8 8 H-CC-S4 Dead 21.1 22.5 23.1 22.3 25.6 9 H-CC-D1 Dead 22.1 22.7 23.5 23.7 26.2 10 H-CC-D2 Dead 26.4 22.9 23.7 24.0 27.3 11 H-CC-D3 Dead 21.9 22.4 22.7 24.3 25.4 12 H-CC-D4 Dead 19.5 23.2 22.2 24.1 25.4 13 N-SCC-S1 Dead 31.0 31.3 31.0 31.3 31.0 14 N-SCC-S2 Dead 26.1 31.0 29.6 29.9 31.3 15 N-SCC-S3 Dead 26.3 28.0 30.1 30.7 31.1 16 N-SCC-S4 Dead 25.3 31.4 30.1 29.7 30.4 17 H-SCC-S1 Dead 21.3 23.7 24.9 25.1 26.0 18 H-SCC-S2 Dead 24.0 22.2 25.7 26.0 27.2 19 H-SCC-S3 Dead 25.9 26.8 23.8 24.1 26.8 20 H-SCC-S4 Dead 23.8 27.1 26.5 27.7 29.2 21 H-SCC-D1 Dead 25.1 26.3 25.4 26.6 27.2 22 H-SCC-D2 Dead 28.7 28.7 26.9 29.3 29.6 23 H-SCC-D3 Dead 27.2 27.2 26.6 27.4 28.0 24 H-SCC-D4 Dead 26.3 26.3 23.6 26.6 26.9 (Note: 1 in. = 25.4 mm)
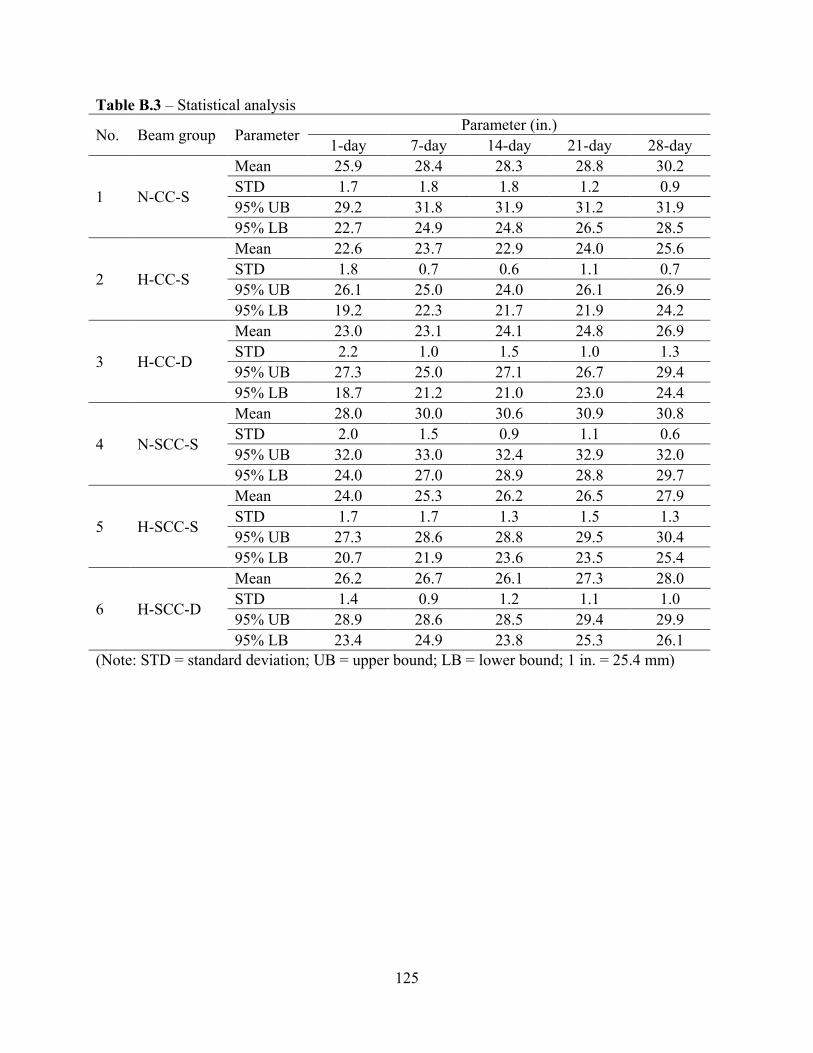
125
Table B.3 – Statistical analysis
No. Beam group Parameter Parameter (in.) 1-day 7-day 14-day 21-day 28-day
1 N-CC-S
Mean 25.9 28.4 28.3 28.8 30.2 STD 1.7 1.8 1.8 1.2 0.9 95% UB 29.2 31.8 31.9 31.2 31.9 95% LB 22.7 24.9 24.8 26.5 28.5
2 H-CC-S
Mean 22.6 23.7 22.9 24.0 25.6 STD 1.8 0.7 0.6 1.1 0.7 95% UB 26.1 25.0 24.0 26.1 26.9 95% LB 19.2 22.3 21.7 21.9 24.2
3 H-CC-D
Mean 23.0 23.1 24.1 24.8 26.9 STD 2.2 1.0 1.5 1.0 1.3 95% UB 27.3 25.0 27.1 26.7 29.4 95% LB 18.7 21.2 21.0 23.0 24.4
4 N-SCC-S
Mean 28.0 30.0 30.6 30.9 30.8 STD 2.0 1.5 0.9 1.1 0.6 95% UB 32.0 33.0 32.4 32.9 32.0 95% LB 24.0 27.0 28.9 28.8 29.7
5 H-SCC-S
Mean 24.0 25.3 26.2 26.5 27.9 STD 1.7 1.7 1.3 1.5 1.3 95% UB 27.3 28.6 28.8 29.5 30.4 95% LB 20.7 21.9 23.6 23.5 25.4
6 H-SCC-D
Mean 26.2 26.7 26.1 27.3 28.0 STD 1.4 0.9 1.2 1.1 1.0 95% UB 28.9 28.6 28.5 29.4 29.9 95% LB 23.4 24.9 23.8 25.3 26.1
(Note: STD = standard deviation; UB = upper bound; LB = lower bound; 1 in. = 25.4 mm)
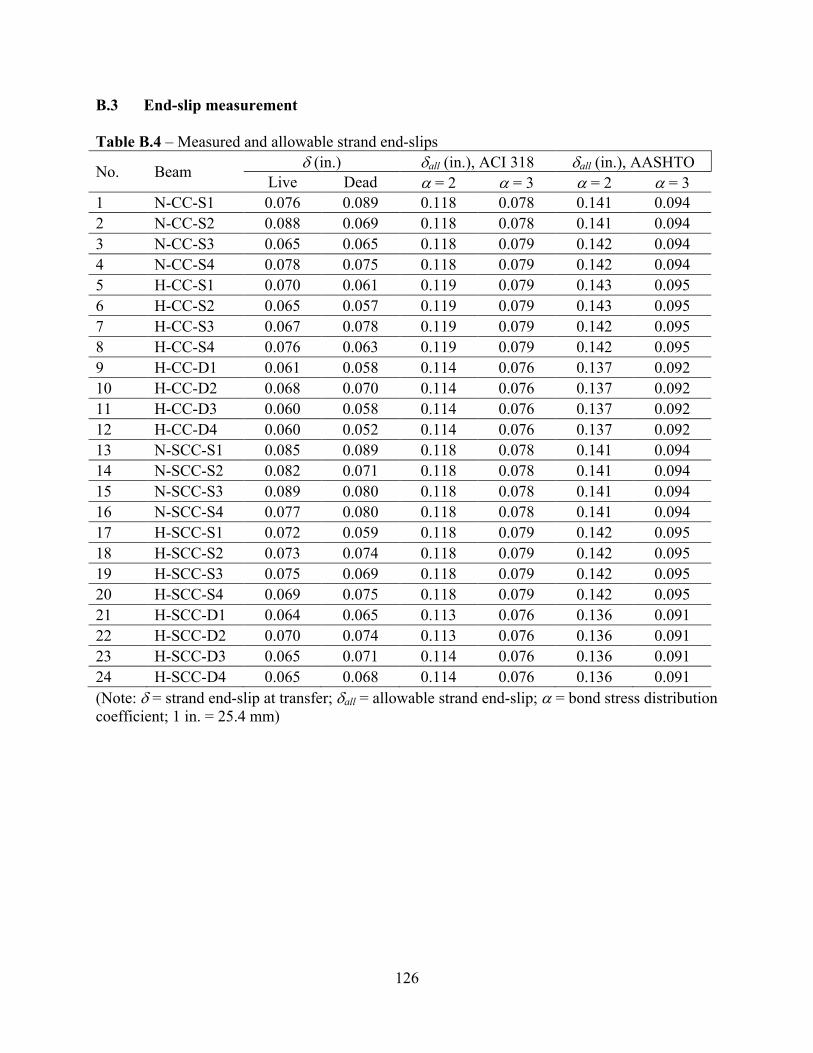
126
B.3 End-slip measurement
Table B.4 – Measured and allowable strand end-slips
No. Beam δ (in.) δall (in.), ACI 318 δall (in.), AASHTO Live Dead α = 2 α = 3 α = 2 α = 3
1 N-CC-S1 0.076 0.089 0.118 0.078 0.141 0.094 2 N-CC-S2 0.088 0.069 0.118 0.078 0.141 0.094 3 N-CC-S3 0.065 0.065 0.118 0.079 0.142 0.094 4 N-CC-S4 0.078 0.075 0.118 0.079 0.142 0.094 5 H-CC-S1 0.070 0.061 0.119 0.079 0.143 0.095 6 H-CC-S2 0.065 0.057 0.119 0.079 0.143 0.095 7 H-CC-S3 0.067 0.078 0.119 0.079 0.142 0.095 8 H-CC-S4 0.076 0.063 0.119 0.079 0.142 0.095 9 H-CC-D1 0.061 0.058 0.114 0.076 0.137 0.092 10 H-CC-D2 0.068 0.070 0.114 0.076 0.137 0.092 11 H-CC-D3 0.060 0.058 0.114 0.076 0.137 0.092 12 H-CC-D4 0.060 0.052 0.114 0.076 0.137 0.092 13 N-SCC-S1 0.085 0.089 0.118 0.078 0.141 0.094 14 N-SCC-S2 0.082 0.071 0.118 0.078 0.141 0.094 15 N-SCC-S3 0.089 0.080 0.118 0.078 0.141 0.094 16 N-SCC-S4 0.077 0.080 0.118 0.078 0.141 0.094 17 H-SCC-S1 0.072 0.059 0.118 0.079 0.142 0.095 18 H-SCC-S2 0.073 0.074 0.118 0.079 0.142 0.095 19 H-SCC-S3 0.075 0.069 0.118 0.079 0.142 0.095 20 H-SCC-S4 0.069 0.075 0.118 0.079 0.142 0.095 21 H-SCC-D1 0.064 0.065 0.113 0.076 0.136 0.091 22 H-SCC-D2 0.070 0.074 0.113 0.076 0.136 0.091 23 H-SCC-D3 0.065 0.071 0.114 0.076 0.136 0.091 24 H-SCC-D4 0.065 0.068 0.114 0.076 0.136 0.091 (Note: δ = strand end-slip at transfer; δall = allowable strand end-slip; α = bond stress distribution coefficient; 1 in. = 25.4 mm)

127
APPENDIX C : DEVELOPMENT LENGTH DATA
C.1 Bending test results
C.1.1 N-SCC-S beams
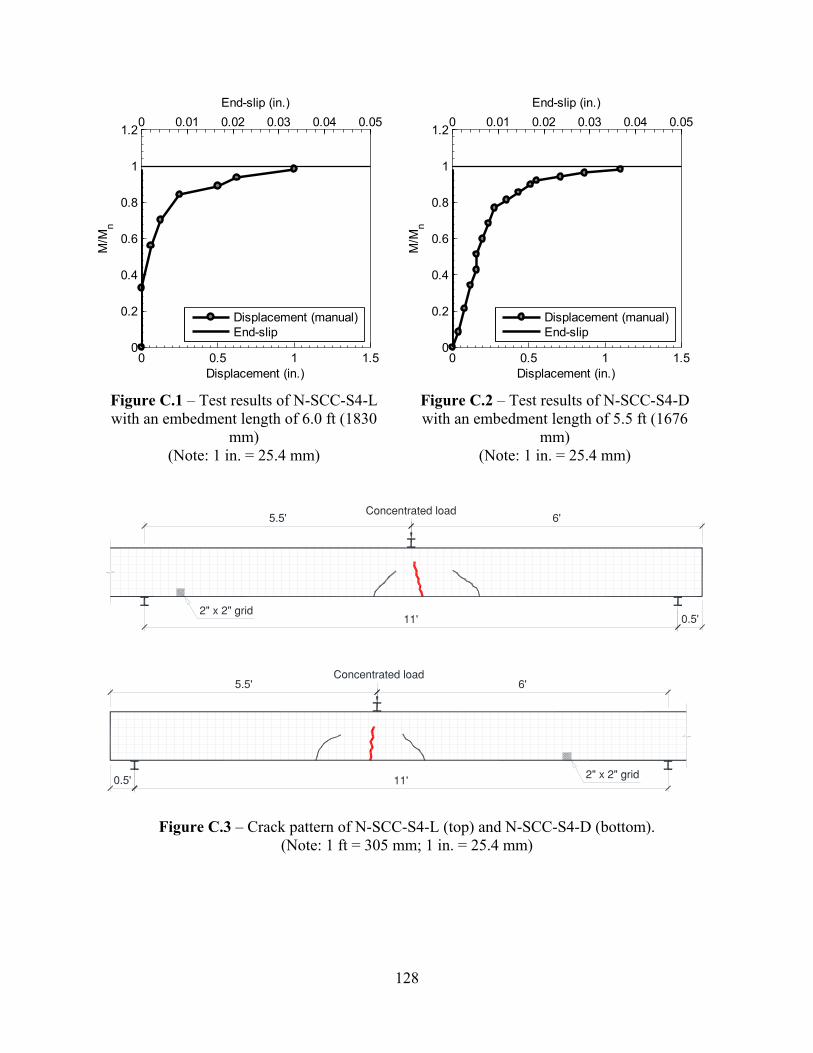
128
Figure C.1 – Test results of N-SCC-S4-L with an embedment length of 6.0 ft (1830
mm) (Note: 1 in. = 25.4 mm)
Figure C.2 – Test results of N-SCC-S4-D with an embedment length of 5.5 ft (1676
mm) (Note: 1 in. = 25.4 mm)
Figure C.3 – Crack pattern of N-SCC-S4-L (top) and N-SCC-S4-D (bottom). (Note: 1 ft = 305 mm; 1 in. = 25.4 mm)
0 0.5 1 1.50
0.2
0.4
0.6
0.8
1
1.2
Displacement (in.)
M/M
n
0 0.01 0.02 0.03 0.04 0.05End-slip (in.)
Displacement (manual)End-slip
0 0.5 1 1.50
0.2
0.4
0.6
0.8
1
1.2
Displacement (in.)
M/M
n
0 0.01 0.02 0.03 0.04 0.05End-slip (in.)
Displacement (manual)End-slip
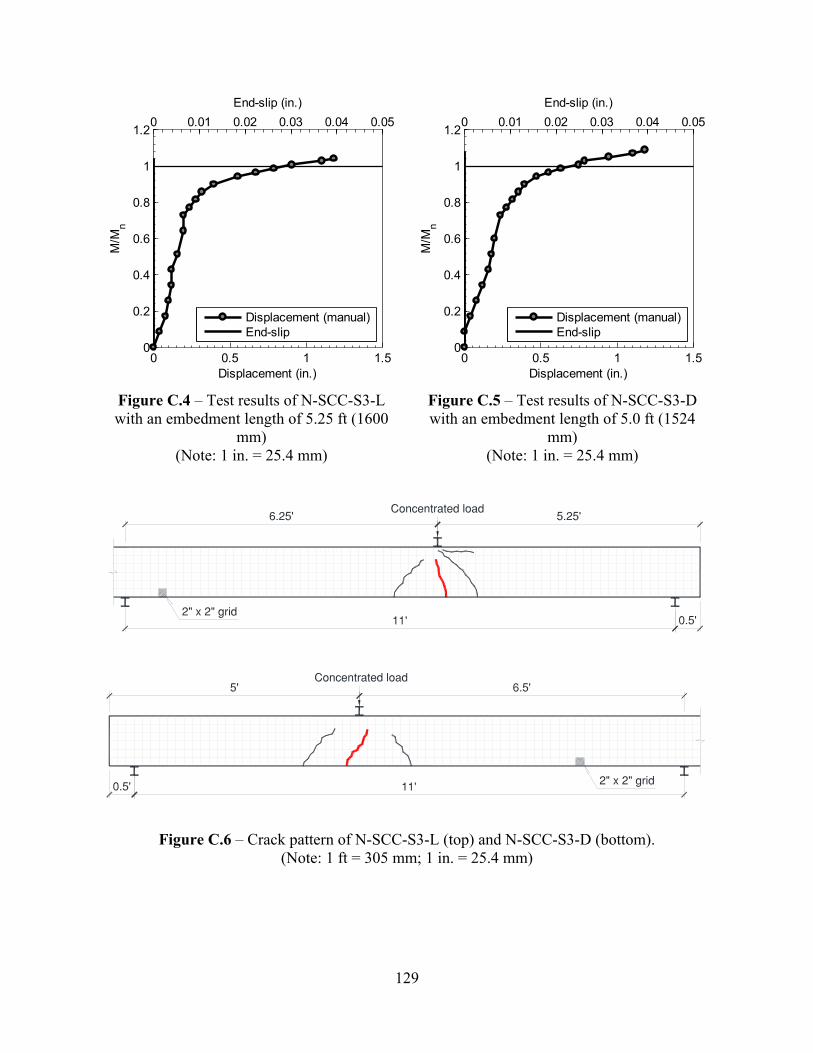
129
Figure C.4 – Test results of N-SCC-S3-L with an embedment length of 5.25 ft (1600
mm) (Note: 1 in. = 25.4 mm)
Figure C.5 – Test results of N-SCC-S3-D with an embedment length of 5.0 ft (1524
mm) (Note: 1 in. = 25.4 mm)
Figure C.6 – Crack pattern of N-SCC-S3-L (top) and N-SCC-S3-D (bottom). (Note: 1 ft = 305 mm; 1 in. = 25.4 mm)
0 0.5 1 1.50
0.2
0.4
0.6
0.8
1
1.2
Displacement (in.)
M/M
n
0 0.01 0.02 0.03 0.04 0.05End-slip (in.)
Displacement (manual)End-slip
0 0.5 1 1.50
0.2
0.4
0.6
0.8
1
1.2
Displacement (in.)
M/M
n
0 0.01 0.02 0.03 0.04 0.05End-slip (in.)
Displacement (manual)End-slip
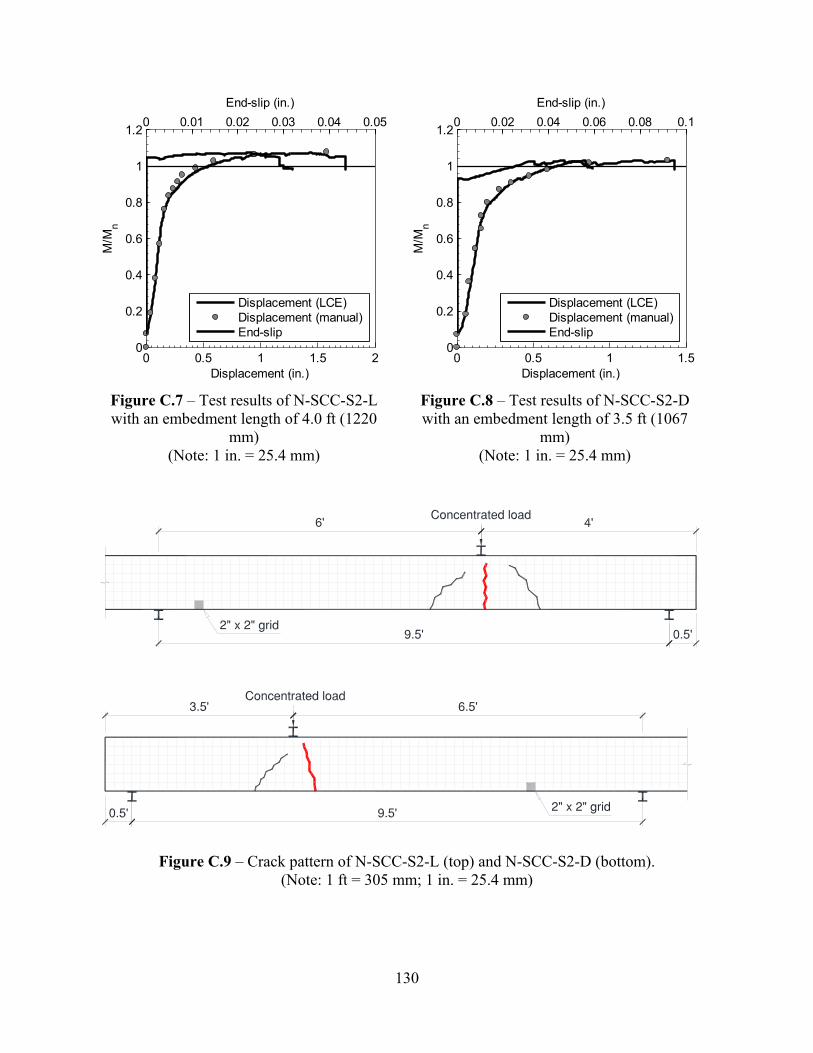
130
Figure C.7 – Test results of N-SCC-S2-L with an embedment length of 4.0 ft (1220
mm) (Note: 1 in. = 25.4 mm)
Figure C.8 – Test results of N-SCC-S2-D with an embedment length of 3.5 ft (1067
mm) (Note: 1 in. = 25.4 mm)
Figure C.9 – Crack pattern of N-SCC-S2-L (top) and N-SCC-S2-D (bottom). (Note: 1 ft = 305 mm; 1 in. = 25.4 mm)
0 0.5 1 1.5 20
0.2
0.4
0.6
0.8
1
1.2
Displacement (in.)
M/M
n
0 0.01 0.02 0.03 0.04 0.05End-slip (in.)
Displacement (LCE)Displacement (manual)End-slip
0 0.5 1 1.50
0.2
0.4
0.6
0.8
1
1.2
Displacement (in.)
M/M
n
0 0.02 0.04 0.06 0.08 0.1End-slip (in.)
Displacement (LCE)Displacement (manual)End-slip
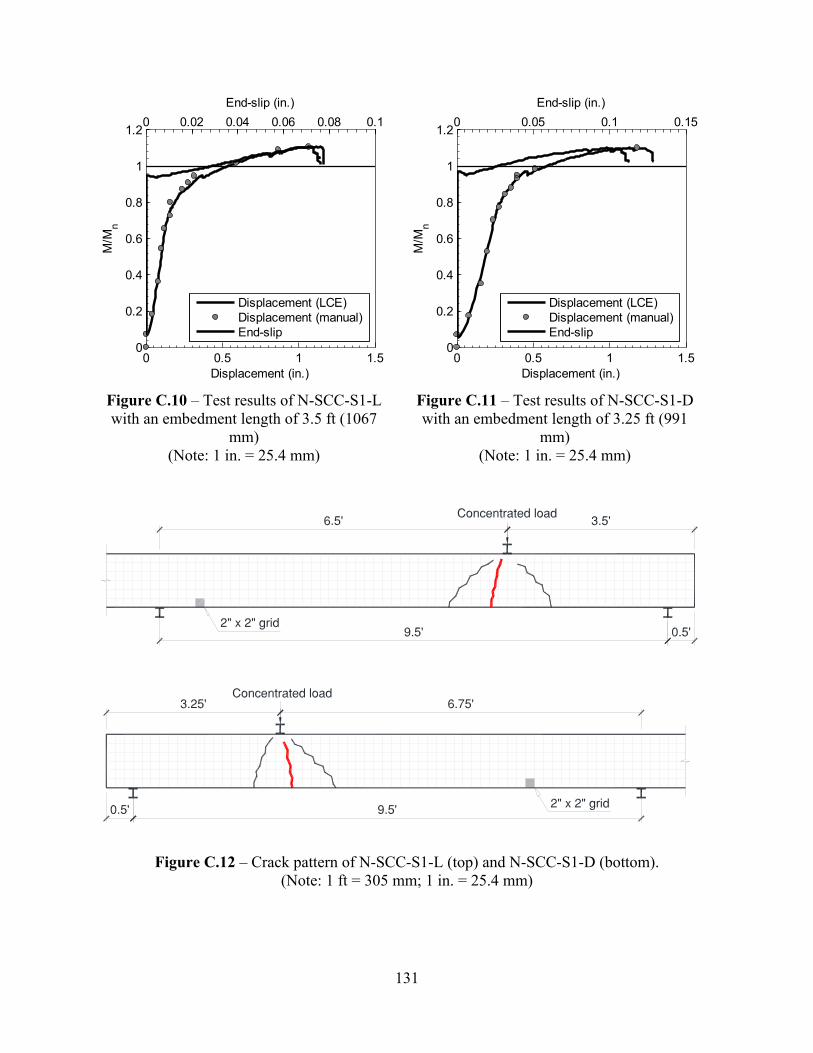
131
Figure C.10 – Test results of N-SCC-S1-L with an embedment length of 3.5 ft (1067
mm) (Note: 1 in. = 25.4 mm)
Figure C.11 – Test results of N-SCC-S1-D with an embedment length of 3.25 ft (991
mm) (Note: 1 in. = 25.4 mm)
Figure C.12 – Crack pattern of N-SCC-S1-L (top) and N-SCC-S1-D (bottom). (Note: 1 ft = 305 mm; 1 in. = 25.4 mm)
0 0.5 1 1.50
0.2
0.4
0.6
0.8
1
1.2
Displacement (in.)
M/M
n
0 0.02 0.04 0.06 0.08 0.1End-slip (in.)
Displacement (LCE)Displacement (manual)End-slip
0 0.5 1 1.50
0.2
0.4
0.6
0.8
1
1.2
Displacement (in.)
M/M
n
0 0.05 0.1 0.15End-slip (in.)
Displacement (LCE)Displacement (manual)End-slip
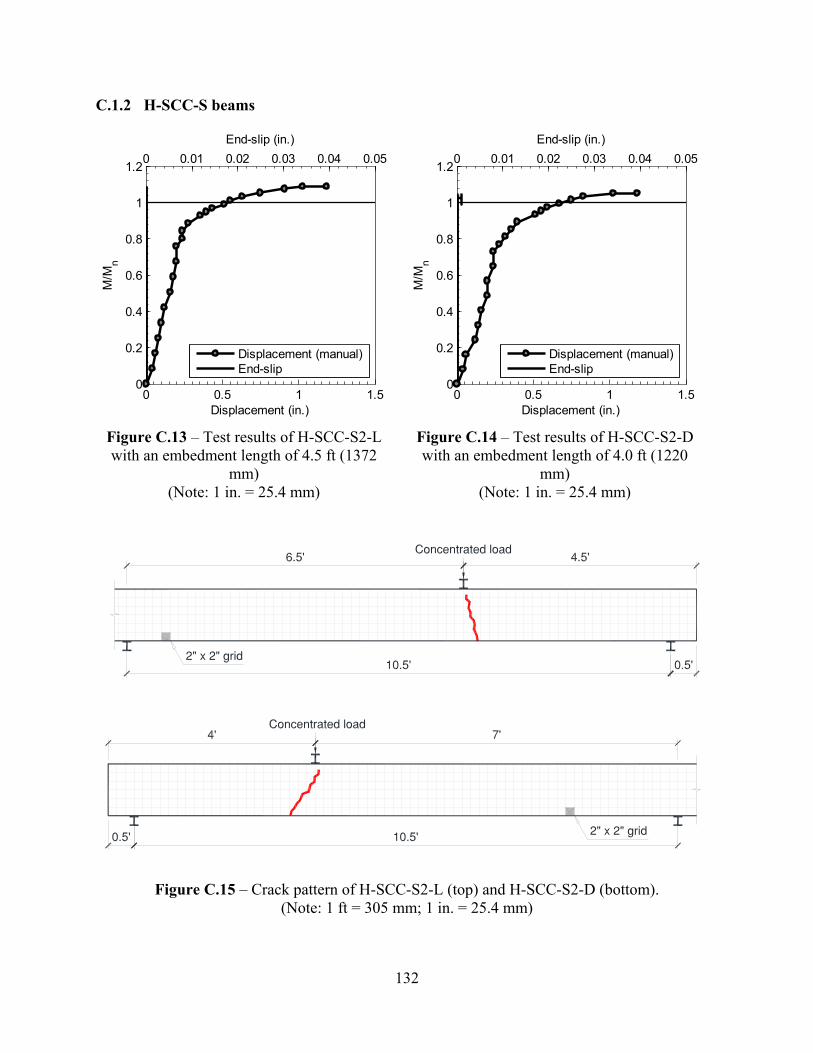
132
C.1.2 H-SCC-S beams
Figure C.13 – Test results of H-SCC-S2-L with an embedment length of 4.5 ft (1372
mm) (Note: 1 in. = 25.4 mm)
Figure C.14 – Test results of H-SCC-S2-D with an embedment length of 4.0 ft (1220
mm) (Note: 1 in. = 25.4 mm)
Figure C.15 – Crack pattern of H-SCC-S2-L (top) and H-SCC-S2-D (bottom). (Note: 1 ft = 305 mm; 1 in. = 25.4 mm)
0 0.5 1 1.50
0.2
0.4
0.6
0.8
1
1.2
Displacement (in.)
M/M
n
0 0.01 0.02 0.03 0.04 0.05End-slip (in.)
Displacement (manual)End-slip
0 0.5 1 1.50
0.2
0.4
0.6
0.8
1
1.2
Displacement (in.)M
/Mn
0 0.01 0.02 0.03 0.04 0.05End-slip (in.)
Displacement (manual)End-slip
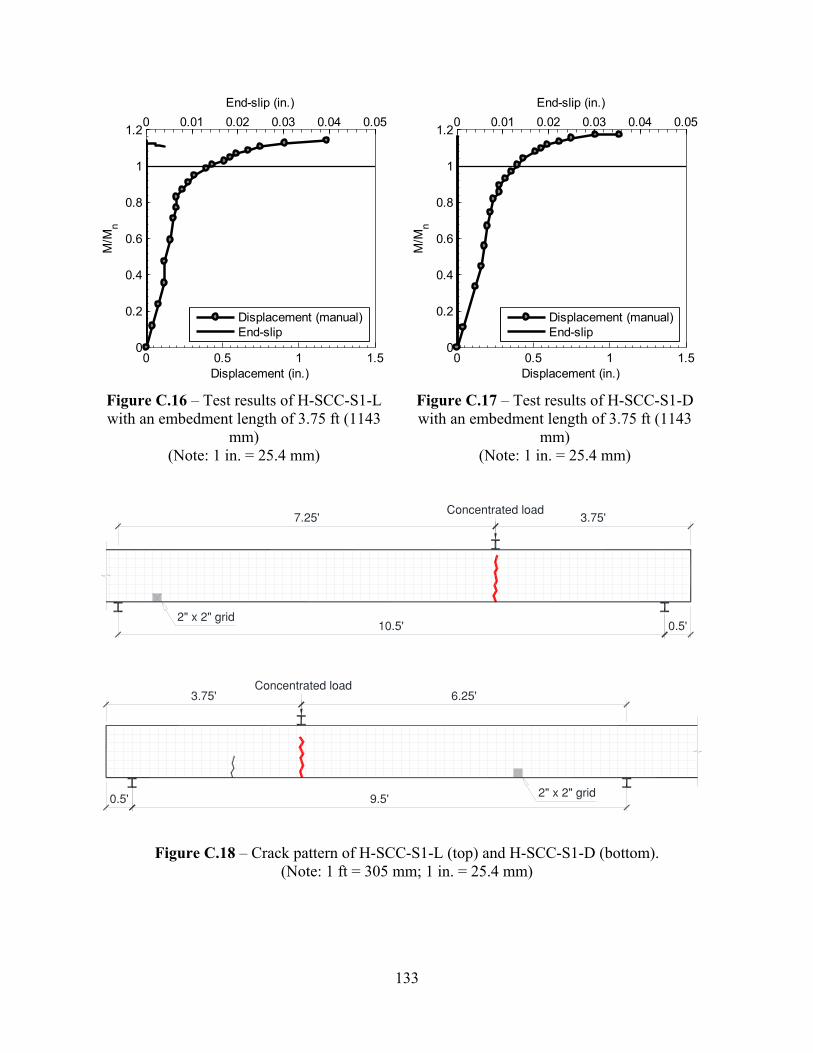
133
Figure C.16 – Test results of H-SCC-S1-L with an embedment length of 3.75 ft (1143
mm) (Note: 1 in. = 25.4 mm)
Figure C.17 – Test results of H-SCC-S1-D with an embedment length of 3.75 ft (1143
mm) (Note: 1 in. = 25.4 mm)
Figure C.18 – Crack pattern of H-SCC-S1-L (top) and H-SCC-S1-D (bottom). (Note: 1 ft = 305 mm; 1 in. = 25.4 mm)
0 0.5 1 1.50
0.2
0.4
0.6
0.8
1
1.2
Displacement (in.)
M/M
n
0 0.01 0.02 0.03 0.04 0.05End-slip (in.)
Displacement (manual)End-slip
0 0.5 1 1.50
0.2
0.4
0.6
0.8
1
1.2
Displacement (in.)
M/M
n
0 0.01 0.02 0.03 0.04 0.05End-slip (in.)
Displacement (manual)End-slip
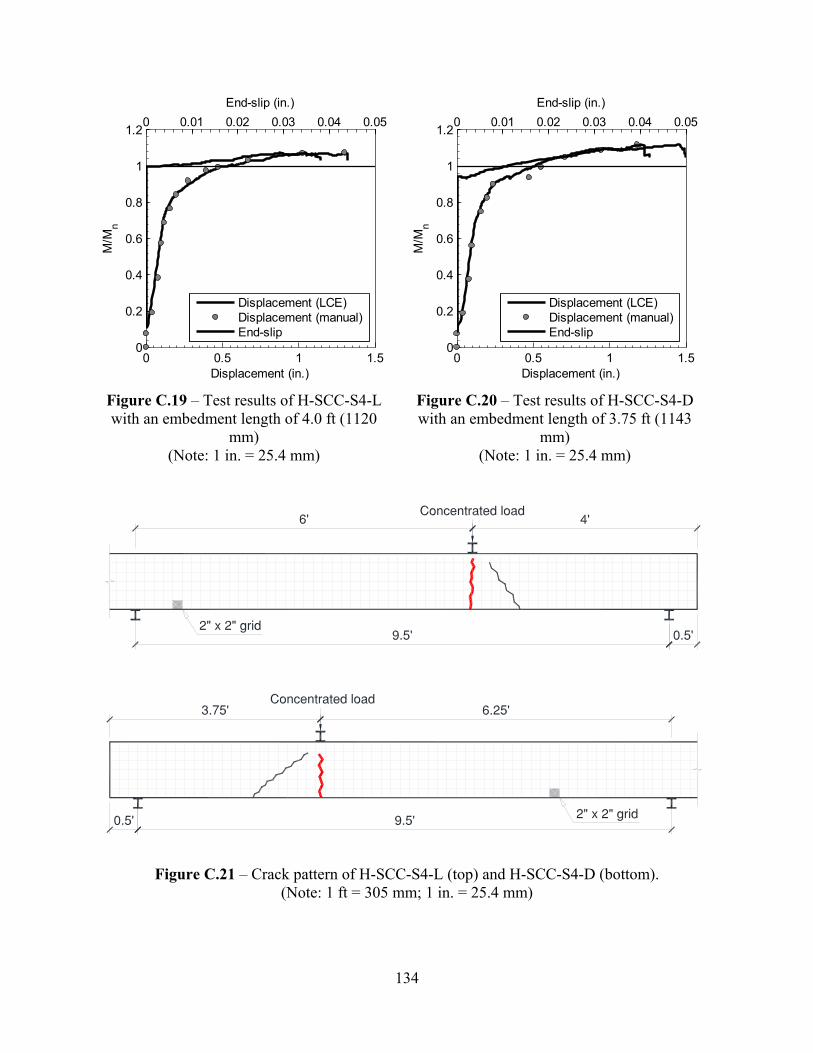
134
Figure C.19 – Test results of H-SCC-S4-L with an embedment length of 4.0 ft (1120
mm) (Note: 1 in. = 25.4 mm)
Figure C.20 – Test results of H-SCC-S4-D with an embedment length of 3.75 ft (1143
mm) (Note: 1 in. = 25.4 mm)
Figure C.21 – Crack pattern of H-SCC-S4-L (top) and H-SCC-S4-D (bottom). (Note: 1 ft = 305 mm; 1 in. = 25.4 mm)
0 0.5 1 1.50
0.2
0.4
0.6
0.8
1
1.2
Displacement (in.)
M/M
n
0 0.01 0.02 0.03 0.04 0.05End-slip (in.)
Displacement (LCE)Displacement (manual)End-slip
0 0.5 1 1.50
0.2
0.4
0.6
0.8
1
1.2
Displacement (in.)
M/M
n
0 0.01 0.02 0.03 0.04 0.05End-slip (in.)
Displacement (LCE)Displacement (manual)End-slip
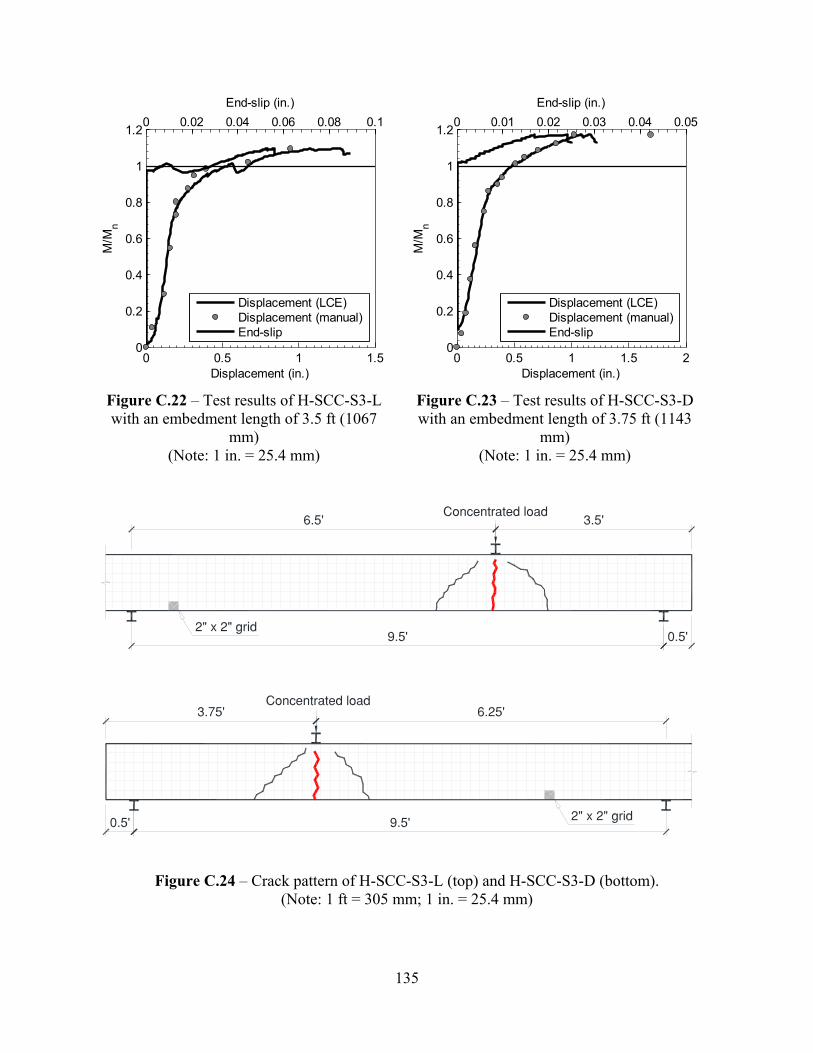
135
Figure C.22 – Test results of H-SCC-S3-L with an embedment length of 3.5 ft (1067
mm) (Note: 1 in. = 25.4 mm)
Figure C.23 – Test results of H-SCC-S3-D with an embedment length of 3.75 ft (1143
mm) (Note: 1 in. = 25.4 mm)
Figure C.24 – Crack pattern of H-SCC-S3-L (top) and H-SCC-S3-D (bottom). (Note: 1 ft = 305 mm; 1 in. = 25.4 mm)
0 0.5 1 1.50
0.2
0.4
0.6
0.8
1
1.2
Displacement (in.)
M/M
n
0 0.02 0.04 0.06 0.08 0.1End-slip (in.)
Displacement (LCE)Displacement (manual)End-slip
0 0.5 1 1.5 20
0.2
0.4
0.6
0.8
1
1.2
Displacement (in.)
M/M
n
0 0.01 0.02 0.03 0.04 0.05End-slip (in.)
Displacement (LCE)Displacement (manual)End-slip
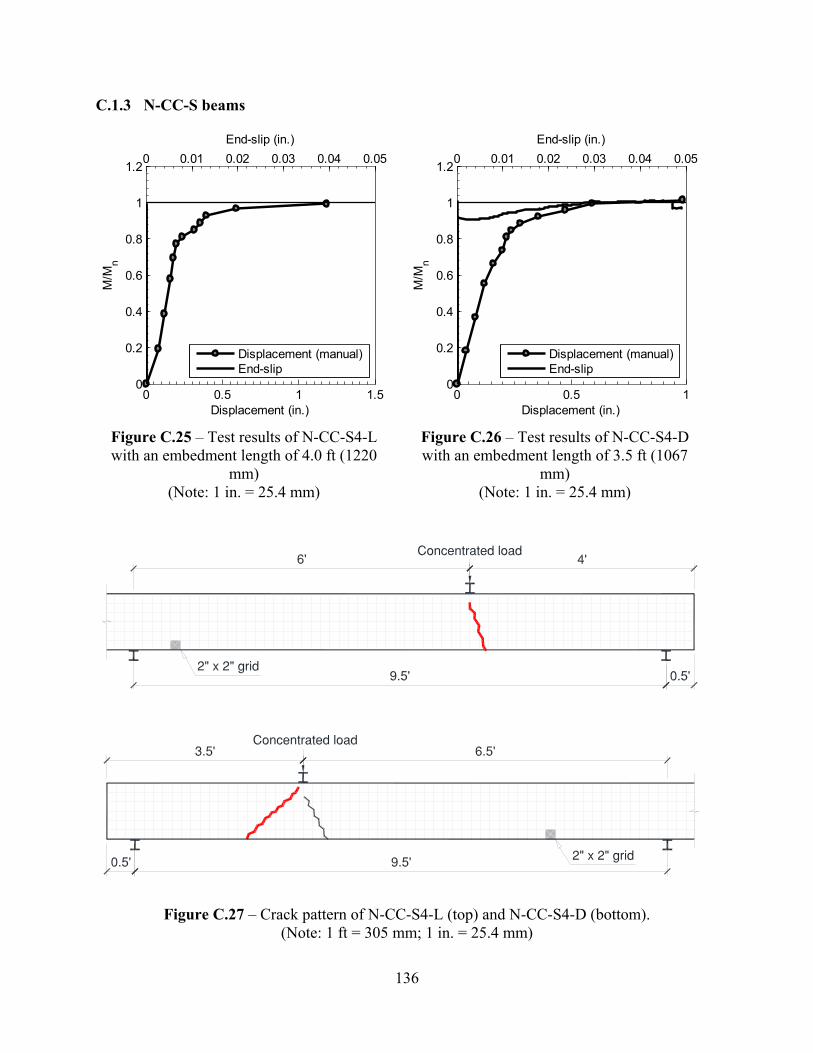
136
C.1.3 N-CC-S beams
Figure C.25 – Test results of N-CC-S4-L with an embedment length of 4.0 ft (1220
mm) (Note: 1 in. = 25.4 mm)
Figure C.26 – Test results of N-CC-S4-D with an embedment length of 3.5 ft (1067
mm) (Note: 1 in. = 25.4 mm)
Figure C.27 – Crack pattern of N-CC-S4-L (top) and N-CC-S4-D (bottom). (Note: 1 ft = 305 mm; 1 in. = 25.4 mm)
0 0.5 1 1.50
0.2
0.4
0.6
0.8
1
1.2
Displacement (in.)
M/M
n
0 0.01 0.02 0.03 0.04 0.05End-slip (in.)
Displacement (manual)End-slip
0 0.5 10
0.2
0.4
0.6
0.8
1
1.2
Displacement (in.)M
/Mn
0 0.01 0.02 0.03 0.04 0.05End-slip (in.)
Displacement (manual)End-slip
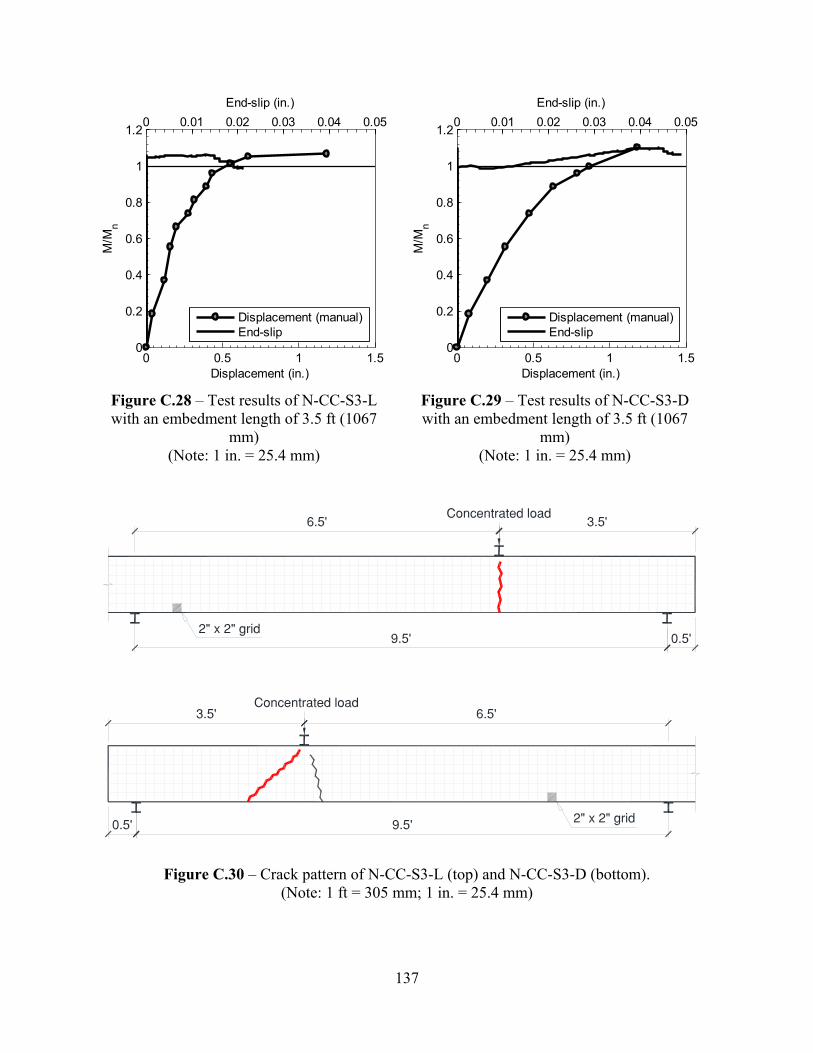
137
Figure C.28 – Test results of N-CC-S3-L with an embedment length of 3.5 ft (1067
mm) (Note: 1 in. = 25.4 mm)
Figure C.29 – Test results of N-CC-S3-D with an embedment length of 3.5 ft (1067
mm) (Note: 1 in. = 25.4 mm)
Figure C.30 – Crack pattern of N-CC-S3-L (top) and N-CC-S3-D (bottom). (Note: 1 ft = 305 mm; 1 in. = 25.4 mm)
0 0.5 1 1.50
0.2
0.4
0.6
0.8
1
1.2
Displacement (in.)
M/M
n
0 0.01 0.02 0.03 0.04 0.05End-slip (in.)
Displacement (manual)End-slip
0 0.5 1 1.50
0.2
0.4
0.6
0.8
1
1.2
Displacement (in.)
M/M
n
0 0.01 0.02 0.03 0.04 0.05End-slip (in.)
Displacement (manual)End-slip
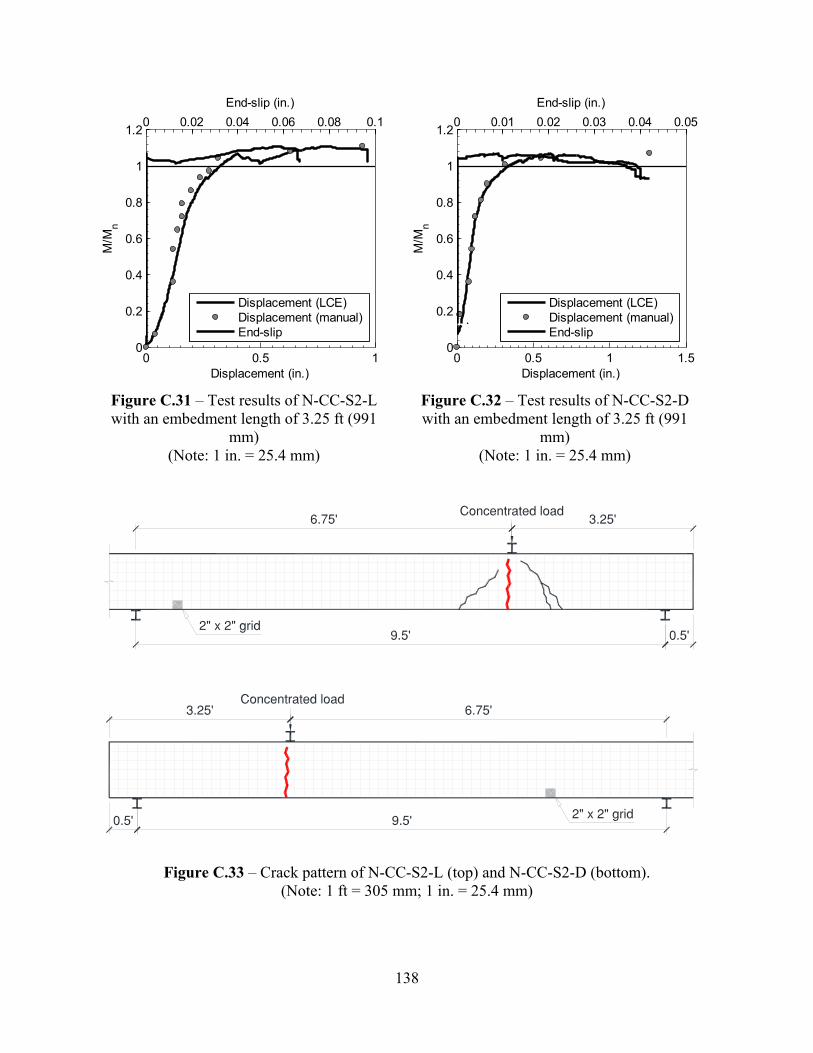
138
Figure C.31 – Test results of N-CC-S2-L with an embedment length of 3.25 ft (991
mm) (Note: 1 in. = 25.4 mm)
Figure C.32 – Test results of N-CC-S2-D with an embedment length of 3.25 ft (991
mm) (Note: 1 in. = 25.4 mm)
Figure C.33 – Crack pattern of N-CC-S2-L (top) and N-CC-S2-D (bottom). (Note: 1 ft = 305 mm; 1 in. = 25.4 mm)
0 0.5 10
0.2
0.4
0.6
0.8
1
1.2
Displacement (in.)
M/M
n
0 0.02 0.04 0.06 0.08 0.1End-slip (in.)
Displacement (LCE)Displacement (manual)End-slip
0 0.5 1 1.50
0.2
0.4
0.6
0.8
1
1.2
Displacement (in.)
M/M
n
0 0.01 0.02 0.03 0.04 0.05End-slip (in.)
Displacement (LCE)Displacement (manual)End-slip
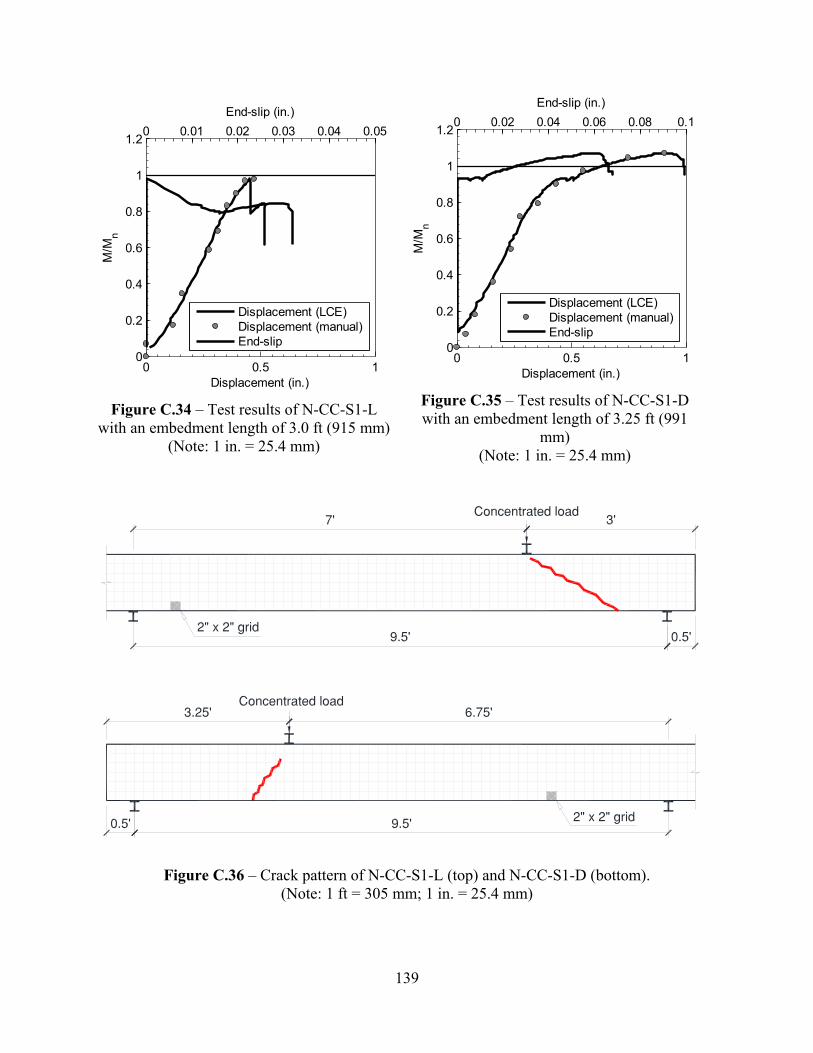
139
Figure C.34 – Test results of N-CC-S1-L
with an embedment length of 3.0 ft (915 mm) (Note: 1 in. = 25.4 mm)
Figure C.35 – Test results of N-CC-S1-D with an embedment length of 3.25 ft (991
mm) (Note: 1 in. = 25.4 mm)
Figure C.36 – Crack pattern of N-CC-S1-L (top) and N-CC-S1-D (bottom). (Note: 1 ft = 305 mm; 1 in. = 25.4 mm)
0 0.5 10
0.2
0.4
0.6
0.8
1
1.2
Displacement (in.)
M/M
n
0 0.01 0.02 0.03 0.04 0.05End-slip (in.)
Displacement (LCE)Displacement (manual)End-slip
0 0.5 10
0.2
0.4
0.6
0.8
1
1.2
Displacement (in.)
M/M
n
0 0.02 0.04 0.06 0.08 0.1End-slip (in.)
Displacement (LCE)Displacement (manual)End-slip
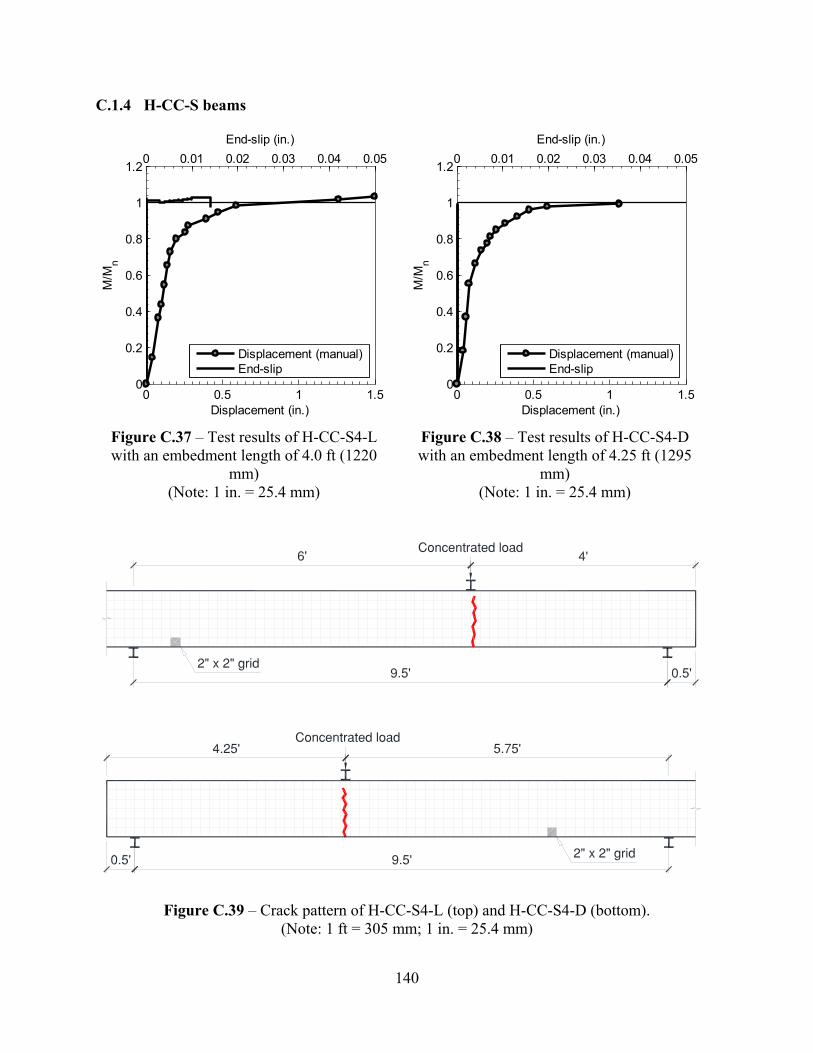
140
C.1.4 H-CC-S beams
Figure C.37 – Test results of H-CC-S4-L with an embedment length of 4.0 ft (1220
mm) (Note: 1 in. = 25.4 mm)
Figure C.38 – Test results of H-CC-S4-D with an embedment length of 4.25 ft (1295
mm) (Note: 1 in. = 25.4 mm)
Figure C.39 – Crack pattern of H-CC-S4-L (top) and H-CC-S4-D (bottom). (Note: 1 ft = 305 mm; 1 in. = 25.4 mm)
0 0.5 1 1.50
0.2
0.4
0.6
0.8
1
1.2
Displacement (in.)
M/M
n
0 0.01 0.02 0.03 0.04 0.05End-slip (in.)
Displacement (manual)End-slip
0 0.5 1 1.50
0.2
0.4
0.6
0.8
1
1.2
Displacement (in.)M
/Mn
0 0.01 0.02 0.03 0.04 0.05End-slip (in.)
Displacement (manual)End-slip
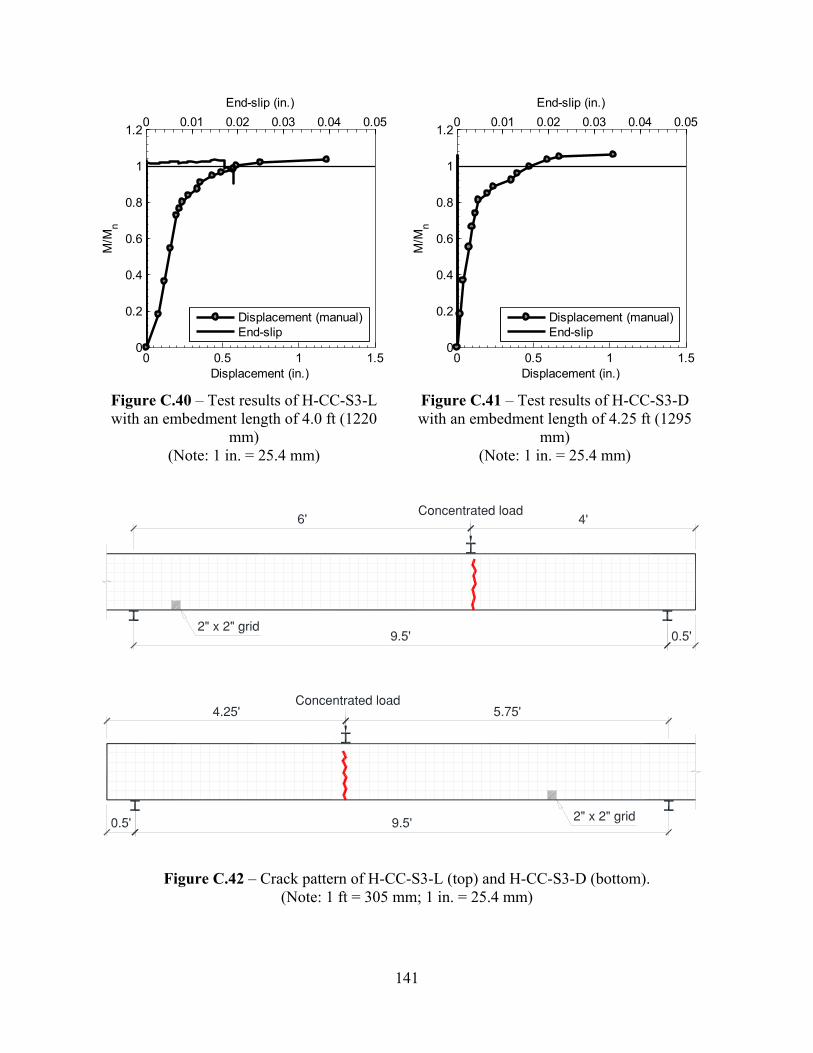
141
Figure C.40 – Test results of H-CC-S3-L with an embedment length of 4.0 ft (1220
mm) (Note: 1 in. = 25.4 mm)
Figure C.41 – Test results of H-CC-S3-D with an embedment length of 4.25 ft (1295
mm) (Note: 1 in. = 25.4 mm)
Figure C.42 – Crack pattern of H-CC-S3-L (top) and H-CC-S3-D (bottom). (Note: 1 ft = 305 mm; 1 in. = 25.4 mm)
0 0.5 1 1.50
0.2
0.4
0.6
0.8
1
1.2
Displacement (in.)
M/M
n
0 0.01 0.02 0.03 0.04 0.05End-slip (in.)
Displacement (manual)End-slip
0 0.5 1 1.50
0.2
0.4
0.6
0.8
1
1.2
Displacement (in.)
M/M
n
0 0.01 0.02 0.03 0.04 0.05End-slip (in.)
Displacement (manual)End-slip
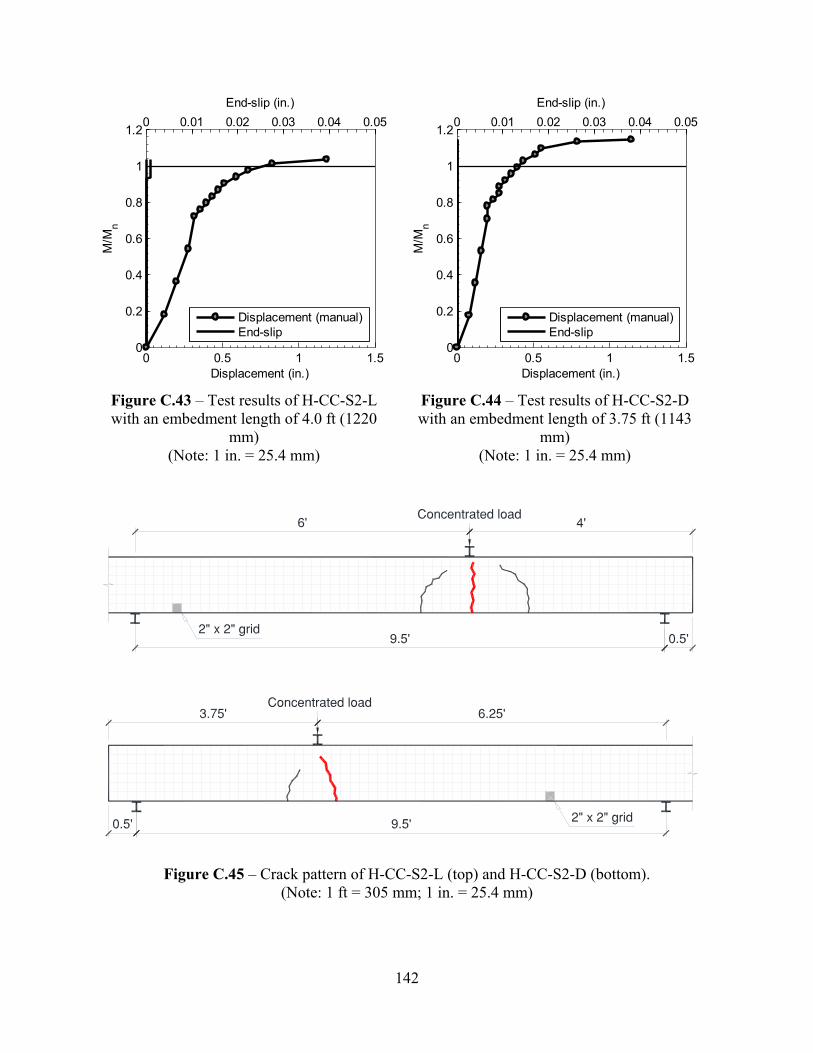
142
Figure C.43 – Test results of H-CC-S2-L with an embedment length of 4.0 ft (1220
mm) (Note: 1 in. = 25.4 mm)
Figure C.44 – Test results of H-CC-S2-D with an embedment length of 3.75 ft (1143
mm) (Note: 1 in. = 25.4 mm)
Figure C.45 – Crack pattern of H-CC-S2-L (top) and H-CC-S2-D (bottom). (Note: 1 ft = 305 mm; 1 in. = 25.4 mm)
0 0.5 1 1.50
0.2
0.4
0.6
0.8
1
1.2
Displacement (in.)
M/M
n
0 0.01 0.02 0.03 0.04 0.05End-slip (in.)
Displacement (manual)End-slip
0 0.5 1 1.50
0.2
0.4
0.6
0.8
1
1.2
Displacement (in.)
M/M
n
0 0.01 0.02 0.03 0.04 0.05End-slip (in.)
Displacement (manual)End-slip
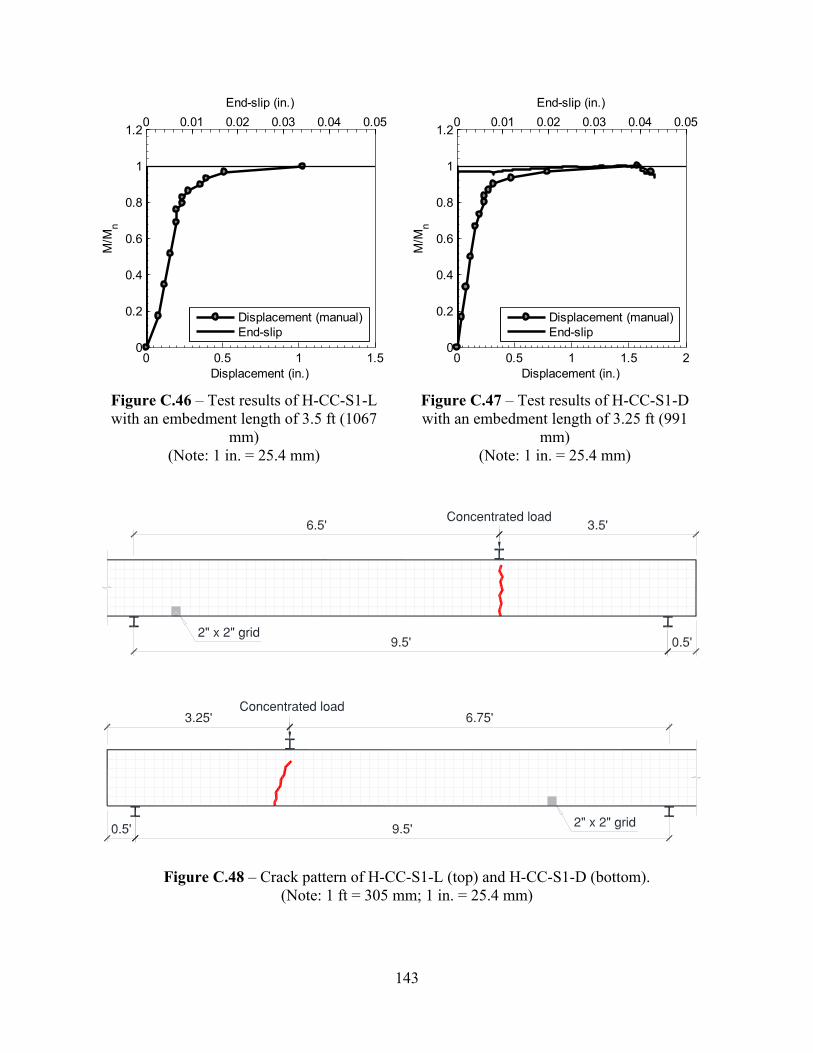
143
Figure C.46 – Test results of H-CC-S1-L with an embedment length of 3.5 ft (1067
mm) (Note: 1 in. = 25.4 mm)
Figure C.47 – Test results of H-CC-S1-D with an embedment length of 3.25 ft (991
mm) (Note: 1 in. = 25.4 mm)
Figure C.48 – Crack pattern of H-CC-S1-L (top) and H-CC-S1-D (bottom). (Note: 1 ft = 305 mm; 1 in. = 25.4 mm)
0 0.5 1 1.50
0.2
0.4
0.6
0.8
1
1.2
Displacement (in.)
M/M
n
0 0.01 0.02 0.03 0.04 0.05End-slip (in.)
Displacement (manual)End-slip
0 0.5 1 1.5 20
0.2
0.4
0.6
0.8
1
1.2
Displacement (in.)
M/M
n
0 0.01 0.02 0.03 0.04 0.05End-slip (in.)
Displacement (manual)End-slip
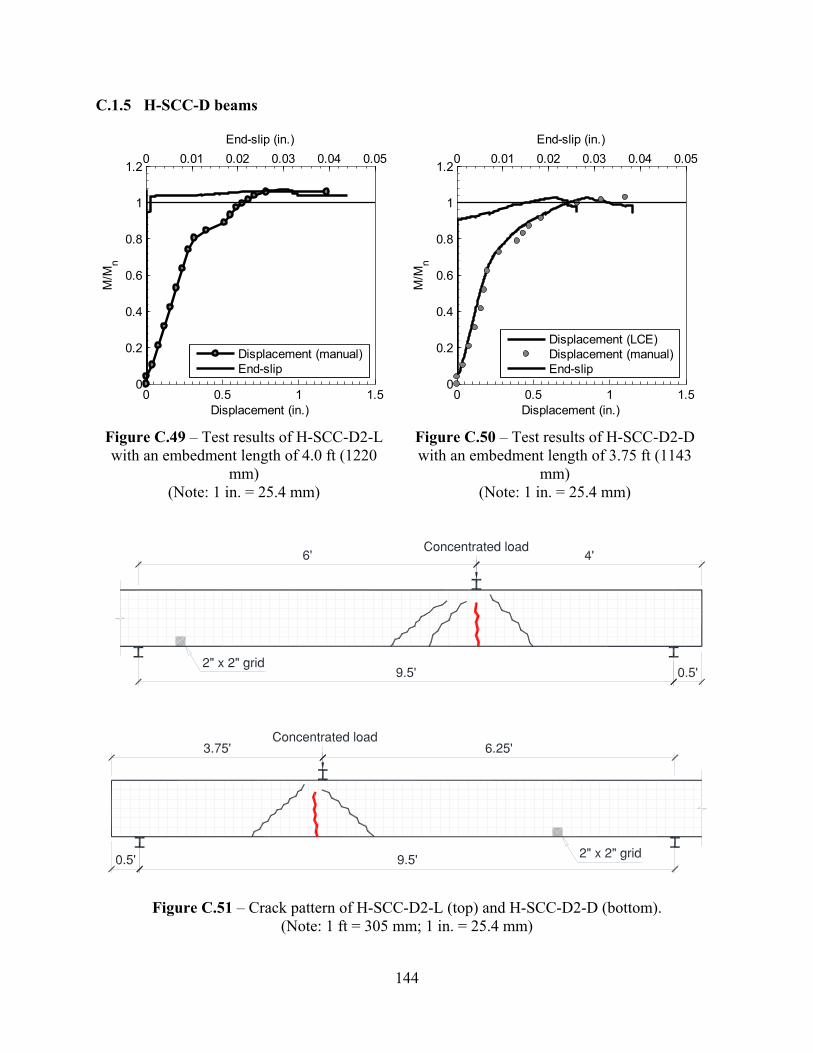
144
C.1.5 H-SCC-D beams
Figure C.49 – Test results of H-SCC-D2-L with an embedment length of 4.0 ft (1220
mm) (Note: 1 in. = 25.4 mm)
Figure C.50 – Test results of H-SCC-D2-D with an embedment length of 3.75 ft (1143
mm) (Note: 1 in. = 25.4 mm)
Figure C.51 – Crack pattern of H-SCC-D2-L (top) and H-SCC-D2-D (bottom). (Note: 1 ft = 305 mm; 1 in. = 25.4 mm)
0 0.5 1 1.50
0.2
0.4
0.6
0.8
1
1.2
Displacement (in.)
M/M
n
0 0.01 0.02 0.03 0.04 0.05End-slip (in.)
Displacement (manual)End-slip
0 0.5 1 1.50
0.2
0.4
0.6
0.8
1
1.2
Displacement (in.)M
/Mn
0 0.01 0.02 0.03 0.04 0.05End-slip (in.)
Displacement (LCE)Displacement (manual)End-slip
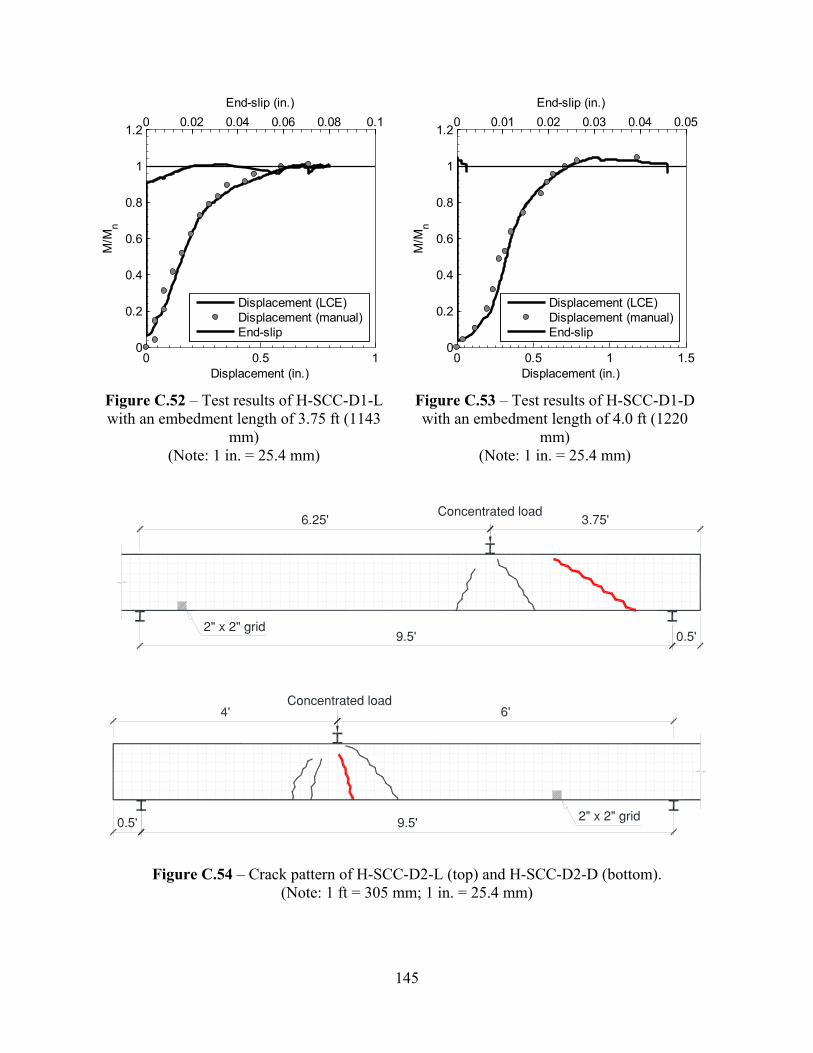
145
Figure C.52 – Test results of H-SCC-D1-L with an embedment length of 3.75 ft (1143
mm) (Note: 1 in. = 25.4 mm)
Figure C.53 – Test results of H-SCC-D1-D with an embedment length of 4.0 ft (1220
mm) (Note: 1 in. = 25.4 mm)
Figure C.54 – Crack pattern of H-SCC-D2-L (top) and H-SCC-D2-D (bottom). (Note: 1 ft = 305 mm; 1 in. = 25.4 mm)
0 0.5 10
0.2
0.4
0.6
0.8
1
1.2
Displacement (in.)
M/M
n
0 0.02 0.04 0.06 0.08 0.1End-slip (in.)
Displacement (LCE)Displacement (manual)End-slip
0 0.5 1 1.50
0.2
0.4
0.6
0.8
1
1.2
Displacement (in.)
M/M
n
0 0.01 0.02 0.03 0.04 0.05End-slip (in.)
Displacement (LCE)Displacement (manual)End-slip
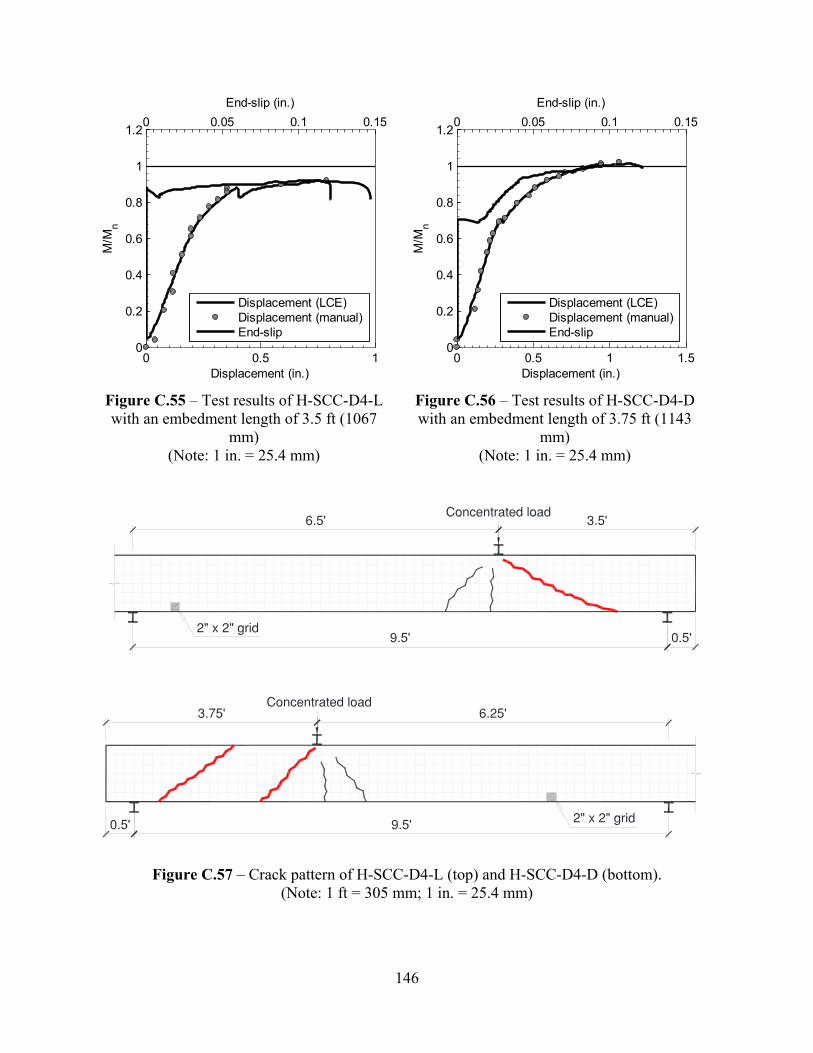
146
Figure C.55 – Test results of H-SCC-D4-L with an embedment length of 3.5 ft (1067
mm) (Note: 1 in. = 25.4 mm)
Figure C.56 – Test results of H-SCC-D4-D with an embedment length of 3.75 ft (1143
mm) (Note: 1 in. = 25.4 mm)
Figure C.57 – Crack pattern of H-SCC-D4-L (top) and H-SCC-D4-D (bottom). (Note: 1 ft = 305 mm; 1 in. = 25.4 mm)
0 0.5 10
0.2
0.4
0.6
0.8
1
1.2
Displacement (in.)
M/M
n
0 0.05 0.1 0.15End-slip (in.)
Displacement (LCE)Displacement (manual)End-slip
0 0.5 1 1.50
0.2
0.4
0.6
0.8
1
1.2
Displacement (in.)
M/M
n
0 0.05 0.1 0.15End-slip (in.)
Displacement (LCE)Displacement (manual)End-slip
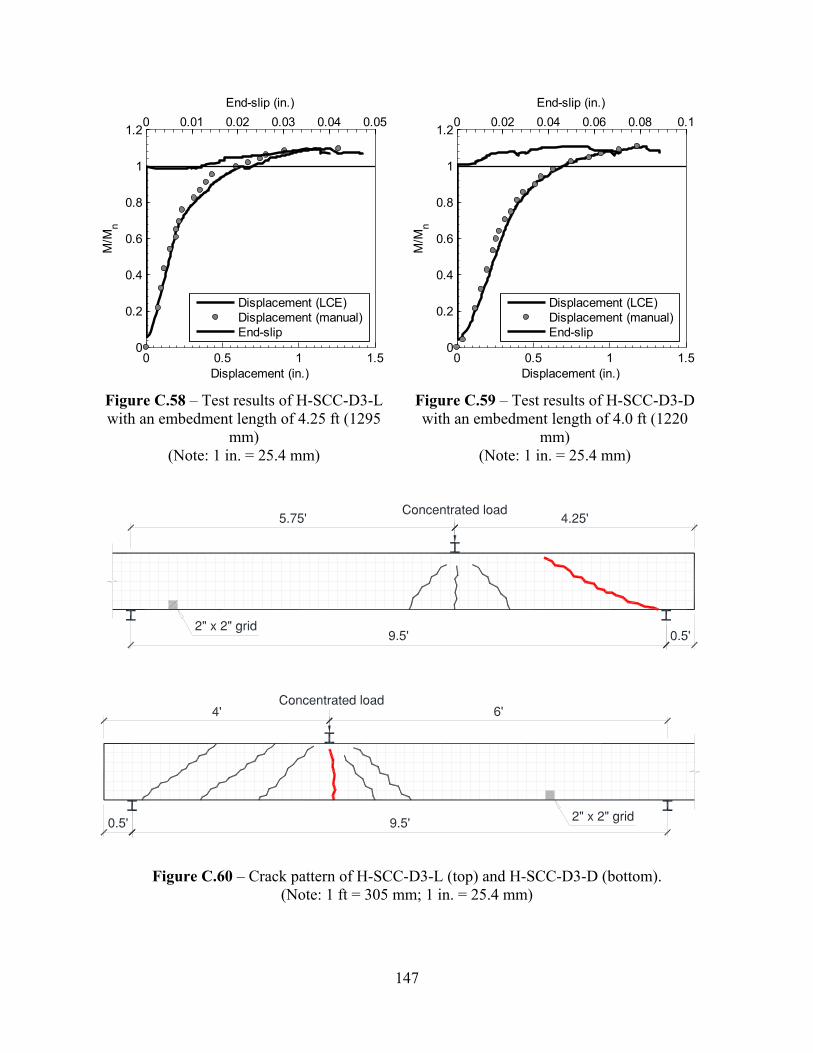
147
Figure C.58 – Test results of H-SCC-D3-L with an embedment length of 4.25 ft (1295
mm) (Note: 1 in. = 25.4 mm)
Figure C.59 – Test results of H-SCC-D3-D with an embedment length of 4.0 ft (1220
mm) (Note: 1 in. = 25.4 mm)
Figure C.60 – Crack pattern of H-SCC-D3-L (top) and H-SCC-D3-D (bottom). (Note: 1 ft = 305 mm; 1 in. = 25.4 mm)
0 0.5 1 1.50
0.2
0.4
0.6
0.8
1
1.2
Displacement (in.)
M/M
n
0 0.01 0.02 0.03 0.04 0.05End-slip (in.)
Displacement (LCE)Displacement (manual)End-slip
0 0.5 1 1.50
0.2
0.4
0.6
0.8
1
1.2
Displacement (in.)
M/M
n
0 0.02 0.04 0.06 0.08 0.1End-slip (in.)
Displacement (LCE)Displacement (manual)End-slip
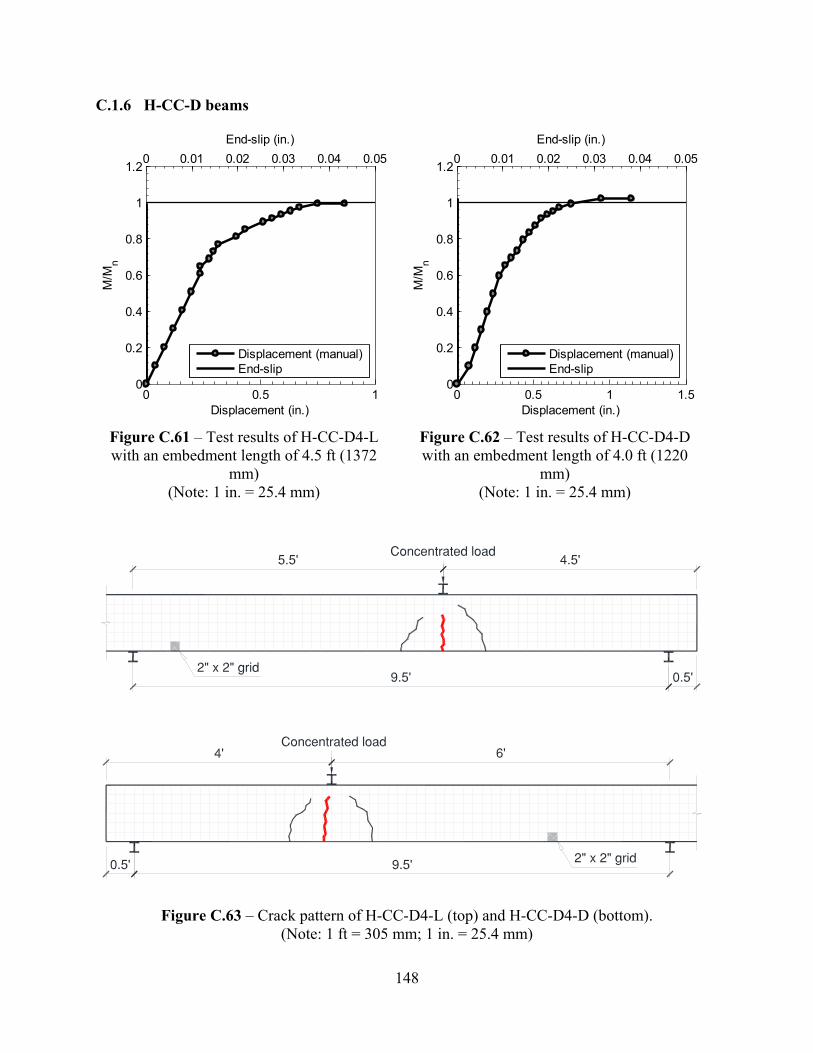
148
C.1.6 H-CC-D beams
Figure C.61 – Test results of H-CC-D4-L with an embedment length of 4.5 ft (1372
mm) (Note: 1 in. = 25.4 mm)
Figure C.62 – Test results of H-CC-D4-D with an embedment length of 4.0 ft (1220
mm) (Note: 1 in. = 25.4 mm)
Figure C.63 – Crack pattern of H-CC-D4-L (top) and H-CC-D4-D (bottom). (Note: 1 ft = 305 mm; 1 in. = 25.4 mm)
0 0.5 10
0.2
0.4
0.6
0.8
1
1.2
Displacement (in.)
M/M
n
0 0.01 0.02 0.03 0.04 0.05End-slip (in.)
Displacement (manual)End-slip
0 0.5 1 1.50
0.2
0.4
0.6
0.8
1
1.2
Displacement (in.)M
/Mn
0 0.01 0.02 0.03 0.04 0.05End-slip (in.)
Displacement (manual)End-slip
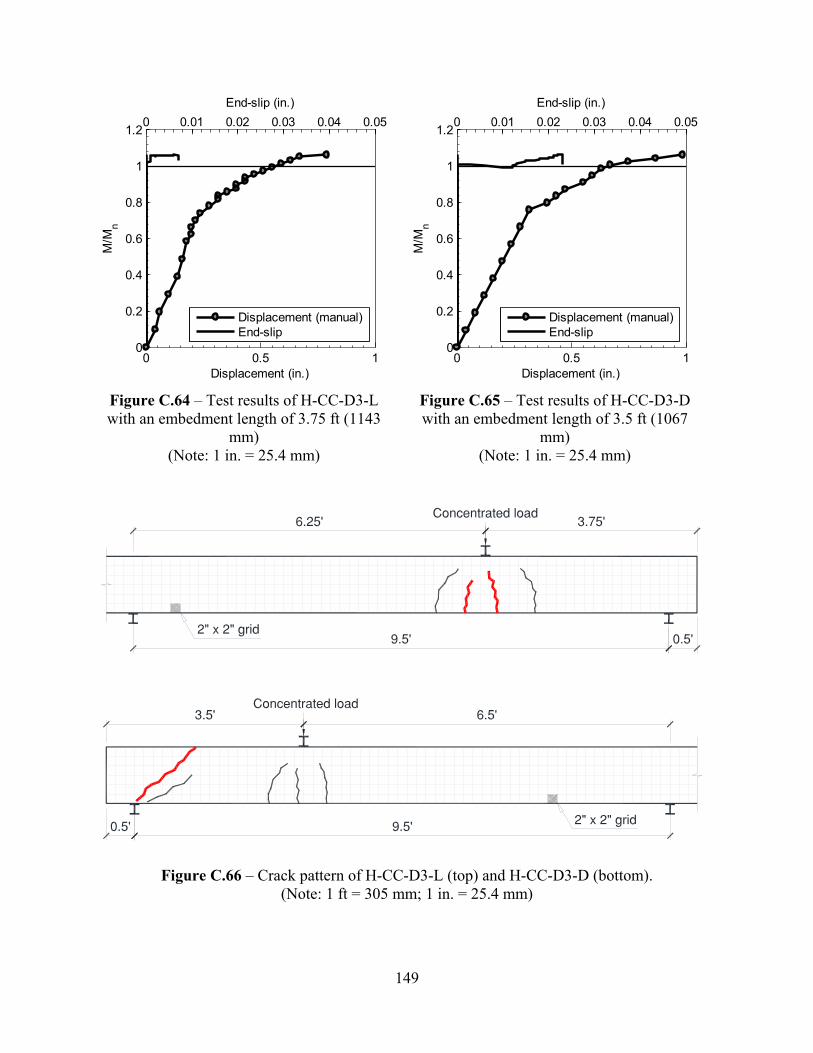
149
Figure C.64 – Test results of H-CC-D3-L with an embedment length of 3.75 ft (1143
mm) (Note: 1 in. = 25.4 mm)
Figure C.65 – Test results of H-CC-D3-D with an embedment length of 3.5 ft (1067
mm) (Note: 1 in. = 25.4 mm)
Figure C.66 – Crack pattern of H-CC-D3-L (top) and H-CC-D3-D (bottom). (Note: 1 ft = 305 mm; 1 in. = 25.4 mm)
0 0.5 10
0.2
0.4
0.6
0.8
1
1.2
Displacement (in.)
M/M
n
0 0.01 0.02 0.03 0.04 0.05End-slip (in.)
Displacement (manual)End-slip
0 0.5 10
0.2
0.4
0.6
0.8
1
1.2
Displacement (in.)
M/M
n
0 0.01 0.02 0.03 0.04 0.05End-slip (in.)
Displacement (manual)End-slip
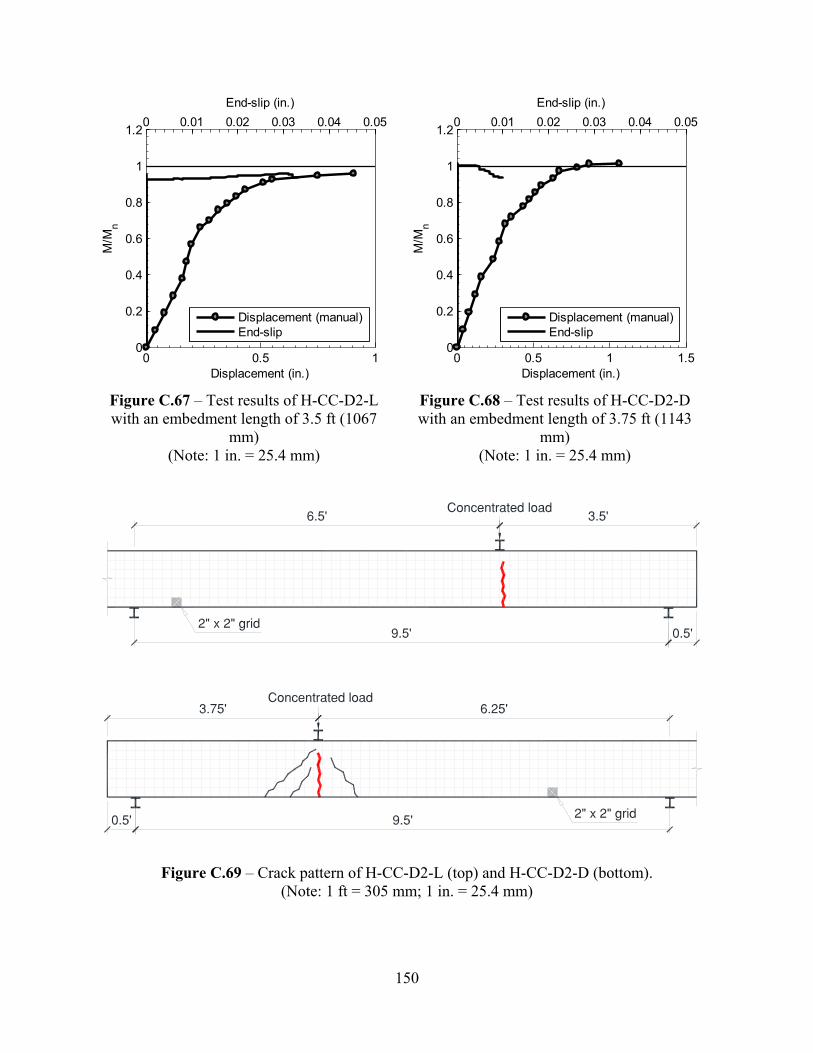
150
Figure C.67 – Test results of H-CC-D2-L with an embedment length of 3.5 ft (1067
mm) (Note: 1 in. = 25.4 mm)
Figure C.68 – Test results of H-CC-D2-D with an embedment length of 3.75 ft (1143
mm) (Note: 1 in. = 25.4 mm)
Figure C.69 – Crack pattern of H-CC-D2-L (top) and H-CC-D2-D (bottom). (Note: 1 ft = 305 mm; 1 in. = 25.4 mm)
0 0.5 10
0.2
0.4
0.6
0.8
1
1.2
Displacement (in.)
M/M
n
0 0.01 0.02 0.03 0.04 0.05End-slip (in.)
Displacement (manual)End-slip
0 0.5 1 1.50
0.2
0.4
0.6
0.8
1
1.2
Displacement (in.)
M/M
n
0 0.01 0.02 0.03 0.04 0.05End-slip (in.)
Displacement (manual)End-slip
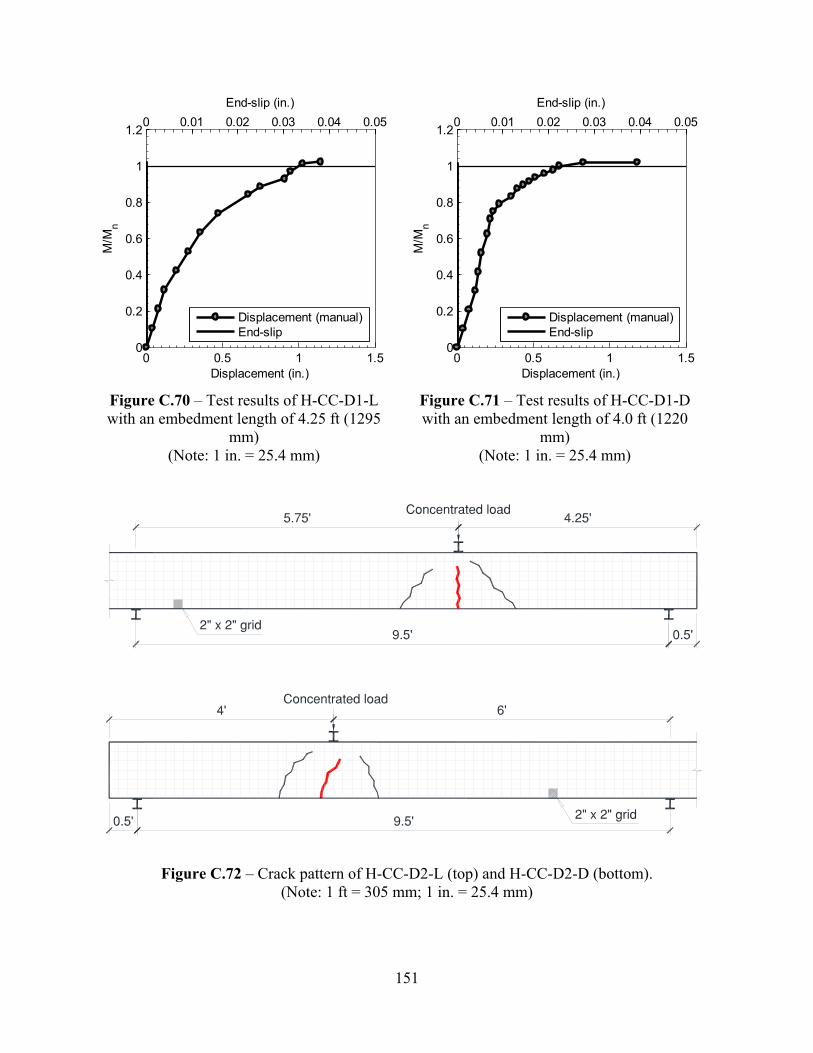
151
Figure C.70 – Test results of H-CC-D1-L with an embedment length of 4.25 ft (1295
mm) (Note: 1 in. = 25.4 mm)
Figure C.71 – Test results of H-CC-D1-D with an embedment length of 4.0 ft (1220
mm) (Note: 1 in. = 25.4 mm)
Figure C.72 – Crack pattern of H-CC-D2-L (top) and H-CC-D2-D (bottom). (Note: 1 ft = 305 mm; 1 in. = 25.4 mm)
0 0.5 1 1.50
0.2
0.4
0.6
0.8
1
1.2
Displacement (in.)
M/M
n
0 0.01 0.02 0.03 0.04 0.05End-slip (in.)
Displacement (manual)End-slip
0 0.5 1 1.50
0.2
0.4
0.6
0.8
1
1.2
Displacement (in.)
M/M
n
0 0.01 0.02 0.03 0.04 0.05End-slip (in.)
Displacement (manual)End-slip
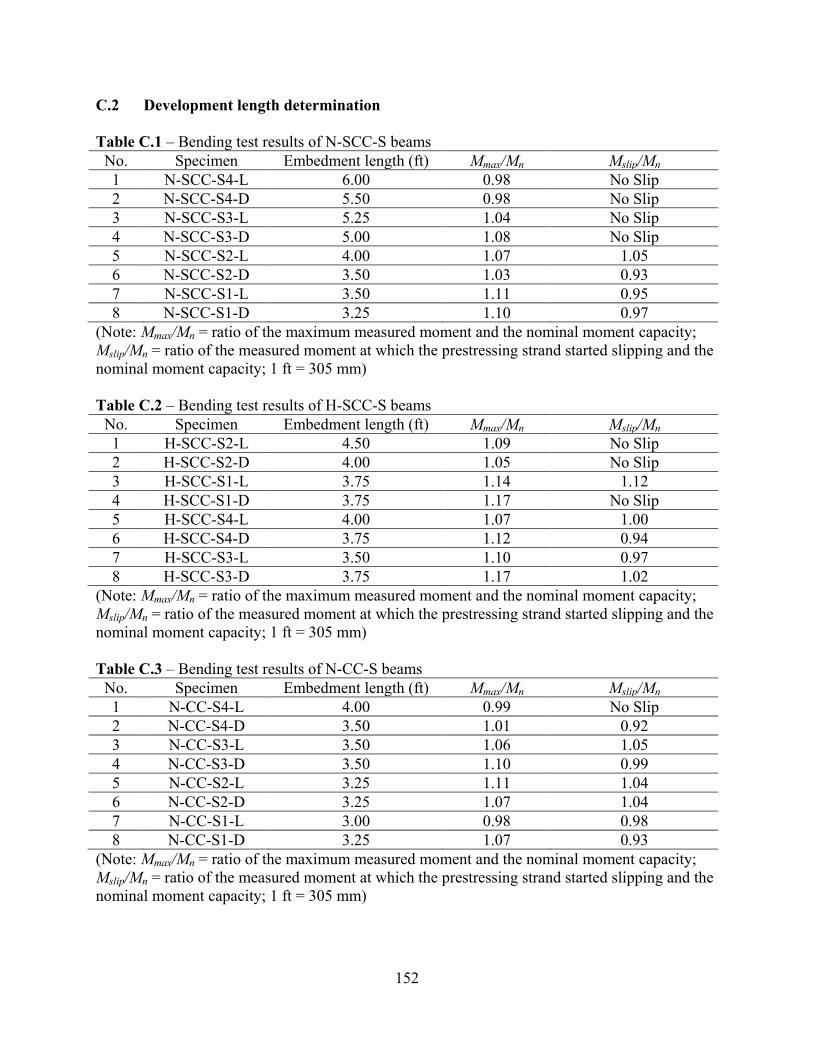
152
C.2 Development length determination
Table C.1 – Bending test results of N-SCC-S beams No. Specimen Embedment length (ft) Mmax/Mn Mslip/Mn 1 N-SCC-S4-L 6.00 0.98 No Slip 2 N-SCC-S4-D 5.50 0.98 No Slip 3 N-SCC-S3-L 5.25 1.04 No Slip 4 N-SCC-S3-D 5.00 1.08 No Slip 5 N-SCC-S2-L 4.00 1.07 1.05 6 N-SCC-S2-D 3.50 1.03 0.93 7 N-SCC-S1-L 3.50 1.11 0.95 8 N-SCC-S1-D 3.25 1.10 0.97
(Note: Mmax/Mn = ratio of the maximum measured moment and the nominal moment capacity; Mslip/Mn = ratio of the measured moment at which the prestressing strand started slipping and the nominal moment capacity; 1 ft = 305 mm) Table C.2 – Bending test results of H-SCC-S beams
No. Specimen Embedment length (ft) Mmax/Mn Mslip/Mn 1 H-SCC-S2-L 4.50 1.09 No Slip 2 H-SCC-S2-D 4.00 1.05 No Slip 3 H-SCC-S1-L 3.75 1.14 1.12 4 H-SCC-S1-D 3.75 1.17 No Slip 5 H-SCC-S4-L 4.00 1.07 1.00 6 H-SCC-S4-D 3.75 1.12 0.94 7 H-SCC-S3-L 3.50 1.10 0.97 8 H-SCC-S3-D 3.75 1.17 1.02
(Note: Mmax/Mn = ratio of the maximum measured moment and the nominal moment capacity; Mslip/Mn = ratio of the measured moment at which the prestressing strand started slipping and the nominal moment capacity; 1 ft = 305 mm) Table C.3 – Bending test results of N-CC-S beams
No. Specimen Embedment length (ft) Mmax/Mn Mslip/Mn 1 N-CC-S4-L 4.00 0.99 No Slip 2 N-CC-S4-D 3.50 1.01 0.92 3 N-CC-S3-L 3.50 1.06 1.05 4 N-CC-S3-D 3.50 1.10 0.99 5 N-CC-S2-L 3.25 1.11 1.04 6 N-CC-S2-D 3.25 1.07 1.04 7 N-CC-S1-L 3.00 0.98 0.98 8 N-CC-S1-D 3.25 1.07 0.93
(Note: Mmax/Mn = ratio of the maximum measured moment and the nominal moment capacity; Mslip/Mn = ratio of the measured moment at which the prestressing strand started slipping and the nominal moment capacity; 1 ft = 305 mm)
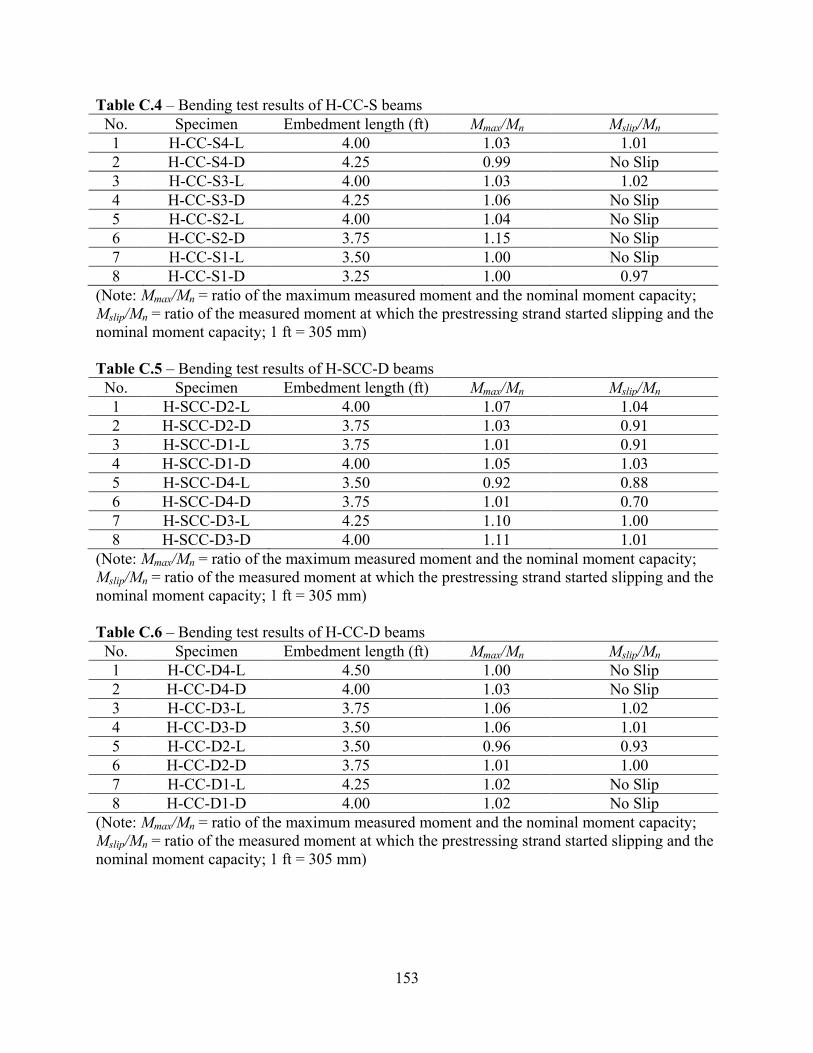
153
Table C.4 – Bending test results of H-CC-S beams No. Specimen Embedment length (ft) Mmax/Mn Mslip/Mn 1 H-CC-S4-L 4.00 1.03 1.01 2 H-CC-S4-D 4.25 0.99 No Slip 3 H-CC-S3-L 4.00 1.03 1.02 4 H-CC-S3-D 4.25 1.06 No Slip 5 H-CC-S2-L 4.00 1.04 No Slip 6 H-CC-S2-D 3.75 1.15 No Slip 7 H-CC-S1-L 3.50 1.00 No Slip 8 H-CC-S1-D 3.25 1.00 0.97
(Note: Mmax/Mn = ratio of the maximum measured moment and the nominal moment capacity; Mslip/Mn = ratio of the measured moment at which the prestressing strand started slipping and the nominal moment capacity; 1 ft = 305 mm) Table C.5 – Bending test results of H-SCC-D beams
No. Specimen Embedment length (ft) Mmax/Mn Mslip/Mn 1 H-SCC-D2-L 4.00 1.07 1.04 2 H-SCC-D2-D 3.75 1.03 0.91 3 H-SCC-D1-L 3.75 1.01 0.91 4 H-SCC-D1-D 4.00 1.05 1.03 5 H-SCC-D4-L 3.50 0.92 0.88 6 H-SCC-D4-D 3.75 1.01 0.70 7 H-SCC-D3-L 4.25 1.10 1.00 8 H-SCC-D3-D 4.00 1.11 1.01
(Note: Mmax/Mn = ratio of the maximum measured moment and the nominal moment capacity; Mslip/Mn = ratio of the measured moment at which the prestressing strand started slipping and the nominal moment capacity; 1 ft = 305 mm) Table C.6 – Bending test results of H-CC-D beams
No. Specimen Embedment length (ft) Mmax/Mn Mslip/Mn 1 H-CC-D4-L 4.50 1.00 No Slip 2 H-CC-D4-D 4.00 1.03 No Slip 3 H-CC-D3-L 3.75 1.06 1.02 4 H-CC-D3-D 3.50 1.06 1.01 5 H-CC-D2-L 3.50 0.96 0.93 6 H-CC-D2-D 3.75 1.01 1.00 7 H-CC-D1-L 4.25 1.02 No Slip 8 H-CC-D1-D 4.00 1.02 No Slip
(Note: Mmax/Mn = ratio of the maximum measured moment and the nominal moment capacity; Mslip/Mn = ratio of the measured moment at which the prestressing strand started slipping and the nominal moment capacity; 1 ft = 305 mm)


![Bridges in Mathematics, Grade 2 Unit 4: Measurement€¦ · Unit 4: Measurement In this unit, your child will: ] E stimate, measure, and compare the lengths of objects in inches,](https://static.fdocuments.in/doc/165x107/605b9ae688161c2d891bc738/bridges-in-mathematics-grade-2-unit-4-measurement-unit-4-measurement-in-this.jpg)