Measurement of tissue scattering properties using multi-diameter … · 2018-11-28 · Measurement...
17
Measurement of tissue scattering properties using multi-diameter single fiber reflectance spectroscopy: in silico sensitivity analysis U. A. Gamm, S. C. Kanick, H. J. C. M. Sterenborg, D. J. Robinson, and A. Amelink ∗ Center for Optical Diagnostics and Therapy, Department of Radiation Oncology, Erasmus Medical Center, PO Box 2040, 3000 CA Rotterdam, The Netherlands ∗ Corresponding author: [email protected] [email protected] Abstract: Multiple diameter single fiber reflectance (MDSFR) measure- ments of turbid media can be used to determine the reduced scattering coefficient (μ ′ s ) and a parameter that characterizes the phase function (γ ). The MDSFR method utilizes a semi-empirical model that expresses the collected single fiber reflectance intensity as a function of fiber diameter (d f iber ), μ ′ s , and γ . This study investigated the sensitivity of the MDSFR estimates of μ ′ s and γ to the choice of fiber diameters and spectral in- formation incorporated into the fitting procedure. The fit algorithm was tested using Monte Carlo simulations of single fiber reflectance intensities that investigated biologically relevant ranges of scattering properties (μ ′ s ∈ [0.4 − 4]mm −1 ) and phase functions (γ ∈ [1.4 − 1.9]) and for multiple fiber diameters (d f iber ∈ [0.2 − 1.5] mm). MDSFR analysis yielded accurate estimates of μ ′ s and γ over the wide range of scattering combinations; parameter accuracy was shown to be sensitive to the range of fiber diame- ters included in the analysis, but not to the number of intermediate fibers. Moreover, accurate parameter estimates were obtained without a priori knowledge about the spectral shape of γ . Observations were used to develop heuristic guidelines for the design of clinically applicable MDSFR probes. © 2011 Optical Society of America OCIS codes: 170.1470, 170.3660, 170.6510, 290.7050, 300.6540, 300.6550 References and links 1. N. Boustany, S. Boppart, and V. Backman, “Microscopic Imaging and Spectroscopy with Scattered Light,” Annu. Rev. Biomed. Eng. 12, 285–314 (2010). 2. R. Drezek, M. Guillaud, T. Collier, I. Boiko, A. Malpica, C. Macaulay, M. Follen, and R. Richards-Kortum, “Light scattering from cervical cells throughout neoplastic progression: influence of nuclear morphology, DNA content, and chromatin texture,” J. Biomed. Opt. 8, 7–16 (2003). 3. I. Georgakoudi and J. Van Dam, “Characterization of dysplastic tissue morphology and biochemistry in Barrett’s esophagus using diffuse reflectance and light scattering spectroscopy,” Tech. Gastrointest. Endosc. 7, 100–105 (2005). 4. J. Mourant, J. Boyer, A. Hielscher, and I. Bigio, “Influence of the scattering phase function on light transport measurements in turbid media performed with small source-detector separations,” Opt. Lett. 21, 546–548 (1996). 5. M. Canpolat and J. Mourant, “High-angle scattering events strongly affect light collection in clinically relevant measurement geometries for light transport through tissue,” Phys. Med. Biol. 45, 1127–1140 (2000). #150989 - $15.00 USD Received 13 Jul 2011; revised 9 Sep 2011; accepted 9 Sep 2011; published 26 Oct 2011 (C) 2011 OSA 1 November 2011 / Vol. 2, No. 11 / BIOMEDICAL OPTICS EXPRESS 3150
Transcript of Measurement of tissue scattering properties using multi-diameter … · 2018-11-28 · Measurement...

Measurement of tissue scatteringproperties using multi-diameter singlefiber reflectance spectroscopy:in silico
sensitivity analysis
U. A. Gamm, S. C. Kanick, H. J. C. M. Sterenborg, D. J. Robinson, andA. Amelink∗
Center for Optical Diagnostics and Therapy, Department of Radiation Oncology, ErasmusMedical Center, PO Box 2040, 3000 CA Rotterdam, The Netherlands
∗Corresponding author: [email protected]
Abstract: Multiple diameter single fiber reflectance (MDSFR) measure-ments of turbid media can be used to determine the reduced scatteringcoefficient (µ ′
s) and a parameter that characterizes the phase function (γ).The MDSFR method utilizes a semi-empirical model that expresses thecollected single fiber reflectance intensity as a function of fiber diameter(df iber), µ ′
s, and γ. This study investigated the sensitivity of the MDSFRestimates ofµ ′
s and γ to the choice of fiber diameters and spectral in-formation incorporated into the fitting procedure. The fit algorithm wastested using Monte Carlo simulations of single fiber reflectance intensitiesthat investigated biologically relevant ranges of scattering properties(µ ′
s ∈ [0.4−4]mm−1) and phase functions (γ ∈ [1.4−1.9]) and for multiplefiber diameters (df iber ∈ [0.2−1.5] mm). MDSFR analysis yielded accurateestimates ofµ ′
s and γ over the wide range of scattering combinations;parameter accuracy was shown to be sensitive to the range of fiber diame-ters included in the analysis, but not to the number of intermediate fibers.Moreover, accurate parameter estimates were obtained withouta prioriknowledge about the spectral shape ofγ. Observations were used to developheuristic guidelines for the design of clinically applicable MDSFR probes.
© 2011 Optical Society of America
OCIS codes:170.1470, 170.3660, 170.6510, 290.7050, 300.6540, 300.6550
References and links1. N. Boustany, S. Boppart, and V. Backman, “Microscopic Imaging and Spectroscopy with Scattered Light,” Annu.
Rev. Biomed. Eng.12, 285–314 (2010).2. R. Drezek, M. Guillaud, T. Collier, I. Boiko, A. Malpica, C. Macaulay, M. Follen, and R. Richards-Kortum,
“Light scattering from cervical cells throughout neoplastic progression: influence of nuclear morphology, DNAcontent, and chromatin texture,” J. Biomed. Opt.8, 7–16 (2003).
3. I. Georgakoudi and J. Van Dam, “Characterization of dysplastic tissue morphology and biochemistry in Barrett’sesophagus using diffuse reflectance and light scattering spectroscopy,” Tech. Gastrointest. Endosc.7, 100–105(2005).
4. J. Mourant, J. Boyer, A. Hielscher, and I. Bigio, “Influence of the scattering phase function on light transportmeasurements in turbid media performed with small source-detector separations,” Opt. Lett.21, 546–548 (1996).
5. M. Canpolat and J. Mourant, “High-angle scattering events strongly affect light collection in clinically relevantmeasurement geometries for light transport through tissue,” Phys. Med. Biol.45, 1127–1140 (2000).
#150989 - $15.00 USD Received 13 Jul 2011; revised 9 Sep 2011; accepted 9 Sep 2011; published 26 Oct 2011(C) 2011 OSA 1 November 2011 / Vol. 2, No. 11 / BIOMEDICAL OPTICS EXPRESS 3150
6. F. Bevilacqua and C. Depeursinge, “Monte Carlo study of diffuse reflectance at source–detector separations closeto one transport mean free path,” J. Opt. Soc. Am. A16, 2935–2945 (1999).
7. A. Kienle, F. Forster, and R. Hibst, “Influence of the phase function on determination of the optical properties ofbiological tissue by spatially resolved reflectance,” Opt. Lett.26, 1571–1573 (2001).
8. F. Bevilacqua, D. Piguet, P. Marquet, J. Gross, B. Tromberg, and C. Depeursinge, “In vivo local determination oftissue optical properties: applications to human brain,” Appl. Opt.38, 4939–4950 (1999).
9. E. Hull and T. Foster, “Steady-state reflectance spectroscopy in the P3 approximation,” J. Opt. Soc. Am. A18,584–599 (2001).
10. P. Thueler, I. Charvet, F. Bevilacqua, M. Ghislain, G. Ory, P. Marquet, P. Meda, B. Vermeulen, and C. De-peursinge, “In vivo endoscopic tissue diagnostics based on spectroscopic absorption, scattering, and phase func-tion properties,” J. Biomed. Opt.8, 495–503 (2003).
11. H. Tian, Y. Liu, L. Wang, “Influence of the third-order parameter on diffuse reflectance at small source-detectorseparations,” Opt. Lett.31, 933–935 (2006).
12. S. C. Kanick, U. A. Gamm, M. Schouten, H. J. C. M. Sterenborg, D. J. Robinson, and A. Amelink, “Measurementof the reduced scattering coefficient of turbid media using single fiber reflectance spectroscopy: fiber diameterand phase function dependence,” Biomed. Opt. Express2, 1687–1702 (2011).
13. S. C. Kanick, U. A. Gamm, H. J. C. M. Sterenborg, D. J. Robinson, and A. Amelink, “Method to quantitativelyestimate wavelength-dependent scattering properties from multi-diameter single fiber reflectance spectra in aturbid medium,” Opt. Lett.36, 2997-2999 (2011).
14. W.F. Cheong, S.A. Prahl, A.J. Welch, “A review of the optical properties of biological tissues,” IEEE J. QuantumElect.26, 2166–2185 (1990).
15. E. Salomatina, B. Jiang, J. Novak, A. N. Yaroslavsky, “Optical properties of normal and cancerous human skinin the visible and near-infrared spectral range,” J. Biomed. Opt.11, 064026 (2006).
16. S. C. Kanick, D. J. Robinson, H. J. C. M.Sterenborg, and A. Amelink, “Monte Carlo analysis of single fiberreflectance spectroscopy,” Phys. Med. Biol.54, 6991–7008 (2009).
17. S. C. Kanick, D. J. Robinson, H. J. C. M. Sterenborg, and A. Amelink, “Method to quantitate absorption co-efficients from single fiber reflectance spectra without knowledge of the scattering properties,” Opt. Lett.36,2791-2793 (2011).
18. P. Bargo, S. Prahl, and S. Jacques, “Collection efficiency of a single optical fiber in turbid media,” Appl. Opt.42,3187–3197 (2003).
19. L. Wang, S. Jacques, and L. Zheng, “MCML–Monte Carlo modeling of light transport in multi-layered tissues,”Comp. Meth. Prog. Biomed.47, 131–146 (1995).
20. A. Knuttel, M. Boehlau-Godau, “Spatially confined and temporally resolved refractive index and scattering eval-uation in human skin performed with optical coherence tomography,” J. Biomed. Opt.5, 83–92 (2000).
21. J. J. J. Dirckx, L. C. Kuypers, W. F. Decraemer, “Refractive index of tissue measured with confocal microscopy,”J. Biomed. Opt.10, 044014 (2005).
22. M. Xu, R. R. Alfano, “Fractal mechanisms of light scattering in biological tissue and cells,” Opt. Lett.30, 3051–3053 (2005).
23. F. Bevilacqua, A. Berger, A. Cerussi, D. Jakubowski, and B. Tromberg, “Broadband absorption spectroscopy inturbid media by combined frequency-domain and steady-state methods,” Appl. Opt.39, 6498–6507 (2000).
24. J. Mourant, J. Freyer, A. Hielscher, A. Eick, D. Shen, and T. Johnson, “Mechanisms of light scattering frombiological cells relevant to noninvasive optical-tissue diagnostics,” Appl. Opt.37, 3586–3593 (1998).
25. A. Amelink, D. J. Robinson, and H. J. C. M. Sterenborg, “Confidence intervals on fit parameters derived fromoptical reflectance spectroscopy measurements,” J. Biomed. Opt.13, 054044 (2008).
26. R. L. P. van Veen, W. Verkruysse, H. J. C. M. Sterenborg, “Diffuse-reflectance spectroscopy from 500 to 1060nm by correction for inhomogeneously distributed absorbers ,” Opt. Lett.27, 246–248 (2002).
27. N. Rajaram, T. H. Nguyen, and J. W. Tunnell, “Lookup table–based inverse model for determining optical prop-erties of turbid media,” J. Biomed. Opt.13, 050501 (2008).
28. G. Palmer and N. Ramanujam, “Monte Carlo-based inverse model for calculating tissue optical properties. PartI: Theory and validation on synthetic phantoms,” Appl. Opt.45, 1062–1071 (2006).
29. D. Sharma, A. Agrawal, L. S. Matchette, and T. J. Pfefer, “Evaluation of a fiberoptic-based system for measure-ment of optical properties in highly attenuating turbid media,” Biomed. Eng. Online5, 49 (2006).
30. R. Reif, O. A’Amar, and I. Bigio, “Analytical model of light reflectance for extraction of the optical properties insmall volumes of turbid media,” Appl. Opt.46, 7317–7328 (2007).
31. R. H. Wilson, M. Chandra, J. Scheiman, D. Simeone, B. McKenna, J. Purdy, and M.-A. Mycek, “Optical spec-troscopy detects histological hallmarks of pancreatic cancer,” Opt. Express17, 17502–17516 (2009).
32. A. Kim, M. Roy, F. Dadani, and B. Wilson, “A fiberoptic reflectance probe with multiple source-collector separa-tions to increase the dynamic range of derived tissue optical absorption and scattering coefficients,” Opt. Express18, 5580–5594 (2010).
#150989 - $15.00 USD Received 13 Jul 2011; revised 9 Sep 2011; accepted 9 Sep 2011; published 26 Oct 2011(C) 2011 OSA 1 November 2011 / Vol. 2, No. 11 / BIOMEDICAL OPTICS EXPRESS 3151

1. Introduction
Reflectancespectroscopy is a non-invasive method that is widely used to measure tissue opti-cal properties. Such information can characterize vascular physiology and tissue ultrastructure,factors that may have diagnostic value [1, 2, 3]. Tissue optical properties are characterized bythe absorption coefficient (µa) and the scattering coefficient (µs), which are the inverse of themean free paths between absorption and scattering events, respectively, as well as the scatteringphase function (PF), which describes the angular distribution of scattering events. Light trans-port at large distances from the light source (in biological tissues this is generally more than 2mm) can be described by the reduced scattering coefficient, given asµ ′
s = µs(1−g1), whereg1 =< cos(θ) > is the scattering anisotropy; light transport at these length scales in tissue isconsidered diffuse and is insensitive to the exact shape of the PF. However, reflectance inten-sities collected by optical devices with small source-detector separations contain contributionsfrom non-diffuse photons, making the collected intensity dependent on bothµs and the exactform of the PF [4, 5, 6, 7]. Failure to account for PF effects for small source-detector separationswill introduce errors into optical property estimates. Previous investigations of light transportnear the source [8, 9, 10, 11] utilized the Legendre moments of the PF to characterize the effectof large angle scattering events on the collected reflectance signal, introducing a parameter
γ =1−g2
1−g1(1)
that includes information about the first two moments of the PF, given asg1 andg2, respec-tively. These first two moments correspond to the mean and the variance of the distribution ofthe angular scattering events specified by the PF. These mathematical approaches have beenshown to be valid for source-detector separations that are greater than 0.5 mm [9].
Our group has focused on developing quantitative fiber optic devices that utilize a single opticalfiber to deliver and collect light during measurement of a turbid medium, such as tissue. Lighttransport relevant to single fiber reflectance (SFR) measurements, where source and detectorspots overlap, is not described by existing analytical models. Recently, our group introduceda semi-empirical model that describes the PF-dependent relationship between the collectedSFR intensity and the dimensionless reduced scattering, a term given as the product of thereduced scattering coefficient and the fiber diameter (µ ′
sdf iber) [12]; from this relationship itis important to note that variations inµ ′
s anddf iber interchangeably affect the collected lightintensity. In a subsequent study, our semi-empirical model was further refined to characterizethe PF-dependence of the SFR intensity in terms ofµ ′
sdf iber andγ [13]. The application of thismodel to analyze SFR spectra measured in tissue is complicated because the tissue PF, andin turn γ, is not well characterized, and have been reported to be wavelength-dependent [10].Our previous study [13] showed the potential of utilizing multiple SFR spectra measured bydifferent fiber diameter probes to characterize the tissue scattering properties without anyapriori information about the tissue PF. Specifically, a multiple diameter single fiber reflectance(MDSFR) approach utilizes the SFR intensity vs. fiber diameter profiles to inform independentestimation of the effects ofµ ′
s andγ on the reflectance signal.
In the present study we characterize the sensitivity of MDSFR estimates ofµ ′s andγ on the fiber
diameters included in the MDSFR approach and on constraints within the analysis algorithm.To investigate this, a Monte Carlo model was utilized to simulate SFR measurements over awide range of scattering coefficients relevant for tissue (µ ′
s ∈ [0.4− 4] mm−1) [14, 15] andbiologically relevant phase functions (Modified Henyey-Greenstein phase function withg1 ∈[0.8−0.95]andγ ∈ [1.4−1.9]) [8], for 7 fiber diameters (df iber ∈ [0.2,0.3,0.4,0.6,0.8,1.0,1.5]
#150989 - $15.00 USD Received 13 Jul 2011; revised 9 Sep 2011; accepted 9 Sep 2011; published 26 Oct 2011(C) 2011 OSA 1 November 2011 / Vol. 2, No. 11 / BIOMEDICAL OPTICS EXPRESS 3152

mm). Simulated measurements are used to characterize the influence that the number of fibersand the range of fiber diameters included in the MDSFR analysis have on the accuracy ofthe estimated scattering parameters. Also, this study considers the potential benefit ofa priorispecification of wavelength-dependent scattering constraints on MDSFR accuracy.
2. Materials and methods
2.1. Single fiber reflectance model
Figure 1 shows a schematic of the SFR spectroscopy setup. During measurement, photons areemitted from a white light source and guided through the single fiber probe to the fiber tipwhere they enter the medium under investigation. Within the medium photons are scattered andabsorbed and a fraction of the photons is reflected back into the single fiber and collected bythe spectrometer.
Fig. 1. Single fiber reflectance spectroscopy setup.
Quantitative analysis of a measured single fiber reflectance spectrum (RSF) requires the use ofan empirical model that describes the wavelength-dependent collected light intensity in theabsence of absorption (Ro
SF), and applies a Modified Beer-Lambert law to that profile to accountfor absorption from tissue chromophores:
RSF = RoSFe−µa〈LSF〉 (2)
Here,RoSF is the SFR intensity in the absence of absorption, and< LSF > is the effective SFR
photon path length, which has a dependence on the sampled optical properties that has beenfully characterized previously as [16, 17]:
〈LSF〉
df iber=
CPF1.54(µ ′
sdf iber)0.18(0.64+(µadf iber)0.64)(3)
whereCPF is a coefficient that describes the effect of phase function on〈LSF〉, described previ-ously [16]. Recently, our group introduced a semi-empirical model [12, 13] that describes therelationship betweenRo
SF and the dimensionless reduced scatteringµ ′sdf iber andγ, given as:
RoSF = ηlimit
(
1+0.63γ2e−2.31γ2(µ ′sdf iber)
)
[
(µ ′sdf iber)
0.57γ
2.31γ2 +(µ ′sdf iber)0.57γ
]
(4)
Here, the product of the terms preceding the square brackets represents the single fiber col-lection efficiency, whereηlimit is the diffuse limit, which approximates to be 2.7% for a single
#150989 - $15.00 USD Received 13 Jul 2011; revised 9 Sep 2011; accepted 9 Sep 2011; published 26 Oct 2011(C) 2011 OSA 1 November 2011 / Vol. 2, No. 11 / BIOMEDICAL OPTICS EXPRESS 3153
fiber withNA= 0.22 [12, 18]. The term within the brackets describes the saturating relationshipbetweenRo
SF andµ ′sdf iber that showed phase function independent behavior for high dimension-
less scattering values (µ ′sdf iber ≥ 10) [12]. This expression accurately describesRo
SF over a widerange ofµ ′
s∈ [0.4−4] mm−1, anisotropyg1 ∈ [0.8−0.95], andγ ∈ [1.4−1.9] for the ModifiedHenyey-Greenstein phase function.
2.2. Monte Carlo simulations of single fiber reflectance
The Monte Carlo code utilized in this study is based on the MCML approach to stochasticallysimulate photon propagation within a turbid medium [19]. The code was adapted to mimica single fiber measurement of a turbid medium with homogeneously distributed opticalproperties; this model has previously been described in detail [12, 16] and will here only beintroduced briefly. Photons were initialized by selecting a location on the fiber face in contactwith the medium and were launched into a direction within the fiber cone of acceptance; bothlocation and direction were sampled from uniform distributions. The index of refractionn ofthe medium was set to 1.37 [20, 21] and that of the fiber to 1.5. Reflection and refraction atthe boundary between fiber face and medium were accounted for by using Fresnel’s equationand Snell’s law. The photons propagated through the medium in discrete steps selected froman exponential distribution that was weighted by the scattering coefficient. Each scatteringevent resulted in a change in propagation direction that was sampled from the user-specifiedscattering phase function. Simulations returned collected reflectance intensity (in the absenceof absorption) in units of percentage of incident photons.
In this study the Monte Carlo model simulations were performed to mimic measurements ofSFR spectra on turbid media that contain biologically-relevant scattering properties. While in-dividual simulations return the equivalent of a measured intensity at a single wavelength, therange of optical properties within the set of simulations was selected such that combinationsof individual simulations could be used to represent reflectance spectra measured in a turbidmedium. For each group of simulations that represent a measured spectrum, the wavelengthdependence ofµ ′
s(λ ) was assumed to follow Mie scattering, as
µ ′s(λ ) = a1(
λλ0
)a2 (5)
wherea1 anda2 represent the Mie scattering amplitude and scattering power, respectively, andλo represents a normalization wavelength (chosen to be 800 nm in this study). Here,µ ′
s(λ )was calculated forλ ∈ [400−900]nm in 50 nm increments witha2 = −1.0 (which is typicalfor tissue [22]) anda1 adjusted to calculate three different sets of scattering profiles, such thatµ ′
s(800nm) = [0.5,1.0,2.0] mm−1 respectively; this yielded 33µ ′s values in total. Figure 2
shows the 3 individual scattering sets utilized in this study.
Each µ ′s value investigated in this study was constructed independently for 3 different
anisotropies (g1 ∈ [0.8,0.9,0.95]) that were derived from the Modified Henyey-Greenstein(MHG) phase function:
pMHG(θ) = α pHG(θ ,gHG)+(1−α)3
4πcos2(θ) (6)
The MHG phase function is a combination of the Henyey-Greenstein phase function (pHG) andan isotropic component that contains thecos2(θ) term. By choosing specific values forgHG andthe normalization parameterα the phase functions were constructed in a way that its secondLegendre moment,g2, led to values ofγ that encompassed the biologically relevant range (γ
#150989 - $15.00 USD Received 13 Jul 2011; revised 9 Sep 2011; accepted 9 Sep 2011; published 26 Oct 2011(C) 2011 OSA 1 November 2011 / Vol. 2, No. 11 / BIOMEDICAL OPTICS EXPRESS 3154

400 500 600 700 800 9000
0.5
1
1.5
2
2.5
3
3.5
4
4.5
wavelength [nm]
µ’s
scatteringset 1scatteringset 2scatteringset 3
Fig. 2. Wavelength dependent reduced scattering coefficient for the 3 scattering sets con-sideredin simulations.
∈ [1.4,1.5,1.6,1.7,1.8,1.9] as reported in previous literature [6]. In total 17 phase functionswere implemented for all possible combinations ofg1 andγ with the exception ofg1 = 0.8 andγ = 1.9; such a combination cannot be obtained with Eq. (6). SFR measurements of the 561combinations of optical properties were each simulated for 7 different fiber diameters (df iber
∈ [0.2,0.3,0.4,0.6,0.8,1.0,1.5] mm) leading to a total amount of 3927 simulated SFR signals.Each simulation launched at least 2×10⁶ photons.
2.3. Estimation ofµ ′s andγ from MDSFR measurements
As reported previously [13], the MDSFR approach is based on the principle that SFR measure-ments of a turbid medium by multiple different fiber diameter probes will yield a PF-specificRo
SF(λ ) vs.df iber relationship (as visualized in Fig. 3) that allows the estimation of bothµ ′s(λ )
and γ(λ ). This theory applies to measurements at a single wavelength, assuming that themeasurements are in the absence of absorption such thatRSF approximates toRo
SF; the applica-tion of Eq. (4) to the data will yield estimates ofµ ′
s(λ ) andγ(λ ) at one selected wavelength ifat least 3 fiber diameters are measured. However, analysis of measurements made in the pres-ence of absorption necessitate the estimation ofRo
SF over the spectral wavelength range prior toapplication of Eq. (4), a calculation that requires specification of a wavelength-dependent func-tion for µ ′
s(λ ) as well as specification of a set of chromophores and their molecular extinctioncoefficients contributing toµa(λ ), as will be discussed extensively in Section 4. One candi-date background scattering model in tissue is the Mie scattering relationship given in Eq. (5)[23, 24]. Instead of fitting the values forµ ′
s andγ for each wavelength separately, the intro-duction of a background scattering model as a spectral constraint allows to fitRo
SF(λ ) datameasured at multiple wavelengths and multiple fiber diameters simultaneously. In this case, themodel Eq. (4) can be rewritten in a matrix representation, as:
RoSF(λi ,d
jf iber)= ηlimit
(
1+0.63γ2i e
−2.31γ2i
(
a1(λiλ0
)a2)
d jf iber
)
((
a1(λiλ0
)a2
)
d jf iber
)0.57γi
2.31γ2i +
((
a1(λiλ0
)a2
)
d jf iber
)0.57γi
(7)wherei and j represent indices for sampledλ anddf iber, anda1, a2 andγi are free fit parame-
#150989 - $15.00 USD Received 13 Jul 2011; revised 9 Sep 2011; accepted 9 Sep 2011; published 26 Oct 2011(C) 2011 OSA 1 November 2011 / Vol. 2, No. 11 / BIOMEDICAL OPTICS EXPRESS 3155

ters. For example, for a simulated MDSFR tissue measurement comprising 11 wavelengthsλi
and 7 fiber diametersd jf iber, the data set consists of 77Ro
SF(λi ,df iber) values and the model towhich these data are fit (Eq. (7)) contains 13 free fit parameters (a1, a2 and 11γi values). TheMDSFR analysis algorithm estimatesµ ′
s(λ ) (or a1 anda2 in case of a spectrally constrainedfit) andγ(λ ) by minimizing the weighted residual error between the simulated and the modelestimatedRo
SF(λ ,df iber) for all included fiber diameters (and all included wavelengths incase of a spectrally constrained fit) simultaneously. The fitting routine utilized a Levenberg-Marquardt algorithm coded into a Matlab script (version R2009, MathWorks). Confidenceintervals of the estimated parameters were calculated from the square root of the diagonal ofthe covariance matrix, as described previously [25]. Note that an additional practical benefitgained from the spectrally resolved MDSFR analysis, is that the fit only requires 2 fiber diame-ters, as opposed to a minimum of 3 diameters ifµ ′
s(λ ) andγ(λ ) are fitted at a single wavelength.
2.4. MDSFR sensitivity analysis to fiber diameter set
Simulated MDSFR measurements for each of the 561 combinations of scattering propertieswere utilized to determine the accuracy ofµ ′
s(λ ) andγ(λ ) estimated at a single wavelength.In order to guide the design of the number and size of fibers to be included in MDSFRapproach, the accuracy of parameter estimates were evaluated by systematically removingreflectance intensities corresponding to individual fibers from each MDSFR measurement at asingle wavelength and calculating the resulting introduction of error. The accuracy of the fitwas analyzed A) when the range of fiber diameters is decreased by subsequently removingdata from larger fibers, B) when the range of fiber diameters is decreased by subsequentlyremoving data from smaller fibers, and C) when intermediate fiber diameters are removed,while maintaining data from the largest and the smallest fiber diameters. In all 3 of the abovecases, stochastic noise of 5% was introduced to the measured reflectance intensity data andthe fit procedure was repeated 100 times; mean residual errors between model estimates
and simulated values ofµ ′s and γ (calculated as 100%·
|µ ′sims −µ ′est
s |µ ′sim
sand 100%·
|γsim−γest|γsim ,
respectively) as well as standard deviations calculated from repeated sets of error estimates arereported throughout this paper.
To investigate the application of the MDSFR approach to spectral measurements in tissue, aspectrally resolved MDSFR analysis was conducted in the presence of wavelength-dependentchanges inγ(λ ). The relationship betweenγ and wavelength in tissue has not yet beenelucidated and therefore cannot be informed by any set of specified spectral constraints;while wavelength-dependent changes are expected [10], the exact form of these changes isunknown. To consider how different wavelength-dependent changes inγ may influence theMDSFR performance, 3 different scenarios were analyzed: I) assumingγ(λ ) constant overthe wavelength range, II) assumingγ(λ ) monotonically decreasing with wavelength, and III)assumingγ(λ ) random for each wavelength. In case I analysis was performed for each of the17 PF-specific scattering constructions of each of the 3 scattering sets, in case IIγ was variedfrom 1.9 to 1.4, andg1 values varied in the set∈ [0.95,0.9,0.8], across the 400− 900 nmwavelength range (with a 0.1 step decrease inγ per 100 nm, and a decrease ing1 introducedevery 200 nm), and in case III 10 data sets were constructed with randomly selectedγ andg1
values at each wavelength. These test scenarios were performed using information from all 7fiber diameters. The influence of reducing fiber diameters on the spectrally resolved calculation(with a specific focus on the error associated with probes containing 2 fiber diameters) wasperformed withγ(λ ) constant over the wavelength range.
#150989 - $15.00 USD Received 13 Jul 2011; revised 9 Sep 2011; accepted 9 Sep 2011; published 26 Oct 2011(C) 2011 OSA 1 November 2011 / Vol. 2, No. 11 / BIOMEDICAL OPTICS EXPRESS 3156
3. Results
3.1. Accuracy of single wavelength MDSFR analysis
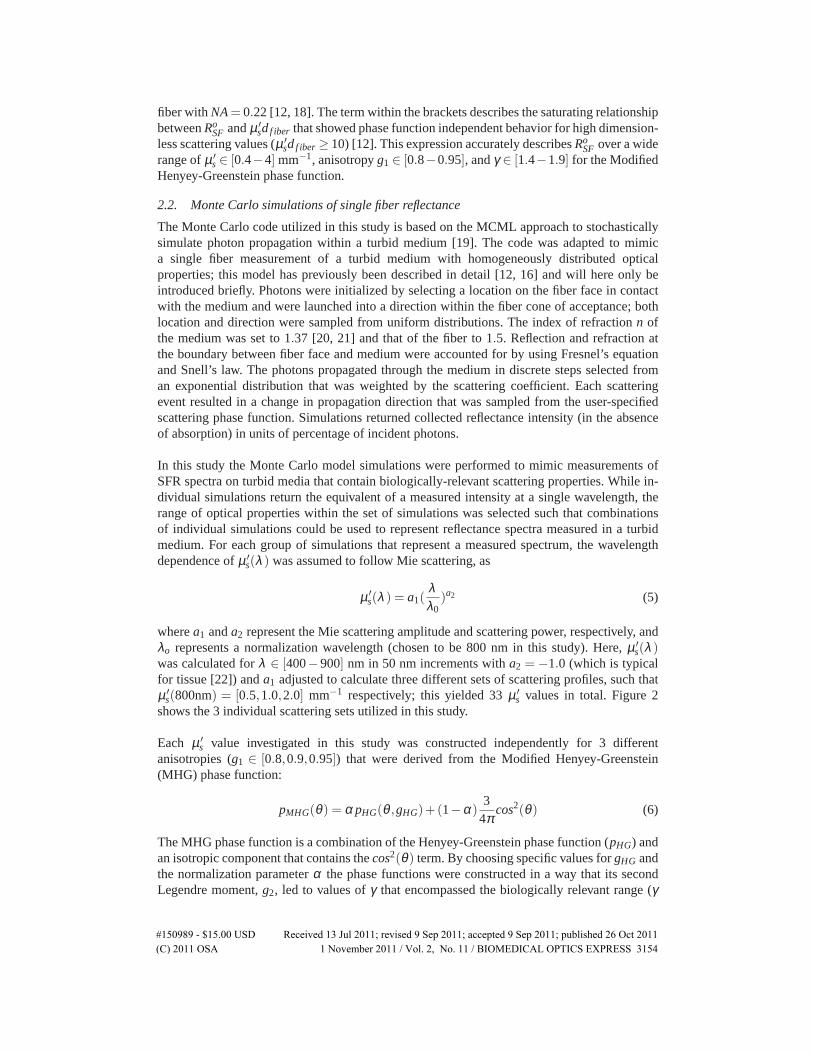
Figure 3a shows the SFR intensity vs. wavelength data for a MDSFR measurement with 7fiber diameters (range 0.2−1.5 mm) on a turbid medium withµ ′
s = 1 mm−1 at 800 nm (withthe wavelength dependence ofµ ′
s described by scattering set 2), withg1 = 0.8 andγ = 1.5at all wavelengths. Here, symbols differentiate between measurements made by different fiberdiameters. These data represent SFR intensity measured in the absence of absorption (Ro
SF).The MDSFR method utilizes theRo
SF(λ ) vs. df iber relationship measured at each individualwavelength to extract estimates for bothµ ′
s(λ ) andγ(λ ). Figure 3b shows theRoSF(λ ) vs.df iber
relationship at 800 nm; simulated data are fit to Eq. (4). MDSFR analysis yields estimates ofreflectance intensity in good agreement with simulated data (visualized on the graph), and alsoyields estimates ofµ ′
s(800nm)andγ(800 nm), which are respectively given as 0.99 mm−1 (truevalue of 1.0 mm−1) and 1.46 (true value of 1.5).
a) b)
Fig. 3. a) Simulated MDSFR reflectance measurements for 7 fiber diameters as a functionof wavelength, and b) simulated and fitted reflectance at a single wavelength (800 nm) as afunction of fiber diameter.
The MDSFR single wavelength analysis was applied to all simulated combinations of scatteringproperties. Figure 4 shows the comparison of estimated vs. simulated values forµ ′
s andγ; thesecalculations utilized all 7 simulated fiber diameters in the MDSFR fitting procedure. Here,both scattering parameters were accurately estimated over a wide range of reduced scatteringcoefficients (0.4 < µ ′
s < 4 mm−1) and for all 17 phase functions and for all 11 wavelengths(λ = [400−900 nm]) with an average mean residual error forµ ′
s of 4.9% and forγ of 2.5%.
3.2. Sensitivity of single wavelength MDSFR analysis to fiber diameter set
This study characterized the sensitivity of scattering parameter estimates to the fiber diametersincluded in the MDSFR analysis. In Fig. 5 the abscissa of the graphs denotes the combinationsof fiber diameters that contribute to the fitted MDSFR analysis and the ordinate denotes themean residual error of eitherµ ′
s or γ. The colors of the bars denote the scattering ranges with redcorresponding to scattering set 1 (rangeµ ′
s=[0.4 - 1] mm−1), green corresponding to scatteringset 2 (rangeµ ′
s=[0.9 - 2] mm−1), blue corresponding to scattering set 3 (rangeµ ′s=[1.8 -
4] mm−1) and cyan corresponding to the entire data set (Fig. 2). The error bars display thestandard deviation of the 100 repetitioned fits with a random noise of 5% introduced to the data.
#150989 - $15.00 USD Received 13 Jul 2011; revised 9 Sep 2011; accepted 9 Sep 2011; published 26 Oct 2011(C) 2011 OSA 1 November 2011 / Vol. 2, No. 11 / BIOMEDICAL OPTICS EXPRESS 3157

a) b)
100
101
100
101
µ’s real
µ’s e
st
R2 = 0.9921
1.2 1.4 1.6 1.8 2 2.2
1.2
1.4
1.6
1.8
2
2.2
γreal
γest
R2 = 0.9273
Fig. 4. a) MDSFR estimated vs. simulatedµ ′s, and b) MDSFR estimated vs. simulatedγ for
the entire data set for all 11 wavelengths (λ = 400−900 nm). Calculations utilized 7 fiberdiameters in the fitting procedure in the rangedf iber ∈ [0.2−1.5]mm.
Figures 5a and b show the influence of removing large fiber diameters from the 7 fibersincluded in the full MDSFR data set on the mean residual error inµ ′
s and γ, respectively.Conversely, Figs. 5c and d display the effect of removing small fibers. The first set of columnsin panels a-f show the case when all fibers are included into the fitting routine. It is observedthat the mean residual error ofµ ′
s is highest for scattering set 1 (lowest scattering); the errorin µ ′
s estimation increases substantially for these low scattering coefficients when large fibersare subsequently removed from the dataset, as observed in Fig. 5a. The effect of fiber removalon estimation ofγ follows a similar trend (see Fig. 5b). Alternatively, when small fibers areremoved from the basis set of fibers included in the MDSFR fitting routine, the resulting meanresidual error forµ ′
s approaches 12% for all scattering sets, as shown in Fig. 5c; this erroris substantially less than the case when larger fibers were removed, which depended on themagnitude ofµ ′
s and approached 60% for the low scattering set (set 1). For the removal ofsmall fibers, the mean residual error inγ increased for all data from 3% to 7%, and also showedan increased error associated with high scattering samples, given as scattering set 3; this isvisualized in Fig. 5d. Such a result is consistent with the understanding that measurements ofSFR intensity in samples with highµ ′
sdf iber become independent ofγ [12].Panels e and f of Fig. 5 describe the influence of removing intermediate fiber diameters fromthe MDSFR fiber set. In this case each analysis retained fiber diameters of 0.2 and 1.5 mm,while differing quantities of the intermediate fibers were randomly removed. Inspection ofpanels e-f show a minimal influence of the removal of the intermediate fibers on MDSFRperformance, with very minor changes to the mean error observed for either the entire dataset or each individual scattering set. This behaviour was maintained when the simulatedmeasurement noise level was increased from 5% to 10% or 20%; in these cases the meanresidual error increased similarly for all fiber combinations and scattering sets (data notshown). These results indicate that the accuracy ofµ ′
s andγ estimates are influenced by therange of diameters, and in turn the range ofµ ′
sdf iber, included in the MDSFR analysis, and notthe quantity of the intermediate fibers.
#150989 - $15.00 USD Received 13 Jul 2011; revised 9 Sep 2011; accepted 9 Sep 2011; published 26 Oct 2011(C) 2011 OSA 1 November 2011 / Vol. 2, No. 11 / BIOMEDICAL OPTICS EXPRESS 3158

a) b)
c) d)
e) f)
Fig. 5. Effect of different fiber diameter combinations on the mean residual error ofµ ′s
andγ estimated by single wavelength MDSFR analysis. a) and b) shows subsequent re-moval of large fibers; all remaining smaller fibers were included. c) and d) shows subse-quent removal of small fibers; all remaining larger fibers were included. e) and f) showsremoval of intermediate fibers; reflectance data from 0.2 mm and 1.5 mm fibers werealways included. Note the difference in y-axis scale between panels a and b-f. Scatte-ring set 1:µ ′
s = 0.4− 1.0 mm−1; scattering set 2:µ ′s = 0.9− 2.0 mm−1; scattering set
3: µ ′s = 1.8−4.0 mm−1.
#150989 - $15.00 USD Received 13 Jul 2011; revised 9 Sep 2011; accepted 9 Sep 2011; published 26 Oct 2011(C) 2011 OSA 1 November 2011 / Vol. 2, No. 11 / BIOMEDICAL OPTICS EXPRESS 3159

aI aII aIII
400 500 600 700 800 9000
0.2
0.4
0.6
0.8
1
1.2
1.4
1.6
wavelength [nm]
Ref
lect
ance
[%]
400 500 600 700 800 9000
0.2
0.4
0.6
0.8
1
1.2
1.4
1.6
wavelength [nm]
Ref
lect
ance
[%]
400 500 600 700 800 9000
0.2
0.4
0.6
0.8
1
1.2
1.4
1.6
wavelength [nm]
Ref
lect
ance
[%]
bI bII bIII
0 0.5 1 1.5 20
0.5
1
1.5
2
dfiber
Ref
lect
ance
[%]
d
fib=0.2 mm
dfib
=0.3 mm
dfib
=0.4 mm
dfib
=0.6 mm
dfib
=0.8 mm
dfib
=1.0 mm
dfib
=1.5 mm
SFR model
0 0.5 1 1.5 20
0.5
1
1.5
2
dfiber
Ref
lect
ance
[%]
0 0.5 1 1.5 20
0.5
1
1.5
2
dfiber
Ref
lect
ance
[%]
cI cII cIII
400 500 600 700 800 9001.2
1.4
1.6
1.8
2
2.2
wavelength [nm]
γ
estimated γreal γ
400 500 600 700 800 9001.2
1.4
1.6
1.8
2
2.2
wavelength [nm]
γ
400 500 600 700 800 9001.2
1.4
1.6
1.8
2
2.2
wavelength [nm]
γ
dI dII dIII
400 500 600 700 800 9000
0.5
1
1.5
2
2.5
3
3.5
4
4.5
wavelength [nm]
µ’s
estimated µ’s
real µ’s
µ’s=a
1λa
2
a1=1.95
a2=1.17
400 500 600 700 800 9000
0.5
1
1.5
2
2.5
3
3.5
4
4.5
wavelength [nm]
µ’s
µ’s=a
1λa
2
a1=1.96
a2=1.05
400 500 600 700 800 9000
0.5
1
1.5
2
2.5
3
3.5
4
4.5
wavelength [nm]
µ’s
µ’s=a
1λa
2
a1=1.91
a2=1.15
Fig. 6. Example for spectrally resolved MDSFR fitting procedure using data from scatteringset3 (µ ′
s(800 nm) =2 mm−1): a) simulated MDSFR intensities for 7 fiber diameters, b)MDSFR intensity vs. fiber diameter for all wavelengths, c) estimated and simulatedγ as afunction of wavelength and d) estimated and simulatedµ ′
s as a function of wavelength forI) wavelength independentγ andg1, II) wavelength dependentγ andg1 and III) randomγandg1.
#150989 - $15.00 USD Received 13 Jul 2011; revised 9 Sep 2011; accepted 9 Sep 2011; published 26 Oct 2011(C) 2011 OSA 1 November 2011 / Vol. 2, No. 11 / BIOMEDICAL OPTICS EXPRESS 3160

3.3. Accuracy of spectrally-resolved MDSFR analysis
Figures6a-I, -II and -III showRoSF(λ ) vs. wavelength data for MDSFR measurements with
7 fiber diameters (range 0.2− 1.5 mm) on a turbid medium withµ ′s = 2 mm−1 at 800 nm
(with the wavelength dependence ofµ ′s described by scattering set 3). In Fig. 6a-I,γ andg1
are constant across all wavelengths, withg1 = 0.9 andγ = 1.9. In Fig. 6a-II, the specifiedPF varies across the 400− 900 nm wavelength range, withγ varied from 1.9 to 1.4 andg1
values varied in the set∈ [0.95,0.9,0.8]. In Fig. 6a-III, g1 and γ were randomly selectedfor each wavelength. Figures 6b-I, -II and -III showRo
SF vs. fiber diameter for these sets ofMDSFR measurements. Application of the spectrally resolved MDSFR fitting method to thesemeasurements yields estimates of reflectance intensity in good agreement with simulated data(visualized on the graph), leading to estimates ofγ at each analyzed wavelength, and estimatesof scattering model parametersa1 anda2 from Eq. (7). The simulated and fitted wavelengthprofiles ofγ(λ ) andµ ′
s(λ ) are displayed in Figs. 6c and 6d, respectively.
To investigate the potential utility of the MDSFR approach to analyze spectral measurementsin tissue, it is important to determine the influence that an unknown and potentially wavelength-dependent PF (andγ) may have on the estimated scattering properties. The spectrally resolvedMDSFR approach was evaluated on sets of MDSFR measurements with I)γ andg1 fixed, II)γ(λ ) andg1(λ ) decreasing monotonically with wavelength, and III)γ(λ ) andg1(λ ) completelyrandomized; details of these sets are described in Section 2.4. The results for these cases areshown in Fig. 7. For all three cases bothµ ′
s(λ ) andγ(λ ) were accurately estimated from thewhole dataset, with mean residual errors of≤ 5% for µ ′
s and of≤ 3% for γ.
3.4. Sensitivity of spectrally-resolved MDSFR analysis to fiber diameter set
The sensitivity of the spectrally resolved MDSFR approach to the variation in the quantity andcombination of fiber diameters was investigated. The error profiles resulting from the analysis,described in Section 2.4, were similar to the error profiles presented for the single-wavelengthMDSFR analysis in Fig. 5 (data not shown). The novel aspect of investigating the sensitivityof the spectrally resolved MDSFR approach to fiber diameter set is the case involving 2 fiberdiameters. In this analysis, pairs of fibers were considered with the the smallest fiber diameterspecified for all pairs as 0.2 mm and the larger fiber selected from different diameters. The meanresidual errors for this analysis are shown in Fig. 8. Here, combinations of small fiber diametersare associated with increased error; this trend is substantially increased for measurements inthe low scattering regime (set 1). Interestingly, measurements of the high scattering case (set 3)yielded accurate estimates even for measurements with the 0.2 and 0.3 mm fiber combination.These results highlight the finding that error in the estimated scattering properties is dependenton the range of dimensionless reduced scattering values included within the MDSFR analysis.
4. Discussion
This study investigated the sensitivity ofµ ′s(λ ) andγ(λ ) estimated by MDSFR to the choice of
fibers included in the analysis and to the incorporation of spectral information into the fittingalgorithm. Results indicate thatµ ′
s(λ ) andγ(λ ) estimates are sensitive to the range of fiber di-ameters but not the quantity of intermediate fibers. Results also show that the MDSFR approachdoes not require anya priori knowledge of the PF within the sampled medium.
#150989 - $15.00 USD Received 13 Jul 2011; revised 9 Sep 2011; accepted 9 Sep 2011; published 26 Oct 2011(C) 2011 OSA 1 November 2011 / Vol. 2, No. 11 / BIOMEDICAL OPTICS EXPRESS 3161

I a) I b)
100
101
100
101
µ’sreal
µ’ses
t
1.2 1.4 1.6 1.8 2 2.2
1.2
1.4
1.6
1.8
2
2.2
γreal
γest
II a) II b)
100
101
100
101
µ’s real
µ’s e
st
1.2 1.4 1.6 1.8 2 2.2
1.2
1.4
1.6
1.8
2
2.2
γreal
γest
III a) III b)
100
101
100
101
µ’s real
µ’s e
st
1.2 1.4 1.6 1.8 2 2.2
1.2
1.4
1.6
1.8
2
2.2
γreal
γest
Fig. 7. Spectrally resolved MDSFR fitting procedure: a) estimated vs. realµ ′s; b) estimated
vs. realγ for I) wavelength independentγ and g, II) wavelength dependentγ andg1 andIII) random γ andg1. The analysis was performed over the whole dataset including all 3scattering ranges and all 11 wavelengths (λ = 400−900 nm).
#150989 - $15.00 USD Received 13 Jul 2011; revised 9 Sep 2011; accepted 9 Sep 2011; published 26 Oct 2011(C) 2011 OSA 1 November 2011 / Vol. 2, No. 11 / BIOMEDICAL OPTICS EXPRESS 3162

a) b)
0.2+1.5 0.2+1.0 0.2+0.8 0.2+0.6 0.2+0.4 0.2+0.30
10
20
30
40
50
60
70
80
mea
n residu
al e
rror
of
' s [%
]
fiber combinations [mm]
scatteringset 1 scatteringset 2 scatteringset 3 average
0.2+1.5 0.2+1.0 0.2+0.8 0.2+0.6 0.2+0.4 0.2+0.30
2
4
6
8
10
mea
n residu
al e
rror
of
[%]
fiber combinations [mm]
scatteringset 1 scatteringset 2 scatteringset 3 average
Fig. 8. Sensitivity of spectrally resolved MDSFR estimates of a)µ ′s and b)γ to the choice
of fiber diameters within a 2 fiber MDSFR probe. Data from all 11 wavelengths (λ =400−900 nm) were included.
4.1. Influence of fiber diameters included in MDSFR analysis
This study investigated the influence of the number and diameter of fibers included in theMDSFR analysis on the accuracy of estimated scattering parameters. One unique aspect of theMDSFR analysis is that SFR intensity depends onµ ′
sdf iber, an important factor that indicatesthat the theory can be applied interchangeably to different sets and combinations of fiberdiameters. Results indicated that the accuracy ofµ ′
s and γ estimates depends on the rangeof fiber diameters included in the analysis; specifically the range ofµ ′
sdf iber is important.This finding is supported by the high degree of accuracy inµ ′
s andγ estimates obtained fromMDSFR analysis that included 7 fibers over the range of diameters[0.2− 1.5] mm for all 3scattering sets investigated (as shown in Fig. 5). It is observed that reduction in the range offibers introduced error, with substantial increases in error associated with measurement ofsmall scattering coefficients by combinations of small diameter fibers (as evident in Figs. 5a-b).Interestingly, the presence of intermediate fibers did not alter error in parameter estimates.These observations lead to the following heuristic guidelines: for tissues with medium to highscattering coefficients (µ ′
s > 1 mm−1), an MDSFR measurement with a relatively limitednumber of small fiber diameters suffices to accurately extractµ ′
s andγ, while for tissues withlow scattering coefficients (µ ′
s < 1 mm−1) larger fiber diameter measurements need to beincluded in the data set to accurately extractµ ′
s and (to a lesser extent)γ. These heuristicguidelines can be used to evaluate the performance of potential MDSFR devices designedfor specific clinical application areas,e.g. MDSFR devices compatible with endoscopicapplications, where the largest allowable single fiber included in the MDSFR measurement isdf iber < 2 mm, or MDSFR devices compatible with Fine Needle Aspiration (FNA) procedures,where the MDSFR technique is performed through the lumen of an FNA needle and the largestsingle fiber included in the MDSFR measurement isdf iber < 0.45 mm. The sensitivity resultsindicate that for endoscopic applications,µ ′
s andγ can be extracted with an accuracy of betterthan 10% by using 0.2 mm and 1.5 mm fibers while employing a spectrally resolved MDSFRfitting procedure; it is possible to perform a wavelength independent assessment ofµ ′
s andγ ifintermediate fiber diameters are included in the MDSFR measurement. For FNA applications,
#150989 - $15.00 USD Received 13 Jul 2011; revised 9 Sep 2011; accepted 9 Sep 2011; published 26 Oct 2011(C) 2011 OSA 1 November 2011 / Vol. 2, No. 11 / BIOMEDICAL OPTICS EXPRESS 3163

µ ′s andγ can be extracted with an accuracy of better than 20% and 10%, respectively, as long
asµ ′s > 1 mm−1. If µ ′
s < 1 mm−1, the accuracy inµ ′s estimation reduces dramatically, while
retaining the high accuracy ofγ estimation. The clinical importance of the reported errorsdepends on the biology of the intended clinical application, e.g. on the difference between thescattering properties of healthy and (pre)malignant tissues.
4.2. Assessment of model error
Inspection of MDSFR estimates ofµ ′s and γ show increased error in the low dimensionless
scattering regime, an increase that is attributable to model error. Inspection of the formulationof Eq. (4) shows two potential sources or error: first, the fitted coefficients reported in Eq. (4)were informed by a wide range of reduced scattering coefficients ([0.1−200]mm−1), such thatSFR data in the lowµ ′
sdf iber regime, where PF has the greatest influence on the SFR intensity,represented a subset of the total fitted parameter space [12]. Second, the characterization of thePF influence on SFR intensity was expressed concisely in terms of a single parameterγ [13].While the resulting formulation of Eq. (4) yields high quality estimates ofµ ′
s over a wide rangeof values, it is possible that higher order moments of the PF exclusively contribute to SFRintensity at lowµ ′
sdf iber. These model errors can be minimized by simulating measurementsthat resample the SFR intensity at lowµ ′
sdf iber values and re-evaluate the fitted coefficients inEq. (4). However, such an analysis is beyond the scope of the current paper and will be thefocus of future work.
4.3. Comparison of MDSFR analysis at a single wavelength or multiple wavelengths: influ-ence of absorption
This study utilized two approaches to analyze MDSFR measurements: (1) a single wavelengthMDSFR analysis, which extractsµ ′
s andγ independently for each wavelength; (2) a spectrally-resolved MDSFR analysis that utilizes prior knowledge of the wavelength dependence ofµ ′
s asa constraint to fitµ ′
s andγ over a selected wavelength range. Comparison of sensitivity resultsfrom each method showed similar levels of accuracy in estimated parameter values; however,proper application of these methods to measurements of tissue requires careful considerationof the underlying assumptions.
The single-wavelength MDSFR analysis requires the measured reflectance intensity to bemade in the absence of absorption; this is important because the influence of absorption on theSFR intensity will affect the reflectance measured by each fiber diameters differently, as SFRphoton path length depends on the fiber diameter [16]. Note that the influence of absorptionon SFR intensity cannot be resolved at a single wavelength. For measurements in tissue, thesingle wavelength MDSFR analysis may still be valid if performed at a wavelength wherebackground absorption due endogenous chromophores (e.g.blood) is minimal. ConsideringMDSFR measurements in tissue, containing vascular parameters of 2% blood volume fractionand 70% microvascular saturation, analysis at a wavelength of 800 nm would introduce onlya 0.5% and 2.6% attenuation of the measured reflectance of the 0.2 mm and 1.5 mm fibers,respectively. This would result in only small increases of the error in estimation ofµ ′
s andγ(from 6.0% to 6.2% and 2.57% to 2.63%, respectively). However, the associated error willdepend on the actual blood content, oxygenation, wavelength as well as scattering coefficient;factors that cannot be resolved at a single wavelength.
The wavelength constrained MDSFR method can extractµ ′s and γ values over the whole
#150989 - $15.00 USD Received 13 Jul 2011; revised 9 Sep 2011; accepted 9 Sep 2011; published 26 Oct 2011(C) 2011 OSA 1 November 2011 / Vol. 2, No. 11 / BIOMEDICAL OPTICS EXPRESS 3164

wavelength range even in presence of strong absorption. As we have described previously[16, 12, 17], the SFR spectrum in the presence of absorptionRSF in its most general formcan be described by combining Eqs. (2)-(4):
RSF = ηlimit (1+ρ3e(−ρ1µ ′sdf iber))
[
(µ ′sdf iber)
ρ2
ρ1 +(µ ′sdf iber)ρ2
]
e(−µtissuea 〈LSF〉) (8)
〈LSF〉 =df iberCPF1.54
(µ ′sdf iber)0.18(0.64+(µadf iber)0.64)
(9)
Note that the general form of Eq. (4), which is valid for a wider range of phase functionsthan the MHG phase function utilized in this paper, contains phase function dependent parame-ters[ρ1,ρ2,ρ3] and does not express these parameters in terms ofγ [12]. Furthermore, the pathlength Eq. (9) contains a phase function dependent constantCPF. We have previously reportedthat substituting the parameter set[ρ1,ρ2,ρ3,CPF] by the values [6.82, 0.97, 1.55, 0.944] en-ables accurate extraction ofµ tissue
a from SFR spectra measured in turbid media withouta prioriknowledge of eitherµ ′
s or phase function [17]. The tissue absorption coefficientµ tissuea is the
sum of the absorption coefficients of all the chromophores present in the interrogation volume,which can be written as:
µ tissuea = ∑
k
ckεk (10)
Here ck and εk are the concentration and extinction coefficient, respectively, of absorbingmolecules (indexk) such as oxyhemoglobin, deoxyhemoglobin, bilirubin, beta-carotene, lipidsand water. Note that Eq. (10) may be modified to contain correction factors for the inhomoge-neous distribution of absorbing molecules such as blood [26]. Application of Eqs. (8) and (9)to SFR spectra measured by each independent fiber diameter returns estimates ofck specific foreach sampled fiber. While this calculation requires the specification of a background scatteringmodel, it is important to note that the fit returnsµ tissue
a independent of fitted scattering param-eters. The resulting absorption coefficient estimates can be used to estimate reflectance spectrain the absence of absorptionR0
SF(df iber), as
R0SF(df iber) =
RSF(df iber)
e(−µtissuea 〈LSF〉)
(11)
Finally, the MDSFR fitting routine as described in Section 2.3 can be applied toR0SF to obtain
estimates forµ ′s andγ over the whole wavelength range.
For the case where absorbers are distributed heterogeneously (e.g., layered tissue), the abovecalculation will allow fiber diameter specific estimation ofµ tissue
a , that may be necessary due toslightly different sampled volumes between fiber diameters [16]; it is important to note that theMDSFR calculation assumes that scattering properties do not substantially differ between thesampled volume(s); the validity of this assumption will be investigated in future work.
We would like to emphasize that broadband MDSFR measurements of reflectance spectraof tissue in the ultraviolet-visible (UV-VIS) wavelength range will require spectrally resolvedanalysis that introduces spectral constraints regarding the form of wavelength-dependentchanges inµ ′
s. Previous investigations that characterizedµ ′s vs. wavelength in the UV-VIS
range in tissue identified the presence of a combination of Mie and Rayleigh scattering that issufficiently described by a power-law function. However, the specification of the backgroundmodel structure is a potential limitation to the general use of the MDSFR technique, as theextracted scattering information is not allowed to deviate from the specified functionality; thisconstraint may prevent identification of subtle wavelength-dependent influences of scattering
#150989 - $15.00 USD Received 13 Jul 2011; revised 9 Sep 2011; accepted 9 Sep 2011; published 26 Oct 2011(C) 2011 OSA 1 November 2011 / Vol. 2, No. 11 / BIOMEDICAL OPTICS EXPRESS 3165
on the reflectance signal. The appropriateness of the background scattering model becomesincreasinglyimportant for MDSFR measurements made with very small fibers, includingdiameters smaller than those investigated in the current study, where the collected signal willcontain an increasingly dominant non-diffuse component; these issues will be addressed infuture studies.
5. Conclusion
MDSFR provides a method to accurately determine bothµ ′s(λ ) and the parameter characterized
by the first two moments of the PF,γ(λ ), within a turbid medium; the approach was shown to bevalid over a broad range of optical properties that are representative of biological tissue. Resultspresented in this study identified the sensitivity of MDSFR estimates to the range of opticallysampledµ ′
sdf iber, and the insensitivity of model estimates to the quantity of intermediate fibersincluded in the analysis. Additionally, the MDSFR does not require anya priori knowledgeof the wavelength-dependent changes inγ. These results indicate that the MDSFR approachcan return a local quantitative assessment ofµ ′
s that is independent of the tissue PF. This is asubstantive improvement over many previous fiber optic approaches to estimatingµ ′
s at smallsource detector separations that did not elucidate the PF-influence on the collected reflectance[27, 28, 29, 30, 31, 32], and therefore, are likely to be less accurate in environments withunknown (or wavelength dependent) PF [4, 9, 7]. The MDSFR approach extracts informationabout bothµ ′
s and the PF from reflectance intensities measured over multiple length scales,in the form of multiple fiber diameters; the basis of this approach is similar to the spatially-resolved method described previously by Bevilacquaet al [6, 8]. Application of this approachto in vivo tissue may yield PF-information that provides novel insight into tissue morphologyand ultrastructure; information that may have potential diagnostic utility [10].
This study utilized simulated data to identify heuristic rules to guide the design of MDSFRfiber probes for specific clinical applications. Studies are ongoing that will validate the approachby experimental measurement in optical phantoms. Further work will investigate the effect ofinhomogeneous scattering distributions on MDSFR performance, and utilize the technique tocharacterize scattering properties in tissuein vivo.
#150989 - $15.00 USD Received 13 Jul 2011; revised 9 Sep 2011; accepted 9 Sep 2011; published 26 Oct 2011(C) 2011 OSA 1 November 2011 / Vol. 2, No. 11 / BIOMEDICAL OPTICS EXPRESS 3166


![Evaluation of a spectrally resolved scattering microscope · sis of biological tissue [12]. The contrast is given only by the scattering, so the technique is marker-free and no further](https://static.fdocuments.in/doc/165x107/60e2f3b7a2c35741795224cc/evaluation-of-a-spectrally-resolved-scattering-microscope-sis-of-biological-tissue.jpg)