Measurement of the orbital angular momentum density of light by
16
PAPER • OPEN ACCESS Measurement of the orbital angular momentum density of light by modal decomposition To cite this article: Christian Schulze et al 2013 New J. Phys. 15 073025 View the article online for updates and enhancements. You may also like Hollow-core photonic bandgap fibers for orbital angular momentum applications H Li, G Ren, Y Gao et al. - Characterization of off-axis phase singular optical vortex and its nonlinear wave- mixing to generate control broad OAM spectra A Srinivasa Rao - Discrete emitters as a source of orbital angular momentum R Liu, D B Phillips, F Li et al. - Recent citations Recent Advances in Generation and Detection of Orbital Angular Momentum Optical Beams—A Review Denis M. Fatkhiev et al - Analysis of misaligned optical rotational Doppler effect by modal decomposition You Ding et al - Menglin L.N. Chen et al - This content was downloaded from IP address 121.185.149.137 on 28/11/2021 at 09:38
Transcript of Measurement of the orbital angular momentum density of light by

PAPER • OPEN ACCESS
Measurement of the orbital angular momentumdensity of light by modal decompositionTo cite this article: Christian Schulze et al 2013 New J. Phys. 15 073025
View the article online for updates and enhancements.
You may also likeHollow-core photonic bandgap fibers fororbital angular momentum applicationsH Li, G Ren, Y Gao et al.
-
Characterization of off-axis phase singularoptical vortex and its nonlinear wave-mixing to generate control broad OAMspectraA Srinivasa Rao
-
Discrete emitters as a source of orbitalangular momentumR Liu, D B Phillips, F Li et al.
-
Recent citationsRecent Advances in Generation andDetection of Orbital Angular MomentumOptical Beams—A ReviewDenis M. Fatkhiev et al
-
Analysis of misaligned optical rotationalDoppler effect by modal decompositionYou Ding et al
-
Menglin L.N. Chen et al-
This content was downloaded from IP address 121.185.149.137 on 28/11/2021 at 09:38

Measurement of the orbital angular momentumdensity of light by modal decomposition
Christian Schulze1,4, Angela Dudley2, Daniel Flamm1,Michael Duparre1 and Andrew Forbes2,3,4
1 Institute of Applied Optics, Abbe Center of Photonics, Friedrich SchillerUniversity, Frobelstieg 1, D-07743 Jena, Germany2 Council for Scientific and Industrial Research, National Laser Centre, PO Box395, Pretoria 0001, South Africa3 School of Physics, University of KwaZulu-Natal, Private Bag X54001,Durban 4000, South AfricaE-mail: [email protected] and [email protected]
New Journal of Physics 15 (2013) 073025 (15pp)Received 22 March 2013Published 10 July 2013Online at http://www.njp.org/doi:10.1088/1367-2630/15/7/073025
Abstract. We demonstrate a versatile method for the measurement of theorbital angular momentum (OAM) density of an optical field. By performinga modal decomposition with digital holograms, we reconstruct the full opticalfield from a small set of single-point intensity measurements, from whichoptical vortices, global OAM and OAM density can be derived. We validate themethod on defined OAM-carrying beams yielding fidelities in the OAM densitymeasurement of up to 99%, and subsequently apply the technique to unknownfields from optical fibers.
S Online supplementary data available from stacks.iop.org/NJP/15/073025/mmedia
4 Authors to whom any correspondence should be addressed.
Content from this work may be used under the terms of the Creative Commons Attribution 3.0 licence.Any further distribution of this work must maintain attribution to the author(s) and the title of the work, journal
citation and DOI.
New Journal of Physics 15 (2013) 0730251367-2630/13/073025+15$33.00 © IOP Publishing Ltd and Deutsche Physikalische Gesellschaft

2
Contents
1. Introduction 22. Modal decomposition 33. Orbital angular momentum density 54. Investigation of Laguerre–Gaussian beams 6
4.1. Experimental setup . . . . . . . . . . . . . . . . . . . . . . . . . . . . . . . . 64.2. Results . . . . . . . . . . . . . . . . . . . . . . . . . . . . . . . . . . . . . . . 7
5. Investigation of fiber beams 115.1. Experimental setup . . . . . . . . . . . . . . . . . . . . . . . . . . . . . . . . 115.2. Results . . . . . . . . . . . . . . . . . . . . . . . . . . . . . . . . . . . . . . . 11
6. Summary and conclusion 12Acknowledgment 13References 13
1. Introduction
It is well understood that light carries both a linear and an angular momentum [1, 2], and whilethe linear momentum per photon is related to the light beam’s wavelength (hk), the angularmomentum per photon is an integer multiple of h [3]. The spin angular momentum componentof light’s total angular momentum has for long been associated with the polarization of light,and it was realized some 20 years ago that the orbital angular momentum (OAM) componentwas related to the spatial distribution of light [4]. Specifically, it was realized that the OAM ofa light field could be customized by selecting a field with an azimuthal phase distribution ofexp(ilφ), giving rise to an OAM of lh per photon. Such modes have been routinely generated inthe laboratory and used for a plethora of applications [5, 6], notably in optical tweezers [7–9],communication studies [10, 11] and at the single-photon level for realizing high-dimensionalentanglement [12–14]. As the latter necessitates the ability to measure multiple OAM statessimultaneously, there has recently been progress toward the detection of OAM modes of light.
There are several options available for the detection of single OAM modes: the ubiquitousdetection scheme involves operating the mode creation optics in reverse, e.g. the so-calledfork holograms, and then projecting into a detectable Gaussian mode [12], a method that hasseen an innovation recently by coupling vortex beams to plasmonic waves for detection [15].Other solutions have involved diffraction off apertures [16–18], where the signal returned isindicative of the OAM spectrum, but this also requires analysis of a full two-dimensional (2D)interference pattern. Methods based on the rotational frequency shift [19–21] also exist butare rather complex to implement, while recent work on dove prism interferometers suggestsa robustness for sorting odd and even OAM modes [22]. Recently, an efficient mode sorter[23, 24] has been proposed for the measurement of any OAM state as well as superpositionstates, and this has successfully been applied to Laguerre–Gaussian and Bessel OAM-carryingbeams and their superpositions [25, 26]. Such sorters are ideal for detecting the presence ofan OAM mode, even in a multimode field, but not for determining the intermodal phases ofsuperposition fields. Without this information it is not possible to infer from the measurementthe total OAM of the beam, nor the OAM density of the beam. Previous tools have considered
New Journal of Physics 15 (2013) 073025 (http://www.njp.org/)

3
very specialized field distributions to measure the OAM density, e.g. Bessel beams, but wouldnot be well suited to general fields with several modes involved [27].
In this paper, we demonstrate the measurement of the total OAM and OAM density of anarbitrary light field. We show that by modally decomposing the beam into an appropriate basisusing a digital hologram, one can infer from only a few single-point intensity measurements themodal weightings and phases of any superposition, from which the OAM properties of the beamare directly accessible. Such a tool is ideally suited to classical light fields where many photonsexist, and in particular to modal demultiplexing of OAM states in optical communicationapplications, either in free space or in fibers, and is considered to be of great significance inthe fields of novel imaging [28] and particle manipulation [29] studies. To this end, we illustratethe technique on optical fibers after validating it on the measurement of structured light createdwith digital holograms.
2. Modal decomposition
Modal decomposition is a powerful tool for the detailed investigation of laser fields. Everyoptical field can be conceived as quantized by a number of modes. Such modes may have aphysical presence as in the case of laser resonators [30] or optical fibers [31], which allow theoscillation or propagation of only discrete field distributions, the so-called modes. Alternatively,modes may merely be used as a different (mathematical) description of a laser field, allowing adetailed beam analysis, but without physical relevance of the mode content [32, 33].
Mathematically, any optical field can be expressed in terms of modes, which constituteorthogonal basis functions:
U(r) =
N∑l=1
cl9l(r) (1)
with r = (x, y) the spatial coordinates, cl = ρl ei1φl the complex expansion coefficient withamplitude ρl and intermodal phase 1φl (with respect to a reference phase), Ψl(r) the lth modefield, which can be vector valued, and N the number of modes. Beam intensity I (r) and phase8(r) are easily inferred from the modal amplitudes and phases via
I (r) = |U(r)|2, (2)
8 j(r) = arg[U j(r)
], (3)
where 8 j is the respective phase of the field component U j . The modal decomposition of alaser field as described by equation (1) can be performed all-optically using correlation filters[34, 35]. Such a filter performs a correlation of the incident field with modes that are encodedinto the filter, which allows us to measure the power and relative phase of each individualmode from an inner product measurement [36, 37]. This ability is based on the specific designof the transmission function of the holographic device that constitutes the correlation filter.This transmission function varies with the quantity that needs to be measured. Measuring thepower of a distinct mode requires the complex conjugate of that very mode to be encoded astransmission function [35]
Tl(r) = 9∗
l (r), (4)
New Journal of Physics 15 (2013) 073025 (http://www.njp.org/)

4
Figure 1. Scheme of the inner product measurement employing the correlationfilter, a 2f configuration and a camera. Exemplarily, the analysis of an in-phasesuperposition of equally weighted Laguerre–Gaussian modes LG0,4 + LG0,−4
is shown. Displaying transmission functions equal to LG∗
0,3 and LG∗
0,4 yieldscorrelation signals I0,3 and I0,4 as well as relative modal powers ρ2
0,3 and ρ20,4.
With the transmission functions superposed gratings enable signal separationfrom undiffracted light.
where ‘∗’ denotes the complex conjugation. Using this transmission function for performing theinner product measurement yields an intensity on the optical axis in the Fourier plane of thecorrelation filter that is ∝ ρ2
l . Hence, from a simple intensity measurement the power of a modecan be inferred.
Similarly, the unambiguous measurement of the phase difference of a mode to a chosenreference mode 1φl necessitates encoding a superposition of the mode field with the referencefield into the match filter [35]:
T cosl (r) = [9∗
0 (r) + 9∗
l (r)]/√
2,
T sinl (r) = [9∗
0 (r) + i9∗
l (r)]/√
2.(5)
Accordingly, the intermodal phase 1φl can be calculated by [35]
1φl = − arctan
[2I sin
l − ρ2l − ρ2
0
2I cosl − ρ2
l − ρ20
], (6)
where I sinl and I cos
l depict the intensity signals from the inner product (phase) measurements.Physically, such filters can be implemented using a phase-only spatial light modulator(SLM) [34] or solid amplitude-only filters [35] by employing special coding techniques totransfer the complex-valued transmission function to a phase-only [38] or an amplitude-onlyfunction [39], respectively.
The procedure of the inner product measurement is shown schematically in figure 1.Consider e.g. a superposition of two equally weighted Laguerre–Gaussian modes (LG0,4 +LG0,−4)/
√2 with azimuthal orders of +4 and −4, but zero radial order, illuminating the
correlation filter. Displaying a transmission function T = LG∗
0,3 (e.g. encoded on an SLM) yieldsan intensity minimum at the center of the optical axis in the Fourier plane of the match filteras realized by a 2f setup and measured with a camera. Hence, the correlation signal I0,3 ∝ ρ2
0,3is zero. However, if the field of a mode is displayed as a transmission function that is actually
New Journal of Physics 15 (2013) 073025 (http://www.njp.org/)

5
contained in the beam, e.g. T = LG∗
0,4, a non-zero correlation signal appears, yielding a relativemodal power of ρ2
0,4 = 0.5 (cf figure 1).The correlation filter can only correlate scalar, i.e. homogeneously polarized, fields. In the
general case of vector beams with spatially varying polarization, a complete description of theoptical field U is provided by the subsequent analysis of the Cartesian field components Ux andUy , including the proper phase difference δ between them.
This can be done by determination of the Stokes parameters S0 . . . S3 of the beam, whichnecessitates six (assuming completely polarized light) modal decomposition measurementswith a quarter-wave plate and a polarizer in appropriate orientations in front of the hologram[40–42]:
S0 = |Ux |2 + |Uy|
2= I (0◦) + I (90◦),
S1 = |Ux |2− |Uy|
2= I (0◦) − I (90◦),
S2 = 2|Ux ||Uy| cos δ = I (45◦) − I (135◦),
S3 = 2|Ux ||Uy| sin δ = Iλ/4(45◦) − Iλ/4(135◦).
(7)
Each field transmitted by a quarter-wave plate and a polarizer is modally decomposed and thebeam intensity is reconstructed following equation (2). Accordingly, I (α) are the reconstructedintensities behind the polarizer at angular orientations α = 0◦, 45◦, 90◦, 135◦, and Iλ/4(α) denotetwo additional measurements with the polarizer placed at α = 45◦, 135◦ behind a precedingquarter-wave plate. Performing the depicted six modal decompositions, information on theoptical field is complete, including amplitude, phase and polarization distribution.
3. Orbital angular momentum density
As shown in the previous section, modal decomposition using a correlation filter yieldscomplete information about the optical field. Hence, the Poynting vector distribution P(r) canbe calculated by [32]
P(r) =1
2<
[i
ωε0ε−1(r)[∇ × U(r)] × U∗(r)
](8)
for vector fields U, and by [43]
P(r) =ε0ω
4
[i(U∇U ∗
− U ∗∇U ) + 2k|U |
2ez
](9)
for scalar fields U , where ω is the angular frequency, ε is the permittivity, ε0 is the permittivityof vacuum, k = 2π/λ is the wave number and ez is the z-direction. From the Poynting vector,the OAM density is accessible from [44]
j = r ×Pc2
. (10)
Hence, the OAM density is measurable for both scalar and vector fields, using the modaldecomposition principle as outlined in section 2. In the following, only the z-component jz,which is of most relevance for application, is considered and termed ‘OAM density’.
New Journal of Physics 15 (2013) 073025 (http://www.njp.org/)
6
Figure 2. Experimental setup for the generation and characterization ofLaguerre–Gaussian beams of different order. HeNe: helium–neon laser; L: lens;M: mirror: SLM1,2: spatial light modulators; A: aperture; CCD1,2: CCD cameras;BS: beam splitter.
4. Investigation of Laguerre–Gaussian beams
Laguerre–Gaussian modes are well known to carry OAM, which has made them thepredominant object of investigation in recent years [5, 6]. Hence, they depict a well-suitedexample to prove the procedure for determining the OAM density as described in sections 2and 3.
4.1. Experimental setup
The experimental setup for measuring these defined OAM states consisted of a branch forbeam generation (A) and their subsequent analysis (B), as depicted in figure 2. To generatethe various Laguerre–Gaussian beams, for which we intended to calculate the OAM density, ahelium–neon laser (linearly polarized) was expanded through a telescope and directed onto thefirst SLM (reflective, HoloEye, PLUTO-VIS, 1920 × 1080 pixels of pitch 8 µm). By displayingthe respective mode fields on SLM1 using the coding technique as described in [34, 38],the corresponding beams were generated in the first diffraction order with the same linearpolarization as the seed laser. The beam plane of SLM1 was relay imaged through a beamsplitter (BS) to a near-field CCD camera directly recording the beam intensity, CCD2 (Spiricon,USB-SP620U), and a second SLM (SLM2, same specifications as SLM1), which was used toperform the inner product measurement to find the modal powers ρ2
l and intermodal phases1φl as described in section 2. An aperture in the Fourier plane of SLM1 was used to selectthe first diffraction order and block all the remaining ones. The diffracted field from SLM2
was Fourier transformed by a single lens in 2f configuration and the correlation signal wasdetected by CCD1 (PGR Scorpion, SCOR-20SOM). The modal decomposition was performedby displaying the transmission functions of equations (4) and (5) on SLM2 subsequently, andrecording the correlation signal in the Fourier plane at CCD1, which yields the modal powersρ2
l and phases 1φl , and hence the optical field (equation (1)), the Poynting vector (equations (8)and (9)) and the OAM density (equation (10)). Note that displaying the single transmissionfunctions in sequence, using the flexibility of the SLM, allows a large number of modes to betested, hence allowing the characterization of optical fields with high spatial frequencies. Thenumber of modes is limited for practical reasons by the measurement time and beam stability,and the weakness of the correlation signal, which needs to be distinguished from noise, in the
New Journal of Physics 15 (2013) 073025 (http://www.njp.org/)

7
Figure 3. Characterization of pure Laguerre–Gaussian modes. (a)–(d)Reconstructed intensity with transverse Poynting vectors, reconstructed phase,theoretical OAM density and measured OAM density, respectively, of an LG0,1
mode beam. (e)–(h) Same for the LG1,0 beam. OAM densities in N s m−2. Insetsin (a) and (e) depict measured beam intensities, respectively.
case of too many modes. For the following experiments, we decomposed the beam into as manyas 30 modes (three hologram patterns for each mode; see equations (4) and (5)) with a totalmeasurement time of about 10 s. The temporal effort can be reduced significantly by combiningthem in sequence measurements with the well-known angular multiplexing approach.
4.2. Results
To verify the procedure as described in sections 2 and 3, Laguerre–Gaussian beams of knownOAM density (calculable using equations (8) and (10)) were generated, which served asa reference to the modal decomposition results. Thereby, we decomposed the beam into abroad mode spectrum each time, pretending to not know which beam we were investigating.Since all Laguerre–Gaussian sample beams were generated with linear polarization, onedecomposition experiment was enough to determine the OAM density of each beam and theStokes measurement according to equation (7) was not necessary.
As a first example, a pure Laguerre–Gaussian mode LG0,1 was generated with SLM1, wherethe last-mentioned index indicates the order of the helical phase and the topological charge[6, 45]. To measure the mode content of this beam, Laguerre–Gaussian mode patterns with pranging from 0 to 2 and l ranging from −4 to 4 were displayed subsequently on SLM2 andthe correlation signals were measured. Accordingly, the purity of the LG0,1 mode amountsto 99.6% of relative mode power. Additionally, the intermodal phases were determined bydisplaying previously stated mode patterns in superposition with the LG00 mode (equation (5)),which served as the reference mode. Using equation (1), the optical field was reconstructedfrom the measured modal amplitudes and phases. Figure 3 depicts the results of the beamcharacterization: figure 3(a) shows the reconstructed intensity (equation (2)), which reveals
New Journal of Physics 15 (2013) 073025 (http://www.njp.org/)

8
the typical donut shape with an intensity minimum in its center indicating phase singularity.As an inset, the directly measured intensity (near field) reveals very good agreement with thereconstruction. Regarding the phase reconstruction of the beam (equation (3)) in figure 3(b), thehelical phase structure is clearly visible, proving the presence of phase singularity in the beamcenter.
Applying the procedure of section 3 to the beam under investigation, the Poynting vectorand OAM density are derived. In figure 3(a), the transverse components of the Poynting vectorare depicted as an arrow plot on top of the reconstructed intensity, revealing the spiralling naturefor a beam with an azimuthal phase structure [47, 48]. Figures 3(c) and (d) illustrate theoreticaland measured OAM densities for the beam under test. Both densities agree very well (a 2Dcorrelation coefficient of 99%) and resemble the intensity of the beam, which can be viewedas a characteristic of Laguerre–Gaussian beams and is a logical consequence of equations (9)and (10). Hence, similar to the intensity distribution, the OAM density is zero at the position ofthe phase singularity and increases to a ring-shaped maximum. Remarkably, the OAM densityis exclusively positive. However, this fact can be easily understood, considering that the z-component of the OAM density is proportional to the ϕ-component of the Poynting vector, andhence to the azimuthal index l (here l = +1), provided the beam carries a helical phase [43].Moreover, it becomes clear that our presented technique is capable of measuring the OAMdensity quantitatively. Here, the maximum is found to be 2.04 × 10⁻²² N s m−2.
The results of figure 3 show that a beam having a helical phase structure has a non-zero OAM density distribution, which mainly follows the intensity distribution. However,Laguerre–Gaussian beams with an azimuthal index l = 0 will have a vanishing ϕ-component ofthe Poynting vector Pϕ [43], and consequently a vanishing OAM density. To prove this relation,a Laguerre–Gaussian mode LG1,0 was generated and characterized analogously to the previousexperiment. The corresponding results are depicted in figures 3(e)–(h). Again, reconstructed andmeasured beam intensities correlate very well (figure 3(e)). The reconstructed phase distributionin figure 3(f) reveals the typical circular phase jump of π between the inner and outer beam parts.Figures 3(g) and (h) picture the measured and calculated OAM densities, which are both zero,which is reasonable, since the beam does not contain any azimuthal phase component.
Thus far the investigated beams have been single Laguerre–Gaussian modes. However,even more interesting with regard to the conservation of momentum and topological chargeare mode superpositions [45, 46]. By way of example, we examined a superposition of twoLaguerre–Gaussian beams LG0,1 + LG0,−2 e−iπ/3 with an intermodal phase shift of 1φ = −π/3.The results are depicted in figure 4. Reconstructed and measured intensities both reveal thethree-lobe structure formed by the interference of the two modes (figure 4(a)). The reconstructedphase distribution (figure 4(b)) unveils four singularities: one in the beam center of topologicalcharge l = +1, and three symmetrically surrounding the center with an azimuthal separation of120◦, each having a charge of l = −1. The positions of the singularities are visible from thearrow plot of the transverse Poynting vector in figure 4(a) as well, which illustrates that thePoynting vector spirals around four rotation centers depicting the singularities (marked withred dots). It is interesting to note that in contrast to the total angular momentum, the numberof singularities and the total topological charge are not conserved when combining two OAM-carrying beams [45, 46]. The interference creates new features: whereas the separate beamscontain one singularity each, with charges +1 and −2, respectively, the combined beam exhibitsfour singularities and the total topological charge is −2. Hence both the number of singularitiesand the total charge are not additive.
New Journal of Physics 15 (2013) 073025 (http://www.njp.org/)

9
Figure 4. Characterization of a Laguerre–Gaussian beam LG0,1 + LG0,−2 e−iπ/3.(a) Reconstructed intensity and transverse Poynting vectors (red dots mark theposition of the phase singularities). (b) Reconstructed phase. (c) TheoreticalOAM density. (d) Measured OAM density. OAM densities in N s m−2. The insetin (a) depicts the measured beam intensity.
Figure 5. Rotation of the beam intensity (a) and of the OAM density (b)of the superposition LG0,1 + LG0,−2 ei1φ while changing the intermodal phasedifference 1φ = 0 . . . 2π yielding a rotation of 120◦. Rotation in full resolution,see movie 1 in the supplementary data (available from stacks.iop.org/NJP/15/073025/mmedia).
Figures 4(c) and (d) depict the measured and calculated OAM densities, which correlatewell by 92% (2D correlation coefficient). Since the azimuthal indices of the involved modes areof positive and negative sign (l = 1 and −2), the resulting OAM density exhibits positive andnegative values as well. Moreover, the structure of the OAM density resembles the triangularsymmetry of the intensity distribution with maxima in the vicinity of the phase singularities.
A generalization of the previously studied beam is achieved by introducing an arbitraryphase shift between the two modes LG0,1 + LG0,−2 ei1φ . As the intermodal phase difference isvaried from 0 to 2π by changing the phase pattern on SLM1, the beam rotates by 120◦ asvisible in figure 5, where 1φ was changed in steps of π/4. The full resolution video (steps ofπ/20) can be viewed in figure 5 (movie 1). At each step in the intermodal phase, a completemodal decomposition was performed to measure the OAM density. Accordingly, it can beseen that the beam intensity rotates in common with the OAM density. Regarding the phasestructure, the three singularities of charge −1 rotate around the singularity in the center withtopological charge +1. Figure 6 depicts the measured position of all four singularities as afunction of intermodal phase difference 1φ yielding a threefold helix around a static centralline, as determined by a tracking routine from the measured phase distributions. Projecting thesingularity movement onto the x–y plane (inset in figure 6), it becomes clear that the three outer
New Journal of Physics 15 (2013) 073025 (http://www.njp.org/)
10
Figure 6. Measured movement of the four phase singularities as a function ofthe intermodal phase shift 1φ in the superposition LG0,1 + LG0,−2 ei1φ. The insetdepicts the top view.
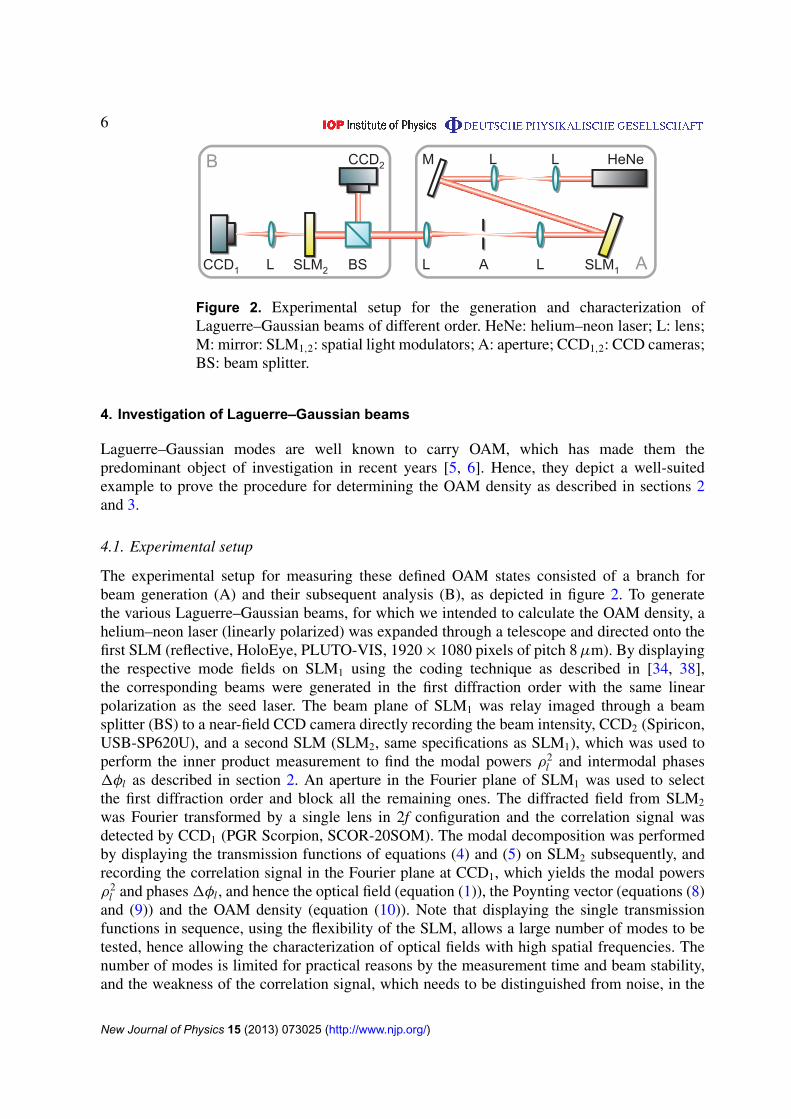
Figure 7. Characterization of a superposition of five Laguerre–Gaussian modesLG0,0 + LG1,1 eiπ/4 + LG2,2 eiπ/3 + LG2,0 eiπ/2 + LG0,2 eiπ . (a) Reconstructed inten-sity. (b) Reconstructed phase. (c) Theoretical OAM density. (d) Measured OAMdensity. OAM densities are in N s m−2. The inset in (a) depicts measured beamintensity.
singularities do not move on a circle, but more on a curve resembling a contour line stretchedaround the three intensity lobes of the beam.
A more complicated example, depicting an arbitrary mode superposition, is shown infigure 7, where five Laguerre–Gaussian modes have been superposed, LG0,0 + LG1,1 eiπ/4 +LG2,2 eiπ/3 + LG2,0 eiπ/2 + LG0,2 eiπ , each with a distinct intermodal phase, yielding anasymmetric beam profile, and a phase distribution that contains four singularities. Again, itcan be seen that the total topological charge is not additive, as is the number of singularities.
The uncertainty of the OAM measurements can be inferred from the uncertainty in themeasurement of modal amplitudes and phases, which are known from statistical evaluations toamount to 1% of total power and to 5◦ in terms of the modal phase. Accordingly, the OAM errordepends on the number of modes and on the mode fields involved in the superposition, yieldinga value for the above cases of about 0.2 × 10⁻²² N s m−2, averaged over the beam diameter.
New Journal of Physics 15 (2013) 073025 (http://www.njp.org/)

11
Figure 8. Experimental setup for measuring the OAM density of a fiber beam.HeNe: helium–neon laser; L: lens; MCF: multicore fiber; QWP: quarter-waveplate; P: polarizer; BS: beam splitter; CGH: computer-generated hologram;CCD1,2: CCD cameras. Insets depict the modes and a cross section of the fiber.
5. Investigation of fiber beams
The comparison of the measured OAM densities with those expected for the artificiallygenerated reference beams proved that the presented technique yields accurate results regardingshape and absolute scale. Hence, the method can be applied to unknown laser beams, for whichno reference can be provided. Suitable examples are beams emerging from optical multimodefibers, which have been studied to generate controllable OAM states [49, 50]. Instead ofprogramming modes and mode superpositions on a separate SLM for beam generation, theoptical field is here created naturally by multimode interference inside the fiber, generallyyielding complex phase and polarization properties.
5.1. Experimental setup
Correspondingly, the experimental setup was changed according to figure 8. As a beam source, amultimode fiber with 19 hexagonally arranged cores embedded in a common cladding material(single core diameter 2.2 µm, core-to-core distance 5.5 µm, single core numerical apertureNA = 0.108) and guiding ten transverse modes was seeded with the fundamental Gaussianbeam of a helium–neon laser (λ = 633 nm). The modes of the fiber and a microscope imageof its end facet under white light illumination are illustrated in figure 8 as insets. The fiberoutput was relay imaged (4f imaged) to the correlation filter, which in this experiment was astatic binary amplitude-only computer-generated hologram (CGH), as used by Kaiser et al [35],and necessitating a different coding technique [39]. Since the fiber under test generally createsfields with spatially varying polarization, we measured all the Stokes parameters of the beam asdescribed by equation (7), employing a quarter-wave plate and a polarizer, yielding completeinformation on the vector field including amplitude, phases and polarization. As in the previousexperiments with Laguerre–Gaussian beams, a 2f setup behind the CGH (previously SLM)enabled the correlation measurement with a CCD camera (CCD1). Again, a beam splitter infront of the hologram and a second CCD camera (CCD2) provided direct recording of the beamintensity.
5.2. Results
Figure 9 illustrates an example of a fiber beam consisting of 10% LP0,1, 4% LP1,1,e, 2%LP1,1,o, 39% LP2,1,e, 31% LP2,1,o, 5% LP0,2, 4% LP3,1,e and 2% LP3,1,o. As outlined by
New Journal of Physics 15 (2013) 073025 (http://www.njp.org/)

12
Figure 9. Characterization of a fiber beam consisting of a superposition often modes of a multicore fiber (10% LP01, 4% LP11e, 2% LP11o, 39% LP21e,31% LP21o, 5% LP02, 4% LP31, 2% LP31). (a) Measured near-field intensity.(b) Reconstructed phase structure of the x-component of the field. (c) Recon-structed phase structure of the y-component of the field. (d) Measured OAMdensity. The inset in (a) depicts measured beam intensity.
figure 9(a), the reconstructed beam intensity reveals good agreement with the direct intensitymeasurement. Note that both intensities represent the sum of intensities recorded in the x-and y-polarization directions as selected with the polarizer (cf figure 8). Figures 9(b) and (c)depict the reconstructed phase distributions in the x- and y-directions, containing multiple phasesingularities and phase steps. The reconstructed OAM density, illustrated in figure 9(d), revealsmany hot spots that are located at the positions of the single cores. This is reasonable, since theOAM density is proportional to the gradients of the field in the x- and y-directions [45], whichare largest at the interfaces of the cores with the common fiber cladding. Hence, dipole-likeOAM structures appear at the core positions. Apparently, the OAM density is much larger thanin the previous cases, of the order of 1 × 10⁻¹¹ N s m−2. This is a logical consequence of themuch smaller dimension of the beam, which is roughly extended to within a diameter of 25 µm.
6. Summary and conclusion
In summary, we have demonstrated a novel measurement system to quantify the OAM densityof light. The technique is based on correlation filters to perform a modal decompositionwith subsequent reconstruction of the optical field, which allows one to derive the Poyntingvector and the OAM density using a simple relationship. The method stands out due to itseasy setup, necessitating only an appropriate hologram, a lens and a single point detector.Laguerre–Gaussian beams of different orders were generated with an SLM and served asreference beams of known OAM density to validate the technique. Both measured andtheoretically expected OAM densities are in very good agreement, hence proving the accuracyof the technique, yielding measurement fidelities of up to 99%. As an application case, themethod was used to characterize a vector beam emerging from a multimode optical fiber. Inconsequence, the correlation filter method is easily applicable to scalar and vector fields andallows the characterization of the OAM density in an easy and fast manner. Accordingly, thepresented technique depicts a versatile tool in many OAM-based applications, such as opticalcommunication and particle manipulation.
New Journal of Physics 15 (2013) 073025 (http://www.njp.org/)

13
Acknowledgment
We thank Julia Borchardt, who provided the phase tracking algorithm.
References
[1] Poynting J H 1909 The wave motion of a revolving shaft and a suggestion as to the angular momentum in abeam of circularly polarised light Proc. R. Soc. Lond. A 82 560–7
[2] Beth R A 1936 Mechanical detection and measurement of the angular momentum of light Phys. Rev.50 115–25
[3] Demore C, Yang Z, Volovick A, Cochran S, MacDonald M and Spalding G 2012 Mechanical evidence of theorbital angular momentum to energy ratio of vortex beams Phys. Rev. Lett. 108 194301
[4] Allen L, Beijersbergen M W, Spreeuw R J C and Woerdman J P 1992 Orbital angular-momentum of light andthe transformation of Laguerre–Gaussian laser modes Phys. Rev. A 45 8185–9
[5] Allen L, Padgett M J and Babiker M 1999 The orbital angular momentum of light Progress in Optics vol 39(Amsterdam: North-Holland) chapter 4, pp 291–372
[6] Yao A M and Padgett M J 2011 Orbital angular monentum: origins, behavior and applications Adv. Opt.Photon. 3 161–204
[7] He H, Friese M E J, Heckenberg N R and Rubinsztein-Dunlop H 1995 Direct observation of transfer ofangular momentum to absorptive particles from a laser beam with a phase singularity Phys. Rev. Lett.75 826–9
[8] Simpson N B, Dholakia K, Allen L and Padgett M J 1997 Mechanical equivalence of spin and orbital angularmomentum of light: an optical spanner Opt. Lett. 22 52–4
[9] Padgett M J and Bowman R 2011 Tweezers with a twist Nature Photon. 5 343–8[10] Gibson G, Courtial J, Padgett M J, Vasnetsov M, Pasko V, Barnett S M and Franke-Arnold S 2004 Free-space
information transfer using light beams carrying orbital angular momentum Opt. Express 12 5448–56[11] Wang J et al 2012 Terabit free-space data transmission employing orbital angular momentum multiplexing
Nature Photon. 6 488–96[12] Mair A, Vaziri A, Weihs G and Zeilinger A 2001 Entanglement of the orbital angular momentum states of
photons Nature 412 313–6[13] Dada A C, Leach J, Buller G S, Padgett M J and Andersson E 2011 Experimental high-dimensional two-
photon entanglement and violations of generalized Bell inequalities Nature Phys. 7 677–80[14] Leach J, Jack B, Romero J, Jha A K, Yao A M, Franke-Arnold S, Ireland D G, Boyd R W, Barnett S M
and Padgett M J 2010 Quantum correlations in optical angle-orbital angular momentum variables Science329 662–5
[15] Genevet P, Lin J, Kats M A and Capasso F 2012 Holographic detection of the orbital angular momentum oflight with plasmonic photodiodes Nature Commun. 3 1278
[16] Mazilu M, Mourka A, Vettenburg T, Wright E M and Dholakia K 2012 Simultaneous determination ofthe constituent azimuthal and radial mode indices for light fields possessing orbital angular momentumAppl. Phys. Lett. 100 231115
[17] Hickmann J M, Fonseca E J S, Soares W C and Chavez-Cerda S 2010 Unveiling a truncated optical latticeassociated with a triangular aperture using light’s orbital angular momentum Phys. Rev. Lett. 105 053904
[18] Mourka A, Baumgartl J, Shanor C, Dholakia K and Wright E M 2011 Visualization of the birth of an opticalvortex using diffraction from a triangular aperture Opt. Express 19 5760–71
[19] Courtial J, Dholakia K, Robertson D A, Allen L and Padgett M J 1998 Measurement of the rotationalfrequency shift imparted to a rotating light beam possessing orbital angular momentum Phys. Rev. Lett.80 3217–9
[20] Allen L, Babiker M and Power W L 1994 Azimuthal Dopper-shift in light-beams with orbital angularmomentum Opt. Commun. 112 141–4
New Journal of Physics 15 (2013) 073025 (http://www.njp.org/)

14
[21] Vasnetsov M V, Torres J P, Petrov D V and Torner L 2003 Observation of the orbital angular momentumspectrum of a light beam Opt. Lett. 28 2285–7
[22] Lavery M P J, Dudley A, Forbes A, Courtial J and Padgett M J 2011 Robust interferometer for the routing oflight beams carrying orbital angular momentum New J. Phys. 13 093014
[23] Berkhout G C G, Lavery M P J, Courtial J, Beijersbergen M W and Padgett M J 2010 Efficient sorting oforbital angular momentum states of light Phys. Rev. Lett. 105 153601
[24] Lavery M P J, Robertson D J, Berkhout G C G, Love G D, Padgett M J and Courtial J 2012 Refractiveelements for the measurement of the orbital angular momentum of a single photon Opt. Express20 2110–5
[25] Dudley A, Mhlanga T, Lavery M, McDonald A, Roux F S, Padgett M J and Forbes A 2013 Efficient sortingof Bessel beams Opt. Express 21 165–71
[26] Lavery M P J, Robertson D J, Sponselli A, Courtial J, Steinhoff N K, Tyler G A, Wilner A and Padgett M J2013 Efficient measurement of orbital angular momentum over 50 states New J. Phys. 15 013024
[27] Dudley A, Litvin I A and Forbes A 2012 Quantitative measurement of the orbital angular momentum densityof light Appl. Opt. 51 823–33
[28] Torner L, Torres J P and Carrasco S 2005 Digital spiral imaging Opt. Express 13 873–81[29] Rodrigo J A, Caravaca-Aguirre A M, Alieva T, Cristobal G and Calvo M L 2011 Microparticle movements
in optical funnels and pods Opt. Express 19 5232–43[30] Hodgson N and Weber H 2005 Laser Resonators and Beam Propagation (Berlin: Springer)[31] Snyder A W and Love J D 1996 Optical Waveguide Theory (London: Chapman and Hall)[32] Schulze C, Naidoo D, Flamm D, Schmidt O A, Forbes A and Duparre M 2012 Wavefront reconstruction by
modal decomposition Opt. Express 20 19714–25[33] Schulze C, Ngcobo S, Duparre M and Forbes A 2012 Modal decomposition without a priori scale information
Opt. Express 20 27866–73[34] Flamm D, Naidoo D, Schulze C, Forbes A and Duparre M 2012 Mode analysis with a spatial light modulator
as a correlation filter Opt. Lett. 37 2478–80[35] Kaiser T, Flamm D, Schroter S and Duparre M 2009 Complete modal decomposition for optical fibers using
CGH-based correlation filters Opt. Express 17 9347–56[36] Golub M A, Prokhorov A M, Sisakian I N and Soifer V A 1982 Synthesis of spatial filters for investigation
of the transverse mode composition of coherent radiation Sov. J. Quantum Electron. 12 1208–9[37] Goodman J W 1968 Introduction to Fourier Optics (New York: McGraw-Hill)[38] Arrizon V, Ruiz U, Carrada R and Gonzalez L A 2007 Pixelated phase computer holograms for the accurate
encoding of scalar complex fields J. Opt. Soc. Am. A 24 3500–7[39] Lee W-H 1979 Binary computer-generated holograms Appl. Opt. 18 3661–9[40] Born M and Wolf E 1991 Principles of Optics (Cambridge: Cambridge University Press)[41] Berry H G, Gabrielse G and Livingston A E 1977 Measurement of the Stokes parameters of light Appl. Opt.
16 3200–5[42] Flamm D, Schmidt O A, Schulze C, Borchardt J, Kaiser T, Schroter S and Duparre M 2010 Measuring the
spatial polarization distribution of multimode beams emerging from passive step-index large-mode-areafibers Opt. Lett. 35 3429–31
[43] Litvin I A, Dudley A and Forbes A 2011 Poynting vector and orbital angular momentum density ofsuperpositions of Bessel beams Opt. Express 19 16760–71
[44] Aiello A, Lindlein N, Marquardt C and Leuchs G 2009 Transverse angular momentum and geometric spinHall effect of light Phys. Rev. Lett. 103 100401
[45] Soskin M S, Gorshkov V N, Vasnetsov M V, Malos J T and Heckenberg N R 1997 Topological charge andangular momentum of light beams carrying optical vortices Phys. Rev. A 56 4064–75
[46] Baumann S M, Kalb D M, MacMillan L H and Galvez E J 2009 Propagation dynamics of optical vortices dueto Gouy phase Opt. Express 17 9818–27
New Journal of Physics 15 (2013) 073025 (http://www.njp.org/)

15
[47] Allen L and Padgett M J 2000 The Poynting vector in Laguerre–Gaussian beams and the interpretation oftheir angular momentum density Opt. Commun. 184 67–71
[48] Leach J, Keen S, Padgett M J, Saunter C and Love G D 2006 Direct measurement of the skew angle of thePoynting vector in a helically phased beam Opt. Express 14 11919–24
[49] Bozinovic N, Golowich S, Kristensen P and Ramachandran S 2012 Control of orbital angular momentum oflight with optical fibers Opt. Lett. 37 2451–3
[50] Flamm D, Schulze C, Naidoo D, Schroter S, Forbes A and Duparre M 2013 All-digital holographic tool formode excitation and analysis in optical fibers J. Light. Technol. 31 1023–32
New Journal of Physics 15 (2013) 073025 (http://www.njp.org/)