Measurement of helicopter rotor blade deformation...
9
Measurement of helicopter rotor blade deformation using digital image correlation Jayant Sirohi Michael S. Lawson Downloaded from SPIE Digital Library on 14 Jun 2012 to 198.213.196.38. Terms of Use: http://spiedl.org/terms
Transcript of Measurement of helicopter rotor blade deformation...

Measurement of helicopter rotor bladedeformation using digital imagecorrelation
Jayant SirohiMichael S. Lawson
Downloaded from SPIE Digital Library on 14 Jun 2012 to 198.213.196.38. Terms of Use: http://spiedl.org/terms
Measurement of helicopter rotor blade deformation usingdigital image correlation
Jayant SirohiMichael S. LawsonThe University of Texas at AustinDepartment of Aerospace Engineering and
Engineering MechanicsAustin, Texas 78712E-mail: [email protected]
Abstract. An experimental study on the application of the digital imagecorrelation (DIC) technique to measure the deformation of rotating helicop-ter blades is described. Measurements on two different rotors of diameter24 and 39 in., with different rotor hubs, were carried out to explore applic-ability of the technique over a range of scales. Commercial DIC softwarewas synchronized with the frequency of rotation such that rotor bladeimages could be obtained at a constant rotor azimuth. Bending and torsionmode shapes were extracted from the data with deformation as high as0.4 in. measured with an accuracy of 0.0038 in. This technique is veryadvantageous because it is noncontact, cost effective, accurate and sim-ple to implement while yielding full-field, three-dimensional data with a highspatial resolution. © 2012 Society of Photo-Optical Instrumentation Engineers (SPIE).[DOI: 10.1117/1.OE.51.4.043603]
Subject terms: digital image correlation; rotorcraft; helicopter blade deformation;optical methods.
Paper 111463 received Nov. 22, 2011; revised manuscript received Feb. 7, 2012;accepted for publication Feb. 17, 2012; published online Apr. 6, 2012.
1 IntroductionHelicopter rotor blades typically are long, slender and flex-ible structures. They are subjected to unsteady aerodynamicloads as well as inertial loads due to blade motion. As a con-sequence, helicopter rotor blades undergo large deflectionsout of the rotor disk plane (flapping), in the rotor diskplane (lead-lag) and torsion along the blade span. Due tothe presence of articulation at the rotor hub, the deflectionof a rotor blade may be comprised of rigid body rotationsabout the blade root in addition to bending and twist defor-mation. Measurement of these rigid body rotations as well asthe blade deformations, is important for a variety of pur-poses. For example, this data can be used to validate analysesthat predict the performance and vibration of helicopters.Real-time blade deformation data can also be used for healthmonitoring of the rotor and sensory feedback for activevibration reduction systems.
Robust and reliable measurement of rotating blade defor-mation is very challenging. Electrical signals from sensorson the rotating frame must be transferred to the fuselagethrough an electrical slip ring. While rigid body rotationsat the blade root can be measured by discrete sensors,such as potentiometers, measurement of blade bendingand twist deformation requires distributed sensors alongthe rotor blade. Typically, strain gauges bonded to theblade at discrete span-wise locations are used to measureblade bending and twist. However, this approach has severaldrawbacks. The limited number of strain gauge locationsresults in a low spatial resolution of the measurements.The lack of deformation data over the entire blade spanhas led to the use of assumed deformations and interpolateddata for the validation of aerodynamic analyses.1,2 Becausesignal conditioning electronics are located in the fixed frame,the small imbalance voltage signal of the Wheatstone bridge
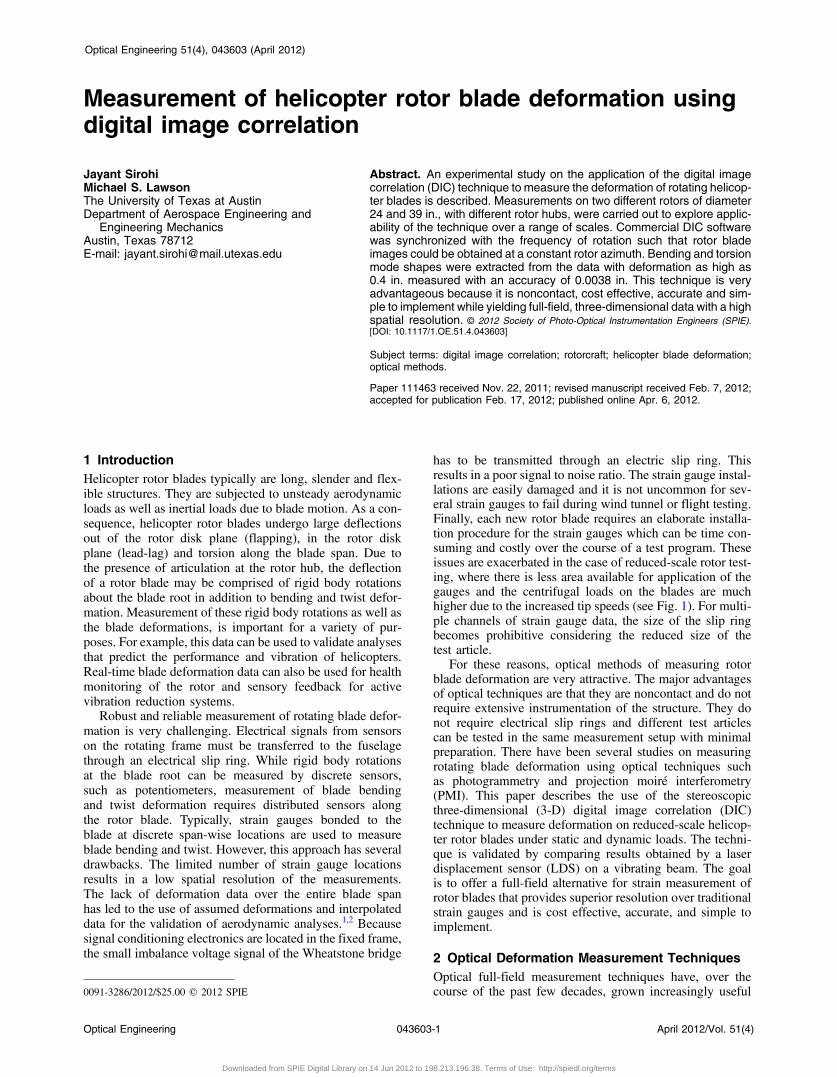
has to be transmitted through an electric slip ring. Thisresults in a poor signal to noise ratio. The strain gauge instal-lations are easily damaged and it is not uncommon for sev-eral strain gauges to fail during wind tunnel or flight testing.Finally, each new rotor blade requires an elaborate installa-tion procedure for the strain gauges which can be time con-suming and costly over the course of a test program. Theseissues are exacerbated in the case of reduced-scale rotor test-ing, where there is less area available for application of thegauges and the centrifugal loads on the blades are muchhigher due to the increased tip speeds (see Fig. 1). For multi-ple channels of strain gauge data, the size of the slip ringbecomes prohibitive considering the reduced size of thetest article.
For these reasons, optical methods of measuring rotorblade deformation are very attractive. The major advantagesof optical techniques are that they are noncontact and do notrequire extensive instrumentation of the structure. They donot require electrical slip rings and different test articlescan be tested in the same measurement setup with minimalpreparation. There have been several studies on measuringrotating blade deformation using optical techniques suchas photogrammetry and projection moiré interferometry(PMI). This paper describes the use of the stereoscopicthree-dimensional (3-D) digital image correlation (DIC)technique to measure deformation on reduced-scale helicop-ter rotor blades under static and dynamic loads. The techni-que is validated by comparing results obtained by a laserdisplacement sensor (LDS) on a vibrating beam. The goalis to offer a full-field alternative for strain measurement ofrotor blades that provides superior resolution over traditionalstrain gauges and is cost effective, accurate, and simple toimplement.
2 Optical Deformation Measurement TechniquesOptical full-field measurement techniques have, over thecourse of the past few decades, grown increasingly useful0091-3286/2012/$25.00 © 2012 SPIE
Optical Engineering 51(4), 043603 (April 2012)
Optical Engineering 043603-1 April 2012/Vol. 51(4)
Downloaded from SPIE Digital Library on 14 Jun 2012 to 198.213.196.38. Terms of Use: http://spiedl.org/terms
in engineering research and development to help facilitatedesign, materials production, and inspection.3 Holographicinterferometry (HI), electronic speckle pattern interferometry(ESPI), Moiré techniques, and DIC technique have beenthoroughly explored from theoretical4,5 and engineeringapplication6,7 viewpoints. It may be remarked that bothESPI and HI possess high sensitivity but have limitedrange. DIC extends this range by several orders ofmagnitude.8
There has been some limited investigation of optical mea-surement techniques for helicopter rotor blade deformation.Flemming and Gorton9 used PMI to obtain 3-D deformationmeasurements of rotor blades and demonstrated the superiorattributes of the technique compared to conventionalapproaches. The technique was also applied to characterizethe vibrations of a NASA active twist rotor blade.10 PMIrelies on the projection of equally spaced grid on themodel surface. The image of the model surface overlaidwith grid lines is superposed on the computer generatedreference grid, resulting in moiré fringe formation. Moiréfringe pattern is analyzed using computational phase-shiftingtechnique to obtain shape and deformation of the object.Olson et al.11 used photogrammetry to measure the deforma-tion of full-scale UH-60 helicopter blades in a wind tunnel atvarious wind speeds, rotor thrusts, and drive shaft angles.This technique used 2 in. diameter reflective, circular targetsattached at specific locations on the blade. The experimentalsetup was calibrated using the known positions of targetsmounted on the wind tunnel walls. The measured deforma-tion and twist distribution closely matched expected values.There have been several other studies using photogrammetryfor visualizing structural deformation and also to maintainproductivity.12–14
Previous studies have provided a solid foundation for theadvancement of the DIC technique since the early 1980s.15
The technique has been extensively used in material sciencesand biomedical engineering to measure deformations in avariety of systems such as high speed fracture and rotatingflywheels,16 deformations in flapping wings for a micro-aerial vehicle,17 tensile test of a knee tendon,18 dynamic tis-sue deformation measurements of a frog heart and ofartificial muscles. Kahn-Jetter and Chu19 presented an over-view of DIC theory with experimental verification on a can-tilever beam, as well as a brief discussion on methods ofrandom speckle pattern and photogrammetric principles.They concluded that the technique is viable for determining
3-D displacements. The effect of camera tilt is negligible andincreasing the camera magnification improves the results.McNeill et al.20 discussed the differences between severalDIC approaches and calibration methods. Several studieshave addressed the advantages of using DIC over single-point conventional strain gauges. For example, Siebert etal.21 measured the strain at three points on a vibrating canti-lever beam using conventional strain gauges and comparedthe results to the strain measured using DIC.
There are several benefits to using DIC to measure rotorblade deformation. Most important is the fact that single-point strain gauges are incapable of showing strain gradi-ents and could potentially miss high strain hot spots,whereas DIC yields measurements with a very high spatialresolution, on the order of 1∕30; 000 of the field of view.3
The output of the DIC technique is a deformation map,which can be used to quickly verify finite element models.DIC does not require involved sample preparation or theinstallation of electronic slip rings. DIC can also be appliedto small or complex geometry, where it is challenging toinstall conventional strain gauges. Because DIC does notrequire instrumentation exposed to the high vibration envir-onment on the rotor blades, it is a more robust techniquethan strain gauges. Additionally, DIC is not affected byrigid body motions and can measure large deformationsas long as the test object remains within focus of thecameras.
3 DIC TechniqueIn the DIC technique, the surface of the model is painted witha random dot or “speckle” (salt and pepper) pattern. A con-venient method to create such a pattern is to paint the surfacewith a matte background color and spray it with a high-contrast color. A high-resolution camera captures imagesof the surface before and after deformation. Cross-correlation of these images yields a two-dimensional(2-D), or in-plane, displacement map of the surface.
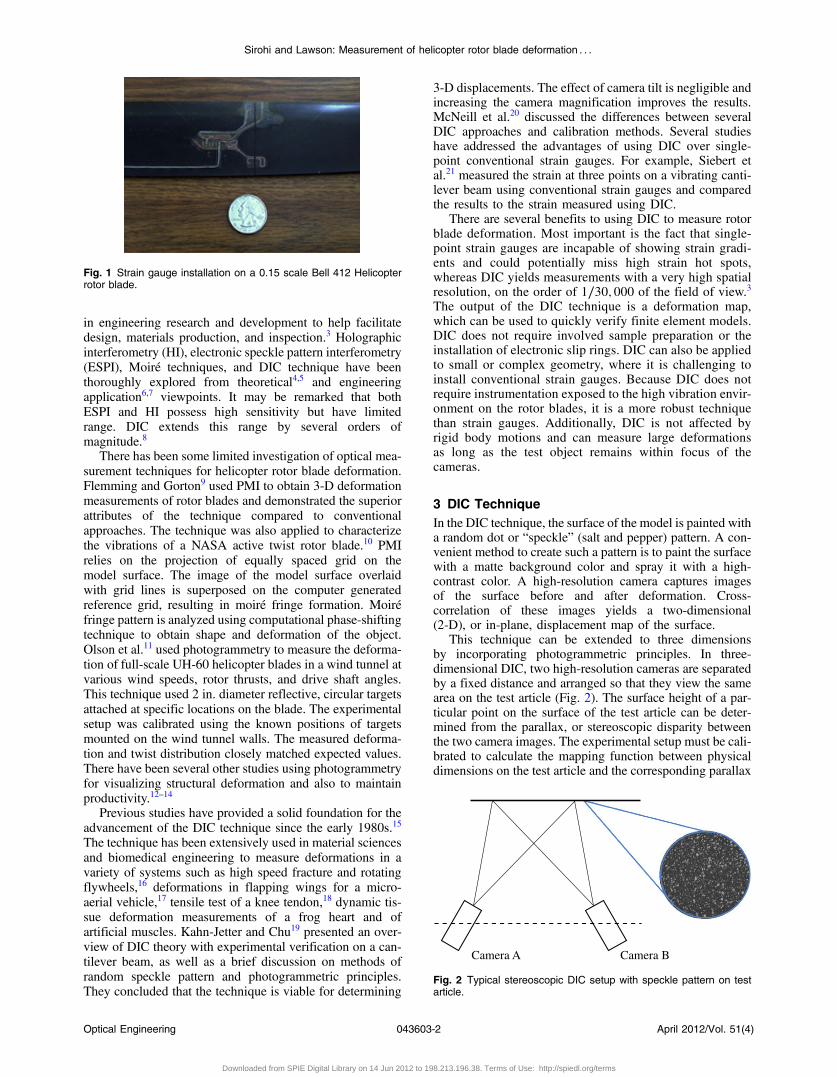
This technique can be extended to three dimensionsby incorporating photogrammetric principles. In three-dimensional DIC, two high-resolution cameras are separatedby a fixed distance and arranged so that they view the samearea on the test article (Fig. 2). The surface height of a par-ticular point on the surface of the test article can be deter-mined from the parallax, or stereoscopic disparity betweenthe two camera images. The experimental setup must be cali-brated to calculate the mapping function between physicaldimensions on the test article and the corresponding parallax
Fig. 1 Strain gauge installation on a 0.15 scale Bell 412 Helicopterrotor blade.
Camera A Camera B
Fig. 2 Typical stereoscopic DIC setup with speckle pattern on testarticle.
Sirohi and Lawson: Measurement of helicopter rotor blade deformation : : :
Optical Engineering 043603-2 April 2012/Vol. 51(4)
Downloaded from SPIE Digital Library on 14 Jun 2012 to 198.213.196.38. Terms of Use: http://spiedl.org/terms

on the image plane of the cameras. This calibration is per-formed using a target of known geometry. After this mappingfunction is generated, any length on the image plane can beconverted to physical dimensions using photogrammetry.Note that the use of parallax enables 3-D displacementsto be measured. The geometric arrangement of the camerasand test article must remain undisturbed for the duration ofthe experiment to ensure the validity of the mapping func-tion. Cross-correlation of images before and after deforma-tion of the test article, in conjunction with the parallaxmapping function, yields a 3-D map of the surface. Compar-ing this map to a reference undeformed surface yields a dis-placement, or deformation map, of the test article.
The calibration of the test setup, as well as the surfaceheight determination are crucial steps in measuring the defor-mation using DIC. These steps are described below.
3.1 Test Setup Calibration
Calibration defines an internal representation of the positionand orientation of the cameras relative to the sample. Thecalibration (expressed, for example, in pixel/mm), representsa mapping between the camera image planes and real worlddimensions. Measurements in three dimensions require acalibration in multiple planes; so a polynomial calibration,which uses either a 3-D calibration plate or multiple coplanarviews of a 2-D calibration plate, is required. A 3-D calibra-tion plate was used in the present set of experiments. It is notnecessary for the calibration plate to be aligned exactly withrespect to the test article or the cameras. This allows the tar-get to be held by hand in front of the test article, and thus,considerably simplifies the calibration process. After captur-ing several images, the distinct marks on the calibration tar-get must be manually identified in the software, which thencalculates the mapping function.
3.2 Surface Height Calculation
The first step in the surface height calculation is to define amask that will exclude any background pixels that are not apart of the test article. The mask can be geometrically fixedfor all images; a moving mask fixed to structures, or algor-ithmically determined based on intensity counts for allimages in the set.
Given a pair of camera images, the surface height of thetest article can be calculated by identifying groups of pixelsin both images and using the mapping functions that weredefined during the camera calibration process. This processis shown in Fig. 3. The test article is indicated by the greyrectangle in image A and image B from camera 1 and camera2, respectively. The area of interest is divided into a rectan-gular grid with a given number of pixels grouped together ineach element (called interrogation window). For example,each group can be of size 16 × 16 pixels or 4 × 4 pixels,and a single point is associated with the center of the inter-rogation window. The corresponding points ðx1; y1Þ andðx2; y2Þ from the two cameras are found by cross-correlationof the images A and B. By passing the x and y coordinatesthrough the mapping function Hðx; yÞ, the height of eachrepresentative point (corresponding to a group of pixels)can be determined by an iterative process to create a surfaceof the test article. This process is repeated for every pair ofimages in a set of recorded images. This has to be done verycarefully for the first image in the set; however, subsequent
images can use the result of the first (or preceding) image asthe initial guess. This implies that the deformation is smallenough that consecutive surfaces do not change substan-tially, though it is possible to calculate each surface fromgeneralized settings, this takes much more time to compute.
3.3 Displacement Calculation
Once the test article surface is calculated for all images in aset, a vector deformation field can be calculated by compar-ing each surface to a baseline or reference surface (Fig. 4).Typically, the reference surface is in the unloaded, or unde-formed, condition while subsequent surfaces are calculatedafter the test article has been loaded, or deformed. A varietyof post processing options are possible including eliminatingvectors that are not consistent or differ from their neighbor-ing vectors by a specified factor, inserting vectors in emptyspots in the vector field, and smoothing.
4 Experimental Setup and Test ProcedureThe cameras (Imager ProX 2M) used for these experimentshave a 1600 × 1200 pixel resolution, 29.5 Hz operationspeed (15 Hz continuous), color CCD image sensors, internalcamera memory, and 16384 (14-bit) gray levels. The expo-sure time is adjustable within the range of 500 ns to 1000 msand the cameras are capable of accepting an auxiliary TTLtriggering signal. The cameras were equipped with Nikon50 mm AF NIKKOR f ∕1.8D lenses; these lenses do nothave any zoom control and a minimum focal distance of1.5 ft (0.45 m), though they have a variable aperture fromf1.8 to f22. The DIC software used was Lavision DaVis7.2-StrainMaster 3-D.22
The surfaces were prepared by applying a matte blackor white coat of paint followed by a speckle pattern of oppo-site color; the speckle pattern was applied either by using atoothbrush dipped in the paint and flicking it over the sampleor by spraying a light coat from a distance. It was observed
Fig. 3 Calculation of surface height by cross-correlation of cameraimages followed by photogrammetry.
Fig. 4 Calculation of vector displacement field by comparingdeformed test article surface “n” to initial test article surface.
Sirohi and Lawson: Measurement of helicopter rotor blade deformation : : :
Optical Engineering 043603-3 April 2012/Vol. 51(4)
Downloaded from SPIE Digital Library on 14 Jun 2012 to 198.213.196.38. Terms of Use: http://spiedl.org/terms
that using black speckles on a matte white coat was easier towork with, as the image would have higher intensity andbetter contrast with the background.
In all the experiments, a set of image frames was capturedat the same point in the period of motion, so that the imagewould appear motionless. The surface height was thencalculated for each image in the set based on a mask, andvarious iterative calculation parameters and postprocessingparameters. Finally, the surface heights for each image inthe set were compared to a reference surface and the surface,deformation was calculated. This surface deformation wasthen be exported and analyzed independent from the DICsoftware.
4.1 Vibrating Cantilever Beam DeformationMeasurement
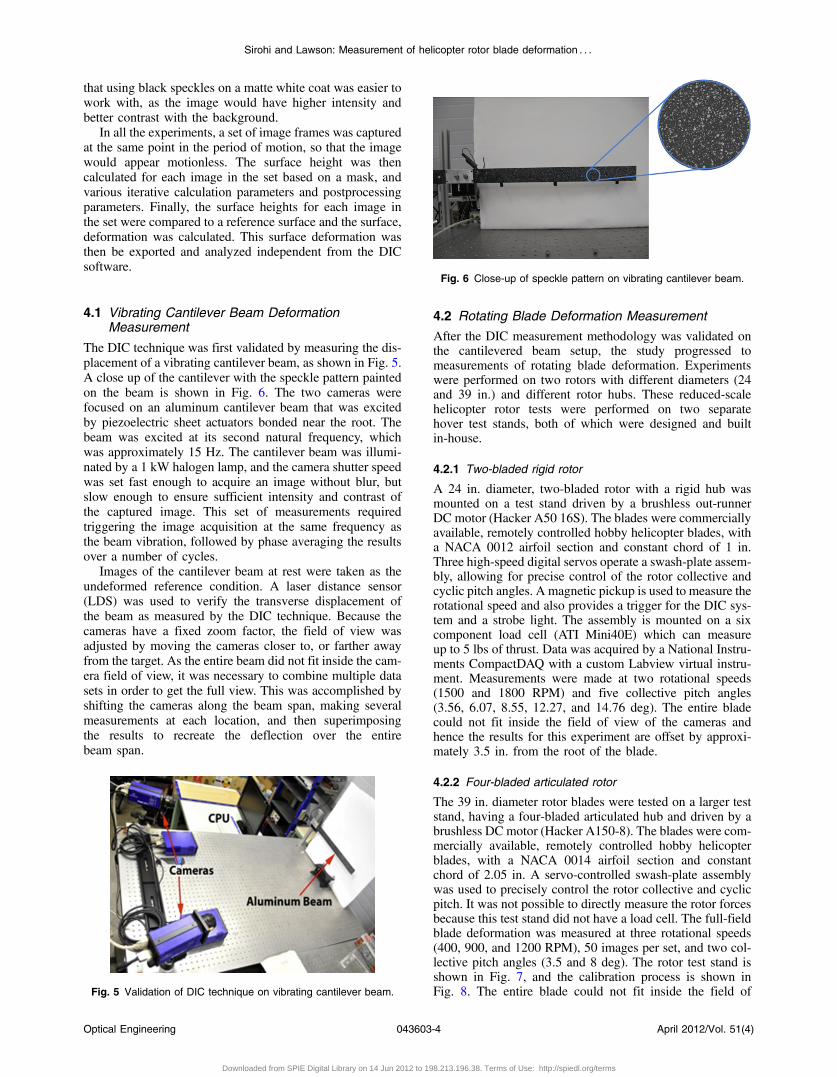
The DIC technique was first validated by measuring the dis-placement of a vibrating cantilever beam, as shown in Fig. 5.A close up of the cantilever with the speckle pattern paintedon the beam is shown in Fig. 6. The two cameras werefocused on an aluminum cantilever beam that was excitedby piezoelectric sheet actuators bonded near the root. Thebeam was excited at its second natural frequency, whichwas approximately 15 Hz. The cantilever beam was illumi-nated by a 1 kW halogen lamp, and the camera shutter speedwas set fast enough to acquire an image without blur, butslow enough to ensure sufficient intensity and contrast ofthe captured image. This set of measurements requiredtriggering the image acquisition at the same frequency asthe beam vibration, followed by phase averaging the resultsover a number of cycles.
Images of the cantilever beam at rest were taken as theundeformed reference condition. A laser distance sensor(LDS) was used to verify the transverse displacement ofthe beam as measured by the DIC technique. Because thecameras have a fixed zoom factor, the field of view wasadjusted by moving the cameras closer to, or farther awayfrom the target. As the entire beam did not fit inside the cam-era field of view, it was necessary to combine multiple datasets in order to get the full view. This was accomplished byshifting the cameras along the beam span, making severalmeasurements at each location, and then superimposingthe results to recreate the deflection over the entirebeam span.
4.2 Rotating Blade Deformation Measurement
After the DIC measurement methodology was validated onthe cantilevered beam setup, the study progressed tomeasurements of rotating blade deformation. Experimentswere performed on two rotors with different diameters (24and 39 in.) and different rotor hubs. These reduced-scalehelicopter rotor tests were performed on two separatehover test stands, both of which were designed and builtin-house.
4.2.1 Two-bladed rigid rotor
A 24 in. diameter, two-bladed rotor with a rigid hub wasmounted on a test stand driven by a brushless out-runnerDC motor (Hacker A50 16S). The blades were commerciallyavailable, remotely controlled hobby helicopter blades, witha NACA 0012 airfoil section and constant chord of 1 in.Three high-speed digital servos operate a swash-plate assem-bly, allowing for precise control of the rotor collective andcyclic pitch angles. A magnetic pickup is used to measure therotational speed and also provides a trigger for the DIC sys-tem and a strobe light. The assembly is mounted on a sixcomponent load cell (ATI Mini40E) which can measureup to 5 lbs of thrust. Data was acquired by a National Instru-ments CompactDAQ with a custom Labview virtual instru-ment. Measurements were made at two rotational speeds(1500 and 1800 RPM) and five collective pitch angles(3.56, 6.07, 8.55, 12.27, and 14.76 deg). The entire bladecould not fit inside the field of view of the cameras andhence the results for this experiment are offset by approxi-mately 3.5 in. from the root of the blade.
4.2.2 Four-bladed articulated rotor
The 39 in. diameter rotor blades were tested on a larger teststand, having a four-bladed articulated hub and driven by abrushless DC motor (Hacker A150-8). The blades were com-mercially available, remotely controlled hobby helicopterblades, with a NACA 0014 airfoil section and constantchord of 2.05 in. A servo-controlled swash-plate assemblywas used to precisely control the rotor collective and cyclicpitch. It was not possible to directly measure the rotor forcesbecause this test stand did not have a load cell. The full-fieldblade deformation was measured at three rotational speeds(400, 900, and 1200 RPM), 50 images per set, and two col-lective pitch angles (3.5 and 8 deg). The rotor test stand isshown in Fig. 7, and the calibration process is shown inFig. 8. The entire blade could not fit inside the field ofFig. 5 Validation of DIC technique on vibrating cantilever beam.
Fig. 6 Close-up of speckle pattern on vibrating cantilever beam.
Sirohi and Lawson: Measurement of helicopter rotor blade deformation : : :
Optical Engineering 043603-4 April 2012/Vol. 51(4)
Downloaded from SPIE Digital Library on 14 Jun 2012 to 198.213.196.38. Terms of Use: http://spiedl.org/terms

view of the cameras and hence the results for this experimentare offset by approximately 7 in. from the root of the blade.
In addition to the difference in size, note that there is amajor difference in the rotor hubs between the two teststands. The smaller rotor has a rigid hub, which meansthat the rotor blades can only undergo elastic bending.Torsion is a combination of pitch angle at the blade rootand elastic twist. The larger rotor has an articulated hub,which means that the rotor blades can undergo flapping(rigid body rotation about a flapping hinge located at theblade root) as well as elastic bending. In this case, torsionis a combination of rigid pitch angle and elastic twist.
For the rotor experiments, the magnetic pickup was usedto trigger image acquisition at a specific rotor azimuthal posi-tion. Phase delays were introduced in the trigger signal tocapture images at different azimuthal angles. Due to thehigher frequency of the rotor blades (compared to the vibrat-ing cantilever beam), the camera shutter was kept open for aset time period while a shorter duration strobe light was trig-gered by the magnetic pickup. In this way, higher speedimage acquisition could be performed while ensuringblur-free images of adequate intensity and contrast. Becausethe cameras were limited to a continuous acquisitionfrequency of 15 Hz, which was slower than the rotationalspeed of the rotor, they were unable to capture images atevery rotor revolution. Some fluctuations in the blade posi-tion was observed between frames due to slight variations inthe rotational speed of the rotor. However, these errors wereminimized by the phase averaging technique.
Images of the blades at a low rotational speed (around 200RPM) and zero pitch angle were taken as the undeformedreference. All blade deformations are calculated with respectto this reference. Because of the low rotational speed andzero pitch angle, the reference condition approximatedan undeformed rotor blade located perpendicular to therotor shaft.
5 Error AnalysisFor the result to be meaningful, it is essential to examine thesources of errors and their contributions to the measurementprocess. There have been several works that have specificallydealt with the error estimation.21,23 Our error analysis isbased on the software used in processing the results, whereinthe dominant source of error in the DIC technique is relatedto the definition of the pixel group size. During the surfaceheight calculation step, it is necessary to define an interroga-tion window which will determine the distance betweenneighboring vectors. It is possible to define these windowssuch that they overlap. The precision of the vectors dependson the size of this interrogation window and the amount bywhich each window overlaps. The distance between twoneighboring vectors, or the vector grid, is determined by
g ¼ Interrogation window size
100∕ð100 −%overlapÞ : (1)
For example, an interrogation window size of 32 × 32pixels with 50% overlap will have a vector grid of 16 pixels.The accuracy depends largely on the interrogation windowsize, but also on the zoom factor of the cameras, the typeof lens used, and the distance to the test article.22 Typical3-D vector accuracy ranges from 0.01 to 0.1 pixels withlarger vector grids being more accurate. The errors
Fig. 7 Rotor test stand with 39 in. diameter rotor and camerasinstalled.
Fig. 8 Calibration of camera setup for DIC using a target of knowngeometry.
Fig. 9 Comparison of beam transverse deflection measured by DICand LDS.
Table 1 Spatial resolution and estimated accuracy of DIC deforma-tion measurements.
ExperimentCalibration factor
(pixel/in)
Spatialresolution) Accuracy
(in.) (%R) (in.) (%R)
Vibrating beam 243.4 0.066 0.369 2.05E-04 0.0012
Rotor blades 198.7 0.081 0.822 2.52E-04 0.0026
Sirohi and Lawson: Measurement of helicopter rotor blade deformation : : :
Optical Engineering 043603-5 April 2012/Vol. 51(4)
Downloaded from SPIE Digital Library on 14 Jun 2012 to 198.213.196.38. Terms of Use: http://spiedl.org/terms

propagate when calculating strain, and the absolute errorincreases with greater deformation. The error in the strainvalues is greater for smaller interrogation windows, anddetecting strain smaller than 1% to suitable accuracy cannotbe done with smaller vector grids as the noise levelapproaches the order of magnitude of the strain to be mea-sured.22 However, larger interrogation windows reduce thespatial resolution and may not resolve local discontinuitiesin the strain field. So, it is important to find a middle groundthat offers the best spatial resolution obtainable while stillcapable of suitably accurate strain calculation. Table 1gives the calibration factor, spatial resolution and accuracyobtained for the various experiments conducted. It can beseen that the accuracy is much better than required for struc-tural dynamic analysis.
6 Results and DiscussionThe transverse displacement of the cantilever beam was mea-sured using DIC and was correlated with measurements froma laser LDS. A comparison between the results of both tech-niques is shown in Fig. 9. Because the beam motion was pre-dominantly out of plane, a fixed mask was used thatdeformed with the structure. A 32 × 32 pixel interrogationwindow with 50% overlap was used in the surface heightcalculation. Since the entire beam could not fit insidethe field of view of the cameras, it was split into two seg-ments and the measurements were merged/stitched using acommon identifying mark on the beam. Note that the DIC
measurements lie within the error bars of the LDS measure-ments, verifying the accuracy of the DIC technique on amoving target.
Measurements on the 24 in. diameter rotor blades focusedon the outer 60% of the blade span due to the large aspectratio of the blades. The bending deflection shape was
Fig. 10 Measured deflection for 24 in. diameter rotor, 1500 RPM at 8.5 deg collective pitch angle.
Fig. 11 Measured blade pitch angle as a function of spanwise location, 24 in. diameter rotor, 1500 RPM at 8.5 deg collective pitch angle.
Fig. 12 Comparison of collective pitch measured by inclinometer andextracted from DIC data.
Sirohi and Lawson: Measurement of helicopter rotor blade deformation : : :
Optical Engineering 043603-6 April 2012/Vol. 51(4)
Downloaded from SPIE Digital Library on 14 Jun 2012 to 198.213.196.38. Terms of Use: http://spiedl.org/terms
automatically extracted from the blade quarter-chord line,and the slope of the chord line was used to find the twistangle at each point along the span. Figure 10 shows the mea-sured deflection from all the images taken of the 24 in. dia-meter rotor blade at 1500 RPM and 8.5 deg collective pitch.The transverse displacement (w) on the y-axis and the span-wise location (x) on the x-axis are shown as a fraction of therotor radius (R). Because the blades are relatively stiff and areattached to a rigid hub, the transverse displacements aresmall. Most of the deformation occurs towards the bladeroot. The spread of the measurements is due to slight varia-tions in the rotational speed of the rotor, which causes var-iations in the position of the image of the rotor blade.
Figure 11 shows the blade pitch angle as a function ofspanwise location for the 24 in. diameter rotor blade at1500 RPM and 8.5 deg collective pitch. The blade pitch(θ) is shown as a fraction of the root pitch (θc). Becausethe blades are stiff in torsion, the twist deformation alongthe blade is very small. The slight scattering of pitch valuesat each radial position was also observed by Olson et al.11 intheir calculation of pitch on a full-scale UH-60A rotor blade.It was concluded that this variation was possibly due toimperfections in the airfoil lower surface geometry. The
error associated with twist is further propagated becausetwist is a derived quantity from multiple displacements.Figure 12 shows a comparison of collective pitch anglesas measured by an inclinometer and extracted from DICdata. It is seen that the maximum error, at higher collectivepitch angles, is around 6%.
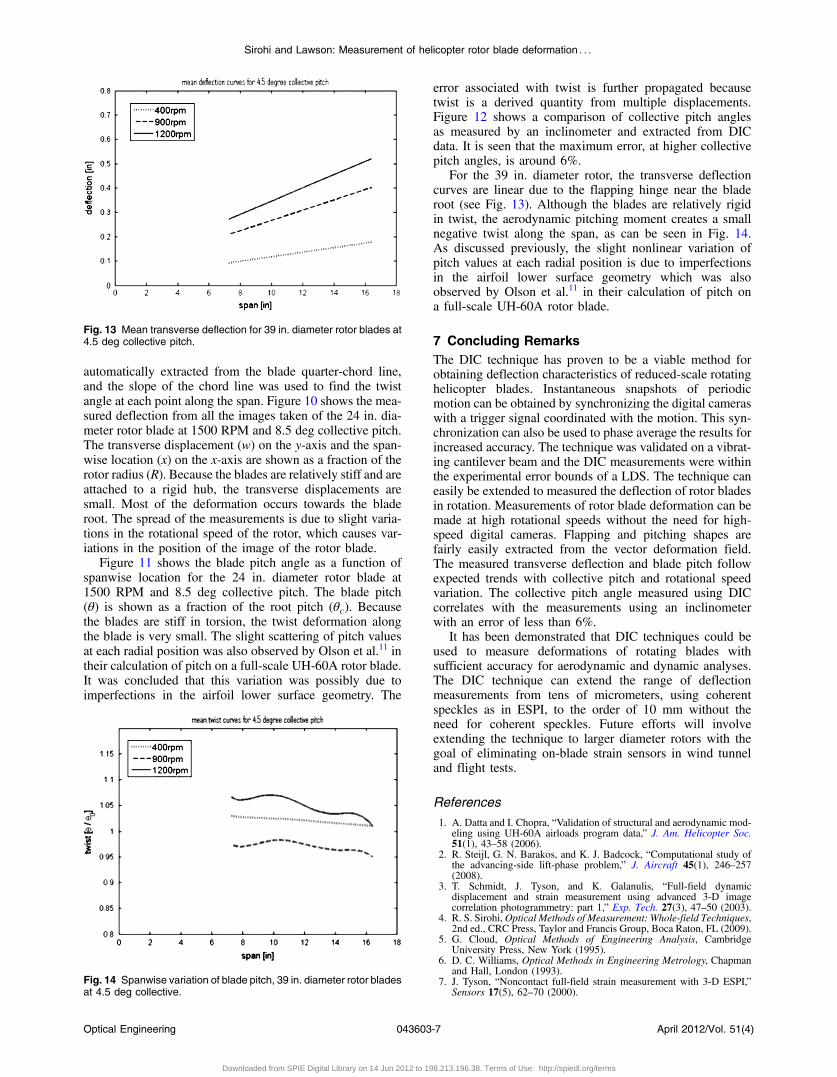
For the 39 in. diameter rotor, the transverse deflectioncurves are linear due to the flapping hinge near the bladeroot (see Fig. 13). Although the blades are relatively rigidin twist, the aerodynamic pitching moment creates a smallnegative twist along the span, as can be seen in Fig. 14.As discussed previously, the slight nonlinear variation ofpitch values at each radial position is due to imperfectionsin the airfoil lower surface geometry which was alsoobserved by Olson et al.11 in their calculation of pitch ona full-scale UH-60A rotor blade.
7 Concluding RemarksThe DIC technique has proven to be a viable method forobtaining deflection characteristics of reduced-scale rotatinghelicopter blades. Instantaneous snapshots of periodicmotion can be obtained by synchronizing the digital cameraswith a trigger signal coordinated with the motion. This syn-chronization can also be used to phase average the results forincreased accuracy. The technique was validated on a vibrat-ing cantilever beam and the DIC measurements were withinthe experimental error bounds of a LDS. The technique caneasily be extended to measured the deflection of rotor bladesin rotation. Measurements of rotor blade deformation can bemade at high rotational speeds without the need for high-speed digital cameras. Flapping and pitching shapes arefairly easily extracted from the vector deformation field.The measured transverse deflection and blade pitch followexpected trends with collective pitch and rotational speedvariation. The collective pitch angle measured using DICcorrelates with the measurements using an inclinometerwith an error of less than 6%.
It has been demonstrated that DIC techniques could beused to measure deformations of rotating blades withsufficient accuracy for aerodynamic and dynamic analyses.The DIC technique can extend the range of deflectionmeasurements from tens of micrometers, using coherentspeckles as in ESPI, to the order of 10 mm without theneed for coherent speckles. Future efforts will involveextending the technique to larger diameter rotors with thegoal of eliminating on-blade strain sensors in wind tunneland flight tests.
References
1. A. Datta and I. Chopra, “Validation of structural and aerodynamic mod-eling using UH-60A airloads program data,” J. Am. Helicopter Soc.51(1), 43–58 (2006).
2. R. Steijl, G. N. Barakos, and K. J. Badcock, “Computational study ofthe advancing-side lift-phase problem,” J. Aircraft 45(1), 246–257(2008).
3. T. Schmidt, J. Tyson, and K. Galanulis, “Full-field dynamicdisplacement and strain measurement using advanced 3-D imagecorrelation photogrammetry: part 1,” Exp. Tech. 27(3), 47–50 (2003).
4. R. S. Sirohi,Optical Methods of Measurement: Whole-field Techniques,2nd ed., CRC Press, Taylor and Francis Group, Boca Raton, FL (2009).
5. G. Cloud, Optical Methods of Engineering Analysis, CambridgeUniversity Press, New York (1995).
6. D. C. Williams, Optical Methods in Engineering Metrology, Chapmanand Hall, London (1993).
7. J. Tyson, “Noncontact full-field strain measurement with 3-D ESPI,”Sensors 17(5), 62–70 (2000).
Fig. 13 Mean transverse deflection for 39 in. diameter rotor blades at4.5 deg collective pitch.
Fig. 14 Spanwise variation of blade pitch, 39 in. diameter rotor bladesat 4.5 deg collective.
Sirohi and Lawson: Measurement of helicopter rotor blade deformation : : :
Optical Engineering 043603-7 April 2012/Vol. 51(4)
Downloaded from SPIE Digital Library on 14 Jun 2012 to 198.213.196.38. Terms of Use: http://spiedl.org/terms

8. M. Anguiano-Morales et al., “Micro-and macro deformation measure-ment by extension of digital correlation technique,” Optik 122(18),1642–1645 (2011).
9. G. A. Fleming and S. Gorton, “Measurement of rotorcraft blade defor-mation using projection moire interferometry,” Proc. SPIE 3441, 514–527 (1998).
10. E. J. Pryputniewicz, G. A. Flemming, and R. J. Pryputniewicz, “Experi-mental characterization of vibrations of a NASA active twist rotorblade,” in Proc. of the IMAC-XXII: Conf. & Exposition on StructuralDynamics, Society for Experimental Mechanics, Inc., Bethel, CT(2004).
11. L. Olson et al., “Blade deflection measurements of a full-scale UH-60Arotor system,” American Helicopter Society Aeromechanics Specialist’sConference, San Francisco, California (20–22 January 2010).
12. S. Robson and H. B. Setan, “The dynamic digital photogrammetricmeasurement and visualization of 21 m wind turbine rotor bladeudergoing structural analysis,” Int. Arch. Photogram. Rem. Sens. ViennaXXXI(Pt. B5), 493–498 (1996).
13. T. Liu et al., “Photogrammetry applied to wind tunnel testing,” AIAA J.38(6), 964–971 (2000).
14. A. W. Burner and T. Liu, “Videogrammetric model deformation mea-surement technique,” J. Aircraft 38 (4), 745–754 (2001).
15. T. C. Chu, W. F. Ranson, and M. A. Sutton, “Applications of digitalimage correlation techniques to experimental mechanics,” Exp.Mech. 25(3), 232–244 (1985).
16. T. Schmidt, J. Tyson, and K. Galanulis, “Full-field dynamic displace-ment and strain measurement – specific examples using advanced 3-Dimage correlation photogrammetry, part 2,” Exp. Tech. 27(4),22–26 (2003).
17. P. Wu et al., “Digital image correlation techniques for full-field displa-cement measurements of micro air vehicle flapping wings,” Exp.Tech. 33(6), 53–58 (2009).
18. J. Tyson, T. Schmidt, and K. Galanulis, “Advanced photogrammetry forrobust deformation and strain measurement,” SEM 2002 AnnualConf., SEM, Milwaukee, WI (2002).
19. Z. L. Kahn-Jetter and T. C. Chu, “Three-dimensional displacement mea-surements using digital image correlation and photogrammic analysis,”Exp. Mech. 30, 10–16 (1990).
20. S. R. McNeill et al., “Measurement of surface profile using digitalimage correlation,” Exp. Mech. 37(1), 13–20 (1997).
21. T. Siebert et al., “High speed digital image correlation error estimationsand applications,” Opt. Eng. 46, 051004 (2007).
22. La Vision, DaVis StrainMaster 3-D, Software Package, Ver 7.2,Göttingen, Germany, (January 2010).
23. H. Haddadi and S. Belhabib, “Use of rigid-body motion for the inves-tigation and estimation of the measurement errors related to digitalimage correlation technique,” Opt. Laser Eng. 46(2), 185–196 (2008).
Biographies and photographs of the authors not available.
Sirohi and Lawson: Measurement of helicopter rotor blade deformation : : :
Optical Engineering 043603-8 April 2012/Vol. 51(4)
Downloaded from SPIE Digital Library on 14 Jun 2012 to 198.213.196.38. Terms of Use: http://spiedl.org/terms