Measurement of Heat Production during the Summation of ...
13
Japanese Journal of Physiology,30,617-629,1980 Measurement of Heat Production during the Summation of Isometric Contraction in Frog Skeletal Muscle with an Infrared Radiometer Takakazu KOBAYASHI and Haruo SUGI Department of Physiology,School of Medicine, Teikyo University,Tokyo,173 Japan Abstract The heat production of frog skeletal muscle during isometric contraction was measured with an infrared radiometer at room tempera- ture(23-26•Ž),attention being focused on the heat produced during the summation of twitches by two successive stimuli.When the amount of heat produced by the second stimulus was plotted against the cor- responding tension increment,the data points fell on two regression lines of approximately the same slope except for the intermediate stimulus intervals.One regression line started from the origin,while the other intersected the ordinate at about 1mcal/g.If a twitch was produced at various times after a 0.5 sec tetanus,all the data points on the heat versus tension increment plot distributed around a single regression line starting from the origin.These results are explained by assuming that the relation between the tension-dependent heat and the tension increment in a twitch produced after a preceding mechanical response remains nearly constant irrespective of the stimulus interval,while the amount of tension-independent heat production varies depending on the time after the preceding stimulation. A number of investigations have hitherto been performed on the heat pro- duction in active muscle by use of a thermopile to obtain information about the mechanism of chemomechanical conversion in muscle contraction(for reviews, see WOLEDGE,1971;HOMSHER and KEAN,1978).In the thermopile experiments, however,heat produced in muscle has to flow through the layer of physiological saline and the film of coating material to be measured by a thermopile,producing a considerable lag in heat measurements.Most thermopile experimentation has,therefore,been made at 0•Žto slow down muscle contraction,thus com- pensating for the limited time resolution.Recently,FRASER(1970,1971)devised an infrared radiometer,which detects infrared radiation from muscle with no thermal contact resulting in an improved time resolution,and has succeeded in measuring heat production in frog muscle at 15•Žat which temperature frogs Received for publication April 3,1980 小林孝和,杉 晴夫 617
Transcript of Measurement of Heat Production during the Summation of ...
Japanese Journal of Physiology,30,617-629,1980
Measurement of Heat Production during the Summation of
Isometric Contraction in Frog Skeletal Muscle with
an Infrared Radiometer
Takakazu KOBAYASHI and Haruo SUGI
Department of Physiology,School of Medicine,Teikyo University,Tokyo,173 Japan
Abstract The heat production of frog skeletal muscle during isometric
contraction was measured with an infrared radiometer at room tempera-
ture(23-26•Ž),attention being focused on the heat produced during
the summation of twitches by two successive stimuli.When the amount
of heat produced by the second stimulus was plotted against the cor-
responding tension increment,the data points fell on two regression
lines of approximately the same slope except for the intermediate stimulus
intervals.One regression line started from the origin,while the other
intersected the ordinate at about 1mcal/g.If a twitch was produced at
various times after a 0.5 sec tetanus,all the data points on the heat versus
tension increment plot distributed around a single regression line starting
from the origin.These results are explained by assuming that the
relation between the tension-dependent heat and the tension increment
in a twitch produced after a preceding mechanical response remains
nearly constant irrespective of the stimulus interval,while the amount
of tension-independent heat production varies depending on the time
after the preceding stimulation.
A number of investigations have hitherto been performed on the heat pro-
duction in active muscle by use of a thermopile to obtain information about the
mechanism of chemomechanical conversion in muscle contraction(for reviews,
see WOLEDGE,1971;HOMSHER and KEAN,1978).In the thermopile experiments,
however,heat produced in muscle has to flow through the layer of physiological
saline and the film of coating material to be measured by a thermopile,producing
a considerable lag in heat measurements.Most thermopile experimentation
has,therefore,been made at 0•Žto slow down muscle contraction,thus com-
pensating for the limited time resolution.Recently,FRASER(1970,1971)devised
an infrared radiometer,which detects infrared radiation from muscle with no
thermal contact resulting in an improved time resolution,and has succeeded
in measuring heat production in frog muscle at 15•Žat which temperature frogs
Received for publication April 3,1980
小林孝和,杉 晴夫
617

618 T.KOBAYASHI and H.SUGI
can move normally(FRASER,1973;FRASER and CARLSON,1973).Since the use of
this infrared radiometer seemed so interesting,we constructed a similar radio-
meter to be used for muscle heat measurements at room temperatures.
The present paper deals with the heat production in frog skeletal muscle during
isometric contraction,attention being focused on the amount of heat produced and
the magnitude of the increment of tension during the summation of isometric
twitches by two successive stimuli.The experiments were made at room tempera-
tures of 23-26•Ž,at which the tension increment by the summation of twitches
was much more marked than at low temperatures because of a large tetanus:
twitch tension ratio(GIBBS et al.,1966;RALL,1979).
METHODS
Infrared radiometer.The infrared radiometer used was essentially similar to
that of FRASER(1970,1971).The radiometer monitored infrared radiation from
a 7mm2 target area of the muscle surface,and consisted of a Golay cell(Eppley
Laboratories,Inc.),a kind of gas thermometer converting infrared radiation
into an optical signal(GOLAY,1947),and a signal processor whose output was
an accurate analog of infrared radiation from muscle.The amount of muscle heat
production was measured directly as millidegrees centigrades(•‹mC),and this value
was nearly equivalent to that expressed as millicalories per gram(mcal/g)because
the specific heat of frog muscle is about 0.86(HILL,1949).In the present study,
the heat production was expressed as mcal/g for the sake of comparison with
the values in previous reports.The rise time constant of the signal processor was
adjusted to about 5 msec,so that the noise levels in heat records was less than
0.5•‹mC.In heat measurements during single or two successive twitches,an
averaging computer was used to increase signal-to-noise ratio.The base-line drift
was less than 1•‹mC/sec,and did not significantly affect the results.No correction
was made for heat loss,since it was negligible for the time of heat measurements
(less than 1 sec).
The linearity and the response time of the radiometer were calibrated with
a black aluminium block containing an internal heater(FRASER,1970,1971).
The aluminium block was placed at the same position as that of the target area of
muscle,and a given temperature increment was produced by applying current to
the internal heater.The temperature change of the block was calculated from
the time integral of the voltage-current product,the specific heat of aluminium,
and the weight and emissivity of the block(0.95,FRASER,1970).Heat loss of the
block was negligible for the time needed for calibration.The relation between
the change in calibrator temperature and the output of the processor was linear
well over the range of heat measurements in the present study.Further details
of the radiometer and the signal processor are the same as those described by
FRASER(1970,1971).
Japanese Journal of Physiology
HEAT PRODUCTION IN FROG MUSCLE 619
Muscle mounting.All experiments were performed with the sartorius muscle
of the bullfrog(Rana catesbeiana).The muscle was isolated with the pelvic bone
attached and kept in physiological saline containing 115mm NaCl,2.5mm KCl,
1.8mM CaCl2,2.18mM Na2HPO4 and 0.85mM NaH2PO4(pH 7.2)for 1 hr prior to
the experiments.The preparation was then mounted in an acrylic experimental
chamber with its inner surface uppermost;the pelvic end was firmly clamped to
the chamber,while the tibial end was connected to a strain gauge with a jeweller's
chain to record isometric tension.The compliance and the natural frequency of
oscillation of the strain gauge were about 1ƒÊm/g and 150Hz,respectively.The
length of the preparation mounted in this way(40-60mm)was about 1.1 times the
slack length unless otherwise stated,the sarcomere length measured by He-Ne
laser light being 2.2-2.4ƒÊm at the middle part.Stimulating electrodes consisted
of two pairs of Pt wires fixed to the chamber,the heat produced by a stimulating
current having been proven negligible.To avoid movement artifacts,the fascia
along the edge of the preparation was pulled laterally and pinned at several points
to the bottom of the chamber to eliminate movement of the target area during
isometric contraction(FRASER,1970;FRASER and CARLSON,1973).
The experimental chamber was initially filled with physiological saline to
equilibrate the preparation for 30min.Immediately before each experiment,the
muscle was carefully blotted with a strip of filter paper.Then,the chamber was
placed in the radiometer in such a way that the distance between a double conical
reflector,which was attached at the aperture of the radiometer to collect infrared
radiation(FRASER,1970,1971),and the muscle surface was about 0.5mm.The
whole set-up was confined to a steel box to be shielded both thermally and electro-
magnetically.
General procedure.The preparation mounted in the radiometer was further
thermally equilibrated for about 10min.Then,it was stimulated to contract
isometrically by applying supramaximal current pulses of 0.5-1 msec duration
through the Pt wire electrodes.Single or two successive twitches were produced
at intervals of 40-60 sec,while tetani were produced with a series of repetitive pulses
given at 50Hz at intervals of more than 2min.In the case of single or two suc-
cessive twitches,four serial records were averaged in an averaging computer to be
displayed on a chart recorder.Individual heat and tension traces were also moni-
tored on a memory oscilloscope to check the reproducibility of heat and tension
responses within each series of records.After the experiments,the muscles were
cut free of their attachments,blotted and weighted to calculate the tetanic tension
per cross-sectional area as Pol/fm,where Po,l and m were the maximum tetanic
tension,muscle length and blotted weight,respectively.The calculated values
ranged from 2.0 to 2.5kg/cm2,indicating that the muscles were adequately stimu-
lated.All experiments were made at room temperatures of 23-26•‹C,at which the
tetanus:twitch tension ratio was 2.2-3.0.
Vol.30,No.4,1980

620 T.KOBAYASHI and H.SUGI
RESULTS
Heat production during isometric twitch and tetanus
General features of heat production.Figure 1 shows examples of the records
of heat production during isometric twitches(A,C)and during short isometric
tetani(B,D).The heat production and tension development took place simultane-
ously with an accuracy of a few msec.In both twitches and short tetani,the rate
of heat production was maximum at the beginning,and then decreased with time
until the muscle temperature reached a maximum level at the relaxation phase.
The above features of heat production recorded with the infrared radiometer
were similar to those reported by FRASER and CARLSON(1973) with the infrared
radiometer,and also to those obtained by previous authors with the thermopile
(cf.WOLEDGE,1971).
On the other hand,a distinct cooling phase,as indicated by a period of negative
slope in the heat records(Fig.1C,D,FRASER,1973;FRASER and CARLSON,1973),
was observed only in about 50% of the muscles studied;the remaining muscles
showed no appreciable cooling phase in heat records(Fig.1A,B).This may be
due,at least in part,to the fact that the present experiments were made with
muscles slightly stretched above the slack length,because the cooling phase tends
to disappear by stretching muscles(FRASER and CARLSON,1973).The average
value of the final temperature change produced in a twitch was 3.1•}0.4mcal/g
(n=35),a value comparable to those obtained by previous authors(e.g.2.5-4•‹mC/g
A
C
B
D
Fig.1. Simultaneous records of heat production(upper traces)and isometric tension
(lower traces)in twitches(A,C)and in 0.5 sec tetani(B,D).Distinct cooling phase
indicated by arrow can be seen in C and D,but not in A and B.Records in A and C
are averages of four traces,while records in B and D are averages of two traces.Tem-
perature,24•Ž
Japanese Journal of Physiology
HEAT PRODUCTION IN FROG MUSCLE 621
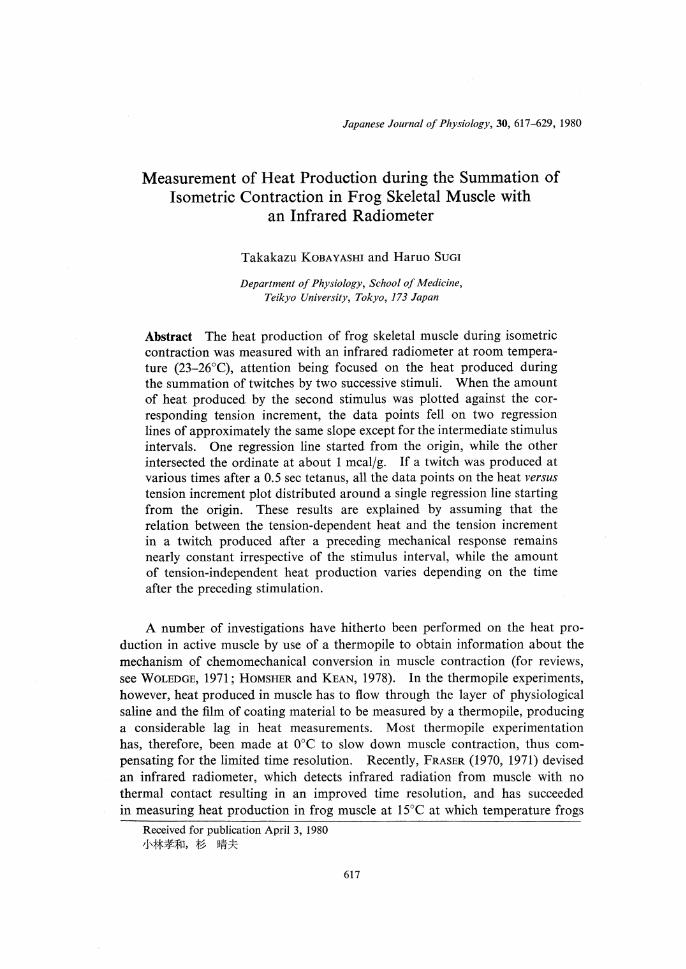
Fig.2. Relation between the heat production and the twitch tension in a muscle stretched
to a variable extent.The initial muscle length l was 53mm.Each data point was
obtained at the following muscle lengths,reading from right,l,l+5mm,l+10mm,
l+15mm,l+20mm,l+30mm. Temperature,25℃.
at 15•Ž,FRASER and CARLSON,1973;2.7•}0.9 mcal/g at 15-22•Ž,GIBBS et al.,
1966).Meanwhile,the average temperature change attained in a 0.5 sec tetanus
was 21.3•}3.4 mcal/g(n=24).
Relation between heat production and twitch tension.The relation between
the amount of heat production and the magnitude of twitch tension was examined
by stretching the muscle beyond its initial length.In agreement with the previous
reports(SMITH,1972;HOMSHER et al.,1972;RALL,1978,1979),the heat produced
in a twitch was divided into tension-dependent and tension-independent com-
ponents as shown in Fig.2.The tension-independent component of heat produc-
tion,which was determined by the point of intersection of the regression line with
the ordinate,was about 1mcal/g,being analogous to the value obtained by
HOMSHER et al.(1972)on the semitendinosus muscle of Rana pipiens at 0•‹C.
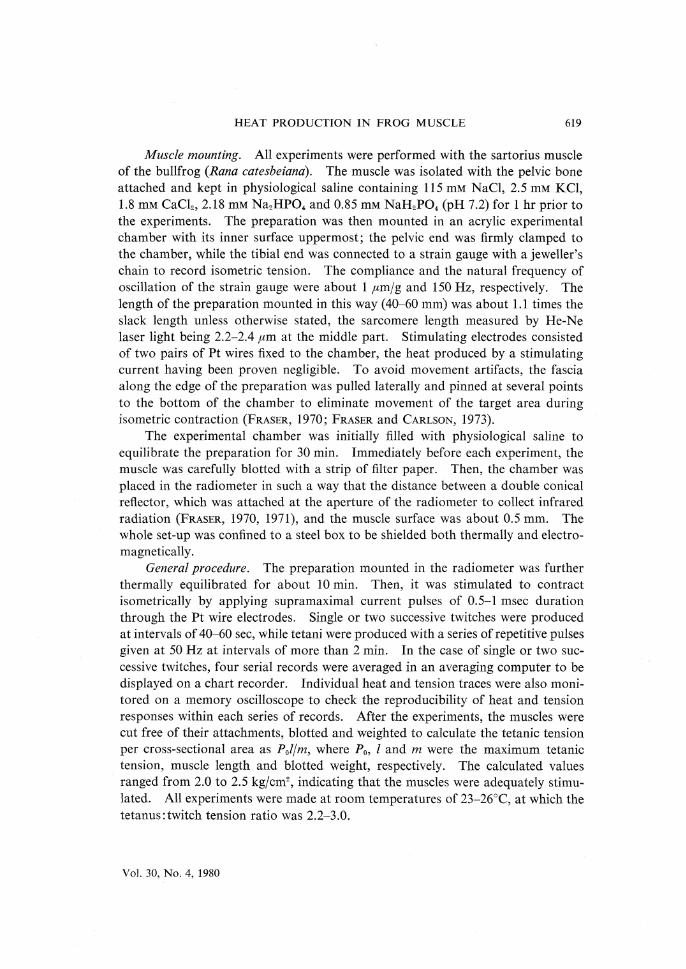
Heat production during summation of isometric twitches by two successive stimuli
The muscle was stimulated by two successive stimuli at various intervals,
and the relation between the heat production and the magnitude of tension in-
crement in response to the second stimulus was examined.Examples of heat and
tension records of summated twitches are shown in Fig .3.The amount of
heat produced by the second stimulus was determined by algebraically subtracting
the heat produced by the first stimulus from the total heat produced by two suc-
cessive stimuli,whereas the magnitude of tension increment produced by the second
stimulus was measured by the method illustrated in Fig.4(GIBBs et al .,1966).
Vol.30,No.4,1980
622 T.KOBAYASHI and H.SUGI
A
C
B
D
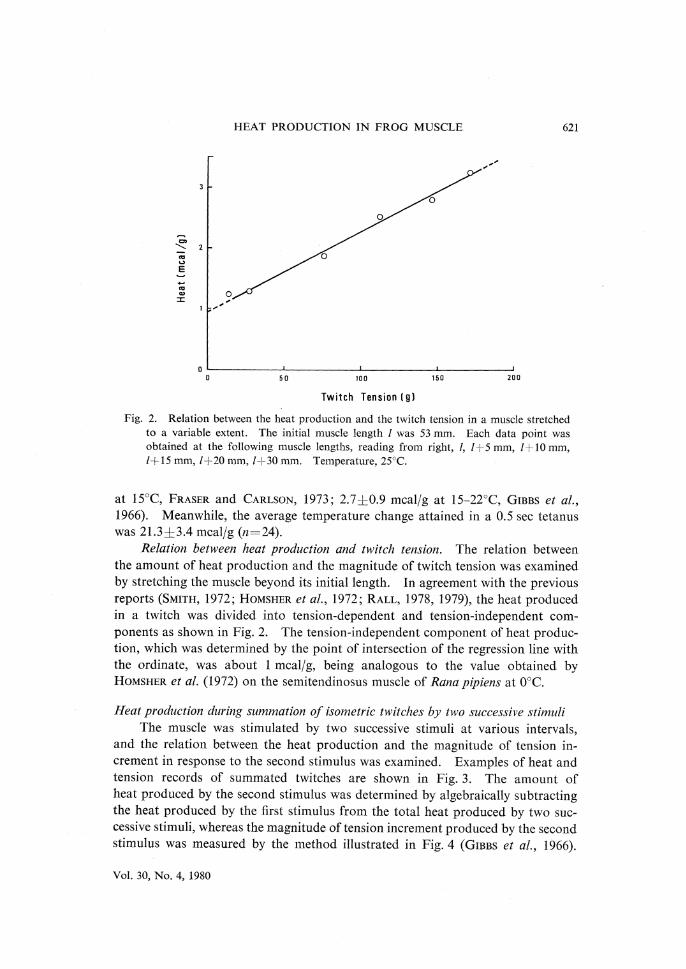
Fig.3. Records of heat production and isometric tension during the summation of twitches
by two successive stimuli given at various intervals.The intervals between stimuli were
10 msec in A,30 msec in B,50 msec in C and 150 msec in D.All records are averages
of four traces.Temperature,24•Ž.
A B C
Fig.4. Schematic drawings showing an isometric twitch in response to a single stimulus(A)and the summated mechanical responses in response to two successive stimuli givenat an interval of less than the mechanical fusion interval(B)and at an interval ofmore than the fusion interval(C).The tension increment in response to the secondstimulus is indicated by arrows.
When the stimulus interval was less than the mechanical fusion interval,the
tension increment was measured by algebraical subtraction of the first twitch from
the summated response(Fig.4B).If the stimulus interval was more than the fusioninterval,the tension increment was measured from the level of tension at whichthe second twitch started(Fig.4C).
A typical result is shown in Fig.5,in which the heat production and the tension
increment in response to the second stimulus are plotted against the stimulus inter-
val.The heat produced by the second stimulus decreased with decreasing stimulus
interval,approaching zero as the stimulus interval tended to zero.Similar resultshave been reported by HARTREE and HILL(1921)and GIBBS et al.(1966),except thatHartree and Hill sometimes observed a supernormal phase in heat production
Japanese Journal of Physiology

HEAT PRODUCTION IN FROG MUSCLE 623
which was never seen in the present experiments.Meanwhile,the tension incre-
ment first decreased with decreasing stimulus interval to reach a minimum value
at a stimulus interval of about 50 msec,and then increased with a further decrease
in the stimulus interval,reaching a maximum at a stimulus interval of about
20 msec.At a stimulus interval of less than 20 msec,the tension increment de-
creased steeply with decreasing stimulus interval,approaching zero as the stimulus
interval tended to zero.
Fig.5. Dependence of the heat production(open circles)and the tension increment(filled
circles)in response to the second stimulus on the stimulus interval.Broken line shows
the time-course of a single twitch.Temperature,24•Ž.
Fig.6. Relation between the heat produced by the second stimulus and the correspondingtension increment.The data are the same as those shown in Fig.5.The stimulusinterval(in msec)is indicated alongside each data point.
Vol.30,No.4,1980

624 T.KOBAYASHI and H.SUGI
The amount of heat produced by the second stimulus was also plotted against
the magnitude of corresponding tension increment in Fig.6.At stimulus intervals
of 60-150 msec,the data points fell on a regression line which intersected the
ordinate at about 1 mcal/g as in the case of the relation between the heat produc-tion and the twitch tension in Fig.2.The first and second twitches were completelyseparated at a stimulus interval of 150 msec with no significant difference betweenthem in either heat production or tension,indicating that the above regression
line was identical with that shown in Fig.2.At stimulus intervals of less than
20 msec,the data points were found to fall on another regression line,which
started from the origin with approximately the same slope as that of the former
regression line.
At intervals between 20 and 60 msec,the data points distributed between these
two regression lines;the deviation along the ordinate of each data point from
the upper regression line increased as the stimulus interval was decreased from
60 to 20 msec.
Heat production in a twitch produced after a tetanusExperiments were also performed in which a twitch was produced at various
times after a preceding 0.5 sec tetanus(Fig.7).In these experiments,the recordswere not averaged to avoid muscle fatigue with repeated tetani.In Fig.8,theheat production and the tension increment in response to the"test"stimulus are
plotted against the interval between the termination of the preceding"conditioning"repetitive stimuli(50 Hz,for 0.5 sec)and the"test"stimulus.Both the heat
Fig.7. An example of unaveraged records of heat production and tension when a twitch
was produced after a 0.5 sec tetanus.The interval between the end of the"conditioning"
repetitive stimuli(50 Hz for 0.5sec)and the"test"stimulus was 500 msec.Temperature,
23.5•Ž.
Japanese Journal of Physiology

HEAT PRODUCTION IN FROG MUSCLE 625
Fig.8. Fig.9.
Fig.8. Dependence of the heat production(open circles)and the tension increment (filledcircles)in response to a"test"stimulus given after a 0.5 sec tetanus on the intervalbetween the termination of the"conditioning"repetitive stimuli and the"test"stimulus.Broken line shows the time-course of the preceding tetanus from the termination of the
"conditioning"stimuli,its magnitude being scaled down for the sake of convenience.
Temperature,23.5•Ž.
Fig.9. Relation between the heat production and the tension increment in a twitch producedafter a tetanus.The data are the same as those shown in Fig.8.The interval betweenthe"conditioning"repetitive stimuli and the"test"stimulus(in msec)is indicated at eachdata point.
production and the tension increment decreased with decreasing interval betweenthe"conditioning"and the "test"stimuli.The heat and tension measurements
were made only at stimulus intervals of more than 120-150 msec,since their values
became vanishingly small at shorter intervals to be measured accurately.The
amount of heat production by the"test"stimulus was also plotted against the
magnitude of corresponding tension increment in Fig.9.In contrast with the results
on summation of twitches(Fig.6),all the data points distributed around a singleregression line starting from the origin, irrespective of the interval between the"conditioning"and the"test"stimuli .
DISCUSSION
Explanation of heat production during summation of isometric contraction interms of two heat components.It has been shown by many investigators that.when the muscle length is increased beyond the slack length to decrease isometric
twitch tension,the heat produced in a twitch decreases with decreasing twitch
Vol.30,No.4,1980
626 T.KOBAYASHI and H.SUGI
tension,approaching a finite value as the tension tends to zero(SMITH,1972;HOMSHER et al.,1972;RALL,1978,1979).Consequently,the heat production ina twitch has been divided into tension-dependent heat(TDH)and tension-inde-
pendent heat(TIH).These two components of heat produced in a twitch werealso confirmed in the present study(Fig.2).
In the present experiments on the summation of twitches by two successivestimuli(Fig.3),it was found that the data points on the heat versus tension incre-ment plot fell on two regression lines with approximately the same slope except forthe intermediate stimulus intervals(Fig.6);the upper regression line was identicalwith the heat versus tension relation in a twitch(Fig.2),while the lower regressionline started from the origin.The above finding was facilitated by the temperature
(23-26•Ž)at which the experiments were performed,since the magnitude of tension
increment for a given stimulus interval increased with increasing temperature as
a result of increasing tetanus:twitch tension ratio.
The heat versus tension increment relation in response to the second stimulusshown in Fig.6 can be explained by assuming(1)the TDH versus tension incrementrelation in the second twitch remains nearly constant irrespective of the stimulusinterval(except for the refractory period of muscle action potential,3.5-4 msec
at 23-26•Ž,Kobayashi and Sugi,unpublished),and(2)the amount of TIH pro-
duced by the second stimulus changes depending on the stimulus interval.Thus,
when the second stimulus is given within 20 msec after the first,it produces a
tension increment above tne nrst twitcn ana tne corresponding amount or tun
while the amount of TIH production is very much reduced or eliminated,and asa result the points on the heat versus tension increment plot should fall on a straight
line starting from the origin(the lower regression line in Fig.6).If the secondstimulus is delivered more than 60 msec after the first one,it produces not onlythe tension increment and the corresponding TDH,but also the full TIH of about1 mcal/g(see Fig.2),so that the points should fall on a straight line intersectingthe ordinate at about 1 mcal/g(the upper regression line in Fig.6).At stimulusintervals between 20 and 60 msec,the second stimulus produces both TDH and TIHas well as the tension increment,and the amount of TIH production increases asthe stimulus interval is increased above 20 msec to reach the maximum value ot-about 1 mcal/g at an interval of 60 msec.
Recently,RALL(1979)showed that the slope of the TDH versus tensionrelation in a twitch remained unchanged irrespective of whether the twitch tensionwas varied by changing muscle length or by changing temperature.Similarly,the
present results may be stated so that the slope 01 the"TDH versus tension relationmay also remain nearly constant when the twitch tension is varied by producing
a twitch at various times after the preceding mechanical response, implying that
the tension increment determined as illustrated in Fig.4 is a valid measure of
the magnitude of the second twitch preceded by the first one.
On the other hand,when a twitch was produced at various times after a
Japanese Journal of Physiology

HEAT PRODUCTION IN FROG MUSCLE 627
preceding 0.5 sec tetanus(Fig.7),both the heat production and the tensionincrement in response to the"test"stimulus were vanishingly small when it wasapplied within 120-150 msec after the termination of the"conditioning"repetitivestimuli(Fig.8),and all the data points on the heat versus tension increment plotwere observed to distribute around a single regression line starting from the originirrespective of the stimulus interval(Fig.9).These results indicate that the TIH
production is markedly reduced for a much longer period after a series of repetitivestimuli than after a single stimulus.
Possible source of tension-independent heat.Though the heat productionduring summation of isometric contraction can be accounted for on the basis ofthe two heat components,the source of the TIH,the amount of which changesdepending on the previous stimulation,remains to be determined.The tension-independent heat is generally referred to as activation heat,in the sense that it isindependent of the interaction between the thick and thin filaments to produceisometric tension(cf.HOMSHER and KEAN,1978).In the present experiments,theamount of TIH production in response to the second stimulus was very muchreduced for the first 20 msec after the first stimulus,and the full recovery of TIHtook place in about 60 msec(Fig.6).Meanwhile,the amount of TIH in a twitch
preceded by a 0.5 sec tetanus was markedly reduced for the first 120-150 msecafter the preceding tetanic stimulation(Fig.8),and the presence of a single re-
gression line in the TDH versus tension increment plot(Fig.9)implies that thefull recovery of TIH takes place gradually in about 300 msec.
At present,the most probable sources of activation heat(or TIH)are theenergy dissipated during Ca2+cycling(HOMSHER et al.,1972)and the enthalpychange for Ca2+binding to troponin(YAMADA et al.,1976;POTTER et al.,1977).Concerning the Ca2+cycling,the Ca transients during an isometric twitch reacha peak at the early phase of tension rise,and then decay nearly to zero shortly afterthe peak of twitch tension(BLINKS et al.,1978),roughly corresponding to the time-course of the initial marked reduction and the subsequent recovery of TIH in re-sponse to the second stimulus.The decay of Ca transients after a tetanus,how-ever,precedes the relaxation of tetanus tension,and cannot be compared with thelong-lasting effect of a tetanus in markedly reducing the TIH response to the sub-sequent stimulus(Figs.8 and 9).
With respect to the Ca2+binding to troponin,it has been shown that the ac-companying enthalpy change is sufficient to account for the activation heat
(YAMADA et al.,1976;POTTER et al.,1977).Though the Ca transient experimentsgive no direct information about the actual amount of Ca2+bound to troponi,it seems possible that the binding of Ca2+to one or more of the Ca2+-bindingsites of troponin may be related to the effect of the preceding stimulation in reduc-ing the amount of TIH production in response to the subsequent stimulus.
In connection with the long-lasting effect of a tetanus on the reduction ofTIH production,it is of interest that,in a twitch produced shortly after a preceding
Vol.30,No.4,1980

628 T.KOBAYASHI and H.SUGI
tetanus,the magnitude of Ca transient decreases markedly as compared to thecontrol in spite of a marked potentiation of twitch tension(BLINKS et al.,1978).In addition,YAGI et al.(1977)reported that the intensity ratio of two equatorialreflections(I1,0/I1,1),which is normally regarded as a measure of the cross-links
between the thick and thin filaments (HASELGROVE and HUXLEY,1973),returnedto the resting value at many seconds after a tetanus.These phenomena seemvery likely to originate from the same underlying mechanism as that for effect ofthe previous stimulation in reducing TIH in response to the subsequent stimulus.
We wish to thank Dr.A.Fraser for giving us valuable information about the infrared
radiometer and Professors H.Mashima and K.Yamada for their encouragement,advice andkind cooperation in constructing the radiometer.
REFERENCES
BLINKS J. R., RUDEL R., and TAYLOR, S. R.(1978) Calcium transients in isolated amphibianskeletal muscle fibres: Detection with aequorin. J. Physiol.(Lond.), 277: 291-323.
FRASER, A.(1970) Myothermic radiometry and muscle heat production: Length dependenceof transients during isometric twitches in. frog sartorius muscle. Ph. D. Thesis, The JohnHopkins University.
FRASER, A.(1971) Myothermic radiometry. Rev. Sci. Instrum., 42: 22-26.FRASER, A.(1973) Comments on activation heat and its relation to activation. Cold Spring
Harbor Symp. Quant. Biol., 37: 627-628.FRASER, A. and CARLSON, F. D.(1973) Initial heat production in isometric frog muscle at
15•Ž. J. Gen. Physiol., 62: 271-285.
GIBBS, C. L., RICCHIUTI, N. V., and MOMMAERTS, W. F. H. M.(1966) Activation heat in frog
sartorius muscle. J. Gen. Physiol., 49: 517-535.
GOLAY, M. J. E.(1947) Theoretical consideration in heat and infrared detection with partic-
ular reference to the pneumatic detector. Rev. Sci. Instrum., 18: 347-356.
HARTREE, W. and HILL, A. V.(1921) The nature of the isometric twitch. J. Physiol.(Lond.),55: 389-441.
HASELGROVE, J. C. and HUXLEY, H. E.(1973) X-ray evidence for radial cross-bridge movementand for sliding filament model in actively contracting skeletal muscle. J. Mol. Biol., 77:549-568.
HILL, A. V.(1949) Energetics of relaxation in a muscle twitch. Proc. R. Soc. Lond.(Biol.),136: 211-219.
HOMSHER, E. and KEAN, C. J.(1978) Skeletal muscle energetics and metabolism. Annu.Rev. Physiol., 40: 93-131.
HOMSHER, E., MOMMAERTS, W. F. H. M., RICCHIUTI, N. V., and WALLNER, A.(1972) Activationheat, activation metabolism and tension-related heat in frog semitendinosus muscle. J.Physiol.(Lond.), 220: 601-625.
POTTER, J. D., HSU, F., and POWNALL, H. J.(1977) The thermodynamics of Ca2+ binding totroponin-C. J. Biol. Chem., 252: 2452-2454.
RALL, J. A.(1978) Dependence of energy output on force generation during muscle contraction.Am. J. Physiol.: Cell Physiol., 4: C20-C26.
RALL, J. A.(1979) Effects of temperature on tension, tension-dependent heat, and activationheat in twitches of frog skeletal muscle. J. Physiol.(Lond.), 291: 265-275.
SMITH, I. C. H.(1972) Energetics of activation in frog and toad muscle. J. Physiol.(Lond.),220: 583-599.
Japanese Journal of Physiology

HEAT PRODUCTION IN FROG MUSCLE 629
WOLEDGE, R. C.(1971) Heat production and chemical change in muscle. Prog. Biophys. Mol.Biol., 22: 37-74.
YAGI, N., ITo, M. H., NAKAYAMA, H., IzUMI, T., and MATSUBARA, I.(1977) Return of myosinheads to thick filaments after muscle contraction. Science, 197: 685-687.
YAMADA, K., MASHIMA, H., and EBASHI, S.(1976) The enthalpy change accompanying thebinding of calcium to troponin relating to the activation heat production of muscle.Proc. Jpn. Acad., 52: 252-255.
Vol.30,No.4,1980