Measurement of consumer benefit of competition in retail ...
30
KEO Discussion Paper No. 118 Measurement of consumer benefit of competition in retail outlets ∗ Toshiyuki Matsuura † Keio University and Mitsuru Sunada Japan Fair Trade Commission Abstract In this paper, we estimated the consumer benefits from the competition in retail industry. In our analysis, we incorporated the service quality of retail outlets as outputs. In Japan, in the process of the deregulation of entry restriction on large-scale retail stores, specialty supermarkets have increased its market share with low price strategy. At the same time, despite its high price, the convenience store has increased its market share through 1990s. We demonstrate changes in market share of each retail format are explained by the changes in the service quality of each retail format. ∗ We thank Masahiro Kuroda, Takanobu Nakajima, Hitoshi Hayami, Sadao Nagaoka, Hiroyuki Odagiri, Daiji Kawaguchi, Ayako Suzuki, Kyoji Fukao, Yosuke Okada and other seminar participants at Keio University, Hitotsubashi University, Semi Annual Meeting of Japan Economic Association at Sendai and Research Institute of Economy Trade and Industry (RIETI), Competition Policy Research Center, Japan Faire Trade Commission (CPRC-JFTC) for their helpful comments and suggestion. The views expressed in this paper are ours, and do not reflect the views of RIETI and CPRC-JFTC. † Correspondence author: E-mail: [email protected] 1
Transcript of Measurement of consumer benefit of competition in retail ...

KEO Discussion Paper No. 118
Measurement of consumer benefit of competition in retail outlets∗
Toshiyuki Matsuura† Keio University
and Mitsuru Sunada
Japan Fair Trade Commission
Abstract In this paper, we estimated the consumer benefits from the competition in retail
industry. In our analysis, we incorporated the service quality of retail outlets as outputs. In Japan, in the process of the deregulation of entry restriction on large-scale retail stores, specialty supermarkets have increased its market share with low price strategy. At the same time, despite its high price, the convenience store has increased its market share through 1990s. We demonstrate changes in market share of each retail format are explained by the changes in the service quality of each retail format.
∗ We thank Masahiro Kuroda, Takanobu Nakajima, Hitoshi Hayami, Sadao Nagaoka, Hiroyuki Odagiri, Daiji Kawaguchi, Ayako Suzuki, Kyoji Fukao, Yosuke Okada and other seminar participants at Keio University, Hitotsubashi University, Semi Annual Meeting of Japan Economic Association at Sendai and Research Institute of Economy Trade and Industry (RIETI), Competition Policy Research Center, Japan Faire Trade Commission (CPRC-JFTC) for their helpful comments and suggestion. The views expressed in this paper are ours, and do not reflect the views of RIETI and CPRC-JFTC. †Correspondence author: E-mail: [email protected]
1

1. Introduction Entry regulation has anti-competitive effects, because it prevents innovative new firm
from entering a market and it brings about high price and consequently hinders welfare improvement. Besides, the entry regulation might reduce incumbents’ incentive for innovation due to the lack of threat of a competition hence it might have a harmful effect on productivity growth. Therefore, to stimulate the economic growth, policy makers as well as researchers have strong interest in the competition effects of deregulations of entry.
In Japan, it is well known that the Large-Scale Retail Store Law (LSRS Law, hereinafter) restricted the entry and floor expansion of large scale retailers. Due to the regulations, incumbent large stores enjoyed monopolistic rent and lead to higher prices. And because of lack of competitive pressure, so-called Pop and Mum shops, traditional small stores were allowed to continue their business even if unprofitable. The LSRS Law has been severely criticized through “The Japan-U.S. Structural Impediments Initiative,” in late 1980s and it was gradually relaxed and finally repealed in 2000.
However, contrary to all expectations, the share of large Generalized Merchandise Store (GMS) did not increase so much. Moreover, Carrefour and Wal-Mart, French and U.S., multinational retail chains, struggled in the Japanese retailing market: because of low profitability, Carrefour left Japan in 2005 and, Wal-Mart has not yet succeeded in expanding the market share. Judging from these facts, the deregulation seemed to have not affected Japanese retail market. Nevertheless, so-called new retail formats, such as specialty supermarket (middle-sized discount store) and convenience stores have substantially increased their market shares, which feature low prices or distinctive services. Therefore, to assess the consumer benefits from severe competition due to the deregulations, we should take into account the differentiation in retail services.
The purpose of this study is two fold. First, to measure the welfare gain from increased competition, by shedding light on low price and distinctive service offered by retailing new formats; specialty supermarket and convenience stores; Second, to explore why gigantic GMSs, such as Carrefour and Wal-Mart, failed to dominate retailing market despite abolishment of LSRS Law.
The organization of the paper is as follows. The next section introduces the historical and institutional background of Japanese retail industry and discuses measurement issues. Third section surveys related literature and then, we will present the model at the 4th section. The 5th section explains our data set, while the 6th section will provide estimation results. A summary and conclusion are presented in the final section.
2

2. Background In this section, we first review the historical overview of the entry restrictions.
Second, we present some indicators about Japanese retail market. Third, the definition of retail output will be discussed.
2.1. Historical Overview of Large Scale Retail Store Law (LSRS Law)
In Japan, the business of large-scale retailers has been highly restricted by law to protect the businesses of smaller-sized retailers. 1 The protection for small retail businesses was originated from “Department Store Law” established in 1937. Although the law was once repealed after the WWII by GHQ, it came to life again in 1956 in almost the same manner as before. In 1974, the law was enforced as “Large Scale Retail Store Law (LSRS law)" targeting the stores with floor space with more than 500 meter squares, which includes not only department stores but also large superstores. At the same time the new law had another purpose to restrain new entrants with large capital from abroad. The law has not only been that of protecting smaller businesses but also restricting the competition among large retailers through controlling the entry of new businesses.
In 1978 the law was reinforced. When a large-scale retailer starts a new business in a certain area, it first has to notify the Minster of International Trade and Industry. The minister investigates the effect of the new entry on smaller retailers in that area. If a significant negative effect is expected after the investigation, the minister urges the entrant to modify his business plan regarding their service characteristics such as floor space, business days, closing times, or the number of holidays. The role of the minister is just to illustrate guidelines. Representatives in regional
business districts carry out substantial adjustments. Furthermore, local governments have been allowed to impose additional regulations on an entry of large stores, their floor space and operating hours. Figure 1 (a) and (b) depict the relationship between the food price index by GMS and the entry regulation indices, and between operating hours by GMS and the entry regulations at prefecture level in 1991. The entry regulation indices are based on the information about additional regulations imposed by city or prefecture government. It is an indicator of strictness of entry restrictions. For food price by GMS and the regulations in panel (a), there seems positive correlation between them, suggesting the price level is higher in prefectures with strict entry regulations. The weak negative correlation between operating hours by GMS and the indices in
1 For historical survey on this issue, see Nishimura and Tachibana (1996), Lark (1994) and Mayer-Ohle(2003).
3
panel (b) infers the regulation is effective for not only price level, but also retailers’ service quality, such as operating hours. 2.2. Market Transition
In the 1990s, the trend changed from protectionism to deregulation as a result of ``The Japan-US Structural Impediments Initiative,” which was aimed at creating a Japanese open market and promoting competition. In 1994, LSRS law was eased to give more freedom to new entrants to the retail industry with less than 1000 square meters of floor space. And, finally, in 1998 the law was completely repealed.
Along with the process of deregulation, the entry and exit rate has been increased in late 1990s. Figure 2 presents annual average entry and exit rate of retail outlets from 1979 to 2004. After 1997, both entry and exit rate has been increasing substantially. At the same time, while the share of small retailers has been decreasing, non-traditional, new retail formats has emerged through 1990s. Figure 3 indicates the transition of the sales share among retail formats. While we saw the share of traditional stores has been shrinking from 70% to 58%, specialty supermarkets and convenience stores have substantially increased their market shares2.
On the other hand, from the viewpoint of international comparison, the share of small retailers, such as convenience stores and traditional stores still remain large despite of increased competitive pressure. Compared with US, UK and France, the share of Japanese traditional stores in food retailing is the highest among them (Figure 4). At the same time, although there are substantial industry dynamics, the productivity of retail industry has remained at the same level through 1990s. Figure 5 presents the transition of labor productivity and it indicates upward trend has disappeared after 1990.
These trends are puzzling, since the increased competitive pressure should replace smaller unproductive outlets with large retail outlets along with the increased competitive pressure. A possible explanation is that the conventional labor productivity index could not measure ‘true productivity” accurately, and, especially, it fails to account for changes in both the input and the output. As for the input, Census of Commerce, a comprehensive data source for Japanese retail industry, does not survey input information except for the number of employees. Besides, while the number of part-time worker has drastically increased through 1990s3, the data of each employment status is available only after 1999. In case of the output for retail sector, the situation is
2 The definition of retail formats are summarized in Table 2. 3 According to Matsuura (2007), the ratio of the number of part-time worker to total employee in retail industry has increased from 33.4% to 54.5 between 1991 and 2004.
4

more complicated, because it is related to the question; what is the appropriate definition of retail output? 2.3 How should we define retail output?
The definition of retail output is the much debated topic among economist. Conceptually, as augured by Oi (1992) and Betancourt and Gautschi (1988), the retail outputs are considered as mix of distribution services, such as assortment, assurance and etc. Betancourt and Gautschi (1988) discuss the economic function of retail organization and propose concepts of distribution service in the empirical perspective. According to their definition, distribution service is classified as the following five categories: (1) accessibility of location, (2) assortment, (3) assurance of product delivery in the desired form and at the desired time, (4) information and ambiance. And then, they step forward to the empirical analysis in Betancourt and Gautschi (1993) and Betancourt and Gautchi (1996).
The emergence of non-traditional outlets might be explained by their distinct distribution services. While specialty supermarkets have increased its share by discounting prices, convenience stores have grown its share because of its innovative distribution services4. In Table 1, there is substantial price gap among retail formats. While specialty supermarkets attract consumers with low price products, convenience stores offer relatively high prices among retail formats. The reason why convenience stores have grown its share despite relatively high prices might lie in its distinctive services. For example, advanced information system, such as Pos-System, enables convenience stores to implement advanced merchandising. 7-elven Japan, the largest convenience store operator, deals with their own brand merchandise and it amount to 50% by sales5.
Besides, long business hours and additional services are also fundamental to convenience stores operation. Basically, in Japan, most convenience stores operate 24-hours and offer additional services, such as making photocopies, photo development, postal package handling, and payment of utility charges.
Finally and most importantly, Japanese convenience store chains have well-organized distribution and supply systems. These days, major chains operate deliveries to each retail outlets from 3 to 5 times a day, since Japanese consumers prefers fresh, sometimes
4 Some specialty supermarket chain has increased the market share because of its distinctive services. See chapter 9 to 11 in Larke and Causton (2005). 5 For details of Japanese convenience stores, see chapter 8 in Larke and Causton (2005).
5

highly perishable food products. While the sales share of convenience stores are still low compared with specialty stores, their profitability is competing with that of US-level. According to MGI (2001), the profitability of stores operated by 7-eleven Japan is 50% higher than that of US average level.
In this study, we focus the consumer benefit from distribution servicese. Consumer benefits can be measured by estimating demand function, and in case of US, Hausman and Leibtag (2006) quantified the benefits of price competition by the entry of Wal-Mart. As for the quality of services in retail sector, Sunada (2004) estimated the changes in service quality and consumer welfare for shopping. In this paper, we extend Hausman or Sunada’s specification to incorporate the regional differences of prices and service quality, and estimate consumer benefits from increased market dynamics.
3. Related literature
There are many empirical frameworks, which enable us to estimate a demand structure in differentiated product settings by utilizing the market-level or aggregated data. The most well-known type of such frameworks is the family of logit model. Berry (1994) introduces the useful empirical framework with the extreme-value distribution of consumers preference, and Berry, et al. (1995) apply the random coefficient model to the U.S. automobile market. Other applications of this type of framework are, for example, Nevo (2001) to the U.S. cereal market, Ohashi (2003) to the U.S. VTR market, and Werden and Froeb (1996) to the merger simulation. The logit family may be the most standardized framework in the recent empirical IO literatures.
Feenstra (1995) summarizes the exact hedonic price indexes, which are derived from various random utility models, and among them, he introduce the CES model with the extreme-value distribution of consumers preference, and a different type of functional forms of individual indirect-utility from logit family. Sunada (2004) uses the CES model in order to construct the cost-of living index of the Japanese Retail industry. The most different feature of the CES model from the logit family and (vertical models) is that, while consumers are assumed to purchase only one unit of products in the logit model, there is not such a restriction in the CES model.
On the other hand, Bresnahan (1981 and 1987) analyze the U.S. automobile market utilizing the vertical differentiation model in which differentiated products are ordered in product quality or price, and the marginal utility of product quality is assumed to vary among consumers, and follow a certain type of distribution. Such an ordering structure may be somewhat strong assumption. Sunada (2005) applies the vertical model in order to access the quality change and new products in the Japanese mobile
6
telecommunication market, in which the marginal utility of quality is assumed to conform of the uniform distribution.
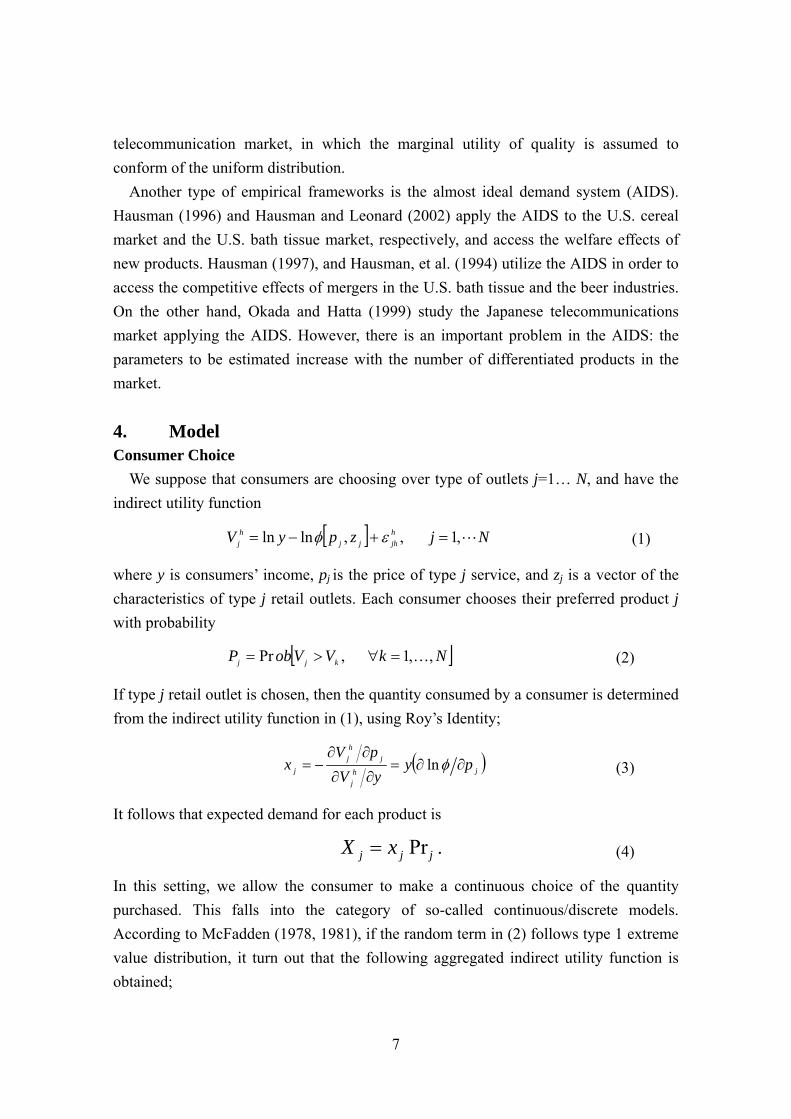
Another type of empirical frameworks is the almost ideal demand system (AIDS). Hausman (1996) and Hausman and Leonard (2002) apply the AIDS to the U.S. cereal market and the U.S. bath tissue market, respectively, and access the welfare effects of new products. Hausman (1997), and Hausman, et al. (1994) utilize the AIDS in order to access the competitive effects of mergers in the U.S. bath tissue and the beer industries. On the other hand, Okada and Hatta (1999) study the Japanese telecommunications market applying the AIDS. However, there is an important problem in the AIDS: the parameters to be estimated increase with the number of differentiated products in the market. 4. Model Consumer Choice
We suppose that consumers are choosing over type of outlets j=1… N, and have the indirect utility function
[ ] NjzpyV hjhjj
hj L,1,,lnln =+−= εφ (1)
where y is consumers’ income, pj is the price of type j service, and zj is a vector of the characteristics of type j retail outlets. Each consumer chooses their preferred product j with probability
[ ]NkVVobP kjj ,,1,Pr K=∀>= (2)
If type j retail outlet is chosen, then the quantity consumed by a consumer is determined from the indirect utility function in (1), using Roy’s Identity;
( jhj
jhj
j pyyV
pVx ∂∂=
∂∂
∂∂−= φln ) (3)
It follows that expected demand for each product is
.Pr jjj xX = (4)
In this setting, we allow the consumer to make a continuous choice of the quantity purchased. This falls into the category of so-called continuous/discrete models. According to McFadden (1978, 1981), if the random term in (2) follows type 1 extreme value distribution, it turn out that the following aggregated indirect utility function is obtained;
7

[ ]11
11111 ),(,,),(lnln),,,,,( −−+= NNnN zpzpHyyzpzpG φφ KK (5)
CES Demand System Here, we specify the individual utility function as CES form, such as,
[ ] hjhjj
hj zfpyV εα +−= )(lnln 0>α , (6)
where we are measuring prices relative to consumers’ perceived “quality” of products f(zj).
We will choose the function H as linear such as,
∑ =
−−− =N
j
jN eeeH1
),,( 1 εεε K , (7)
We obtain the aggregated utility function as
[ ]∑ =
−==N
j jjNN zfpyyzpzpGU111 )(),,,,,( α
L , (8)
so that expected aggregate demand is
[ ] ⎟⎟
⎠
⎞
⎜⎜
⎝
⎛ ⋅=
∂∂∂∂
−=∑ =
−
−−
N
k kk
jjjj
zfp
zfpy
yGpG
X1
1
)(
)(//
α
αα, (9)
The elasticity of substitution for CES indirect utility function or associated CES demand function is 1+α .
Given this demand function, market share function for type j service is reduced as follows;
( )[ ]∑∑
=
−
−
== N
k kk
jj
k kk
jjj
zfp
zfpXp
XpS
1)(
)(α
α
(10)
Specify service quality function as )exp()( jjj zzf ζγ += , we obtain the following
regression equation to be estimated.
( ) ( jijij
i
j
i
jj
ii zzpp
SS
XpXp ξξαγαα −+−⋅+⎟
⎟⎠
⎞⎜⎜⎝
⎛−=⎟
⎟⎠
⎞⎜⎜⎝
⎛=⎟
⎟⎠
⎞⎜⎜⎝
⎛lnlnln ) (11)
jξ is the unobservable service characteristics of type j retail outlet, which is a random
variable with the mean equal zero. Nested CES system
8

Now, suppose that the consumers have a choice between two levels of the differentiated retailing service. The structure of consumer choice is presented in Figure 6. First, an individual decides whether to purchase a product from each of g=1,…, G groups (for example, GMS, specialty supermarket store, or convenience store), and second, the individual decides which of outlets in that group to purchase. Suppose that
the outlets available in each group g are denoted by . Utility for
consumer h is given by the following equation.
},,1{ NJ g K⊂
[ ] hjhjj
hj zfpyV εα +−= )(lnln 0>α . (12)
Following from Berry(1994), the random error term are defined as follows. hjε
,)1( hj
hg
hj eρζε −+= for gJj∈ (13)
where the errors are iid extreme value. hje
We will choose the function H as linear such as,
[ ] )1(
0
)1/(),,( 1g
g
gjNG
g JjeeeH
ρρεεε −
= ∈
−−−− ∑ ∑=K , (14)
We obtain the aggregated utility function as
[ ][ ] )1(
0 1)1/(
11 )(),,,,,(g
gG
g
N
j jjNN zfpyyzpzpGUρρα −
= =
−−∑ ∑== L , (15)
so that expected aggregate demand is
,)(//
1
)1(
)1(
∑ =
−
−
×⎟⎟⎠
⎞⎜⎜⎝
⎛=
∂∂
∂∂−= G
g g
g
g
kk
j
jj
g
g
D
DD
zfppyy
yGpG
Xρ
ρα
, for (16) gJj∈
where the term [ ]∑ ∈
−−=Jj kkg
gzfpD )1/()( ραis the “inclusive value”
The expected demand on the right-hand side of (16) is composed of three terms: the frist
term ⎟⎟⎠
⎞⎜⎜⎝
⎛
jpyy α
, is the conventional Cobb-Douglas demand function, the second term,
gkk Dzfp )( , is the share or the probability of choice of outlets j in the demand for
group of retailing format g, the third term, ∑ =
−− G
g gggg DD
1
)1()1( ρρ, is the share or the
9

probability of choice of group of retail format g. Here, we assume the symmetry of price pj and zj within group g, in other words, we
assume pj=pg, f(zj)=f(zg) and for gJj∈ 6.
Since [ ] [ ] gggJj kkg NzfpzfpD gg )1/()1/( )()( ραρα −−
∈
−− ==∑ , the aggregated
demand function is derived as follows;
( )[ ] ⎟
⎟
⎠
⎞
⎜⎜
⎝
⎛=
∂∂
∂∂−=
∑ =
−−
−−
L
l lll
ggg
gg
jj
g
g
Nzfp
NzfpNp
yyGpG
X1
)1(
)1(
)(
)(1//
ρα
ραα
(17)
( )[ ] ⎟
⎟
⎠
⎞
⎜⎜
⎝
⎛==
∑ =
−−
−−
L
l lll
ggg
ggjg
g
g
Nzfp
NzfppyNXX
1
)1(
)1(
)(
)(ρα
ραα
(18)
Given this demand function, market share function for type j service is reduced as follows;
( )[ ]∑∑
=
−−
−−
== L
l lll
ggg
l ll
ggg
g
g
Nzfp
NzfpXp
XpS
1
)1(
)1(
)(
)(ρα
ρα
(19)
Specify service quality function as )exp()( ggg zzf ξγ += , we obtain the following
equation to be estimated. gξ is the unobservable service characteristics of type g retail
format, which is a random variable with the mean equal zero.
( ) ( )''''''
ln)1(lnlnln ggg
ggji
g
g
g
g
gg
gg
NN
zzpp
SS
XpXp
ζζαργαα −+⎟⎟⎠
⎞⎜⎜⎝
⎛−+−⋅+⎟
⎟⎠
⎞⎜⎜⎝
⎛−=⎟
⎟⎠
⎞⎜⎜⎝
⎛=⎟
⎟⎠
⎞⎜⎜⎝
⎛ (20)
Notice that if gρ =1, the increase in Ng does not affect the affect the share of group g7 .
On the other hand, when 0< gρ <1, the sales share of group g increases as entry of
outlets in group g .
6 This specification is proposed and used by Berry and Waldfogel (1999), which quantifies the social inefficiency of free entry in radio broadcasting. 7 When gρ =1, increases Ng does affect only the sales share of outlet j in each group of retail format g. For details, see Appendix A.
10

Extension: Welfare We now demonstrate how we can estimate the changes in consumer welfare that arise
form the expansion of variety of service. The correspondence expenditure function to the social welfare function or indirect
utility function (21),
[ ][ ][ ]( ) .)(
)():,,(
1
0
)1(
1)1(
0 1)1/(
GNzfp
GzfpzpUE
G
g ggg
G
g
N
j jj
g
gg
−
=
−−
−−
= =
−−
∑
∑ ∑
=
⎟⎠⎞⎜
⎝⎛=
ρα
ρραα. (21)
We define compensating variation as the log-difference in the consumers’ expenditure function, holding utility constant at the beginning of the periods;
):,,,(ln):,,,(ln 111000 αα NzpNzp UEUECV −= . (22)
where is the price and quality index and number of outlets in the beginning of sample periods and are those of the end of sample periods.
000 ,, Nzp111 ,, Nzp
Following from Sunada (2005), the changes in compensation variation can be decomposed into two parts as follows;
pNq CVCVCVUEUEUEUEUEUECV
++=−+
−+
−=
):,,,(ln):,,,(ln):,,,(ln):,,,(ln):,,,(ln):,,,(ln
111110
110010
010000
αα
αα
αα
NzpNzpNzpNzpNzpNzp
(23)
The first term CVq represents the increase in welfare due to the average quality change, holding the prices and number of outlets in group g at their pre-change level. The second term CVN and third term CVp are the welfare changes due to the changes in number of outlets and prices respectively, holding other factors fixed. The increase in CVN is considered as the effect of changes in share of retail format with high service quality. 5. Data and Estimation Methodology
11

Our dataset is food retailing outlets prefecture-level panel dataset covering 1991, 1997 and 2002. The primary data source is the Census of Commerce, which is compiled by the Ministry of Economy, Trade and Industry. The Census of Commerce covers all the establishments which belong to wholesale and retail industry. From the Census, we can obtain the sales by commodity, and characteristics of establishments. One limitation of the Census is the lack of cost and price information. Therefore, as for the price information, we use National Survey of Prices (Ministry of Internal Affaire and Communication), which provides us the commodity-level price information by region and the type of retail outlets (retail formats). Since the Census of Commerce and the Survey of Price have different definition of the retail formats, we aggregated establishment-level data of the Census of Commerce in order to match the definition of type of retail formats in Survey of Price. Table 2 indicates our definition of retail formats. Note that not all specialty superstores have been affected by deregulation, because they contain stores with floor space less than 500 meter squires, which are not covered by LSRS raw. However, the sales share of the stores with floor space between 250 and 500 meter squires in total specialty superstores is 1.2% in 2002. Therefore, we consider the entry of specialty superstores has been strongly affected by deregulations. And we assume the retailing markets are segmented by region, that is, 47 prefectures. The food retailing sales shares by retail format are presented in Figure 78. Price indices by region, and retail formats are estimated by aggregating commodity-level price with the weight of Consumer Price index (Ministry of Internal Affaire and Communication). As for the service quality indicator, we use “Log of operating hours”, “Goods in stock
per sales”, “Single store ratio”, “Log of floor space per employee”, “Method of payment” and “Breadth assortment.” “Log of operating hours” is the proxy for time accessibility or assurance of product delivery. We expect a positive significant effect of “Log of operating hours” on the market share. “Goods in stock per sales” is the inverse of merchandise turnover ratio, and it is defined as the ratio of value of stocks to sales of products. Low “Goods in stock-sales ratio” imply adoption of just-in time delivery system, which enables retailers to provide fresh food products with customers. We expect positive and significant coefficient. “Log of floor space per employee” is proxy for broad assortment services or information supply for customer. Retailing outlets with larger floor space offer broader variety of products. On the other hand, to provide sufficient information of prices or characteristics of products for customers, managers have to increase the number of employees. The expected sign of the coefficient will be
8 Although GMS deals with various products, sales data here are restricted to food and beverage products.
12

positive or negative depending on consumers’ preferences. “Method of payment” is defined as the ratio of cash settlement to total sales, which suggest an index for variety of payment. While most of non-traditional or chain stores usually offers variety of methods of payments, such as davit card, credit cards or prepaid electric money card, traditional stores does not. Thus, the negative sign is expected for the coefficient. “Single store ratio” will have negative effect on the market share, since single stores are inferior to multiple stores in terms of providing information of prices, availability and other characteristics. “Breadth assortment” means dealing with broad variety of product lines. The following index is used as the proxy for “Breadth assortment”,
∑ =−=
K
k ikiD1
21 ω ,
where ikω indicates sale share of products k for outlet i9. The more retail outlets deals with the product lines, the index D will approach 1. On the other hand, Retail outlets dealing with only 1 product line have D=0. This index is calculated by each establishment, and aggregated by prefecture and retail formats with the sales share weight. We constructed two indexes according to commodity basket. One is the index calculated over all commodities, and the another one is calculated only about food and beverage products. While former indicates the depth of assortment regarding all commodities, the latter represents width of variety within food and beverage products. Finally, to capture unobservable format specific service quality, sales format dummy variables are included in the equation. Table 3 indicates summary of variables we used as service characteristics for food retailing outlets. While Convenience stores have the second highest price level, their distinctive services are reflected by longer operating hours and low goods in stock per sales.
Since the relative price and number of outlets are considered as endogenous variables, the OLS estimates are not consistent. Therefore, the instrument variables are needed. In our study, as discussed in Barry (1994), Berry, et al. (1995), Hausman (1996), and Nevo (2001), we use standard instrumental variables, such as (1) the observed own service characteristics, (2) the mean of service characteristics of other type of retail formats, (3) the mean of price of same retail formats in other market (prefecture), and (4) cost side variables; average wage by prefecture and retail formats. We obtain wage information from Census of Wage Structure (Ministry of Health and Labor). 6. Estimation Results 9 Product line is defined according to 4 digit commodity code.
13

The estimation results are presented in Table 4. We estimated the model with both OLS (Model 1 and Model 3) and GMM (Model 2, Model 4) including retail format dummies, prefecture dummies and year dummies. While OLS estimates for the coefficients of relative price are all positive, those for GMM are negative and significant. The specification of Model 1 and Model 2 does not include log of number of outlets, which is equivalent to CES demand function expressed as in the equation (11). Nested CES specification is estimated in Model 3 and Model 4, and the coefficients for
log of number of outlets, which are correspondence with 1- gρ , are estimated between 0
and 1. Moreover, while the Hansen’s J test is rejected for Model 2, Model 4 does not; therefore we conclude the nested CES demand specification is more appropriate than CES demand specification10.
Focusing on other variables in Model 4, log of operating hours, method of payments, single stores ratio and two breadth assortment have also significant coefficients and expected sign. Negative coefficients for “Goods in stock per sales” suggest that since low “Goods in stock per sales” implies adoption of just-in time delivery systems, consumers highly evaluate those outlets which provide fresh food products. The coefficients for log of floor space per employee are negative but insignificant for nested CES model with the GMM estimation.
Furthermore, using estimated parameters, we calculated the quality indices by retail formats. Since dummy variable for retail format captures service quality each retail format offers, we regard the coefficient for retail format dummy as part of service quality. The indices are normalized so as the quality index for traditional store in 1991 to be 1.0. The estimated indices are presented in Table 5. We can find substantial variation in quality indices among retail formats. The services quality indices for large retailers, such as GMS, Specialty superstores and Department stores are almost 2 or 2.5 times larger than that of Traditional stores. Convenience stores offer the highest services quality. In addition, services quality for Convenience stores has been increasing during sample periods and it has amounted to 3.56 in 2002. Therefore, the substantial share increase for convenience stores can be attributed to the improvement of its service quality.
Table 6 presents the annual average welfare change and its decomposition. In this calculation, changes in price are measured as relative price changes against general CPI. 10 Wald test statistics for significance of log of number of outlets in Model 4 is 58.55 and the null hypothesis is rejected at the 1% level of significance. Test statistics for the hypothesis gρ =0 is 9.17 and rejected at 1% level of significance, as well.
14

The annual average welfare changes between 1991 and 2002 are around 3.7% to 1.9%, more than half of which are explained by CVq, the quality changes. It amounts to 2.1% or 1.2% between 1991 and 1997 and between 1997 and 2002, respectively. We also found significant contribution of CVN (1.4%) during 1990s. Since CVN is considered as the effects of changes in share of number of outlets by retail format, positive CVN
reflects the decreases in stores with low service quality, such as traditional stores and the increases in non-traditional stores. Considering the fact that there is substantial increase in consumers’ perceived quality for convenience store in sample periods and the increases in the share, emergence of convenience store have played an important role of changes in welfare for food retailing. 7. Discussion
Combined with the estimation results and service characteristics by sales format in table 3, the reason why GMS failed to expand market share despite deregulation is mainly due to insufficient price competitiveness and failure to differentiate its service characteristics against specialty superstores. For example, in table 3, while the price index for GMS is 0.963, that for specialty superstores is 0.907. Index for operating hours and goods in stock per sales for GMS are also same with those for specialty superstores. And insignificant coefficient on floor space per employment reflects the fact that Japanese consumers dose not place an importance on huge floor space for daily food shopping. According to Aoyama (2007), retailing MNEs, such as Wal-Mart and Carrefour, has succeeded in oversea market by collaborating with manufacturers and adopting factory-direct model, which enables them to undercut competitors’ prices. However, in Japan, their offers are refused by Japanese manufacturers and failed to adopt the model, thus, both had no cost advantages. Besides, taking advantages of huge floor space, Carrefour and Wal-Mart stick to their strategies for low-cost operations, such as stack-them-up-and-sell-them-cheap strategy, where products are displayed without being taken out of corrugated boxes. However, bulk purchase is not familiar with Japanese consumers and that strategy failed to lure consumers.
8. Concluding remarks
In this paper, we propose the framework which enables us to evaluate consumer benefits from the competition in retail industry. In our framework, we incorporated the service quality of retail outlets as outputs. In Japan, in the process of the deregulation of entry restriction on large-scale retail stores, specialty supermarkets have increased its market share with low price strategy. At the same time, despite its high price, the
15

convenience store has increased its market share through 1990s. We demonstrate changes in compensation variation are explained by the changes in prices, the number of outlets and the service quality of each retail format. However, this research offers various agenda for future research. First, since our data is based on prefecture panel data set, we can compare the changes in welfare among regions. Market structure for food retailing sector varies significantly between major metropolitan areas and other areas. According to Matsuura and Motohashi (2006), the growth rate of sales for specialty supermarket stores for rural area has been significantly larger than for major metropolitan areas between 1997 and 2002, reflecting the fact that there is substantial increase in car ownership rate in rural areas and it encourages consumers to go shopping at large scale specialty supermarket in outside city. Second, our framework enables us to make an international comparison on the
differences in services quality and consumer gains from retail outlets. The difficulties in international comparison on the productivity in services sector lie in incorporating the differences in consumer testes. In our framework, we can expect differences in consumer testes are reflected by parameters for price and service characteristics. Third, this research framework can be applied not only to retail industry, but also to
other service sector with service differentiation, such as hotel, amusement park and restaurant. There are difficulties in estimating productivity in those sectors since conventional output index are not adjusted quality change. However, our framework enables us to estimate quality adjusted cost of living index based on compensation variation and construct quality adjusted output index. Productivity in services sector has recently been paid much attention to by economists, thus it must be promising research agenda.
16

References Aoyama, Y (2007) “Oligopoly and the Structural Paradox of Retail TNCs: an
Assessment of Carrefour and Wal-Mart in Japan,” Journal of Economic Geography, 7, 66.471-490.
Berry, S. T. (1994), “Estimating Discrete-Choice Model of Product Differentiation,” RAND Journal of Economics, 25(2), pp. 242–262.
Berry, S. T., J. Levinson, and A. Pakes (1995) “Automobile Prices in Market Equilibrium,” Econometrica, 63(4), pp. 841–890.
Berry, S. T., and J. Waldfogel (1995) “Free Entry and Social Inefficiency in Radio Broadcasting,” Rand Journal of Economics, 30(3), pp. 397-420.
Betancourt, R. (2004). The Economics of Retailing and Distribution, Northampton: Edward Elgar
Betancoutr, R. and D A. Gausschi, (1988) “The Economics of Retail Firms,” Managerial and Decision Economics, 24, pp. 1034-1052.
Betancoutr, R. and D A. Gausschi, (1996) “An International Comparison of the Determinants of Retail Gross Margins,” Empirica, 23, pp. 173-189.
Betancoutr, R. and D A. Gausschi, (1993) “The Outputs of Retail Activities: Concepts, Mesurement and Evidence from U.S. Census Data,” Review of Economics and Statistics, 75, pp. 294-301.
Bresnahan, T. F. (1981) “Departures from Marginal-Cost Pricing in the American Automobile Industry,” Journal of Econometrics, 17(2), pp. 201–237.
Bresnahan, T. F. (1987) “Competition and Collusion in the American Automobile Industry: the 1955 Price War,” Journal of Industrial Economics, 35(4), pp. 457–482.
Feenstra R. C, (2004) Advanced International Trade: Theory and Evidence Princeton University Press
Hausman, J. (1997) “Valuation of New Goods Under Perfect and Imperfect Competition,” in T. F. Bresnahan and R. J. Gordon, eds., The Economics of New Goods, National Bureau of Economic Research Studies in Income and Wealth, 58, Chicago: University of Chicago Press, pp. 209–237.
Hausman, J. and E. Leibtag (2006) “Consumer Benefits from Increased Competition in Shopping Outlets: Measuring the Effects of Wal-Mart,” NBER Working Paper No. 11809. Forthcoming Journal of Applied Economics.
Hausman, J. and G. K. Leonard (1997) “Economic Analysis of Differentiated Products Mergers Using Real World Data,” George Mason Law Review, 5(3), pp. 321–346.
Hausman, J. and G. K. Leonard (2002) “The Competitive Effects of a New Product
17

Introduction: a Case Study,” Journal of Industrial Economics, 50(3), pp. 237–263. Hausman, J., G. Leonard, and J. D. Zona (1994) “Competitive Analysis with
Differentiated Products,” Annales D’Economie et de Statistique, 34, pp. 159–180. Larke, R. (1994). Japanese Retailing, London: Routledge. Matsuura, T. (2007), “Productivity improvement in service sector; Retail industry of
Japan,” prepared for the APO research meeting in 29th November, 2007. Matsuura, T. and K. Motohashi. (2006), “Entry and Exit of Large-scale Retail Stores
and Revitalization of City Center Districts,” RIETI Discussion Paper, 06-J-051 (in Japanese)
Mayer-Ohle, H. (2003), Innovation and Dynamics in Japanese Retailing- Rrom Techniques to Formats to Systems, Hampshire: Palgrave Macmillan.
McFadden, D. (1978) “Modeling the Choice of Residential Location," in Spatial Interaction Theory and Planning Models, ed. by A. Larlqvist, L.Lundqvist, F.Snickars, and J. Weibull, North-Holland.
McFadden, D. (1981) “Econometric Models of Probabilistic Choice." in Structual Analysis of Discrete Data with Econometric Applications, ed. by C F. Manski and D McFadden, MIT Press.
Mckinsey Global Institute. (2000) Why the Japanese Economy is not Growing; micro barriers to productive growth
Nevo, A. (2001) “Measuring Market Power in the Ready-to-Eat Cereal Industry,” Econometrica, 69(2), pp. 307–342.
Nishimura, G. K., T. Tachibana. (1996) “Entry Regulations, Tax Distortions and the Bipolarized Market: the Japanese Retail Sector,” Sato, R., R. Ramachandran., H., Hori eds. in Organization, Performance, and Equity: Perspectives on the Japanese Economy, Kluwer Academic Publication, pp. 1-57.
Ohashi, H. (2003) “The Role of Network Effects in the US VCR Market, 1978–1986,” Journal of Economics & Management Strategy, 12(4), pp. 447–494.
Oi, Walter (1992) “Productivity in the Distributive Trades: The Shopper and the Economies of Massed Reserves,” in Output Measurement in the Service Sector, ed. by Z. Grilliches, Chicago: University of Chicago Press.
Okada, Y. and K. Hatta (1999) “The Interdependent Telecommunications Demand and Efficient Price Structure,” Journal of the Japanese and International Economies, 13(4), pp. 311–335.
Sunada, M. (2004) “Measuring the COL Index, Output and Productivity Growth of Service Industries: The Case of the Japanese Retail Industries,” Keio University Market Quality Research Project Discussion Paper Series, the 21st Century Center
18

of Excellence Program, Graduate School of Economics and Graduate School of Business and Commerce, Keio University, DP2004-14.
Sunada, M. (2005) “Welfare Effects of Quality Change and New Products in the Japanese Mobile Telecommunications Market: 1995-2001,” Economics of Innovation and New Technology, 14(8), pp. 715-733.
Werden, G. J., L. M. Froeb, and T. Tardiff (1996) “The Use of the Logit Model in Applied Industrial Organization,” International Journal of the Economics of Business, 3(1), pp. 83–105.
19

Appendix A: Historical overview of Large Scale Retail Law In Japan, the business of large-scale retailers has been highly restricted by law to
protect the businesses of smaller-sized retailers. 11 The protection for small retail businesses was originated from “Department Store Law” established in 1937. Although the law was once repealed after the WWII by GHQ, it came to life again in 1956 in almost the same manner as before. In 1974, the law was enforced as “Large Scale Retail Law (LSR law)" targeting not only department stores but also large superstores. At the same time the new law had another purpose to restrain new entrants with large capital from abroad. The law has not only been that of protecting smaller businesses but also restricting the competition among large retailers through controlling the entry of new businesses. In 1978 the law was reinforced. When a large-scale retailer starts a new business in a
certain area, it first has to notify the Minster of International Trade and Industry. The minister investigates the effect of the new ently on smaller retailers in that area. If a significant negative effect is expected after the investigation, the minister urges the entrant to modify his business plan regarding such items as floor space, business days, closing times, or the number of holidays. The role of the minister is just to illustrate guidelines. Representatives in regional
business districts carry out substantial adjustments. Furthermore, local governments have been allowed to impose additional entry regulations on large stores. In the 1990s, the trend changed from protectionism to deregulation as a result of ``The
Japan-US Structural Impediments Initiative," which was aimed at creating a Japanese open market and promoting competition. In 1994, LSRS law was eased to give more freedom to new entrants to the retail industry with less than 1000 square meters of floor space. And, finally, in 1998 the law was completely repealed.
11 For historical survey on this issue, see Lark (1994) and Mayer-Ohle(2003).
20

Appendix A: The effects of the increase in Ng on market share.
As we saw in the equation (10), the share or choice probability of group g is
∑ −−
−−
=l lll
gggg g
g
Nzfp
Nzfpρα
ρα
1/1
1/1
))(/(
))(/(Pr .
Therefore, the elasticity of choice probability of group g to Ng , gη ,is
)Pr1)(1())(/(
))(/(1)1(
PrPr
1/1
/1
jg
l lll
gggg
g
g
g
gg g
g
NzfpNzfpN
N−−=
⎥⎥⎦
⎤
⎢⎢⎣
⎡−−=
∂
∂=
∑ −−
−−
ρρη ρα
ρα
One the other hand, the choice probability of outlet j in group g is
∑ −−
−−
==l lll
ggg
gggjj g
g
NzfpNzfp
N ρα
ρα
1/1
1/1
| ))(/())(/(1PrPrPr ,
where 0 ≤ ≤ 1. gρ
If = 1, gρ
0=gη and 1−=jη . Therefore, while the share of outlets j in group g is
decreasing as increase in Ng, the share of group g dose not.
If = 0, gρ ∑ −
−
=l lll
ggj Nzfp
zfpα
α
/1
/1
))(/())(/(
Pr ,
0Pr1))(/())(/(
1 /1
/1
<−=−=∑ −
−
jl lll
ggg Nzfp
zfpα
α
η ,
jl lll
ggj Nzfp
zfpPr
))(/())(/(
/1
/1
−=−=∑ −
−
α
α
η .
Hence,
jg Pr10 −≤≤η and jj Pr1 −≤≤− η . So, when 0< < 1, increases in Ng
accompanies the increases in the share of group g and the decreases in the share of outlet j in group g.
gρ
21

Table 1. Price gap by products and retail formats
013 Pillow type instantnoodle, Chicken Ramen(per package, Yen)
078 Plain yogurt, MEIJIBulgaria LB51 (500ml,Yen)
023 Microwave, ToshibaER-VS6 (Yen)
108 Imported dress shirt,made in South East Asia,35-percent-cotton, 65-percent polyester (Yen)
130 Toothpaste, LionDentor T Lion (170g,Yen)
Average price in all over Japan 81.60 228.17 81,169 2,298 212.0Average price in Tokyo 82.30 231.81 81,230 2,316 213.1Chain Supermarket 82.06 230.21 79,442 2,295 216.0Other Supermarket 81.14 227.60 71,500 1,682 210.7Convenience stores 83.74 235.70 - - 223.0Department stores 83.59 239.61 86,037 2,279 224.3General retail outlets 82.30 236.02 80,855 2,313 207.2Source: National Price Survey in 1992, Management and coordination Agency
22

Table 2. Definition and Concordance of Retail Formats
(1) The definition of retail formatsSelf-service system Sales floor space Operating hours Note
1 GMS Yes 3000m2 or over 22 Specialty supermarket Yes 250m2 or over 33 Department stores No 3000m2 or over 2
Traditional stores No
5 Convenience stores Yes between 30m2 and 250m2 14 hour or moreNote 1) Self-service stores are defined as those establishments who adopt the self-service system in 50% or more of the sales floor.The "Self-service system" means that the establishment meets the following conditions;
i) Merchandise are put on the shelf unwrapped or prepackaged with price labeled on them.ii) Shopping baskets or shopping carts are provided for customers.iii) Customers pay for all of the purchases at the check-out counters.
2) Department and General supermarkets are stores that retail clothing, food and housing products,in which retail sales for each of these categories is over 10% but under 70%.
3) Specialty supermarkets are those stores which retail clothing, food or housing products, one of which retail sales is 70% or over
(2) Concordance of Retail formats
1997, 2002 19921 GMS Supermarket Chain Supermarket General Supermarkets2 Specialty supermarket Specialty supermarket Other Supermarket Specialty supermarket3 Department stores Department stores Department stores Department stores
Other SupermarketTraditional stores Specialty stores
Semi-specialty stores5 Convenience stores Convenience stores Convenience stores Convenience stores
4
4
Census of Commerce
General retail outlets General retail outlets
National Survey of Price
23

24
Table 3. Average service characteristics for food retailing outlets(i) Price level 1991 1997 2002
1 GMS 0.908 0.991 0.9632 Specialty Supermarkets 0.922 0.966 0.9073 Department store 1.024 1.121 1.1394 Traditional store 0.96 0.974 0.9535 Convenience store 0.969 1.021 0.982
(ii) Operating hours 1991 1997 20021 GMS 0.385 0.425 0.4522 Specialty Supermarkets 0.419 0.448 0.453 Department store 0.364 0.384 0.3884 Traditional store 0.423 0.419 0.4055 Convenience store 0.71 0.878 0.919Note: Operating hours are divided by 24.
(iii) Single stores ratio 1991 1997 20021 GMS 0.047 0.029 0.022 Specialty Supermarkets 0.192 0.172 0.1383 Department store 0.181 0.152 0.214 Traditional store 0.806 0.781 0.7775 Convenience store 0.753 0.799 0.774
(iv) Goods in stock per sales 1991 1997 20021 GMS 0.07 0.08 0.092 Specialty Supermarkets 0.06 0.08 0.093 Department store 0.10 0.09 0.084 Traditional store 0.14 0.14 0.145 Convenience store 0.05 0.04 0.04Note: Goods in stock per sales = Value of goods in stock/Total Sales
(v) Floor space per employee 1991 1997 20021 GMS 37.89 48.60 42.822 Specialty Supermarkets 24.98 33.76 34.313 Department store 34.55 45.52 55.024 Traditional store 15.07 17.26 17.355 Convenience store 11.59 10.57 8.39
(vi) Method of Payments 1991 1997 20021 GMS 0.266 0.208 0.1182 Specialty Supermarkets 0.650 0.650 0.5273 Department store 0.022 0.039 0.0514 Traditional store 0.431 0.435 0.4425 Convenience store 0.655 0.696 0.704Note: Method of payments defined as ratio of cash settlement to total sales
(vii) Index of breadth assortment 1991 1997 20021 GMS 0.74 0.72 0.682 Specialty Supermarkets 0.25 0.24 0.243 Department store 0.81 0.80 0.784 Traditional store 0.15 0.16 0.155 Convenience store 0.26 0.31 0.35
Source: Authors' calculation based on Census of Commerce.

Table 4. Estimation result of market share equationModel 1 Model 2 Model 3 Model 4
Number of obs 1410 1410 1410 1410Adj R-sq: 0.9229 0.9229 0.9739 0.9739Relative price 0.82 -4.94 1.23 -1.45
[3.53]*** [-4.68]*** [9.11]*** [-1.84]*Log(Number of outlets) 0.82 0.65
[51.29]*** [6.92]***Log(operating hours) 1.95 2.39 0.59 1.01
[13.32]*** [11.53]*** [6.60]*** [4.42]***method of payments -0.25 -0.18 -0.29 -0.24
[-2.71]*** [-1.73]* [-5.38]*** [-3.67]***Good in stock per sales -0.19 -3.36 -3.74 -4.27
[-0.35] [-3.68]*** [-11.30]*** [-7.28]***Single store ratio -0.63 -0.39 -0.3 -0.35
[-6.86]*** [-2.35]** [-5.65]*** [-3.43]***Log(Floor space per employee -0.07 0.13 -0.09 -0.01
[-1.27] [1.57] [-2.87]*** [-0.30]Breadth assortment 0.57 0.47 0.39 0.39(all products) [6.45]*** [4.35]*** [7.51]*** [6.71]***Breadth assortment 1.34 1.47 0.83 1.00(food and beverage) [6.13]*** [5.63]*** [6.50]*** [6.52]***Sales format dummy(base= GMS)
Speciality Supermarket -0.08 0.03 2.14 1.64[-0.39] [0.10] [16.27]*** [5.79]***
Department 2.26 2.13 1.75 1.73[16.71]*** [9.34]*** [22.07]*** [12.70]***
Traditional store -0.91 0.07 2.33 2.01[-4.07]*** [0.22] [16.12]*** [6.18]***
Convenience store 3.56 3.8 -0.21 0.64[29.18]*** [22.34]*** [-2.10]** [1.35]
const -0.1 -0.28 -0.02 -0.17[-1.06] [-3.20]*** [-0.36] [-4.26]***
Prefecture dummy Yes Yes Yes YesYear dummy Yes Yes Yes YesEstimation Method OLS GMM OLS GMMHansen J Statistics 16.695 5.445Chi-sq p-value 0.011 0.364Note: 1) Figures in brackets are t-value.2) "***","**", and "*" represents level of significance at 1%, 5% and 10%, respecti
25

Table 5. Estimated Quality Indices by sales formats1991 1997 2002
1 General Supermarkets 2.701 2.799 2.9132 Specialty supermarket 2.038 1.913 1.9123 Department stores 2.207 2.439 2.4554 Traditional stores 1.000 1.009 0.9905 Convenience stores 2.348 3.194 3.560
Note; The quality indices are estimated by using estimated regression coefficients and normalized so that Traditional stores' in 1991 equals 1.
Table 6. The decomposition of annual average welfare changes
Table 6. The decomposition of annual average welfare chan1991-1997 1997-2002
CV 3.7% 1.9%CV q 2.1% 1.2%
CV N 1.4% 0.1%
CV p 0.2% 0.5%
26

Figure 1 panel (a)
0.82
0.84
0.86
0.88
0.9
0.92
0.94
0.96
0.98
1
0 2 4 6
Regulation index
Food
Pric
e (G
MS)
Food Price (GMS) v.s. Regulation Index
8
panel (b)
8.8
9
9.2
9.4
9.6
9.8
10
10.2
0 2 4 6 8
Regulation Index
Ope
ratin
g H
ours
Operating Hours (GMS) v.s. Regulation Index
27

7.9%5.9%
4.3%
2.6%2.3%3.2%2.7%2.6%
3.5%
-9.9%-9.6%-5.9%
-4.7%
-2.6%-3.3%-4.4%
-1.7%-2.4%
1.1% 0.9%
-1.6%-0.2% -0.3%
-2.0% -1.6%
-3.7%-2.0%
-10.0%
-8.0%
-6.0%
-4.0%
-2.0%
0.0%
2.0%
4.0%
6.0%
8.0%
10.0%
1979-1982
1982-1985
1985-1988
1988-1991
1991-1994
1994-1997
1997-1999
1999-2002
2002-2004
entry rate exit rate net growth rate
Figure 2.Annual Average Entry and Exit rate
Source: Census of Commerce
69%62% 58% 58%
5%7%
7% 6%5.2%
17.5% 18.1%
13.9% 14.0% 12.5% 12.3%
→3.3% ←2.2%
←3.5%
13.8%←9.9%
0%
10%
20%
30%
40%
50%
60%
70%
80%
90%
100%
1991 1997 2002 2004
Traditionals
Other supermarketsConvenient stores
Specilitysupermarkets
GMS
Figure 3. The tranition of the sales sahre by retail
Source: Census of Commerce
Note: See footnote at Table 2 for the definition of retail formats.
28

45%
16%24% 27%
13%
10% 3%
30%
65% 59% 64%
9% 6% 7% 6%
11%
5%
0%
10%
20%
30%
40%
50%
60%
70%
80%
90%
100%
Japan 1997 US 1995 UK 1995 France 1995
GMS
Supermarket
Convenience
Traditional
DepartmentStores
Smalloutlets
Figure 4. International Comparison on the share of food retailing by formats
Source: Mckinsey Global Institute (2000)
0
5
10
15
20
25
1972 1974 1976 1979 1982 1985 1988 1991 1994 1997 1999 2002 2004
Figure 5. Retail sales per employee(milion yen)
Source: Census of Commerce
29

Figure 6. Structure of consumers’ choice
1st stage: Decision to choose the group of retail format g
The elasticity of substitution between groups:
α+1
2nd stage: Decision to choose the outlet j in retail format g
ConvenienceStores
GMS Traditional Stores
Assumption: Symmetry of quality and prices within group
Figure 7. The sales share of retail formats by commodity group and retail formats
9.3%
9.5%
7.2%
35.3%
31.5%
25.5%
41.6%
47.3%
58.8%4.7%
7.8%
10.4%
3.5%
3.8%
3.8%
0% 20% 40% 60% 80% 100%
2002
1997
1991
General Supermarkets Speciality supermarketTraditional outlets
Food and Beverage
Convenience storesDepartment stores
30