Measurement and understanding of magnetization in AC and ...
27
PramS, na- J. Phys., Vol. 30, No. 6, June 1988, pp. 569-595. (', Printed in India. Measurement and understanding of magnetization in AC and DC fields and the determination of intragrain He1 in high T c RBa2Cu307 superconductors A K GROVER, C RADHAKRISHNAMURTY t, P CHADDAH*, G RAVI KUMAR* and G V SUBBA RAO** Tata Institute of Fundamental Research, Bombay 400085, India *Bhabha Atomic Research Centre, Bombay 400085, India **Indian Institute of Technology, Madras 600036, India MS recewed 5 April 1988 Abstract. We present DC and low frequency AC magnetization measurements on various RBa2Cu307 superconductors. We identify features intrinsic to these compounds, and establish the features originating from intergranular links in sintered pellets. The isothermal magnetization curves, and the temperature dependence of magnetization in field-cooledand zero field-cooled states are shown to be consistent with the calculations done following a recent extension of Bean's model. Low field anomalies predicted within this model are observed, and yield H,,1 values of a few Oe. These values are shown to be consistent with the temperature variation of magnetization. A comparison is made with the other existing data and it is demonstrated that earlier quoted values of H,,1 are gross overestimates. Keywords. High temperature superconductors: lower critical field: magnetization curves; critical currents: AC methods; DC methods: hysteresis loops. PACS Nos 74,30;74.60 I. Introduction The lower critical field Hot is a basic physical parameter of a type II superconductor and its value can be used to infer microscopic properties of the superconducting state. The textbook definition of Hot is the field below which there is a complete flux expulsion. When a magnetization measurement is made on a sample of macroscopic size, macroscopic shielding currents can be set up at H > H d which will effectively shield the bulk of the sample from the magnetic field (Bean 1962, 1964). It is the experimentalist's problem to find ways to distinguish this macroscopic shielding (which, though not ideally total, may appear total within the experimental error) from the thermodynamic Meissner state and thus determine H,.t. The magnetization measurements are usually made to obtain information about the extent of magnetic flux expulsion in superconductors. The magnetization curve of a superconducting sample is obtained by first cooling the sample to a given temperature in zero field (ZFC) and then gradually raising the externally applied field He. Upto the field He1 (ignoring the demagnetization correction) the screening currents are set up at *To whom all correspondence should be addressed, 569
Transcript of Measurement and understanding of magnetization in AC and ...

PramS, na- J. Phys., Vol. 30, No. 6, June 1988, pp. 569-595. (', Printed in India.
Measurement and understanding of magnetization in AC and DC fields and the determination of intragrain He1 in high T c RBa2Cu307 superconductors
A K G R O V E R , C R A D H A K R I S H N A M U R T Y t, P C H A D D A H * , G RAVI K U M A R * and G V SUBBA RAO** Tata Institute of Fundamental Research, Bombay 400085, India *Bhabha Atomic Research Centre, Bombay 400085, India **Indian Institute of Technology, Madras 600036, India
MS recewed 5 April 1988
Abstract. We present DC and low frequency AC magnetization measurements on various RBa2Cu307 superconductors. We identify features intrinsic to these compounds, and establish the features originating from intergranular links in sintered pellets. The isothermal magnetization curves, and the temperature dependence of magnetization in field-cooled and zero field-cooled states are shown to be consistent with the calculations done following a recent extension of Bean's model. Low field anomalies predicted within this model are observed, and yield H,,1 values of a few Oe. These values are shown to be consistent with the temperature variation of magnetization. A comparison is made with the other existing data and it is demonstrated that earlier quoted values of H,, 1 are gross overestimates.
Keywords. High temperature superconductors: lower critical field: magnetization curves; critical currents: AC methods; DC methods: hysteresis loops.
PACS Nos 74,30; 74.60
I. Introduction
The lower critical field Hot is a basic physical parameter of a type II superconductor and its value can be used to infer microscopic properties of the superconduct ing state. The textbook definition of Hot is the field below which there is a complete flux expulsion. When a magnetizat ion measurement is made on a sample of macroscopic size, macroscopic shielding currents can be set up at H > H d which will effectively shield the bulk of the sample from the magnetic field (Bean 1962, 1964). It is the experimentalist 's problem to find ways to distinguish this macroscopic shielding (which, though not ideally total, may appear total within the experimental error) from the thermodynamic Meissner state and thus determine H,.t.
The magnetizat ion measurements are usually made to obtain information about the extent of magnetic flux expulsion in superconductors. The magnetizat ion curve of a superconduct ing sample is obtained by first cooling the sample to a given temperature in zero field (ZFC) and then gradually raising the externally applied field He. Upto the field He1 (ignoring the demagnet izat ion correction) the screening currents are set up at
*To whom all correspondence should be addressed,
569
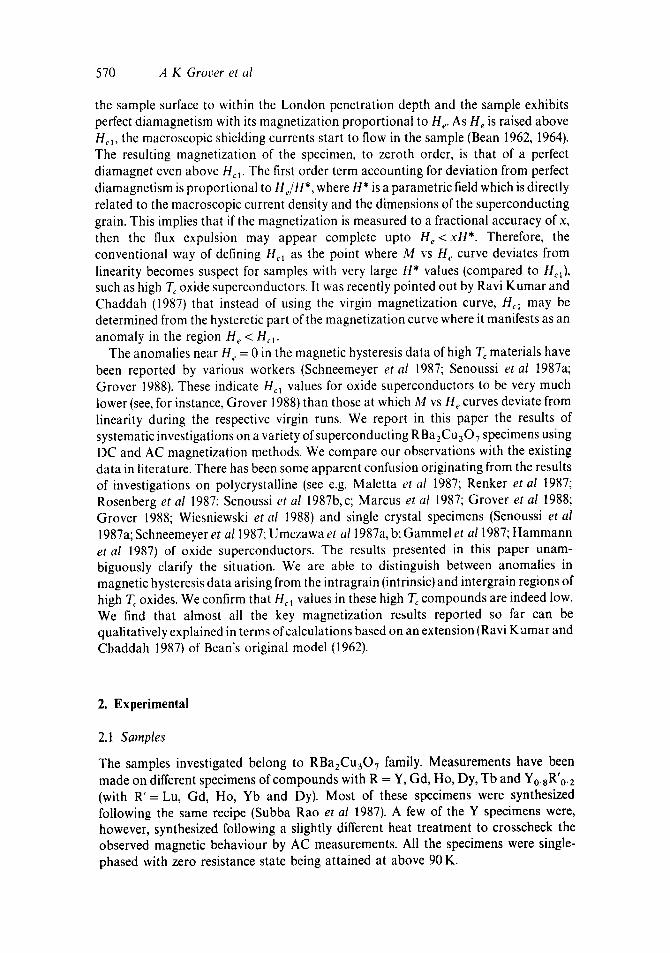
570 A K Grover et al
the sample surface to within the London penetration depth and the sample exhibits perfect diamagnetism with its magnetization proportional to He. As He is raised above He1, the macroscopic shielding currents start to flow in the sample (Bean 1962, 1964). The resulting magnetization of the specimen, to zeroth order, is that of a perfect diamagnet even above Hcl. The first order term accounting for deviation from perfect diamagnetism is proportional to He/H*, where//* is a parametric field which is directly related to the macroscopic current density and the dimensions of the superconducting grain. This implies that if the magnetization is measured to a fractional accuracy of x, then the flux expulsion may appear complete upto H e < x H * . Therefore, the conventional way of defining He1 as the point where M vs H e curve deviates from linearity becomes suspect for samples with very large H* values (compared to Hc~), such as high Tc oxide superconductors. It was recently pointed out by Ravi Kumar and Chaddah (1987) that instead of using the virgin magnetization curve, H~ may be determined from the hysteretic part of the magnetization curve where it manifests as an anomaly in the region He < He1.
The anomalies near H,, = 0 in the magnetic hysteresis data of high T¢ materials have been reported by various workers (Schneemeyer et al 1987; Senoussi et al 1987a; Grover 1988). These indicate H~ values for oxide superconductors to be very much lower (see, for instance, Grover 1988) than those at which M vs He curves deviate from linearity during the respective virgin runs. We report in this paper the results of systematic investigations on a variety of superconducting RBazCuaOv specimens using DC and AC magnetization methods. We compare our observations with the existing data in literature. There has been some apparent confusion originating from the results of investigations on polycrystalline (see e.g. Maletta et al 1987; Renker et al 1987; Rosenberg et al 1987; Senoussi et al 1987b, c; Marcus et al 1987; Grover et al 1988; Grover 1988; Wiesniewski et al 1988) and single crystal specimens (Senoussi et al
1987a; Schneemeyer et a11987; Umezawa et a11987a, b; Gammel et a11987; Hammann et al 1987) of oxide superconductors. The results presented in this paper unam- biguously clarify the situation. We are able to distinguish between anomalies in magnetic hysteresis data arising from the intragrain (intrinsic) and intergrain regions of high T~ oxides. We confirm that He~ values in these high Tc compounds are indeed low. We find that almost all the key magnetization results reported so far can be qualitatively explained in terms of calculations based on an extension (Ravi Kumar and Chaddah 1987) of Bean's original model (1962).
2. Experimental
2.1 Samples
The samples investigated belong to RBa2Cu307 family. Measurements have been made on different specimens of compounds with R = Y, Gd, Ho, Dy, Tb and Yo.sR'o.2 (with R '= Lu, Gd, Ho, Yb and Dy). Most of these specimens were synthesized following the same recipe (Subba Rao et al 1987). A few of the Y specimens were, however, synthesized following a slightly different heat treatment to crosscheck the observed magnetic behaviour by AC measurements. All the specimens were single- phased with zero resistance state being attained at above 90 K.
Magnetization and intragrain H,. t in high T c superconductors 571
2.2 DC measurements
The magnetization curves in steady magnetic field were obtained using the Faraday method. The magnetic field was produced by an electromagnet and the gradient field was obtained by a pair of Lewis coils. The experimental set up used was such that the DC magnetic field could be varied without interruption from - 50 to 8000 Oe. The field could not be changed in steps smaller than about 1.60e. The magnetic force on the sample is in the direction normal to the direction of the DC field due to the electromagnet. The field gradient was limited to a value of 12 Oe/cm. The applied magnetic field values were read using a Hall probe placed outside the cryostat. Using a strongly magnetic sample, it was ensured that the Halt probe is so located that it faithfully measures the field at the sample position. We estimate a systematic error of less than 3 0 e in our absolute field values, whereas the relative error in different field values is about 0.20e. The pellet specimen had the dimensions 6"5 x 2'2 x 2"2 mm 3 whereas the powder specimen was put inside a copper bucket with internal diameter of 4 mm. Considering the finite dimensions of the specimens, we have measured the magnetization with a resolution function of FWHM < 20e . The gradient field was switched on only while recording the magnetic force at a fixed field value. The force value was recorded about a minute after switching on the gradient field. The force with the gradient field in the reversed direction was not recorded to avoid any possible complications because of hysteresis. The magnetic isotherms were measured at 77 K and 5 K; at these temperatures it was possible to ensure the stability of the sample temperature over long times.
The DC magnetization data were recorded only on one compound, namely, Luo.:Y0.sBa2Cu3OT, both in its sintered pellet as well as crushed powder forms. Most of these data are presented in figures I to 8. The arrows in figures 1 to 7 indicate the direction in which the field was varied and the different magnetization curves are identified by the number of the field cycle. The dotted lines through the data points are only a guide to the eye. The measurements made on the pellet and powder specimens include the following:
(i) M vs He curves at 77 K in pellet (figure la) and powder (figure 6a) on their zero field-cooled states in field values upto 1500Oe. The minor hysteresis loops were recorded in field values of + 4 5 O e and + 10Oe in pellet (figure lb) and powder (figures 6b and c) specimens respectively after reversing the field from - 5 0 O e .
{ii) M vs He curves at 77 K on pellet (figures 2a and b) and powder (figure 7) in fields upto _+ 10Oe.
(iii) M vs H~ curves at 77 K and 5 K on pellet in fields of _+ 45 Oe (see figures 3 and 5 respectively).
(iv) M vs He curve at 5 K on ZFC pellet in field upto 6 kOe (figure 4a). Figure 4b shows the hysteretic behaviour near He = 0 on an expanded scale.
(v) Magnetization vs temperature behaviour on the pellet from 20 K to 95 K in a nominal field of 10Oe in both the nominal zero field-cooled and field-cooled states (figure 8). In the first case, the sample was cooled down to about 20 K in nominal zero field and magnetization was then measured in a field of 10Oe during the warm-up cycle. The DC field was kept on during the warm-up whereas the gradient field was switched on only while recording the force value at selected temperatures. The

572 A K Grover et al
0 . 4 I ,1
:~ o.o
Z 0
- 0 . 4
N I-- LU z - 0 . 8 (D <Z
- 1 . 2
' ' ' I ' ' ' I ' ' ' I ' '
L u.2Y. e B o 2 C u 3 0 7 P e l l e t
7 7 K %
• % i o
• • = = • • • • • • •
• /7"
I | 1 | I I I I [ I I I I I I
0 . 0 0 . 4 0 . 8 1 . 2
= 1
M A G N E T I C F I E L D ( k O e )
Figure la. Magnetic hysteresis curve at 77 K for a sintered pellet of Luo.2Yo 8Ba2Cu30. in DC field upto 1500 Oe. The specimen was cooled down to 77 K in nominal zero field. The arrows indicate the direction in which the field was varied. The anomalous dip in magnetization values near zero field value on the reverse cycle is sandwiched between the pair of arrows.
0 . 2
Z £ o.o I--
N l - bJ Z
< -0 .2 =E
~¢~1 , , , I . . . . , , I , + , I + ,
% Lu.2Y. I Bo 2 Cu307 O
~ Xxxx Pellet
~OiooX ~ Xx xx x) Xxx 77 K I 0 0 0 XX
0 X D i O 0 x ! o x
0 X
0 013 0 I ~ Oil= 0
D 0 0 0 0 0
D O 0
% "~,, t"
x I REVERSE ° ° 0 | FORWARO o . o It REVERSE
X X
~X From 1500 OI
0
0
O
, 1 , , . 1 , , , I , , I , I , I , ,
- 4 0 - 2 0 0 20 40
M A G N E T I C F I E L D (Oe)
Figure lb. Magnetic hysteresis curves for the pellet specimen of Luo 2 at '77 K on repeated cycling between ± 45 Oe. The specimen was first exposed to a field of 1500 Oe. The anomalous dip of figure la can be clearly identified on the I reverse cycle.
Magnetization and intragrain He1 in high Tc superconductors 573
.2
A
;o N t - UJ Z (.9
- 2
1 ! I I I I I I I
( a ) Lu.2 Y.e BazCu307 ( Pellet )
~,,"r -~..~..~>. 77K o O~,ID ~
a, " " -..'$7., \ O \O
O ~ \
o o o ~,j o o ,~ o %0 O., X ~ = ~,
X ~O x I VIRGIN (ZFC) ~ ~ - , x
• I REVERSE o'~.~ o ] I F O R W A R D o. ,
X
i n I I I I I I l
-12 - 9 - 6 - 3 0 3 6 9 12
MAGNETIC FIELD (Oe)
• 2 l I I
(b) A
uJ Z O
o
N C-- Z (..9 ,~ -'1
- . 2
\ "Q,
",~,,
t I I i i
Lu.2 Y.o Bo2Cu307(Pellet )
~o
="\ "l"~-"°i "~,, I I ~ ' \ , ; '~
", i j . • !" ~ t
~o"
77K
o E REVERSE
• ltr F O R W A R D
-12 - 0 6 I
MAGNETIC FIELD (Oe)
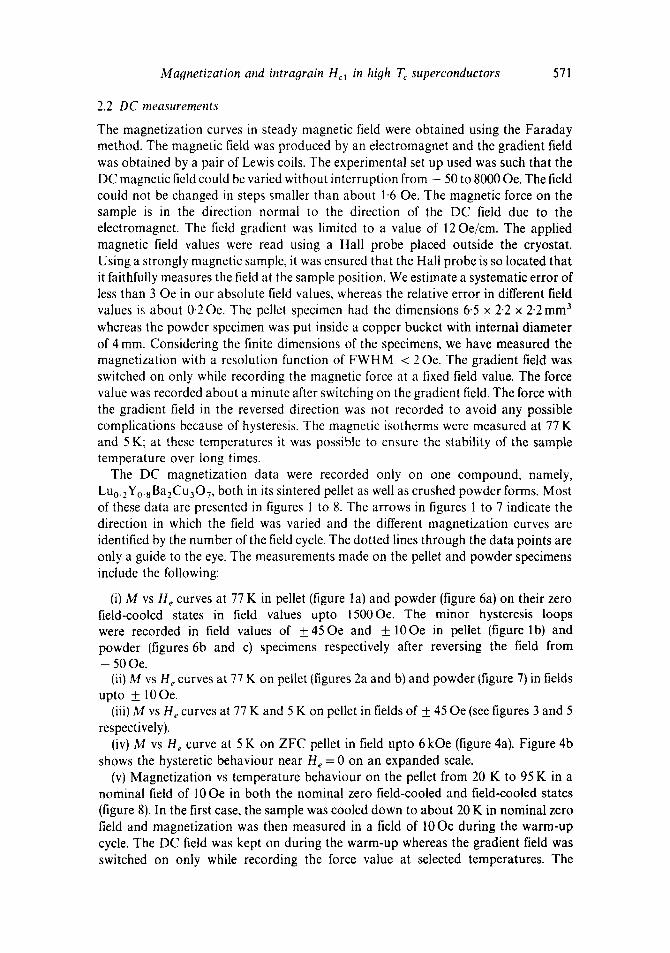
Figure2. a and b. Minor hysteresis loop obtained in DC field of + 10Oe at 77K for the sintered pellet of Luo.zY0.eBazCuaO 7. The anomalous dip near zero field values can be identified in the loops.

574 A K Grover et al
uJ
z o
S
Ld
Z (.9 <{
0.4
0 .2
0 .0
-0 .2
-0 .4
I r
I I
[ I t r J | 1 1 { | I T I I I I j
=p
Lu.2Y. 8 BG 2 Cu 3 0 7 Pel let
77 K ~
l u e U e e I
• I I l l l ~
",, I%\ am L |o ~ a • le
l i l l l o~
x g REVERSE o ~ FORWARD o ~ REVERSE
-40 -20 0 20 40
' a
=1=1
I i
MAGNETIC FIELD (Oe)
Figure 3. Minor hysteresis loop obtained at 77 K for the pellet specimen of Luo. 2 after repeated cyclings in a DC field of ,-45 Oe.
continuous lines shown in figure 8 are the smooth curves drawn through discrete data points.
2.3 A C measurements
The AC magnetization measurements give information about the steady state response of specimens at a given frequency. These measurements were performed using low (Likhite and Radhakrishnamurty 1966) and high (Radhakrishnamurty et al 1971) field techniques developed initially for the quick study of the superparamagnetic aspects of rock samples. Due to the ease with which data could be obtained on these instruments, we studied the AC magnetic hysteresis of all the sintered pellet specimens. Several of the specimens were also studied in their powder form. For brevity, we show only some of the representative data in figures 9 to 12. The measurements made on different specimens can be listed as follows:
(a) Study of hysteresis loops at 77 K in fields below and up to 20 Oe at a frequency of 317 Hz. From these data, a comparative study could be made about the extent of irreversibility at low field values in different specimens. They also provide a measure of the lowest field values in which irreversibility can be seen (within the sensitivity limit of the instruments used) in different specimens and in different orientations of each specimen.
(b) Record of hysteresis loops at 77 K in peak fields ranging from 30 to 1500 Oe at a frequency of 50 Hz. These data vividly show the changes in shape of the magnetic hysteresis curves as peak field gradually increases.
(c) Temperature variation of AC susceptibility from 20 to 300 K in different peak fields.
Magnetization and intragrain Hot in high Tc superconductors 575
I I
4 - 0 - ~'., c ~
5 o . o
z - ~ I • o - 4 . 0 , I -
N "
- 8 . 0 - I .d
Z ( .9 < :E
-12 -0
I I
0
u 1 t 1 i i
Lu.2Y. e Ba 2 Cu307
• Pellet =\
5K
\ \ \
\ \
\ \
\ -
\
w
• J • •
2 ,4 6
M A G N E T I C F IELD (kOe)
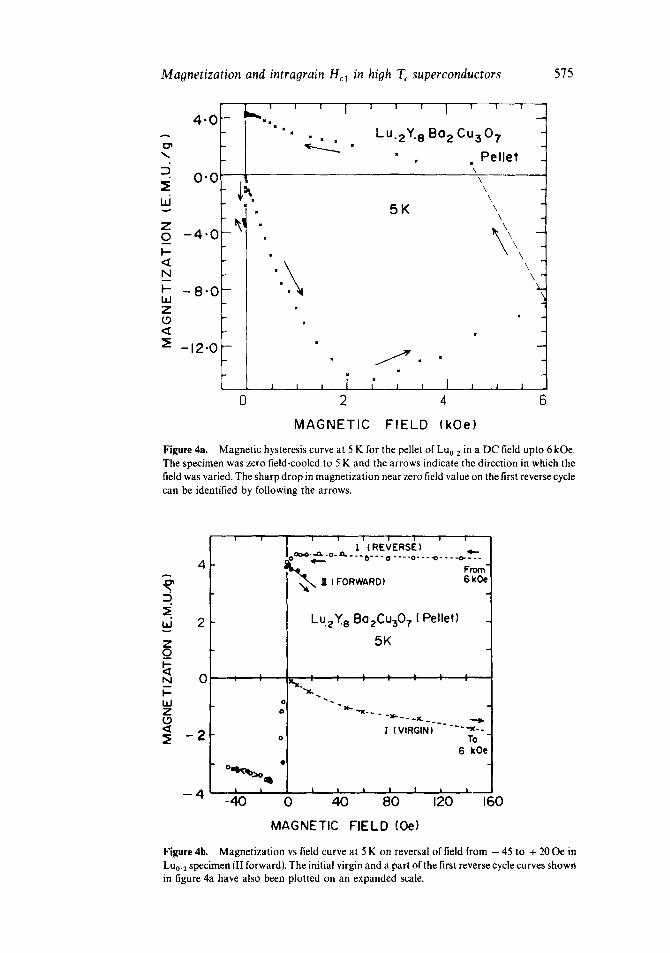
Figure 4a. Magnetic hysteresis curve at 5 K for the pellet of Lu0, 2 in a DC field upto 6 kOe. The specimen was zero field-cooled to 5 K and the arrows indicate the direction in which the field was varied. The sharp drop in magnetization near zero field value on the first reverse cycle can be identified by following the arrows.
l..=J
Z o_
N I-- W Z (,.9
I ( R E V E R S E ) ~=. . o - . a . _ - - e , - - " • . . . . o - - - ..o- - - .-o--q~-- -
4 F r o m "
• , ~ X ( F O R W A R D ) 6 k O e
2 LuzY. e Bo2Cu307 (Pellet)
5K
o ~ ~
- 2 o 7 ~
[ ° -I "°'J
-40 0 40 80 120 160
MAGNETIC FIELD (Oe)
Figure 4b. Magnetization vs field curve at 5 K on reversal of field from - 45 to + 20 Oe in Luo. 2 specimen (II forward). The initial virgin and a part of the first reverse cycle curves shown in figure 4a have also been plotted on an expanded scale.

576 A K Grover et al
.9
W 3
Z o o F-
N - ' 3
LLJ Z - 6
:~ - 9
0 Oo o
0 o
I 1 1
°o o ° 0
~"X°°OOooo °
i I I I
Lu.2'(sBa2Cu307 (Pellet~
5K
t I I I
-50 -40 -30 -20 -I0
MAGNETIC FIELD (Oe)
o " : : : : %
O O O °~ ~:::oOo°o~ ) ~ O0~
VIRGIN :o%
I I t l
0 I0 20 50 40 50
Figure 5. Magnetic hysteresis curve at 5 K for the pellet of Lu o.2 in + 45 Oe. The small dip in magnetization near zero field value on the reverse cycle can be identified.
v
Z 0 l-- < N F- bJ Z L9 <
" 5 ! 1 v
o
% 6 0 0 0 0 •
• 0
- - ' 5
o
-I,0 o
-IO0 0
1 ! i ! ; !
L u.zY. e Bo 2Cu3071 Powder)
7 7 K
~ o e o °
4
0
0
I I I | t i i 1 l
200 400 600 800 K)00
MAGNETIC FIELD (Oe)
Figure 6a. Magnetic hysteresis curve at 77 K for powdered specimen of LUo. 2 in DC field upto 1 kOe. The sample was cooled down first in nominal zero field, the arrows indicate the direction in which the field was varied.

Magnetization and intragrain H , , in high T, superconductors 577
MAGNETIC FIELD (Oe)
Figure 6b. Magnetic hysteresis curves in i lOOe on revcrsal of field from - 45 Oe for powdered specimen of Lu, at 77 K.
MAGNETIC FIELD
Figure 6c. Magnetic hysteresis loop on repeated cycling between + IOOe for Lu, , specimen at 77 K. The bubble-shaped irreversible region centred near - 2 Oe can he identified.

578 A K Grover et al
W
N I - bJ Z <
.08
.04
0
-.04
-.08
- I '
o VIRGIN
• FIRST REVERSE
I
i i i
Lu.zY.eBo2Cu30 r Powder
77K
o #
, lJ
d' o
MAGNETIC FIELD (Oe)
Figure 7. Magnetization vs field in + 45 Oe at 77 K (after zero field cooling) for Luo.2 powdered specimen.
C ID
u.i v
~9 -.I t-- <~ N 7- LLI Z - ' 2 (.9
-3
, , , , i ' t Lu.z Y.s Bo z Cu30~,(Pelle )
ooy ZERO FIELD COOLED
TEMPERATURE (K)
tOO
Figure 8. Temperature variation of ZFC and FC magnetization in a field of 10Oe for sintered Luo. 2 pellet. The arrows indicate that the data were recorded during warm-up from about 20 K.
Magnetization and intragrain He1 in high Tc superconductors 579
3. Results
3.1 Magnetic behaviour in DC fields
The following features are noteworthy from the data presented in figures 1 to 8.
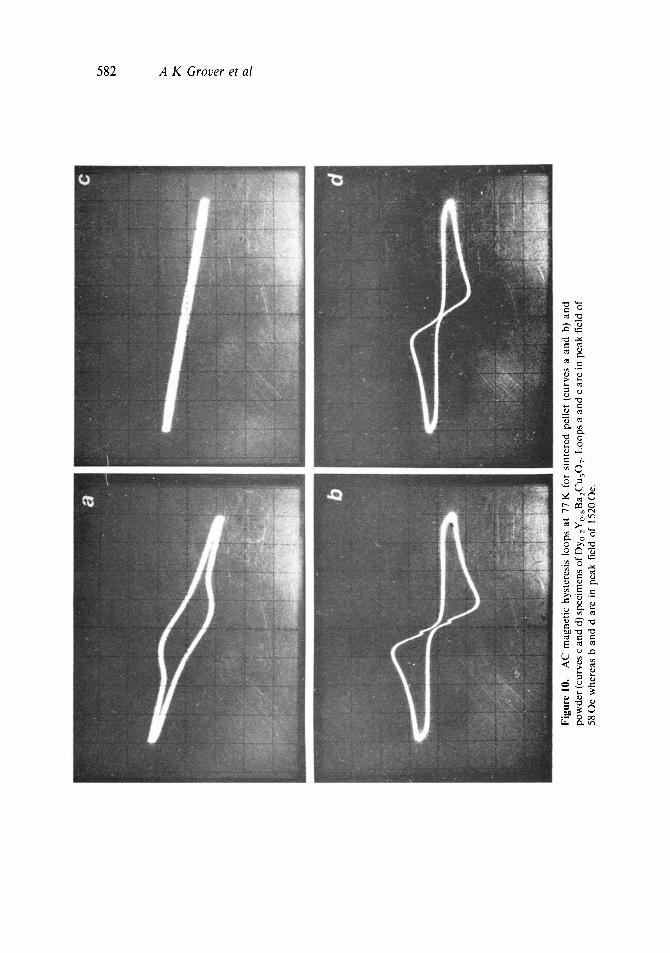
(i) There is a general resemblance in the magnetization response of sintered pellet and the crushed powder (see their major hysteresis curves in figures la and 6a for comparison at 77 K). The virgin M vs He plots are apparently linear upto about 100 Oe in both the cases and the initial slope values and the field values at which the magnetization turns over are nearly the same. The minimum magnetization value at the turnover point in the case of powder is less than, but within, 15% of that of the pellet.
(ii) A sharp dip in magnetization value is observed near H e = 0 in the first reverse cycle at 77K in the case of the pellet (see figure la). The anomalous jumps in magnetization values near He = 0 get more pronounced as the field is further cycled between + 45 Oe (see figure I b). These jumps near H e = 0 seem to be superimposed on the minor hysteresis loop traced in + 45 Oe. The curves corresponding to II forward and II reverse cycles in figure lb constitute the minor hysteresis. No unusual change in magnetization values near He = 0 is perceptible (figure 6a) in the first reverse cycle in the case of powdered sample. However, an anomalous variation in magnetization values near He = 0 becomes somewhat perceptible as the field is reversed from - 45 Oe to + 10 Oe. Figure 6b shows the data during the second forward and second reverse cycles. As the field is cycled several times between + 10Oe, the shape of the magnetization curve stabilizes, as is evident from figure 6c. This figure shows an anomalous dip (or rise) in magnetization values near He = 0 and at higher fields the magnetization seems reversible within the scatter in our experimental data. The small minor hysteresis loop of figure 6c is centred around a nominal field value of - 2 0 e instead of 00e. This, as mentioned earlier, is due to the experimental error in absolute field values. The width of the region of the anomalous dip (and rise) for powder as well as the pellet (cf. figures 2b and 6c) appear to be of the same order as the smallest step (1"60e) in which the DC field could be incremented. The height of the anomaly, i.e., the abrupt change in magnetization near H e = 0, in the pellet is about one order of magnitude higher than that in the powder. The anomaly in the powder is above the scatter in our experimental data.
(iii) The comparison of data contained in figures 2 and 7 focusses attention onto an essential difference between the magnetic behaviour of pellet and powder in small fields. These figures show the response in the two cases in a field of + 10Oe after zero field cooling the specimens to 77 K. The virgin M vs He curves upto + 10Oe for both of them look similar, the initial slope value for powder being somewhat lower than that for the pellet. However, on reversing the field, a large flux is trapped (figure 2a) in the case of pellet whereas magnetization appears reversible (figure 7) within the sensitivity limit in the case of powder. In addition to the trapped flux, figure 2b shows the presence of anomalous kinks near He = 0 for pellet. The changes in magnetization values giving rise to the kinks in figure 2b, are about ten times smaller than in figure l b, where the same sample had been exposed to large fields before cycling the field near the origin. We believe that the corresponding kinks in powder are perhaps buried within the scatter in the data of figure 7.
(iv) A comparison of figures 2b and 3 shows the change in the steady state response of

O0
0

tq
Figu
re 9
. A
C m
agne
tic
hyst
eres
is l
oops
at
77 K
in
diff
eren
t pe
ak f
ield
s fo
r si
nter
ed p
elle
t of
L
u0. 2
. (a)
15
Oe,
(b)
60
Oe,
(c)
110
Oe,
(d)
220
Oe,
(e)
320
Oe,
(f)
660
Oe,
(g)
108
0 O
e an
d (h
) 15
40O
e. V
ertic
al s
cale
is
arbi
trar
y fo
r al
l th
e lo
ops.
Oo
i.....
t
Oo
I-3
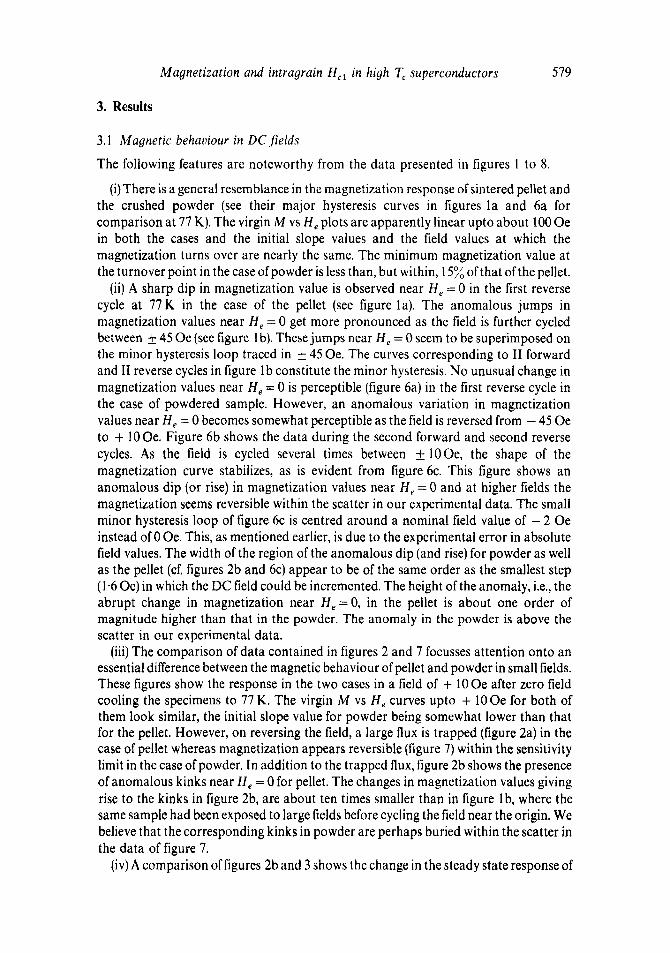
Fig
ure
10.
AC
mag
neti
c hy
ster
esis
loo
ps a
t 77
K
for
sint
ered
pel
let
(cur
ves
a an
d b)
and
po
wde
r (c
urve
s c
and
d) s
peci
men
s of
Dy
o 2Y
o.sB
azC
u30~
. L
oops
a a
nd c
are
in
peak
fie
ld o
f 58
Oe
whe
reas
b a
nd d
are
in
peak
fie
ld o
f 15
20O
e.

g~
t-,1
7~
¢h
¢%
Fig
ure
11.
AC
hys
tere
sis
loop
s at
77
K i
n pe
ak f
ield
s of
50
e (a
and
c)
and
80
e (b
an
d d
) fo
r ~i
nter
ed p
elle
t of
Luo
.2 in
tw
o di
ffer
ent
orie
ntat
ions
. In
a a
nd b
the
fie
ld w
as a
ppli
ed p
aral
lel
to
Lhe
cyli
ndri
cal
axis
of
the
pell
et w
here
as i
n c
and
d th
e fi
eld
was
in
the
plan
e of
the
pel
let.
b

584 A K Grover et al
>-
..J m V- n ~d U
U q
0 | | ; i ! i i ] i Dy.eYe 13o 2 Cu307
-- 050e !1 -5 . . . . 2 5 0 e
/
-I0 POWOER //jlj -15
~ J ) PEIIE"
. 'o ' ' 'go' ' ' d o ' ' 50 70 90
TEMPERATURE (K)
Figure 12. Temperature variation of ac susceptibility for sintered pellet and powdered specimens of Dyo z sample in two different values of peak field.
the pellet at 77 K as the maximum field, H e, to which the specimen is cycled, is increased. After a certain threshold value of H e (about 20 Oe in the case of the present specimen), the M vs He curve is linear and reversible within the scatter limit of the data. The slope of the linear portion at higher field values is not much different from the initial slope value during the virgin run. The hysteresis curve of figure 3, made up of reversible linear portion above a certain threshold superimposed on the irreversible bubble-shaped plot centred around the origin, is reminiscent of the plots reported by others (Senoussi et al
1987b, c; Renker et al 1987; Rosenberg et al 1987; Wiesniewski et al 1988) in the sintered pellet specimens of the two families of oxide superconductors. An additional feature evident in our present data, is the presence of anomalous kink(s) near H e = O.
The irreversibility responsible for the bubble disappears in the case of powder. This is analogous to the absence of a bubble-like feature in the data of single crystal specimen of Senoussi et al (1987a).
(v) Figures 4 and 5 show the changes in the magnetic behaviour as the pellet is cooled down from 77 to 5 K. The major hysteresis loop (figure 4a) shows that the virgin M vs He plot is apparently linear up to about 500 Oe. The maximum value of magnetization during the virgin run and field value at which it occurs increases by a factor often at 5 K as compared to their corresponding values at 77 K (cf. figures 1 a and 4a). On the reverse cycle, as the external applied field approaches zero value, the magnetization values rapidly drop from positive to negative values (see figure 4b for M vs He data on an expanded scale). As the field moves away from H e = 0, the magnetization again increases as evidenced by open circle data points in figure 4b. On reversal of the field from about - 45 Oe, the magnetization values retrace their path as He approaches zero value. As the field values move across He = 0, the magnetization swings back from negative to positive values. The behaviour depicted in figure 4b confirms the trend anticipated from the earlier report of scanty data in two types of high Tc super- conductors (Grover 1988). The absolute height of the magnetization anomaly at 5 K is more than ten times that at 77 K, whereas the width is of the same order (cf. figures 1 b and 4b). Figure 5 shows that even at 5 K, the height of the anomaly decreases if the specimen is not exposed to a high field before the reversal of the field. This is similar to the trend evident from the comparison of data in figures lb and 2b. The threshold field
Magnetization and intragrain H~I in high Tc superconductors 585
value up to which magnetization remains irreversible near the origin also appears to be higher at 5 K as compared to that at 77 K (cf. figures 2a, 4 and 5).
(vi) Figure 8 shows the comparison of magnetization behaviour in ZFC and FC states of pellet. The magnetization has been measured in a nominal field of I 0 0 e which is much larger than the field value corresponding to the width of the anomaly near He = 0, as discussed above. The ZFC and FC magnetization values appear saturated below about 50 K. The saturated ZFC magnetization corresponds to 4~rM/H value of about ~zp/lO, where p( = 5" 1 g/cc) is the physical density of the pellet. This value of about 1.6 for 4gM/H is consistent with another independent estimate for this factor obtainable from the slope of the initial linear portion of virgin M as H,, curve at 5 K in figure 5.
3.2 Magnetic hehaviour in AC fields
The important points emerging from the AC magnetization studies are as follows:
(i) There is a close correspondence between the DC and AC magnetic response of the same specimen. This is evident from a comparison of figures 2a and 3 with figures 9a and b respectively and of figure l a with the relevant portion of hysteresis curve of figure 9h for the specimen of Luo.zYo.sBazCu~OT. The virgin M vs He curve cannot be seen in the AC plots. The shape of the magnetic hysteresis curves generated on repeated cyclings in DC fields are similar to those of the AC hysteresis loops.
(ii) The anomalous kinks centred at He = 0 in DC data (figures 2b and 3) are not perceptible in the corresponding AC data. The pair of kinks visible in the AC hysteresis loops (figures 9e to h) do not correspond to the kinks in DC data. The kinks in figure 9 are located in the second (He < 0) and fourth quadrant (H,, > 0) instead of being centred at H e = 0, as in the DC data. The anomalous kinks in the AC hysteresis loops are a manifestation of irreversible response in low fields. This fact is well evident from an examination of the change in the shape of the loops depicted in figures 9a to h, as the peak field increases, The bubble-like minor hysteresis loop in low fields (figures 9a to c) appears as a pair of kinks in major hysteresis loops (figures 9fro hi. The bubble-shaped hysteresis regions are evident (figures 2b and 3) in low DC fields as well, but the corresponding kinks are not visible in our high field DC data [figure 1 a) as we could not reverse the DC field below about - 50 Oe on our set-up. Figure 9h shows that the kink is located beyond this field value. However, the loop formed by II forward and II reverse cycles in the DC data of figure lb clearly shows the presence of bubble-like irreversible region extending between about _+ 45 Oe. The shape of the bubble in figure 1 b appears distorted near He = 0 due to the superposition of anomalous jumps in this region. The DC data, therefore, at least display all the features contained in the AC hysteresis curves: however, the converse need not be true due to the limitations in the sensitivity and the time resolution factor in AC techniques.
(iii) There exists a direct correlation between the relative prominence of the anomalous kinks in the high field AC hysteresis loops and the width and the area of the minor hysteresis loops observable in low fields. For the Ro.2Yo.sBa2Cu30. 7 series of specimens studied by us, the prominence of the kinks decreases in the order, Luo. 2
Ho0-2, Dyo.2, Ybo.2, Gdo.2. (iv) A variation is observed in the low field response (minor loops) amongst different
sintered pellets with the same nominal chemical composition. Correspondingly, the differences are also observed in the prominence of the kinks in their high field AC
586 A K Grover et al
hysteresis loops. On powdering a given sintered pellet, the irreversibility (bubble- shaped region) in its minor AC hysteresis loop and the corresponding kinks in its major AC hysteresis loop disappear. Besides the kinks, there is not much difference in the general shape of the high field AC hysteresis loops of sintered pellet and the powdered form of the same specimen at the same temperature. One of the powdered specimens was compacted, into a pellet at room temperature and its AC hysteresis response was studied. No difference was observed in the response of this unsintered (coldl pellet and its powdered form.
(v) Another important feature evident from the sequence of loops depicted in figures 9e to h is that the magnitude of maximum magnetization and the field values corresponding to this magnetization are nearly independent of the peak field in which the sample is cycled. The same trend is observed in the data of all the compounds, however, the actual values differ in different samples.
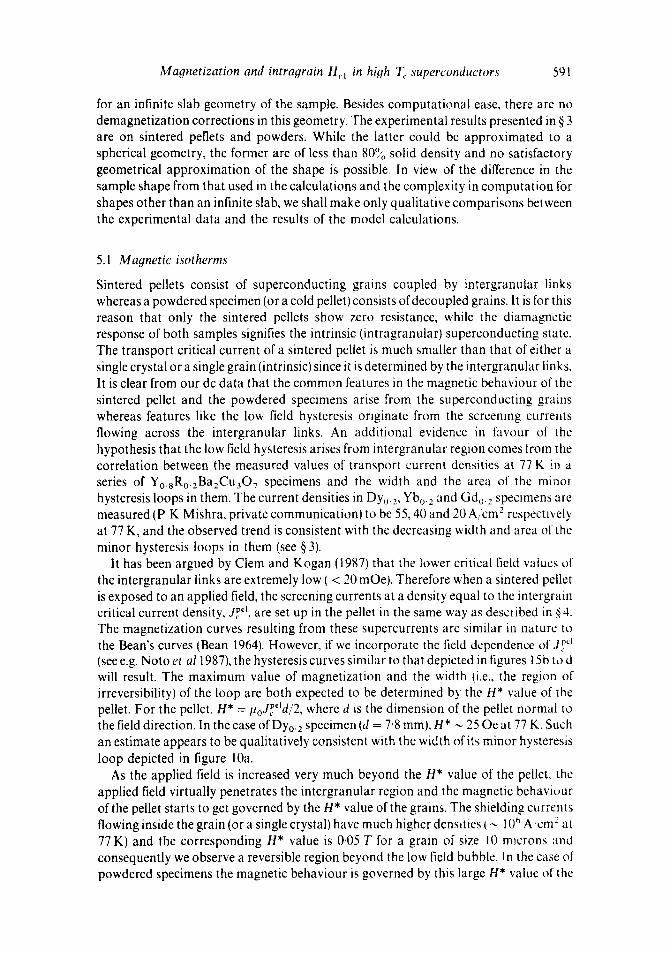
(vi) Figure l 1 shows minor hysteresis loops in peak fields of 5 0 e (figures 11 a and c) and 8 0 e (figures 11 b and d) applied parallel and perpendicular to the cylindrical axis of the sintered pellet of Luo.2 specimen (diameter = 7'8 mm and thickness = 2'2 mm). In a field of 5 0 e the loop is slightly open (figure l la) when the field is parallel to the cylindrical axis, whereas it appears closed when perpendicular to the axis (figure l lc). The difference in behaviour observed for two different orientations is due to the difference in the demagnetization factors. Because of the porus nature of sintered pellets, the demagnetization factor for these specimens cannot be reliably calculated and will be smaller than that ascertained from their geometrical shape and the relative orientation of the applied field. However, a good estimate can be made by measuring the threshold field values at which the irreversibility is visible (as in figure 1 la) in three orthogonal directions for a given specimen. The trace of the demagnetization tensor equals unity. Therefore if n is the demagnetization factor for a field applied parallel to the cylindrical axis of the pellet and x is the ratio of the threshold fields in parallel and perpendicular directions to the axis, then it is easy to show that n = (2 - x)/(2 + x). We could estimate the values of n from the low field hysteresis data of the kind shown in figure 11 in all the specimens. These estimated values were considerably lower than the values calculated from the geometrical considerations alone. For Luo.2 specimen, n is found to be 0.45 + 0"05 as compared to a value of 0'65 +_ 0"05 determined from its shape and size assuming solid density.
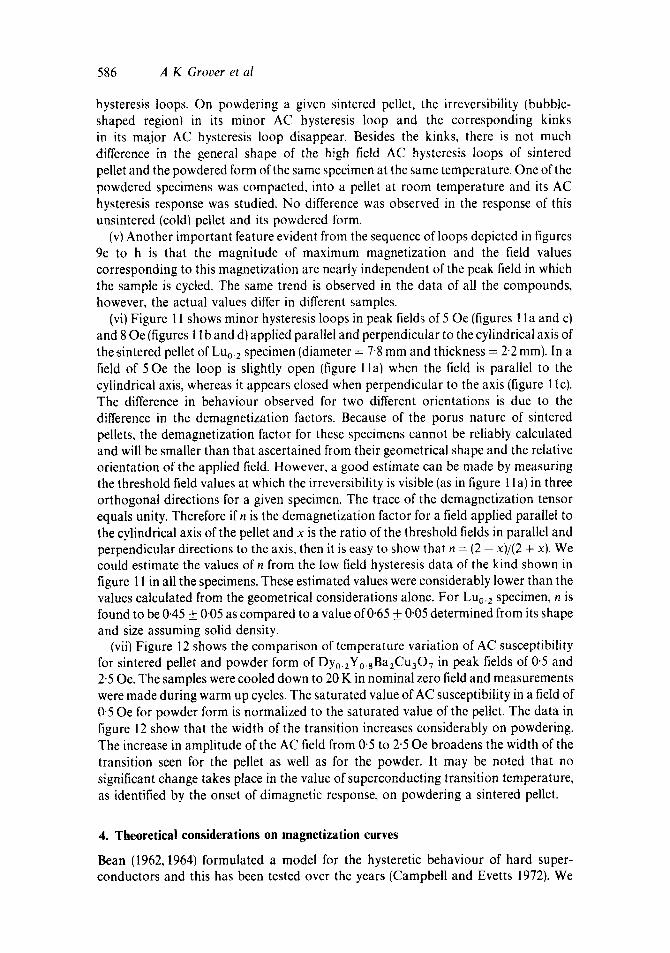
(vii) Figure 12 shows the comparison of temperature variation of AC susceptibility for sintered pellet and powder form of Dyo.zY0.sBazCu30 7 in peak fields of 0.5 and 2"50e. The samples were cooled down to 20 K in nominal zero field and measurements were made during warm up cycles. The saturated value of AC susceptibility in a field of 0.50e for powder form is normalized to the saturated value of the pellet. The data in figure 12 show that the width of the transition increases considerably on powdering. The increase in amplitude of the AC field from 0.5 to 2"50e broadens the width of the transition seen for the pellet as well as for the powder. It may be noted that no significant change takes place in the value of superconducting transition temperature, as identified by the onset of dimagnetic response, on powdering a sintered pellet.
4. Theoretical considerations on magnetization curves
Bean (1962, 1964) formulated a model for the hysteretic behaviour of hard super- conductors and this has been tested over the years (Campbell and Evetts 1972). We

Magnetization and intraqrain H~ in hi,oh T~ superconductors 587
shall first outline Bean's model and then briefly discuss its extension for high T~ superconductors (Ravi Kumar and Chaddah 1987, 1988).
4.1 Bean's model
Bean considered the virgin magnetization for finite (Bean 1962) and zero (Bean 1964) He1 and the hysteresis curve only for zero H~. The virgin curve shows complete flux expulsion for He < HcL, but for He > H~ the shielding currents are set up which have a magnitude J~ and flow in a field-dependent penetration depth. If we make an assumption that H~ is negligible, then the virgin magnetization curve is determined solely by the shielding currents and is given by (Bean 1964)
M = - H + H2/kH *, (1)
where H* = ~oJcD/2 and k = 2 for an infinite slab of width D with field parallel to the surface. This is plotted in figure 13 for H* = 0'63 T and compared with the case of complete flux expulsion.
4.2 Present model
4.2a He1 = 0 case. Based on experimental data (see e.g. Farrell et al 1987; Senoussi et al 1987a) on high T~ superconductors, Ravi K umar and Chaddah (1987) extended Bean's model. While Bean assumed that ,It is independent of field, they assumed that
J,.(H) = Jc(0) exp ( - H/Ho). (4.2)
The calculated virgin magnetization curve is also shown in figure 13 and two features stand out in contrast to the results of Bean. Firstly the magnetization does not saturate at high fields and this results in hysteresis curves whose shape changes qualitatively as the maximum applied field is changed. Secondly there is a peak in the magnetization curve and the field corresponding to this turnover point is sometimes (see e.g. Maletta et al 1987) confused with He1.
4.2b Non zero He1. For a non-zero but small (compared to H*) Hcl there will be no experimentally perceptible change in the virgin magnetization curve. An interesting
-O'l Z 0 ~- -0-2
N
-0.3 Z
< - 0 - 4
-0 ' 5 0
, , , , , , , T , [ ' ' ' ' I ' ' ' '
, Hct=O
" , ' ~ ~ ( ' 9 . 2 )
\ \
\ Comple te f lux i xpu lS lOn
, , , , I , , , J I a i i i I i i i i
0"5 I'O I-5 2-0 MAGNETIC FIELD (T)
Figure 13. Virgin magnetization curves calculated in the framework of Bean (1962) and Ravi Kumar and Chaddah (1987). The dotted line corresponds to complete flux expulsion.

588 A K Grover et al
H ~" 0"63T,
Hext "0 H (T)
Ho' IT , HCl --0ST
-S
Hut- -.15T H (T)
t
Figure 14. Field and current density distributions at two different values of externally applied field in an infinite slab of width D in the framework of model calculations (see text). The applied field is cycled upto 3 T before reversal. The values of the other parameters of the model are indicated in the figure.
anomaly is predicted, however, in the hysteresis curve near H = 0. The anomaly is best understood by considering figure 14 where we show the remanent field distribution and the macroscopic current distribution in a hysteretic sample. When the external field is zero, the region near the surface sees a field below He1 and, following Bean (1962), is shielded by the "soft" superconductor and the macroscopic current density is reduced to zero. We refer to this region as the "Meissner zone". Compared to the case o f H , = 0, the magnetization contribution from the Meissner zone consists of two different terms.

Magnetization and intragrain H~I in high T~ superconductors 589
These are
A M = - I / D f H ( x ) d x - # o / D f J ( x ) x d x , (3)
where the domain of integration is the Meissner zone. For He1 << H*, the first term is small and shall be ignored for the present discussion. The Meissner zone starts forming at H = + He1, and continues to grow in size till H = - He1 and in this region the second term and thus AM grows in magnitude. As the applied field is reversed below - He1 the Meissner zone stops growing in size and moves inwards and this is depicted in figure 14. Because of the weight factor in the integrand, the contribution of the second term and thus the magnitude of AM drops. The anomaly thus extends from + He1 to - He1 and is discussed in detail by Ravi Kumar and Chaddah (1988). Following their prescription, we present in figure 15, qualitative changes in the shape of the hysteresis curves and the manifestation of the anomaly as the maximum applied field is varied. We also state that the height of the anomaly increases with increasing maximum applied field.
Figure 15d shows that magnetization peaks at a field Hr,e~ k. For a given H*, Hpe~k is independent of the maximum field Hma x. Figure 15a shows that for H ~ slightly greater than H~ the hysteresis loop appears to be made up of an irreversible bubble region
(a)
-B
H* : 18.9mT H o : - 15 T (c)
Hcl: lmT ~E -20
He(m T)
2 - - 1
(b) 7- F lo I He(mT)
- 20 ~_ ~0~~20
~ - - 2 0
~E -20 (d)
- 2 0
Figure 15. Calculated magnetic hysteresis loops for different values of H~ "~ in which the cyclings are done. The values of other parameters are H* = 18-9 mT. H,~ = 0.15 7" and He: = l i n T .

590 A K Grover et al
0
i
-100 20 40 60 80 ;00 TEMPERATURE (K)
Figure 16. Calculated curves for the temperature varmtion of ZFC and F'C magnetization in externally, apphed magnetic field of lOmT. The curves are labelled by the thickness of an mfimte slab. Thc values of other parameters in the model are shown in the figure.
between + H~I and - H,~ surrounded on both sides by apparently reversible wings. The anomalous kinks (figures 15b to d) centred at He = 0 are a consequence of finite H,.~. The height of the anomaly grows in magnitude as Hm~x is increased.
4.3 Field cooled and zero .field cooled magnetization
A type II superconductor, when cooled below 7) in a magnetic field H > Hot, goes into a mixed state with a magnetization M(H), where M(H) is less than He1 and M(H) falls to zero as H approaches Hc2. However, if a magnetic field H > He1 is applied to a superconductor after cooling it below Tc in a zero field, shielding currents are set up which give rise to magnetization. It is easy to argue that for H,.1 < H << H*, the ZFC sample will always show a larger magnetization than the FC sample. We have calculated FC magnetization values as a function of temperature assuming that
M(H, T) = - Hcl(T) for Hct < H << Hc2. (4)
For calculating the ZFC magnetization we have also assumed a temperature dependence in Jc such that
Jc(H, T) =dco exp ( - T/To) exp ( - H/Ho). (5)
In figure 16 the calculated FC and ZFC curves have been shown. It is evident that as the size of the particles is reduced, the width of the transition increases for the ZFC case.
5. Discussion
The results of the model calculation of virgin magnetization and hysteresis curves and of the temperature dependence of magnetization presented in the previous section were
Magnetization and intra,qrain Hc~ in high T c superconductors 591
for an infinite slab geometry of the sample. Besides computational ease, there are no demagnetization corrections in this geometry. The experimental results presented in § 3 are on sintered pellets and powders. While the latter could be approximated to a spherical geometry, the former are of less than 80,°o solid density and no satisfactory geometrical approximation of the shape is possible. In view of the difference in the sample shape from that used in the calculations and the complexity in computation for shapes other than an infinite slab, we shall make only qualitative comparisons between the experimental data and the results of the model calculations.
5.1 Magnetic isotherms
Sintered pellets consist of superconducting grains coupled by intergranular links whereas a powdered specimen (or a cold pellet) consists of decoupled grains. It is for this reason that only the sintered pellets show zero resistance, while the diamagnetic response of both samples signifies the intrinsic (intragranular) superconducting state. The transport critical current of a sintered pellet is much smaller than that of either a single crystal or a single grain (intrinsic) since it is determined by the intergranular links. It is clear from our dc data that the common features in the magnetic behaviour of the sintered pellet and the powdered specimens arise from the superconducting grains whereas features like the low field hysteresis originate from the screening currents flowing across the intergranular links. An additional evidence in favour of the hypothesis that the low field hysteresis arises from intergranular region comes from the correlation between the measured values of transport current densities at 77 K in a series of Y0.sRo.2Ba2Cu307 specimens and the width and the area of the minor hysteresis loops in them. The current densities in Dy0. 2, Ybo. 2 and Gdo., specimens are measured (P K Mishra, private communicationl to be 55, 40 and 20 A/cm 2 respectively at 77 K, and the observed trend is consistent with the decreasing width and area ol the minor hysteresis loops in them (see § 3).
It has been argued by Clem and Kogan [1987) that the lower critical field values of the intergranular links are extremely low I < 20 mOe). Therefore when a sintered pellet is exposed to an applied field, the screening currents at a density equal to the intergrain critical current density, jpel are set up in the pellet in the same way as described in § 4. The magnetization curves resulting from these supercurrents are similar in nature to the Bean's curves (Bean 1964). However, if we incorporate the field dependence of 3~? ~ (see e.g. Noto et a11987), the hysteresis curves similar to that depicted in figures 15b to d will result. The maximum value of magnetization and the width {i.e., the region of irreversibility) of the loop are both expected to be determined by the H* value of the pellet. For the pellet, H* = I~oJ~e~d/'2, where d is the dimension of the pellet normal to the field direction. In the case of Dyo. / specimen {d = 7.8 mm), H* ~ 25 Oe at 77 K. Such an estimate appears to be qualitatively consistent with the width of its minor hysteresis loop depicted in figure 10a.
As the applied field is increased very much beyond the H* value of the pellet, the applied field virtually penetrates the intergranular region and the magnetic behavi~,ur of the pellet starts to get governed by the H* value of the grains. The shielding currents flowing inside the grain (or a single crystal) have much higher densities I ~ 10 ~ A'cm 2 at 77 K) and the corresponding H* value is 0.05 T for a grain of size I0 microns and consequently we observe a reversible region beyond the low field bubble. In the case of' powdered specimens the magnetic behaviour is governed by this large H* value of the
592 A K Grover et al
grain even in the low field region during the virgin run. This explains the absence of the low field hysteretic bubble in the case of powdered sample (figure 10c).
The general features of magnetization curves (ignoring the bubble-shaped irrever- sible region centred at the origin due to intergranular links) depicted in figure 9, can now be understood in terms of the results of model calculations, with typical H* values of the grain. The observed changes in the shape of magnetization curves shown in figures 9e to h can be easily identified with calculated shapes in figures 15b to d. The field value (250 Oe) corresponding to the maxima in magnetization remains unchanged in figures 9e to h. This value is about the same at which the DC magnetization peaks during the virgin runs at 77 K in pellet and powder specimens as shown in figure la and figure 6a respectively. In the framework of model calculations (see Ravi Kumar and Chaddah !987) this field value must be less than the H* value of the superconducting grain. An estimate of lower limit of 250Oe for H* value at 77 K is qualitatively consistent with the typical grain dimensions ( ~ 10 microns) and the observed values of current densities ( ~ l06 A/cm 2) at 77 K in single crystal specimens of RBa2Cu307 family. It may also be mentioned here that the above values for the dimensions of the grain and the critical current densities in them are also consistent in the framework of Bean's model with the DC magnetization values shown in figures la and 6a.
As discussed in § 4 the anomalies centred at the origin in the magnetic hysteresis loops shown in figure 15 are a manifestation of the lower critical field. The anomaly depicted in figures 15b to d may be identified with the observed kinks near He = 0 in figures 1 to 6. In the case of sintered pellet (figures 2, 3 and 5) the observed anomalous kinks near He = 0 appear superimposed on minor hysteresis loop due to intergrain supercurrents. Figure 6b shows that the minor hysteresis loop collapses in the powder specimen whereas the anomalous kinks survive. It may be recalled here that similar kinks are visible in the high field magnetic hysteresis data at 5 K of single crystal specimen of HoBa2Cu307 (Schneemeyer et al 1987). We believe that our powder specimen consisting of randomly oriented grains emulates the behaviour seen in single crystal specimens. We identify the calculated hysteresis curve of figure 15a with the observed hysteresis loop shown in figure 6c. The latter has been obtained after first exposing the specimen to high field values (> 1 kOe), whereas the calculated curve is obtained only by cycling the specimen within 30 Oe. As described in § 3.1, we observed that the exposure of the virgin specimen to high fields enhances the height of the anomalous kink. In the absence of this exposure (see figure 7) the anomaly is perhaps buried within the scatter limit of our data. The width of the anomaly in figure 6c is of the same order as the smallest step in which we could increment the DC field. Thus our estimate of lower critical field from figure 6b in superconducting grains of Luo.2Yo.sBa2Cu3Ov is limited to a value of < 2 0 e at 77 K.
5.2 Temperature variation of magnetization
The observed difference in the temperature variation of diamagnetic response in pellet and powder specimens of Dyo.2Yo.sBa2Cu3Ov, as depicted in figure 12, can be understood in terms of grain size effects as shown in figure 16. On crushing a given pellet the average size of the grains is expected to decrease, and consequently the diamagnetic response decreases. Figure 12 also shows that the difference in ac susceptibility values obtained in fields of 0"5 and 2.50e in powder specimen persists down to about 40 K. As stated in § 4.2, this implies that He1 < 2"50e for T > 40 K in this specimen.

Magnetization and intragrain H~x in high Tc superconductors 593
Figure 8 shows the temperature variation of ZFC and FC magnetization in a sintered pellets specimen of Lu0.2Yo.8Ba2Cu30 7 in an applied DC field of 10 Oe. The width of the magnetization anomaly at 5 K in the same specimen (see figures 4 and 5) is much less than 10 Oe. Thus the ZFC and FC magnetization data of figure 8 have been obtained in a field value larger than the expected H~I(0) value. The observed difference in ZFC and FC magnetization curves is, therefore, qualitatively consistent with the results of model calculations shown in figure 16 (for grains of size 100 microns) where the measuring field is larger than H¢1(0). We note that the calculated values of ZFC magnetization saturate at low temperatures and correspond to nearly complete flux expulsion. The measured values of ZFC magnetization have to be corrected for the demagnetization factor. Assuming that our zero field magnetization values at low temperatures (see figures 5 and 8 and § 3.2) correspond to complete flux expulsion, we get a value of about 0.38 for the demagnetization factor for a cylinder of length 2"2 mm and diameter 6.5 mm. This value of 0.38 is to be compared with a value of about 0"55 obtained from geometrical considerations alone. The difference between these two values is consistent with the analysis presented in § 3.2 for such a sintered pellet.
5.3 Comments on existin 9 data
We have argued above that our data on various RBa2Cu307 samples imply He1 values of a few Oe. We shall now discuss two sets of data often quoted in the oxide superconductors that also lead to similar conclusions.
We first discuss the high accuracy ZFC and FC data of Maletta et al (1987) on Lal.sSro.2CuO4. They measure susceptibility on ZFC samples in fields varying from 0.01 Oe to 100Oe, and find that the flux expulsion is never complete. Further susceptibility is independent of field till 10e, and drops at 10e < H e < 10Oe. This is consistent with our estimate of Hcx. For He < He1, the screening current flows only in the London penetration depth, and flux expulsion is not complete for finite size samples (Clem and Kogan 1987). Susceptibility is, however, independent of H e in this regime. For H e > H~a the shielding currents flow deeper inside the sample, and susceptibility decreases with increasing He. The data of Maletta et al thus clearly show that He1 lies between 10e and 10Oe. We also show in figure 17 the virgin magnetization curve obtained by Maletta et al, its qualitative agreement with our model, for H~t = 0 is apparent on comparison with figure 13.
Z
<~-10
W z
i I ! I [ I I i I ] I I
1987 )
t Complele f l u l expulsion
5O I00 MAGNETIC REID (mT)
Figure 17. Virgin magnetization curve obtained for a sintered pellet specimen of Lar~Sr,~.lsCuO 4 by Maletta et al (1987). The dotted line corresponds to complete flux expulsion.

594 A K Grover et al
Our low value of H~I is also consistent with the results of Gammel et al (1987) on single crystal YBa2Cu30 7. They see an ordered vortex lattice at 4.2 K even when the sample is cooled in a field of 13 Oe. They also see such a lattice in fields of about 30 Oe, 50 Oe, 110 Oe and ! 70 Oe. The lattice spacing of the vortex structure scales inversely as the square root of the field in which the sample is cooled. The lattice cannot be ascribed to flux vortices pinned to inhomogeneities as inhomogeneities spaced so appropriately would be extremely fortuitous. It is thus clear that the sample studied by Gammel et al
has H~ < 13Oe at 4.2K. In this section we have established the qualitative agreement of our data with the
model of Ravi Kumar and Chaddah that current densities in high Tc superconductors decay sharply with field. We have shown that our results are characteristic of intrinsic, intragranular superconductors. We find that H¢1 values of the high T~ superconductors are extremely low.
6. Summary and conclusions
We have presented magnetization data on RBa2Cu30~ family of superconductors. Comparison of data on sintered pellets and powdered samples has helped identify the features that are intrinsic to these compounds and originate from the intragrain region and those which emanate from the intergranular links. We have established consistency between magnetization data obtained by DC and low frequency AC methods. The isothermal AC and DC data, and the temperature variation of magnetization of ZFC and FC states of the specimen are all in good agreement with the values calculated following the prescription of Ravi Kumar and Chaddah (1987) to extend Bean's (1962) model.
We have observed two kinds of anomalies in the magnetic hysteresis curves. One pair of anomalies are located away from the H~ = 0 line and this is a feature of the intergranular links. The field at which this pair of anomalies occurs correlates well with the transport critical current density of the sintered pellet. The other set of anomalies is centred about the H e = 0 line and is consistent with the prediction of Ravi Kumar and Chaddah (1987). We have shown that these anomalies are intrinsic to the high T c compounds. This set of anomalies, which are also evident in the magnetic hysteresis data of single crystal specimen (Schneemeyer et al 1987), imply Hd values of about a few Oe. We show that this is also consistent with other published data (Maletta et al
1987; Gammel et al 1987), but in total disagreement with the large values of H~1, often quoted (Dinger et al 1987; Crabtree et al 1987). Such low values of H~ would, besides having implications for apphcations (Padamsee 1987), alter the presently quoted (e.g. Umezawa et al 1987b) microscopic parameters of these superconductors.
References
Bean C P 1962 Phys. Rev. Lett. 8 250 Bean C P 1964 Rev. Mod. Phys. 36 31 Campbell A M and Evetts J E 1972 Adv. Phys. 21 199 Clem J R and Kogan V G 1987 Jpn. J. Appl. Phys. Suppl. 26 1161 Crabtree G W, Lin J Z, Umezawa A, Kwok W K, Sowers C H, Malik S K, Veal B W, Lam D J, Brodsky M B
and Downey J W 1987 Phys. Rev. B36 4021

Magnet i za t ion and intragrain H,, 1 in high T c superconductors 595
Dinger T R, Worthington T K, Gallagher W J and Sandstrom R L 1987 Phys. Rev. Lett. 58 2687 Farrell D E, Chandrasekhar B S, DeGuire M R, Fang M M, Kogan V G, Clem J R and Finnemore D K
1987 Phys. Rer. B36 4025 Gammel P L, Bishop D J, Dolan G J, Kwo J R, Murray C A, Schneemeyer L F and Waszczak J V 1987
Phys. Rev. Lett. 59 2592 Grover A K 1988 (submitted) Grover A K, Radhakrishnamurty C~ Chaddah P, Ravi Kumar G and Subba Rao G V 1988 Pramana -3 .
Phys. 30 L167 Hammann J, Oclo M, Bertinotti A, Luzet D, Vincent E, Revcolevschi A and Jegoudez J 1987 (preprint) Likhite S D and Radhakrishnamurty C 1966 Curr. Sci. 35 534 Maletta H, MalozemoffA P, Cronemeyer D C, Tsuei C C, Greene R L, Bednorz J G and Mueller K A 1987
Solid State Commun. 62 323 Marcus J, Escribe-Filippini C, Schlenker C, Buder R, Devenyi J and Reyder P L 1987 Solid State Commun. 63
129 Noto K, Morita H, Watanabe K, Murakami Y, Obi Y, Fujimori H, Kobayashi N and Muto Y 1987 Jpn. J.
Appl. Phys. Suppl. 26 1195 Padamsee H 1987 (preprino Radhakrishnamurty C, Likhite S D and Sastry N P 1971 Philos. Maq. 23 503 Ravi Kumar G and Chaddah P 1987 (submitted) Ravi Kumar G and Chaddah P 1988 (submitted) Renker B, Apfelstedt I, Kupfer H, Politis C, Rietschel H, Schauer W, Wuhl H, Gottwick U. Knelssel H,
Rauchschwalbe U, Spille H and Steglich F 1987 Z. Phys. B67 1 Rosenberg M, Mittag M, Job R, Chojetzki W, Wernhardt R. Sabrowsky H and Neubauer R 1987 Z. f'h)s.
B69 151 Schneemeyer L F, Gyorgy E M and Waszczak J V 1987 Phys~ Rev. B36 8804 Senoussi S, Oussena M and Collin G 1987a (preprint) Senoussi S, Oussena M, Ribault M and Collin G 1987b Phys. Rev. B36 4003 Senoussi S, Oussena M and Hadjoudj S 1987c J. Appl. Phys. Im press) Subba Rao G V, Varadaraju U V, Thomas K A, Vijayashree R, Raju N P, Srinivasan R, De U, Janaki J and
Radhakrishnan T S 1987 Jpn. J. Appl. Phys. Suppl. 26 1077 Umezawa A, Crahtree G W, Liu J Z, Weber H W, Kwok W L, Nunez L H, Moran T J, Sowers C H and
Claus H 1987a Phys. Rev. B36 7151 Umezawa A, Crabtree G W, Liu J Z, Moran T J, Malik S K, Nunez L H, Kwok W L and Sowers C H 1987b
Ipreprint) Wiesmewski A, Baran M, Przyslupski P, Szymczak H, Pajaczkowska A, Pytel B and Pytel K 1988 Solid State
Commun. 65 577