
Measurement and Evaluation in Education II
125
i STUDY GUIDE Measurement and Evaluation in Education – II Course Code – 3743 Re-written and updated by Prof. Dr. Rehana Masrur DEPARTMENT OF SECONDARY TEACHER EDUCATION FACULTY OF EDUCATION ALLAMA IQBAL OPEN UNIVERSITY, ISLAMABAD
Transcript of Measurement and Evaluation in Education II

i
STUDY GUIDE
Measurement and Evaluation in Education – II
Course Code – 3743
Re-written and updated
by
Prof. Dr. Rehana Masrur
DEPARTMENT OF SECONDARY TEACHER EDUCATION
FACULTY OF EDUCATION
ALLAMA IQBAL OPEN UNIVERSITY, ISLAMABAD

ii
(All Rights are Reserved with the Publisher)
First Edition ..................................... 2010
Year of Printing ............................... 2012
Quantity ........................................... 20
Layout .............................................. Asrar ul Haque Malik
Printer .............................................. AIOU-Printing Press, H-8, Islamabad.
Publisher .......................................... Allama Iqbal Open University, Islamabad
Price ................................................. Rs.

iii
COURSE TEAM
Dean: Prof. Dr. Rehana Masrur
Chairperson: Prof. Dr. Rehana Masrur
Writers: Prof. Dr. Rehana Masrur
Reviewer: Prof. Dr. Rehana Masrur
Editor:
Course Development Coordinator Prof. Dr. Rehana Masrur
Course Coordinator: Prof. Dr. Rehana Masrur

iv
FORWARD
‘Measurement’ and ‘Evaluation’ are very important aspects for the appraisal of any
phenomenon. Evaluation helps in ascertaining the level of achievement of objectives.
Similarly, measurement helps in rating the worth of any task rendered. As we know that
quality of teacher preparation and ongoing professional development indeed is crucial to
quality of teacher performance in the classroom and this can be achieved through the
awareness and application of the principles relating to measurement and evaluation.
The rapid technological changes and developments have changed the face of the social as
well as educational arena. These changes demand more rigorous approach from the
academics which consequently have changed their approach towards measurement and
evaluation.
The particular fact leads the teacher educators towards more specific approach that the
trainee teachers should be well prepared. The particular study guides “Measurement and
Evaluation in Education-I”, and “Measurement and Evaluation in Education-II” are an
attempt of the course development team, who focused upon the modern concepts of the
measurement and evaluation.
I appreciate Dean Faculty of Education (coordinator of this course) and course
development team, on successful completion of this study guide and selection of web
based study materials.
The theoretical and methodological issues in measurement and evaluation addressed in
these study guides will help future educators to measure students’ performance on
scientific basis.
I congratulate the co-coordinator for her efforts regarding the completion of study guides.
(Prof. Dr. Mehmood-ul-Hassan Butt)
Vice-Chancellor

v
INTORDUCTION TO THE COURSE
This study guide has been revised keeping in view new knowledge, emerging trends in
pedagogy and curriculum development approaches. Therefore revised version will serve
the following purposes:
1. To develop the ability to assess affective behavior through informal and formal
ways. Unit 1 focuses on this topic.
2. To develop the understanding of special needs of students in regular classes and the
ability to deal with them. This issue is discussed in Unit 2.
3. To develop the ability of assessing complex learning objectives through
performance assessment. Unit 3 deals with this topic.
4. To develop the understanding of formative assessment and the ability to effectively
use formative assessment in classroom. This topic is discussed in unit 4.
5. To develop the understanding of use of portfolios in educational assessment. This
is the focus of unit 5.
6. To develop the understanding of use of descriptive statistics in education. In units-6
and 7 some important statistical measures have been introduced.
7. To develop the understanding of importance of teachers self assessment and
accreditation of teacher education institutions. These topics are discussed in unit 8.
8. To develop an appreciation of recent trends in educational assessment and the use
of technology in educational assessment. This is the topic of unit 9.

vi
CONTENTS
UNIT 1
1.1 Introduction ..........................................................................................................5
1.2 Objectives ............................................................................................................5
1.3 Methods for Assessing Affective Behavior .........................................................5
1.4 Observational Techniques ....................................................................................6
1. Anecdotal records ......................................................................................6
2. Rating Scales ..............................................................................................6
3. Checklists ...................................................................................................8
4. Inventories ..................................................................................................8
5. Interview ..................................................................................................10
1.5 Projective Techniques ........................................................................................10
1. The Rorschach Psycho Diagnostic Test ...................................................11
2. The Thematic Apperception Test .............................................................11
3. The Szondi Test .......................................................................................11
4. Resenzweig Picture - Frustration Study ..................................................12
5. Free Word Association Method ...............................................................12
1.6 Sociometric and Related Techniques .................................................................12
1. Sociogram ................................................................................................12
2. Social Distance Scale ...............................................................................12
3. Guess Who ...............................................................................................13
4. Peer Rating ...............................................................................................13
1.7 Self-report ..........................................................................................................13
1. Biographical Data Blanks ........................................................................13
2. Personality Inventories .............................................................................14
3. Interest Inventories ...................................................................................14
1.8 Measurement of Attitude ...................................................................................14
1. Thurstone Scales ......................................................................................14
2. Guttman Scale ..........................................................................................15
3. Likert Scales .............................................................................................15
1.9 Self Assessment Questions ................................................................................15
1.10 Additional Readings ..........................................................................................15
1.11 Web Based Material ...........................................................................................16
UNIT 2
2.1 Introduction ........................................................................................................21
2.2 Objectives ..........................................................................................................21
2.3 Identification of Students' Special Needs ..........................................................21
2.4 Common Learning Deficits................................................................................21
1. Mild Mental Retardation ..........................................................................22

vii
2. Sensory Impairment .................................................................................22
3. Physical Impairment ................................................................................22
4. Learning Disability ..................................................................................22
5. Emotional Disturbance .............................................................................22
6. Attention Deficits .....................................................................................22
7. Hyperactivity ............................................................................................22
2.5 Teaching Students with Learning Deficits .........................................................22
2.6 Assessment Problems Encountered by Students with Special Needs ................23
1. Comprehension Difficulty ........................................................................23
2. Auditory Difficulties ................................................................................23
3. Visual Difficulties ....................................................................................23
4. Time Constraint Difficulties ....................................................................23
5 Anxiety .....................................................................................................23
6. Embarrassment .........................................................................................24
7. Variability of Behavior ............................................................................24
2.7 Assessment Accommodations ...........................................................................24
1. Adaptations in Test Directions, Construction and Format .......................24
2. Adaptation in Test Administrations .........................................................24
3. Adaptations in Testing Site ......................................................................24
2.8 Grading Accommodations .................................................................................25
2.9 Reporting Accommodations ..............................................................................26
2.10 Self Assessment Questions ................................................................................26
2.11 Suggested Readings ...........................................................................................26
2.12 List of Web-Based material ...............................................................................27
UNIT 3
3.1 Introduction ........................................................................................................33
3.2 Objectives ..........................................................................................................33
3.3 Performance Assessment ...................................................................................33
3.4 Importance of Performance Assessment ............................................................34
3.5 Strength and Weaknesses of Performance Assessment .....................................34
3.6 Stating Objectives for Performance Assessment ...............................................35
1. Deep Understanding .................................................................................35
2. Reasoning .................................................................................................35
3. Skills ........................................................................................................35
4. Products ....................................................................................................36
3.7 Constructing Performance Tasks .......................................................................36
1. Identifying Performance Task ..................................................................36
2. Performance Task Description .................................................................37
3. Performance Task Questions....................................................................37
3.8 Performance Criteria ..........................................................................................37

viii
3.9 Scoring Performance tasks .................................................................................38
3.10 Self Assessment Questions ................................................................................39
3.11 Suggested Readings ...........................................................................................39
3.12 List of Web-Sites ...............................................................................................39
UNIT 4
4.1 Introduction ........................................................................................................45
4.2 Objectives ..........................................................................................................45
4.3 Formative Assessment .......................................................................................45
4.4 Informal Observation .........................................................................................46
1. Non-verbal Behavior ................................................................................46
2 Vocal Cues ...............................................................................................47
4.5 Oral Questioning ................................................................................................47
1. Purpose of Questioning ............................................................................47
2. Types of Questions ...................................................................................48
3. Guidelines for Effective Questioning .......................................................48
4.6 More Assessment Strategies ..............................................................................49
1. Homework ................................................................................................49
2. In-class Assignments ................................................................................49
3. Quiz ..........................................................................................................49
4.7 Effective Feedback ............................................................................................49
4.8 Effective Praise ..................................................................................................50
4.9 Self Assessment Questions ................................................................................50
4.10 Additional Readings ..........................................................................................50
5.11 Web Based Material ...........................................................................................51
UNIT 5
5.1 Introduction ........................................................................................................57
5.2 Objectives ..........................................................................................................57
5.3 Portfolios ............................................................................................................57
5.4 Types of Portfolios .............................................................................................58
5.5 Strengths and Weaknesses of Portfolios ............................................................58
5.6 Planning Portfolios ............................................................................................59
1. The Purpose of Portfolios ........................................................................59
2. The Performance Criteria .........................................................................59
3. The Structure and Organization of Portfolios ..........................................59
4. Scoring Criteria ........................................................................................59
5.7 Implementation of Portfolio Assessment ...........................................................60
1. Discussion with Students .........................................................................60
2. Selection of Contents ...............................................................................60
3. Maintenance and Use ...............................................................................60

ix
4. Evaluation ................................................................................................61
5 Feedback ..................................................................................................61
5.8 Self-Assessment Questions ................................................................................61
5.9 Additional Readings ..........................................................................................61
5.10 Web-Based material ...........................................................................................62
UNIT 6
6.1 Introduction ........................................................................................................67
6.2 Objectives ..........................................................................................................67
6.3 Basic Concepts in Statistics ...............................................................................67
6.4 Frequency Distribution ......................................................................................68
6.5 Measures of Central Tendency ..........................................................................70
1. Mean ........................................................................................................70
2. Median .....................................................................................................73
3. Mode ........................................................................................................74
UNIT 7
7.1 Introduction ........................................................................................................81
7.2 Objectives ..........................................................................................................81
7.3 Measures of Variability .....................................................................................81
1. The Quartile Deviation (Q) ......................................................................81
2. The Standard Deviation or SD ................................................................82
7.4 Percentile Ranks ................................................................................................86
7.5 Normal Distribution ...........................................................................................88
Skewness ............................................................................................................88
7.6 Measures of Relationships .................................................................................89
1. Linear Correlation ....................................................................................89
2. Prediction .................................................................................................91
7.7 Application of Descriptive Statistics for Interpreting Standardized Tests .........92
7.8 Self Assessment Questions ................................................................................92
7.9 Additional Readings ..........................................................................................93
7.10 Web Based Material ...........................................................................................94
UNIT 8
8.1 Introduction ........................................................................................................99
8.2 Objectives ..........................................................................................................99
8.3 Why Teacher Self-Assessment? ........................................................................99
8.4 Informal Self-Assessment ................................................................................100
8.5 Formal Self-Assessment ..................................................................................100
8.6 Peer Assessment ..............................................................................................101
8.7 Institutional Self-Assessment...........................................................................101

x
8.8 What is Accreditation? .....................................................................................101
8.9 Need and Importance of Accreditation ............................................................102
8.10 Pakistan Accreditation Council for Teacher Education ...................................102
8.11 Quality Indicators for Teacher Education ........................................................103
8.12 Professional Standards for Teachers in Pakistan .............................................103
8.13 Self Assessment Questions ..............................................................................104
8.14 Additional Readings ........................................................................................104
8.15 Web Based Material .........................................................................................105
UNIT 9
9.1 Introduction ......................................................................................................111
9.2 Objectives ........................................................................................................111
9.3 Traditional Tests and Cognitive Psychology ...................................................111
9.4 Assessment Trends in the Light of Behavioral Views .....................................112
9.5 Assessment Trends in the Light of Cognitive Views .......................................112
9.6 Educational Assessment in 21st Century .........................................................112
1. Computer Adaptive Testing ...................................................................113
2. Computer Simulation .............................................................................113
3. E-Portfolios ............................................................................................113
9.7 Equity and Assessment ....................................................................................113
9.8 Trends in Student Testing in Pakistan .............................................................113
1. Establishment of National Educational Assessment System .................114
2. GRE Tests ..............................................................................................114
9.9 Self Assessment Questions ..............................................................................114
9.10 Web-Based Material ........................................................................................115

1
Unit–1
Assessing Affective Behavior
Written by:
Prof. Dr. Rehana Masrur

2

3
CONTENTS
1.1 Introduction ......................................................................................................5
1.2 Objectives .........................................................................................................5
1.3 Methods for Assessing Affective Behavior ......................................................5
1.4 Observational Techniques ................................................................................6
1. Anecdotal records ...................................................................................6
2. Rating Scales ..........................................................................................8
3. Checklists ................................................................................................8
4. Inventories ..............................................................................................8
5. Interview ...............................................................................................10
1.5 Projective Techniques .....................................................................................10
1. The Rorschach Psycho Diagnostic Test ................................................11
2. The Thematic Apperception Test .........................................................11
3. The Szondi Test ....................................................................................11
4. Resenzweig Picture - Frustration Study ...............................................12
5. Free Word Association Method ............................................................12
1.6 Sociometric and Related Techniques..............................................................12
1. Sociogram .............................................................................................12
2. Social Distance Scale ............................................................................12
3. Guess Who ............................................................................................13
4. Peer Rating ............................................................................................13
1.7 Self-report .......................................................................................................13
1. Biographical Data Blanks .....................................................................13
2. Personality Inventories .........................................................................14
3. Interest Inventories ...............................................................................14
1.8 Measurement of Attitude ................................................................................14
1. Thurstone Scales ...................................................................................14
2. Guttman Scale .......................................................................................15
3. Likert Scales .........................................................................................15
1.9 Self Assessment Questions .............................................................................15
1.10 Suggested Readings ........................................................................................15
1.11 List of Web Sites ............................................................................................16

4

5
1.1 Introduction
Affective behavior relates to the emotional life of an individual. A person acts in
response to his immediate environment. But in the same environment reaction of one
individual largely differs from the reaction of another individual. “Why it happens so,” is
a big question, and the development of personality theories, is an effort to answer this
question. Earlier assumption of S-R (Stimulus-Response) does not hold true now. The
new equation of S-O-R (Stimulus-Organism-Response) includes organism as the decisive
element for responding to any situation. The organism (individual) is not a mere physical
entity. His environment, both prenatal and post-natal, has its lasting effects on the
personality of the individual. Reactions to any situation stem from the past experiences,
but they are modified in the light of present situation.
In evaluating affective behavior we try to measure the emotional life of the
individual which, in one way or the other influences his behavior and gives a specific
form to his disposition.
This unit therefore will discuss mostly the behavioral aspect of the individual in the
perspective of different measurement techniques. In contrast to abilities, behavior relates
to emotions, motivations, interpersonal relations and attitudes. Tests developed to
measure the above aspects of behavior run into hundreds, but in this unit a few very
important tests will be discussed.
1.2 Objectives
After going through this unit, the you are expected to be able to:
1. Describe different techniques for evaluating behavior;
2. Observe and record behavior symptoms of students;
3. Prepare and use different types of scales, checklists and inventories;
4. Use and interpret projective techniques for evaluating behavior; and
5. Prepare and use sociometric techniques and sociograms.
1.3 Methods for Assessing Affective Behavior
The following methods are commonly used for measuring the personality of an
individual. You should know that measurement of emotional life (the inner-self) of a
person is a very difficult task; there is every possibility that the measurement would not
be reliable. The underlying secret is that human beings always make an endeavor to
conceal their inner-self. Private life is always private and no one wants to expose it to
others. Personality, in fact is a persona-the mask on the face.
A Observational methods
a. Anecdotal records.
b. Rating scales.
c. Check lists.
d. Inventories.
e. Interviews.

6
B Sociometric and related techniques
a. Sociograms.
b. Socio-distance scales.
c. “Guess who” scales.
C Self-report inventories
a. Biographical data banks.
b. Personal inventories.
c. Interest inventories.
d. Attitude scales and questionnaires.
D Projective techniques
a. Inkblot and picture presentations.
b. Presentations of verbal stimuli.
c. Sentence completions.
1.4 Observational Techniques
Paper-pencil tests usually used in ability testing cannot be used for evaluating
behavior. One way of evaluating behavior is observation in working situations. We can
also make judgment of behavior by observing the quality of product. Opinion solicited
from the peer group also helps in making a judgment of behavior. Our questions related
to the personal and social life of the individual provide useful information about his
attitudes, liking and disliking, etc. The following observational methods are systematic
approaches for evaluating behavior.
1- Anecdotal records
These are the records of the daily observation of students by the teacher. Only
those aspects of behavior are noted which help in making some sort of decision. Separate
record is maintained for each student. It is confidential and non-transferable to any other
teacher. The use of anecdotal record is limited to the area of social adjustment, and social
development.
In observation, care needs to be taken that only those areas of behavior may be
observed which cannot be evaluated by other means. At one time only one type of
behavior may be observed. Observation may be restricted to those few students who are
in need of special attention.
Article 1.1.2 on “Anecdotal Records” in Folder Unit. 1 in CD.
Activity Develop anecdotal records of your students.
2- Rating Scales
It is a systematic procedure for recording observation. Rating scale consists of qualities,
characteristics to be observed. A rating scale is not an instrument for measuring some behavior.

7
It is only a device for reporting the observations made by any external observer. In contrast to
the anecdotal record, the rating scale has the following advantages:
a. It helps in concentrating on the specific area of observation.
b. It provides a common frame of reference for all pupils being observed.
c. It is a very convenient method of recording observations.
Please see a sample of rating scale1.2.2 on “Rating Scale” in Folder 1on Affective
Behavior in CD.
Types of Rating Scales
i) Numerical rating scales
These scales have numbers to check the degree of behavior which is present. For
example a teacher is evaluating the overall performance of a student. The raring scale has
the following columns. The rater is to check the most appropriate column.
5 4 3 2 1
Out-standing Excellent Above-average Below average Unsatisfactory
ii) Graphic rating scales
These scales have a horizontal line long with the behavior being observed. The
rater checks a place on the line to mark the degree of behavior found in the individual.
Example:
To what extent he is aggressive in daily class activities:
Never Seldom Sometimes Frequently often
iii) Descriptive graphic scales
These scales are similar to the graphic rating scales but provide description of the
behavior being observed.
Uses of Rating Scales
The rating scales are used for observing (1) procedures; (2) product; (3) personal-
social development.
a. Procedure: all behaviors being performed.
b. Product: output, resultant outcome of certain action, e.g., handwriting, drawing,
maps, graphs, notebooks, etc.
c. Personal-social development: general pattern of behavior with classmates, friends,
peer group, teachers, parents, etc.
Errors in rating
The following types of errors often occur when rating certain behavior: (1) personal
bias: (2) Halo effect: and (3) logical error.
i) Personal bias
Personal bias reflects the general tendency of an individual for rating either on high
side or on low side. There is no discrimination of good or bad performance. Evaluation is
made only on account of personal disposition.

8
ii) Halo effect
It is general impression of the rater about some individual who is being rated. If the
rater has good opinion, rating will be naturally very high. If it is reverse, the rating will be
very low.
iii) Logical error
It occurs when rating two similar characteristics, but the rater is unable to properly
differentiate between the two.
3 Checklists
Checklist is similar to a rating scale in appearance. The only difference is that in
the rating scale the rater has to check the degree to which certain behavior exists. But in
the checklist, he has to respond in yes or no. It means he has to describe whether a certain
behavior exists or not. These are used for evaluating procedures, products and existence
of typical behavior. Checklists are especially useful at primary level where most of the
behavior is observed by the teacher and the students are not expected to mark or fill up
the blanks. Checklists may also be used for the illiterate population who, on account of
illiteracy, are not able to respond on a written form.
Here the students need to be aware of the concept “behavior”. It denotes apparent
working of an organism, whatever motivation may be in the background. Painting a wall,
drawing a portrait, writing a letter, all are kinds of behavior. By a checklist, the
supervisor can make judgment of the work being performed by a painter; a teacher may
check the positive and negative points of a letter being written by a student, and so on. As
the nature of checklist changes with the subject to be evaluated, therefore it is necessary
that appropriate and elaborate directions may be provided to every person assigned the
job of evaluation. For details, please study:
Please study Airasian (2001), pp. 243-248
For samples of different scales see 1.3.2“Samples of Scales” in Folder 1 in CD.
Activity Prepare a checklist for measuring the attitude of teachers towards their profession.
4 Inventories
An inventory is a kind of checklist used to determine the subject’s or examinee’s
ability, achievement, aptitude, interest or likes and dislikes, usually in a limited area.
Sometimes there are questions or tasks to be performed for providing a comprehensive
description of some aspect of an individual’s behavior in quantitative form.
The first inventory was developed during World War-I, by Woodworth. It was a
self report-type personal data sheet and the individual was required to answer about self.
Score was obtained by counting the number of symptoms reported. This inventory served
as a model and was followed by most subsequent inventories prepared for measuring
emotional adjustment.
During world War-II, a new kind of inventory on the pattern of forced choice rating
scale was developed, where often four choices were available, two favorable and two

9
unfavorable and the observer had to rate the individual anywhere on the scale. First
inventory of this type, developed by Shipley, had both long form and short form. The
long form consisted 145 items and the short form had only 20 items.
At present several hundred personality inventories are available in different institutions, and
several approaches have been used in developing them. The major approaches are:
a. Content validation.
b. Empirical criterion keying.
c. Factor analysis.
d. Personality theory.
i) Content Validation
This pattern follows the self-report personality; inventory procedures first
developed by Woodworth in the form of personal Data Sheet. The inventory questions
were developed with reference to the symptoms of neurotic behavior developed by him.
Present achievement in this direction is the Mooney Problem check list. This has been
developed for identifying the problems of students. Some of the problems are as under:
a. I wish I knew how to study better.
b. I am self-conscious at social affairs.
ii) Empirical criterion keying.
This refers to a scoring key in terms of some external criteria. The base of this inventory
was also the Personal Data Sheet developed by Woodworth. Only those items were retained in
this inventory that received more than 25 per cent of the answer in negative from the normal
group and the abnormal group as compared to the normal group reported them at least twice as
often. This survey of symptoms served as the criterion for the selection of items. One of the
examples of this kind is the Minnesota Multiphase Personality Inventory. This test consists of
550 affirmative statements to which the examinee gives the responses, “true,” “false” or
“cannot-say.” Some of the items are given below.
a. I do not tire quickly.
b. I am worried about sex matters.
c. When I get bored I like to stir up some excitement.
d. I believe I am being plotted against.
iii) Factor Analysis
In an effort to arrive at a systematic classification of personality traits Guilford and
Zimmerman used the factor analysis method. They computed correlation of different items
scores and developed Guilford-Zimmerman Temperament survey. Another inventory of this
kind is Comrey Personality Scales and yields scores in eight personality traits.
iv) Personality theory
A few of the inventories based on Clinical research are as under:
Edward Personal Reference Schedule, developed by Edward, deals with 15 basic needs.
The inventory consists of 210 pairs of statements. Out of each pair the examiner has to
check one statement more relevant to him, for example.
A. I like to talk about myself to others.

10
B. I like to work toward some goal that I have set for myself.
A. I feel depressed when I fail at something.
B. I feel nervous when giving a talk before a group.
For details please study Anastasi, pp493-526
5. Interview
Interview is a kind of observation of behavior. It is a planned effort and the
behavior expressed by the examiner is modified according to the constructed situation.
But it always yields good results and helps to certify information gathered from other
sources. A trained interviewer often succeeds in educing information which otherwise
was not possible to reach at.
Before holding interview, rapports need to be developed. Intimacy and friendship
encourages the interviewee to expresses himself freely. For marking responses, the
interviewer should have a checklist/rating scale appropriate to the occasion. Responses
should be marked instantly.
If the checking of responses is delayed personal whims of the interviewer interrupt
and the outcome becomes susceptible to errors.
Please study McMillan (2007), pp. 305-323
1.5 Projective Techniques
It is a diagnostic procedure to find out behavior tendencies of an individual. The
individual is put in an unstructured, vague and ambiguous situation where there is no
compulsion. He is free to react, write or speak according to the situation. The outcome is
considered to be the reflection (projection) of his inner-self, and thus it helps in
understanding the problems.
The projective measures are divided into two major types:
1. Content-Centered
In this type the feeling of the examinee are analyzed in terms of the theme that is
believed to be the product of his imagination and represents his fantasies.
2. Form-Centered
It consists of different forms, figures, pictures, etc. The examinee looks at the figures and
expresses his reactions that are considered to be the factors influencing his behavior.
In the interpretation of projective techniques the emphasis should always be on the
content that actually is the reflection of the sub-conscious. Emphasizing, for example, on
the presentation of the material is actually shifting emphasis form the theme to the format
that, in this case, is not important.
There has been severe criticism against the use of projective techniques as a
measure for evaluating behavior, as there is no objective evidence of validity. Some
important projective techniques are given below:
11
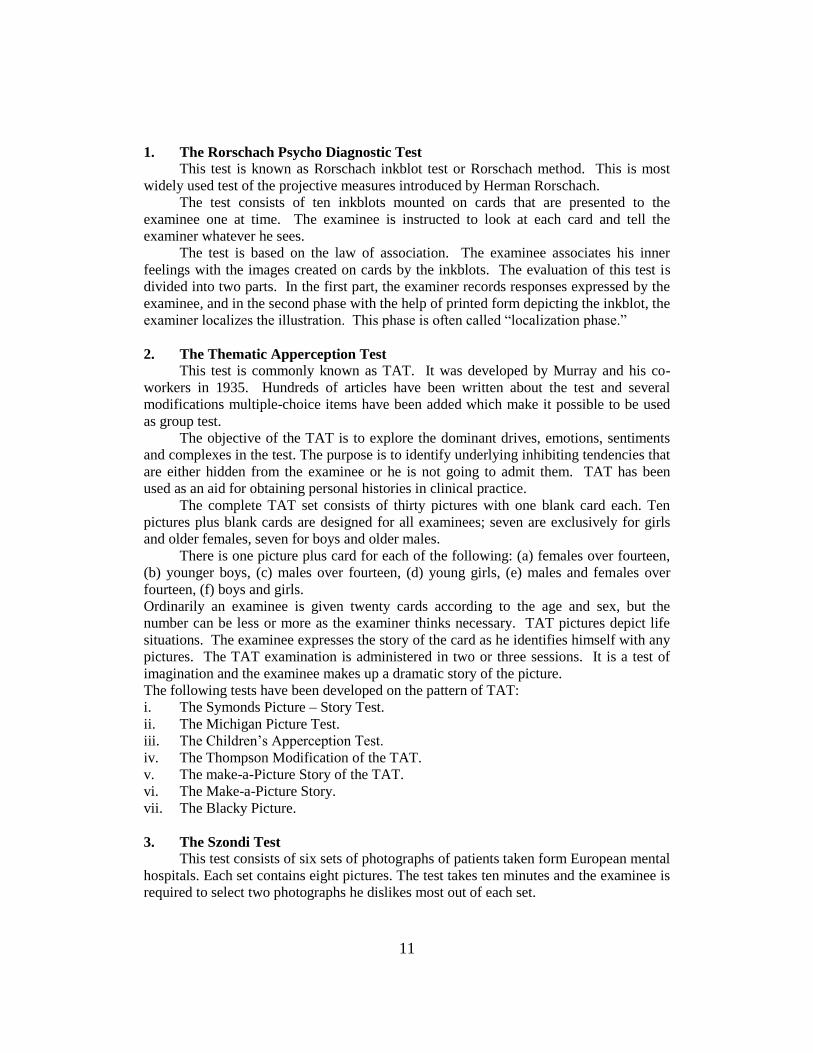
1. The Rorschach Psycho Diagnostic Test
This test is known as Rorschach inkblot test or Rorschach method. This is most
widely used test of the projective measures introduced by Herman Rorschach.
The test consists of ten inkblots mounted on cards that are presented to the
examinee one at time. The examinee is instructed to look at each card and tell the
examiner whatever he sees.
The test is based on the law of association. The examinee associates his inner
feelings with the images created on cards by the inkblots. The evaluation of this test is
divided into two parts. In the first part, the examiner records responses expressed by the
examinee, and in the second phase with the help of printed form depicting the inkblot, the
examiner localizes the illustration. This phase is often called “localization phase.”
2. The Thematic Apperception Test
This test is commonly known as TAT. It was developed by Murray and his co-
workers in 1935. Hundreds of articles have been written about the test and several
modifications multiple-choice items have been added which make it possible to be used
as group test.
The objective of the TAT is to explore the dominant drives, emotions, sentiments
and complexes in the test. The purpose is to identify underlying inhibiting tendencies that
are either hidden from the examinee or he is not going to admit them. TAT has been
used as an aid for obtaining personal histories in clinical practice.
The complete TAT set consists of thirty pictures with one blank card each. Ten
pictures plus blank cards are designed for all examinees; seven are exclusively for girls
and older females, seven for boys and older males.
There is one picture plus card for each of the following: (a) females over fourteen,
(b) younger boys, (c) males over fourteen, (d) young girls, (e) males and females over
fourteen, (f) boys and girls.
Ordinarily an examinee is given twenty cards according to the age and sex, but the
number can be less or more as the examiner thinks necessary. TAT pictures depict life
situations. The examinee expresses the story of the card as he identifies himself with any
pictures. The TAT examination is administered in two or three sessions. It is a test of
imagination and the examinee makes up a dramatic story of the picture.
The following tests have been developed on the pattern of TAT:
i. The Symonds Picture – Story Test.
ii. The Michigan Picture Test.
iii. The Children’s Apperception Test.
iv. The Thompson Modification of the TAT.
v. The make-a-Picture Story of the TAT.
vi. The Make-a-Picture Story.
vii. The Blacky Picture.
3. The Szondi Test
This test consists of six sets of photographs of patients taken form European mental
hospitals. Each set contains eight pictures. The test takes ten minutes and the examinee is
required to select two photographs he dislikes most out of each set.

12
According to Szondi, the author of the test, the test is based on the similarity
between the genes shown in the pictures and the examinee’s own. The test is not in use
anywhere.
4. Resenzweig Picture – Frustration Study
This test has been designed for the assessment of reaction to frustration. The test
contents 24 cartoon pictures each depict two persons involved in a frustrating situation of
common type. The examinee is asked to look at one of the pictures and write on the
blank space the first response to the words written above the picture.
5. Free Word Association Method
The method was developed by Kent and Rosanoff. It attempts to elicit the fist
association to the stimulation method. The examinee is asked to complete partially
finished sentences. These tests are suitable for group administration while, usually the
projective methods are individual –type tests.
For further study: McIntire and Millar (2000), pp. 309-314
1.6 Sociometric and Related Techniques
During late 1920s and early 1930s two sociologists, Bogardus and Merano
developed quantifiable measuring techniques for assessing inter-group conflict and
interpersonal attraction. These techniques were later called "sociometrics". These
techniques were quickly adapted for classroom usage in order to create a healthy
classroom environment.
Teachers know that the groups of children they work with have patterns of sub-groups,
cliques, and specific friendships. Some children are liked by their group more than others. Some
are less liked and some are even rejected by their group. The patterns of alliance and denial play
an important role in determining how the group will respond to learning situations, and to
various group management techniques that teachers might use.
Although teachers know the apparent and significant attributes of group structure,
the more subtle inter-personal relationships may be difficult to detect. Various
sociometric techniques are designed to analyze these relationships.
1. Sociogram
It is a very simple technique. All members of the group are asked to select and
name the children they would like to work or play with. After the group has given the
choices, the examiner makes an analysis by constructing a diagram that is usually called
“Sociogram.”
For detail please study article 1.4.2 “Sociometry in the classroom” in Folder 1 in CD.
2. Social Distance Scale
This scale is used for measuring peer attraction among group members. The scale
allows each child within a group to give, as well as receive from every child in the group,
a rating on a 1 to 5 continuum. The rating continuum is as follows:
o I would like to have her/him as one of my best friends.

13
o I would like to have her/him in my group but not as a close friend.
o I would like to be with her/him once in awhile but not often or for long at a time.
o I don't mind her/him being in our room but I don't want to have anything to do with
her/him
o I wish she/he weren't in our room.
For detail please see article 1.5.2 “Classroom Sociometry Introduction” and article 1.6.2
“Sociometry in the Classroom” in Folder 2 on CD.
3. Guess Who ‘Guess who’, is another technique of sociometry. It deals with the peer judgment
of an individual. Here each student is given a series of brief behavior descriptions and he
is asked to identify the classmate in order of preference who best fits to that description.
Some of the descriptions can be as given below:
a. Here is someone who is always friendly.
b. Here is someone who is never friendly.
c. This boy is never satisfied unless he gets his own way.
d. This girl is always starting quarrel even with her closest friends, etc.
Sometimes there are only positive characteristics and sometimes only negative but
they are helpful in understanding the group structure.
4. Peer Rating
It is not sociometric technique but a kind of evaluation taken up by the Class itself.
This evaluation can be of manners, behavior as in the scoiometric technique. It can also
be used as an evaluation device to serve as external criterion for validating the results of
classroom tests. It can also be used for evaluating oral performance of students e.g., in a
group discussion, debate, presentation of facts, etc. The rating is always averaged for
establishing rank order.
Please study McMillan (2007), pp. 320-322
1.7 Self-report
Some people are most knowledgeable of their capabilities and well-aware of their
own behavior. For evaluating their strengths and weaknesses self-report inventories are
used. The validity of this type of inventories line upon the degree to which the individual
responds to the questions correctly and tick the facts about his life.
1. Biographical Data Blanks
Data blanks are a kind of multiple-choice questions for eliciting successes and
failures for the past life of the individual. Information collected through this source helps
in prediction the failure or success of the individual in future profession. This information
can also be useful for selecting different school programs.
Please Study Gronlund, pp. 407-16

14
2. Personality Inventories
Personality inventories measure various personality traits, such as extraversion,
conscientiousness, agreeableness, etc. according to different personality theories that
suggest that the strength of these traits varies from person to person.
The earliest personality inventory, developed by Raymond B. Cattel, was published
in 1949, followed by a number of other personality tests. Some prominent personality
inventories are:
1. The Hogan Personality Inventory
2. California Personality Inventory
3. Neo Personality Inventory
For detail please study:
Kline (2005), pp.325-328 and McIntire and Miller (2000), pp. 331-334
3. Interest Inventories
These inventories are used in making career and vocational choices. These
inventories assess people’s interests in various types of careers. However, they do not
assess skills and abilities in those areas. Some major interest inventories are:
1. The Strong Interest Inventory
2. The Kuder Occupational Interest Survey
3. Career Assessment Inventory
4. Jackson Vocational Interest Survey
For detail please study:
Murphy and Davidshofer (1998), pp. 333-368 and Kline (2005), pp. 328-330
Also see a sample of ‘Students Interest Inventory’article 1.7.2, in Folder 1 on CD.
1.8 Measurement of Attitude
Attitude is reaction in words or feeling towards a person, thing or situation. It is the
sum of his inclinations, fears, wishes, prejudices, etc. In this way it is psychological
component of behavior and cannot be measured directly.
Attitude is often measured by observation in natural setting, interview, specific
performance pictorial and projective techniques, sociometry, analysis of personal
documents and questionnaires. However, the most popular approach of measuring
attitude is to administer an attitude questionnaire or scale. An attitude scale consisting of
positive and negative statements about a subject of interest can be constructed by
different procedures. Some of the famous attitude scales have been given below:
1. Thurstone Scales
Thurstone is considered to be the pioneer of attitude scaling. Thurstone scales
consist of a number of statements to which the readers have to respond, usually by ticking
a choice of two possible responses e.g. true/false or agree disagree.
Thurstone developed 3 scales for measuring attitude.
1. Paired Comparisons

15
2. Equal-appearing intervals.
3. Successive intervals.
2. Guttman Scale
Louis Guttman developed a scale in which all items are on a single dimension, so
that if a person agrees with a complete category, he should also agree with the parts of the
category. For example, if a person agrees with the statement, ‘I do not eat dairy products’
he will also agree with the statement, ‘I do not eat cheese and butter’.
For detail please study Kline (2005), pp. 35-45
3. Likert Scales
Likert scales use a slightly different approach. A number of statements, both
positive and negative are produced, however, instead of simple agreement or
disagreement with the item, the respondent is provided with responses ranging from
“strongly agree” to “strongly disagree”.
For detail please study Kline (2005), pp. 61-66
Also see article 1.8.2 “Attitude Measurement” in folder 1 in CD
and araticle 1.9.2 “Attitude Scales” in Folder 1 on CD.
Activity Prepare five-point Likert Scale for measuring attitude towards students unions in
colleges and universities.
SELF-ASSESSMENT QUESTION
1. What kinds of errors are expected to take place in rating? Suggest suitable
measures for avoiding the errors.
2. What is the difference between checklist and an inventory? What are their uses?
How far are they effective in measuring behavior?
3. Describe the philosophy behind projective techniques. Are they valid and reliable
tools for the studying the behavior?
4. What kinds of personality inventories are available? In your opinion which ones are
comparatively more reliable, why?
5. Discuss salient features of different attitude scales.
6. Develop an interest inventory to assess student’s interest in science/English.
Additional Readings
1. Kline, T. J. B. (2005), Psychological Testing, New Delhi: Vistaar Publications.
2. Murphy, K. R. and Davidshofer, C. O. (1998), Psychological Testing, New Jersey:
Prentice-Hall International, Inc.
3. McIntire, S. A. and Miller, L. A. (2000), Foundations of Psychological Testing,
Boston: McGraw Hill.

16
4. McMillan, J. H. (2007), Classroom Assessment: Principles and Practice for
effective Standard Based Instructions, Boston: Pearson Education, Inc.
5. Airasian, P. W. (2001), Classroom Assessment: Concepts and Applications,
Boston: McGraw Hill.
Web Based Material
1. Anecdotal Records, Retrieved February 25, 2008 from
http://www.fcs.utah.edu/info/cfdc/2610/anecdotal_records.doc
2. Rating Scale, Retrieved February 28, 2008 from
http://www.sasked.gov.sk.ca/docs/policy/studeval/affectasp.pdf
3. Samples of Scales, Retrieved February 28, 2008 from
http://www.sasklearning.gov.sk.ca/docs/kindergarten/anecdot.pdf
4. What is Sociogram, Retrieved March 05, 2008 from
http://www.users.muohio.edu/shermalw/sociometryfiles/socio_are.htmlx#what
5. Classroom Sociometry Introduction, Retrieved March 05, 2008 from
http://www.users.muohio.edu/shermalw/sociometryfiles/socio_introduction.htmlx#contents
6. Sociometry in the Classroom, Retrieved March 05, 2008 from
http://www.users.muohio.edu/shermalw/sociometryfiles/SOCIO_variation.htmlx#d
istance
7. Attitude Measurement, Retrieved February 25, 2008 from
http://www.ciadvertising.org/SA/fall_02/adv382j/kfarri1/attitude_measurement2.html
8. Attitude Scales, Retrieved February 25, 2008 from
http://www.psych.umn.edu/courses/spring05/federicoc/psy3201/lectures/032505.pdf
9. Student Interest Inventory, Retrieved February 25, 2008 from
http://www.orange.k12.nj.us/InclManualOrange/InclusionForms/STUDENTINTE
RESTINVENTORY-OrangeInclusionManual.pdf

17
Unit–2
Diagnosis and Remediation of Problems
Written by:
Prof. Dr. Rehana Masrur

18
19
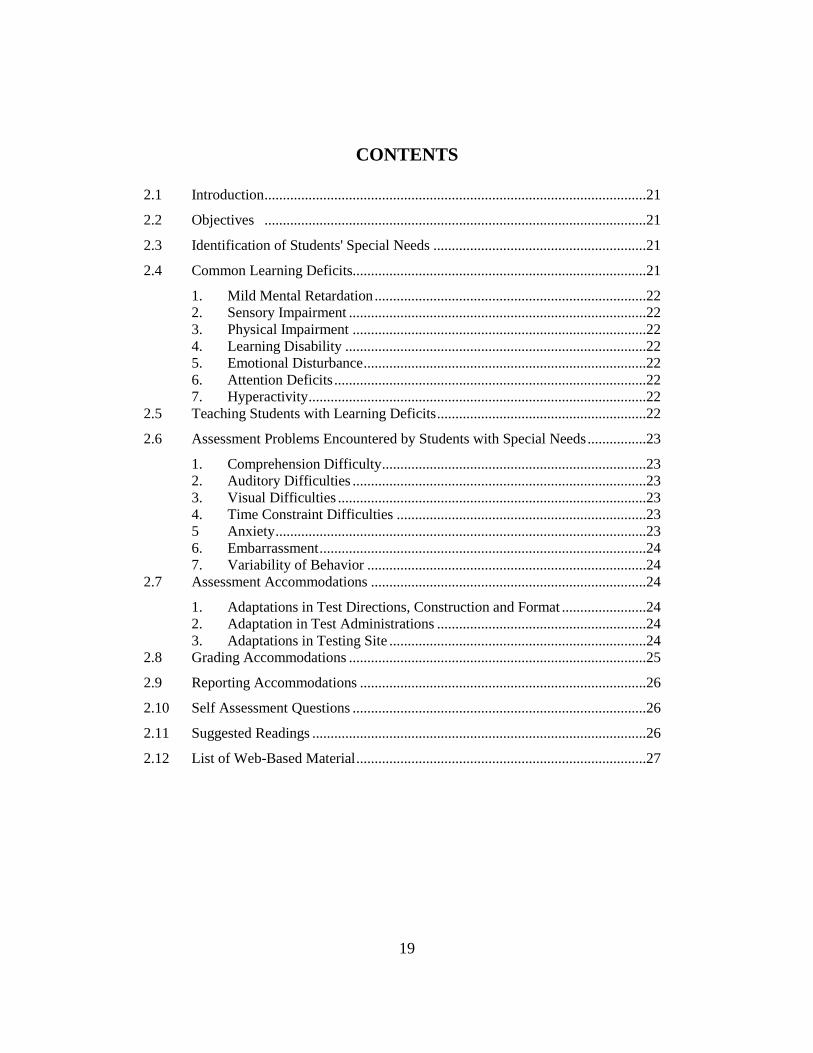
CONTENTS
2.1 Introduction ........................................................................................................21
2.2 Objectives ........................................................................................................21
2.3 Identification of Students' Special Needs ..........................................................21
2.4 Common Learning Deficits................................................................................21
1. Mild Mental Retardation ..........................................................................22
2. Sensory Impairment .................................................................................22
3. Physical Impairment ................................................................................22
4. Learning Disability ..................................................................................22
5. Emotional Disturbance .............................................................................22
6. Attention Deficits .....................................................................................22
7. Hyperactivity ............................................................................................22
2.5 Teaching Students with Learning Deficits .........................................................22
2.6 Assessment Problems Encountered by Students with Special Needs ................23
1. Comprehension Difficulty ........................................................................23
2. Auditory Difficulties ................................................................................23
3. Visual Difficulties ....................................................................................23
4. Time Constraint Difficulties ....................................................................23
5 Anxiety .....................................................................................................23
6. Embarrassment .........................................................................................24
7. Variability of Behavior ............................................................................24
2.7 Assessment Accommodations ...........................................................................24
1. Adaptations in Test Directions, Construction and Format .......................24
2. Adaptation in Test Administrations .........................................................24
3. Adaptations in Testing Site ......................................................................24
2.8 Grading Accommodations .................................................................................25
2.9 Reporting Accommodations ..............................................................................26
2.10 Self Assessment Questions ................................................................................26
2.11 Suggested Readings ...........................................................................................26
2.12 List of Web-Based Material ...............................................................................27

20

21
2.1 Introduction
In a regular class there are always some students with special needs, for example,
having cognitive, emotional or physical problems. A big challenge for a classroom
teacher is to diagnose the needs and accommodate such students in regular classrooms.
The teacher has to instruct and evaluate such students along with the normal students. It
is also a responsibility of the teacher to use assessment information to identify the
problems of students who may need special education services. In this unit we will take a
look at some special needs of students and also review some strategies used in adapting
fair and unbiased assessment practices for diagnoses and remedies of special students.
2.2 Objectives
After completing this unit, you will be able to:
1. Diagnose students’ special needs.
2. Understand problems of students with special needs in testing situations.
3. Make remedial measures for students with special needs in regular classroom.
4. Make fair and unbiased assessments of students with special needs.
5. Use appropriate grading procedures for students with special needs.
2.3 Identification of Students’ Special Needs
Teacher’s observations play important role in identifying students’ special needs.
Common problems, for example, in communication, comprehension, attention and
behavior, are best identified by classroom teachers’ observations (Airasian, 2001). On the
basis of observation, teachers can adapt suitable strategies for improving students’
performance. If students’ difficulties continue after making instructional modifications,
diagnostic assessment is made for identifying specific difficulties.
McMillan (2007) described following steps leading to identification of a student’s special
needs:
I. Initial assessment of student by class teacher.
II. Modification of instructions provided by the class teacher.
III. Diagnostic assessment of specific difficulties.
IV. Small group review of difficulties and interventions.
V. Further pre-referral instructional interventions.
VI. Formal referral for special services.
VII. Formal assessment of student.
VIII. Formal identification for special education services.
For detail see McMillan (2007), pp. 330-331
2.4 Common Learning Deficits
Following learning deficits are most likely to be found in students included in regular classes.

22
1. Mild Mental Retardation
Students having low scores on standardized intelligence tests and deficits of
adaptive behaviors are identified as having mild mental retardation. Adaptive behaviors
include skills necessary for daily living and its evaluation is relative to age and the
context in which the behavior occurs.
2. Sensory Impairment
Students having difficulties in vision, hearing or speech usually show poor
academic performance. Teacher’s close observations can help in identifying such deficits.
3. Physical Impairment
These include physical disorders such as orthopedic impairment and physical
illness. These conditions are obvious and can easily be identified.
4. Learning Disability
It is a deficit in mental process which manifests itself in a discrepancy between
performance and ability (McMillan, 2007). Students with learning disability may have
average or above average intelligence but their performance is below average.
5. Emotional Disturbance
It includes consistent inappropriate behavior and feelings which interfere with
academic performance, however, these are not caused by any other disability. Systematic
observation of student can help identify such problems.
6. Attention Deficits
Students with attention deficits find it difficult to focus on something or remain
focused. There are two types of attention disorders: Attention Deficit Disorder and
Attention Deficit Hyperactivity Disorder. Students with these disorders cannot sustain
attention, make careless mistakes, are likely to be absent-minded and forgetful.
7. Hyperactivity
Hyperactive students seem restless and have difficulty sitting calm. A related
disorder, impulsivity, includes difficulty waiting in turn, calling out answers, constantly
interrupting others, etc.
For detail see McMillan (2007), pp. 332-334 and McIntire and Miller (2000), pp. 68-72.
Also see article 2.1.2 “Learning Disabilities” in folder 2 in CD
and article 2.2.2 “Specific Learning Difficulties” in Folder 2 on CD.
2.5 Teaching Students with Learning Deficits
A teacher has the responsibility to adjust the students with special needs in the
class. However, it should not be done on the expense of quality of learning of the whole
class. The students with special needs should be so adjusted as to learn at their own pace
without being discriminated from the rest of the class. Teachers should made

23
accommodations for facilitating the learning of such students. For example, for the
students with visual or hearing difficulties may be seated on front desks, the students
having learning difficulties may be given extra time for completing work, students with
attention deficit may be allowed to work in a separate place where disturbance in
minimum and so on.
Airasian (2001) suggested some strategies to accommodate students with disabilities in
the regular classroom. See pp. 106-109.
Also see article2.3.2 ‘Teaching students with Disabilities’
article 2.4.2‘ strategies for Teaching Students with Learning Disabilities’ in Folder 2.
Activity Interview with two regular classroom teachers about the accommodations they made for
students with special needs and compare their responses with suggestions in this unit.
2.6 Assessment Problems Encountered by Students with Special Needs
The basic goal of assessment is to get accurate information about students’ performance.
As disabilities can affect assessment process, there is need to make necessary accommodations
or changes in assessment when needed so that the validity of assessment can be ensured. Before
looking at the strategies for assessing students with special needs, we will review some
problems encountered by such students in testing conditions.
1. Comprehension Difficulty
Students have difficulty in understanding directions for test or questions asked in
the test. They also have difficulty in completing tests that require reasoning skills.
2. Auditory Difficulties
Students have difficulty in understanding oral directions and their attention may be
distracted due to surrounding noises.
3. Visual Difficulties
Students have difficulty in understanding written directions or test items. They can
find difficulty in decoding resembling letters or symbols, e.g., b and d. Visual distracters
can affect their concentration.
4. Time Constraint Difficulties
Students having some sort of disabilities have difficulty in completing test in the
same time as other students do.
5. Anxiety
Testing situation usually overwhelms students particularly those having some
disabilities. The fear of being unable to complete the test creates feelings of anxiety. Such
students need to learn appropriate test-taking skills.

24
6. Embarrassment
The feeling of embarrassment keeps students with special needs from asking
questions about directions or test items because they want to conceal their weaknesses.
They also feel embarrassed when taking a test different from other students.
7. Variability of Behavior
The behavior of students with special needs varies from time to time. Their disabilities
can affect their behavior one time but not on other time. So, the teacher should be adaptable
while assessing such students so that their difficulty might not affect assessment results.
For detail see McMillan (2007), pp. 336-339
2.7 Assessment Accommodations
As disabilities can intervene with assessment process and influence the validity of
assessment results, there is need to take steps to accommodate the disability. McMillan
(2007) has grouped these accommodations in following three major categories:
1. Adaptations in Test Directions, Construction and Format
Test directions can be adapted for making them easy for students with special
needs. McMillan (2007) suggested following practices for adapting test directions.
i- Read direction loud and slowly; give students opportunity to ask questions.
ii- Keep direction short and simple.
iii- Explain with examples.
iv- Underline important verbs in the questions.
v- Provide separate directions for different sections of the test.
vi- Check students’ understanding of the directions.
The format of test should be simple; the printing should be large and ample space
should be given between items. The test should be divided into short sections. The
adapted format of the test should look like the format of test given to other students.
2. Adaptation in Test Administrations
Adaptations in test procedure can reduce the adverse effects of disabilities on
students’ performance in the test. Teachers keeping in view the nature of disabilities can
make these adaptations. For example, students with visual difficulties can be given oral
directions; students who experience time constraints can be given extra time. In order to
prevent disturbance a notice can be put on the classroom door alerting about the ongoing
test. McMillan (2007) has suggested several adaptations in test administration according
to various disabilities. See table 11.4 on page 343.
3. Adaptations in Testing Site
Students with special needs may be allowed to take test in a separate room. This
room should be quiet and free from distractions. In a separate setting students will find it
easy to ask questions without feeling of embarrassment.
For detail see McMillan (2007), pp. 339-344

25
Airasian (2001) has described four categories of modifications in testing students
with disabilities: modifying the presentation format of the test, modifying the response
format of the test, modifying test timings and modifying test setting.
See Airasian (2001), pp. 221-223
2.8 Grading Accommodations
Students’ grades are an evidence of what they have learned. In case of students
with special needs it is necessary to make accommodations in grading procedures, so that
their disabilities do not affect the grading decision. Following types of accommodations
can be made for grading students with special needs:
1. IEP-Based Grading
Grades can be assigned to special students on the basis of Individual Education
Plan (IEP). Grades are determined according to the criteria stated in IEP.
2. Shared Grading
In this approach grades are decided by more than one teacher. Different teachers
assign grades in different areas of learning for which they are responsible.
3. Multiple Grading
Students are assigned different grades for different performances and the overall
performance is determined on the basis of these grades. This approach also helps teachers
identify students’ strengths and weaknesses.
4. Contract Grading
In this method a contract is made between teacher and student that states the nature
of work that the student has to complete for getting a particular grade.
5. Level-Based Grading
In this approach students are assigned grade that mention both their achievement
level and curriculum level. For example, a student having achievement grade B in high
level curriculum may be assigned B (1), and in low-level curriculum B (2).
6. Narrative Grading
Teachers do not assign grades as such, but give a thorough written or oral report of
students’ performance, strengths, weaknesses and achievement based upon his/her own
observation and assessment.
For detail see McMillan (2007), pp. 345-346
Also see Airasian (2001), pp. 309-312
See 2.5.2 article ‘Grading Students with Educational Disabilities’
Activity Devise a plan for how you would accommodate the assessment of one or two students
with special needs who have been placed in regular classrooms.

26
2.9 Reporting Accommodations
In the regular progress report of special students supplementary information should
be provided regarding the specific disability of the student. This additional information
may be in the form of a checklist or in descriptive form. A checklist is suitable for
indicating whether objectives of instructions have been achieved satisfactorily or there is
need of further improvement.
A descriptive or narrative report provides more personalized evaluation of the
student. In this type of report teacher can fully explain students’ strengths and
weaknesses and also the areas of deficit that need special attention. Student’s
performance can be explained by describing some examples.
With the help of this supplementary information in the progress report, students can
have a better idea of how they can improve their performance. Students and parents can
understand what specific learning approach should be adapted for making better
performance.
2.10 Self-Assessment Questions
1. Identify the learning deficits to which following characteristics are associated:
a- Diabetes
b- Language deficit
c- Discrepancy between ability and achievement
d- Poor adaptive behavior
e- Poor eyesight
f- Slow learning
g- Restless
h- Easily distracted
2. Explain some problems that come across students with special needs during testing.
3. How can assessment procedures be made more valid for assessing students with
learning deficits?
4. What accommodations can be made in grading and reporting students with special
needs?
2.11 Suggested Readings
1. Airasian, P. W. (2001), Classroom Assessment: Concepts and Applications,
Boston: McGraw Hill.
2. McIntire, S. A. and Miller, L. A. (2000), Foundations of Psychological Testing,
Boston: McGraw Hill.
3. McMillan, J. H. (2007), Classroom Assessment: Principles and Practice for
effective Standard Based Instructions, Boston: Pearson Education, Inc.
27
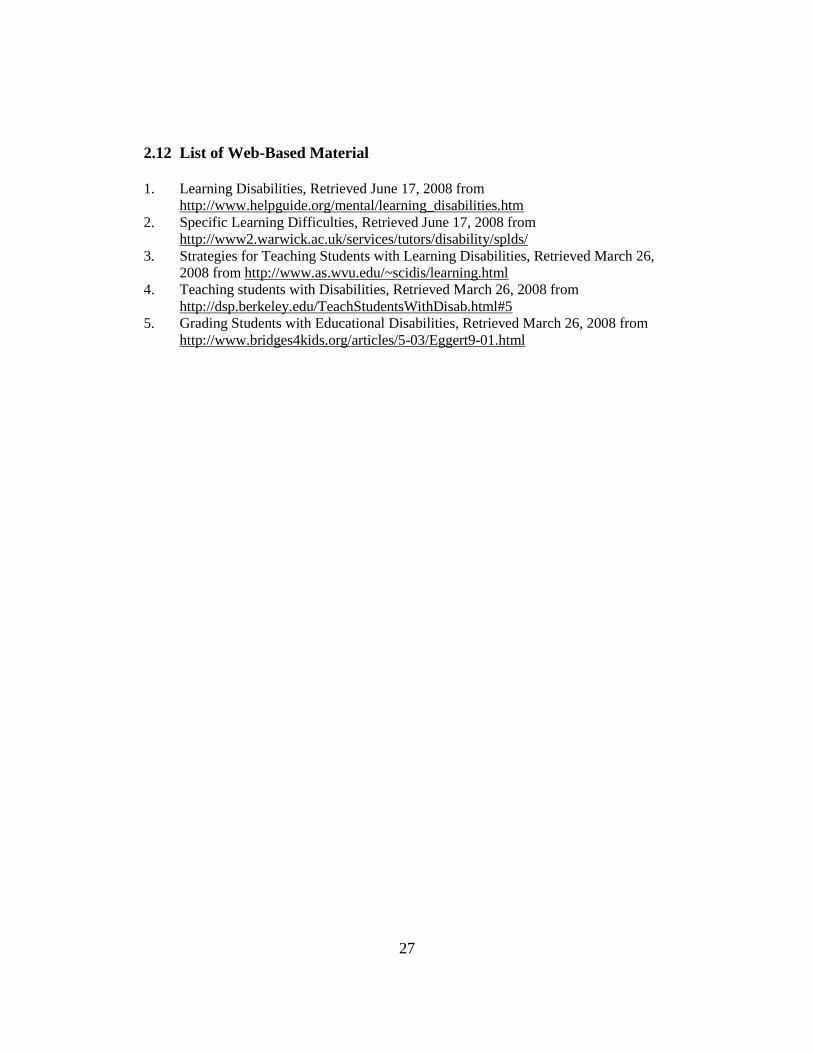
2.12 List of Web-Based Material
1. Learning Disabilities, Retrieved June 17, 2008 from
http://www.helpguide.org/mental/learning_disabilities.htm
2. Specific Learning Difficulties, Retrieved June 17, 2008 from
http://www2.warwick.ac.uk/services/tutors/disability/splds/
3. Strategies for Teaching Students with Learning Disabilities, Retrieved March 26,
2008 from http://www.as.wvu.edu/~scidis/learning.html
4. Teaching students with Disabilities, Retrieved March 26, 2008 from
http://dsp.berkeley.edu/TeachStudentsWithDisab.html#5
5. Grading Students with Educational Disabilities, Retrieved March 26, 2008 from
http://www.bridges4kids.org/articles/5-03/Eggert9-01.html

28

29
Unit–3
Assessing Deep Understanding,
Reasoning and Skills

30

31
CONTENTS
3.1 Introduction ........................................................................................................33
3.2 Objectives ..........................................................................................................33
3.3 Performance Assessment ...................................................................................33
3.4 Importance of Performance Assessment ............................................................34
3.5 Strength and Weaknesses of Performance Assessment .....................................34
3.6 Stating Objectives for Performance Assessment ...............................................35
1. Deep Understanding .................................................................................35
2. Reasoning .................................................................................................35
3. Skills ........................................................................................................35
4. Products ....................................................................................................36
3.7 Constructing Performance Tasks .......................................................................36
1. Identifying Performance Task ..................................................................36
2. Performance Task Description .................................................................37
3. Performance Task Questions....................................................................37
3.8 Performance Criteria ..........................................................................................37
3.9 Scoring Performance tasks .................................................................................38
3.10 Self Assessment Questions ................................................................................39
3.11 Suggested Readings ...........................................................................................39
3.12 List of Websites .................................................................................................39

32

33
3.1 Introduction
So far in this book we have discussed conventional paper and pencil methods of
assessment. These methods are useful for assessing knowledge and comprehension but
these are not much effective for assessing higher levels of cognition and psychomotor
skills. These days, great importance is given to make students able to apply learned
knowledge to real life situation, therefore, it is required to assess students by evaluating
what they can do rather than what they know how to do.
In this unit we will discuss the importance and development of performance assessment
and also discuss its strengths and weaknesses.
3.2 Objectives
After completing this unit you will be able to:
1. Explain performance assessment and describe its importance.
2. Evaluate strengths and weaknesses of performance assessment.
3. State objectives for performance assessment.
4. Construct performance assessment tasks.
5. Score performance assessment tasks.
3.3 Performance Assessment
Performance assessment is not a new idea in classroom setting rather it has been
used in classrooms for as long, as there have been classrooms (Airasian, 2001). Some
commonly used performance assessments in classrooms include reading, writing, using
various equipments, drawing figures, making sketch, etc. McMillan (2007) defined
performance assessment as a method of assessment based on teacher’s observation and
judgment about students’ demonstration of a skill or competency in creating a product,
constructing a response or making a presentation. In other words, performance
assessment requires students to carry out an activity or produce a product in order to
demonstrate their learning (Airasian, 2001).
Another related term Authentic Assessment concerns with the judgment of students’
ability to use knowledge in performing such tasks that are much similar to real life.
Authentic assessment is performance-based assessment but all performance assessments
are not authentic, because authenticity in terms of use of knowledge in real world is only
one of many characteristics of performance assessment (McMillan, 2007).
McMillan (2007) described following characteristics of performance assessment:
o Students perform, create, construct, produce or do something.
o Deep understanding and/or reasoning skills are needed and assessed.
o Involve sustained work, often days or weeks.
o Calls on students to explain, justify and defend.
o Involve engaging ideas of importance and substance.
o Relies on trained assessor’s judgments for scoring.
o Multiple criteria and standards are pre-specified and public.
o There is usually no single “correct” answer.

34
o If authentic, the performance is grounded in real-world contexts and constraints.
For detail see Airasian (2001), pp. 228-232 and McMillan (2007), pp. 229-230
3.4 Importance of Performance Assessment
Most of the learning involves some sort of skills that students should be able to
demonstrate after taking instructions. Most common examples are communication skills, i.e.,
reading, writing and speaking; psychomotor skills such as holding a pencil or brush, using
equipments, athletic activities; cognitive skills like creative thinking and problem solving.
Performance assessment helps in evaluating students’ ability to apply the learned
knowledge. Performance assessment is especially useful in subjects that emphasize
performances or products such as art, physical education, language teaching, etc. It is also
important in assessing affective behavior. Teacher’s assessment of a student’s behavior is
mostly based on the observation of student’s performance in a specific context.
Performance assessment is important in early childhood and special education
settings. Children in pre-school and lower grades need to learn communication skills as
well as social skills for adjusting in school settings. They are in the age when fine and
gross motor skills are in developmental phase. Such skills at this age can best be assessed
with the help of performance outcomes.
Special children with severe deficits in mental, emotional or psychomotor
development need to learn such skills that are helpful in their daily life. They learn these
skills through repetitions and assessment of these skills is based on the observation of
their performance.
For detail see Airasian (2001), pp. 231-234
3.5 Strength and Weaknesses of Performance Assessment
Performance assessments have following advantages:
1. Assessment and instructions are integrated; students learn during assessment and
chances of formative assessment are provided.
2. Performance assessment is more effective in evaluating higher cognitive skills and
psychomotor skills.
3. Active involvement of students provides learning opportunities as well as the
opportunities to show learning in different ways.
4. Teachers use multiple criteria for judging the performance that are shared with
students before assessment. In this way students learn self-assessment.
5. Performance assessment emphasizes on application of knowledge and encourages
re-examination of instructional goals.
Following limitations come across performance assessment:
1. Reliability: The subjective nature of scoring of performance assessment can cause
substantial measurement error that lowers the reliability of assessment results.
Moreover, inconsistency in students’ performance from time to time can lead to
inaccurate conclusions.

35
2. Sampling: As performance assessment takes a lot of time, a small sample of
students’ abilities and skills can be assessed. It is difficult to assess students’
capabilities in a larger domain on the basis of evaluation of few skills.
3. Time: It is time consuming for a teacher to construct good tasks, develop scoring
criteria, administer the task and then score the performance of students. It is also
time consuming for students to complete the assessment task. The restriction of
time obstructs the communication of students and teacher; therefore, students
cannot be given significant feedback for learning and making decisions.
For detail see McMillan (2007), pp. 230-232
Airasian (2001) has discussed the issues of validity and reliability of performance
assessment. See pp. 250-255
Activity Identify a teacher who is using performance assessment and find which characteristics
of performance assessment are present and what advantages could be obtained from
this assessment. Also identify
3.6 Stating Objectives for Performance Assessment
Performance assessment can be used for various purposes, e.g., grading, diagnosis,
active learning, etc. The purpose of performance assessment should be specified before
commencement of assessment process in order to set up proper performance criteria and
scoring procedure.
Performance assessments are primarily used for to assess learning objectives that
are related to high-level cognitive and psychomotor domains. The objectives of
performance assessment should be specified keeping in the view the type of skills to be
assessed.
1. Deep Understanding
The fundamental objective of performance assessment is to evaluate as well as
improve the understanding of pupils about learned knowledge. Pupils are required to use
knowledge and skills in order to show what they understand.
2. Reasoning
Students must use reasoning skills as they demonstrate their understanding during
performance assessment. The cognitive processes including analysis, synthesis,
prediction, critical thinking, generalizing, etc. must be used in performance assessment.
Such skills must be specified while stating the objectives of performance assessment.
3. Skills
Performance assessment is most suitable for evaluation of skills such as
communication and psychomotor skills.
Communication skills basically involve reading, writing, speaking and listening
skills. For effective performance assessment the objectives related to these areas must be

36
specified in accordance with age and grade level of students.
The objectives for assessing psychomotor skills are stated in two steps. The first
step includes the clear description of required physical actions. McMillan divided these
physical skills in five categories: fine motor, gross motor, complex, visual, and verbal
and auditory skills.
The second step involves the identification of the level of performance. The
classification of psychomotor domain (unit 2) can be used for stating these objectives for
performance assessment.
4. Products
Products are the completed works of students that are based on assessment
activities. While stating objectives for this kind of assessment, it is necessary to clearly
describe what students are required to produce at the end of the given task. All the
elements of the product should be made clear. The performance criteria and scoring
procedure must be mace clear.
For detail see McMillan (2007), pp. 233-238
Kubiszyn and Borich (2000) described how to state performance objectives in cognitive,
affective and social domains. Please see pp. 162-165
Also see article 3.1.2“Writing Performance Objectives” in Folder 3 on CD.
3.7 Constructing Performance Tasks
After identifying the purpose of performance assessment and clearly stating what
decision is to be made from performance assessment, the next step is to identify the
observable features of students’ performance that can be evaluated. McMillan (2007)
identified three steps in constructing a performance task: identifying performance task,
developing description and context of the task and writing specific questions or problems.
1. Identifying Performance Task
The performance task is what students are required to do in performance
assessment (McMillan, 2007). Different performance tasks can be constructed in
accordance with content area and age and grade levels. There are two types of
performance tasks regarding complexity of the task.
Restricted type tasks require brief response focusing on a specifically defined
skill. These tasks require little time for administration and scoring, and provide greater
reliability and sampling, however, much of the important characteristics of performance
assessment cannot be included in this type of performance tasks.
Extended type tasks are more complex, elaborated and time consuming and often
include joint work in small groups. Various sources of information are used in the tasks
and product is developed over a period of time consisting of several days or weeks.
Students can apply various skills and integrate different content areas during the task.
For detail see McMillan (2007), pp. 239-240
Linn and Gronlund (2000) pp. 261-266

37
2. Performance Task Description
Performance task description is in fact the planning of performance task that
includes the following (McMillan, 2007):
1. Content area and skills to be assessed.
2. Description of students’ activities.
3. Resources needed.
4. Teacher’s role.
5. Administrative process
6. Scoring procedure.
The performance task should be developed in the light of instruction given in the classroom.
Please see McMillan (2007), pp.241-242
Kubiszyn and Borich (2000), pp. 165-168
3. Performance Task Questions
Performance task questions or problems are written according to the task description. These
questions or problems state what students’ outcomes are required, what students are allowed to do,
and what will be the criteria of judging students’ performance. For constructing a good
performance task following suggestions should be kept in mind:
1. The performance task should integrate content, instruction and skills.
2. The task should be as realistic as possible.
3. The task should be structured to assess various objectives.
4. The task should be so structured that students can learn from it.
5. The task should be feasible regarding availability of resources, time and proper
opportunities for students.
6. The task should be so structured that more than one answer can be taken as correct.
7. The directions for the task should be clearly stated.
8. The task should be thought provoking and exciting.
9. Scoring criteria should be made clear in the task.
10. Limitations in task completion should be made clear.
For detail see McMillan (2007), pp. 242-248 and Linn and Gronlund (2000) pp. 267-270
Also see article 3.2.2 “Performance Assessment in Classroom” in Folder 2 on CD.
Activity Construct a performance task for a subject of your choice keeping in mind the given guidelines.
3.8 Performance Criteria
These are the specific characteristics of students’ performance that are used to demonstrate
the level of students’ achievement in a task. Performance criteria are established by breaking down
a general performance into more specific characteristics that are involved in it. For example, the
general performance of oral reading consists of specific characteristics such as clarity of voice,
correct pronunciation, clear phonetics, etc. These specific characteristics are the performance
criteria used in the judgment of performance. The performance criteria should be clear in teacher’s

38
mind and should also be made clear to students.
In order to identify useful and observable criteria following guidelines, suggested by
Airasian (2001), should be taken into consideration:
1. Before administering the assessment task, perform it yourself and identify the
important elements to be judged.
2. List the most important behaviors as performance criteria and exclude the irrelevant ones.
3. Keep the number of performance criteria limited so that all of them can be
observed during assessment.
4. Teachers should develop performance criteria through collaborative thinking.
5. Performance criteria should be described in terms of observable behavior of
students or characteristics of products.
6. The criteria should be stated in clear and un-ambiguous words.
7. The criteria should be arranged in the order in which they are expected to be observed.
8. If appropriate performance criteria are available, there is no need to develop new criteria.
For detail see Airasian (2001), pp. 239-241 and McMillan (2007), pp. 258-264
Also see article 3.3.2 “Assessment Criteria” in Folder 2 on CD.
Activity Identify performance criteria for your constructed performance task.
3.9 Scoring Performance tasks
Scoring of performance assessment is like scoring essay questions. It can be
holistic or analytic. Holistic scoring is useful when the purpose of assessment is more
generalized like placement, selection or grading. For assessing more specific
characteristics of students’ performance or for diagnosing their difficulties, analytic
scoring is appropriate. Different techniques can be used for scoring pupils’ performance.
In previous chapter we have discussed these techniques for assessing affective behavior
(unit 10) and for scoring essay items (unit 4).
1. Anecdotal Records
It is a written record of important measures and students’ behavior during
performance assessment as observed by the teacher. Only those aspects of performance
are recorded which help in decision making and cannot be evaluated by any other means.
2. Checklists
It is a list of performance criteria used to judge the performance or product of students.
The observed criterion is marked positively while the un-existing criterion is marked negatively.
3. Rating Scales
Rating scale is used to judge a criterion at different qualitative levels of
performance. It indicates the degree to which a criterion exists. The commonly used types
of rating scales include numerical, graphical and descriptive rating scales.

39
4. Scoring Rubrics
A scoring rubric is an elaborated form of rating scale. It is a descriptive guide to
evaluate students’ performance at various levels according to the criteria. Rubrics are
developed to specify the essential aspects of performance to be assessed and to make
criterion-referenced interpretation. These rubrics help teachers to make clear judgments
and inform students about their strengths and weaknesses.
For detail see: McMillan (2007), pp. 249-264
Airasian (2001), pp. 243-250
Kubiszyn and Borich (2000), pp. 168-175
Linn and Gronlund (2000), pp. 270-286
Self Assessment Questions
1. What are the key characteristics of performance assessment? What advantages can
be obtained by this type of assessment and what are its limitations?
2. What are the important steps in constructing a good performance task?
3. What is the importance of performance criteria in performance assessment? How
do they help in planning, constructing and evaluating performance tasks?
4. For what types of performance tasks rating scales, checklists or rubrics are appropriate?
5. How scoring performance assessment is similar to scoring essay questions?
3.11 Suggested Readings
1. Airasian, P. W. (2001), Classroom Assessment: Concepts and Applications,
Boston: McGraw Hill.
2. McMillan, J. H. (2007), Classroom Assessment: Principles and Practice for
effective Standard Based Instructions, Boston: Pearson Education, Inc.
3. Kubiszyn, T. and Borich, G. (2000), Educational Testing and Measurement:
Classroom Application and Practice, (6th Ed), New York: John Wiley & Sons.
4. Linn, R. L. and Gronlund, N. E. (2000), Measurement and Assessment in
Teaching, (8th Ed), New Jersey: Prentice Hall.
List of Websites
1. Wenning C. J. (nd), Writing Inquiry-Oriented Student Performance Objectives
Assignment, Retrieved March 25, 2008 from
http://www.phy.ilstu.edu/pte/310content/objectives/stperfobjectives.html
2. Brualdi, A. (1998). Implementing performance assessment in the classroom,
Practical Assessment, Research & Evaluation, 6(2). Retrieved May 27, 2007 from
http://PAREonline.net/getvn.asp?v=6&n=2
3. Assessment Criteria, Retrieved March 25, 2008 from
http://www.iml.uts.edu.au/assessment/criteria/index.html

40

41
Unit–4
Assessing Students’ Progress
during Instruction
Written by:
Prof. Dr. Rehana Masrur

42

43
CONTENTS
4.1 Introduction ........................................................................................................45
4.2 Objectives ..........................................................................................................45
4.3 Formative Assessment .......................................................................................46
4.4 Informal Observation .........................................................................................46
1. Non-verbal Behavior ................................................................................46
2 Vocal Cues ...............................................................................................47
4.5 Oral Questioning ................................................................................................47
1. Purpose of Questioning ............................................................................47
2. Types of Questions ...................................................................................48
3. Guidelines for Effective Questioning .......................................................48
4.6 More Assessment Strategies ..............................................................................49
1. Homework ................................................................................................49
2. In-class Assignments ................................................................................49
3. Quiz ..........................................................................................................49
4.7 Effective Feedback ............................................................................................49
4.8 Effective Praise ..................................................................................................50
4.9 Self Assessment Questions ................................................................................50
4.10 Additional Readings ..........................................................................................50
4.11 Web Based Material ...........................................................................................51

44

45
4.1 Introduction
Though teachers plan the lesson before starting instruction, it is hardly ever
possible to carry out instructions in the planned way. Teachers have to make on-the-spot
decisions about instructional process by continuously assessing students behavior and
progress during instructions. A teacher should be aware of the classroom environment
and able to perceive any cues requiring making appropriate changes in the instructional
process. Assessment of students’ behavior, facial expressions, answers to questions,
attention and their reaction to instructions provide cues for making desirable changes in
the planned instructions. In the teaching process instruction, assessment and decision
making is a continuous cycling process. After starting instructions the teacher makes
assessment in the light of cues provided by the class and makes decisions about
continuing the instructions or making any changes. In this unit we will discuss
importance of assessment for effective teaching and how to make effective assessment
during instruction.
4.2 Objectives
After completing this unit, you will be able to:
1. Explain formative assessment.
2. Describe different sources of informal observation.
3. Explain students’ behavior on the basis of informal observation.
4. Describe the use and importance of oral questioning in assessment.
5. Use effective oral questions during instruction.
6. Evaluate important formative assessment strategies.
7. Provide effective feedback to students.
4.3 Formative Assessment
In unit 1 you have been introduced with formative assessment as the feedback provided
by the constant assessment of students’ learning and behavior during instructions. This feedback
helps teachers in improving teaching learning activities. Such information can be obtained by
formal as well as informal methods. The main purpose of formative assessment is to improve
students’ interest, motivation and learning, therefore, teachers have to make continuous
evaluation of students’ behavior and learning and make appropriate changes in instructional
procedures. Change in instruction is an essential outcome of formative assessment. The
assessment which is not used for making appropriate changes is not formative assessment but a
short assessment (McMillan, 2007). For example, if a teacher gives weakly tests or assignments
to students but does not use the feedback provided by the results for improving instructions, this
is not formative assessment. However, if the teacher uses this information for analyzing
students’ problems and needs and tailor instructional activities accordingly, it is formative
assessment.
Boston (2002) has described purpose and benefits of formative assessment. See 4.1.2
article ‘The Concept of Formative Assessment’ in Folder 13 on CD.

46
4.4 Informal Observation
Most of the decisions made by teachers during instructions are based on informal
observation. Teachers use these observations for assessing students’ interest,
understanding, participation in class and responses to questions, and then making on-the-
spot decisions about students’ problems, learning activities, making changes in
instructions and improving classroom environment. Informal observations differ from
formal observations in following ways:
1. Informal observations are not planned or structured rather these are carried out in
natural settings.
2. Informal observations are limited by teachers’ particular perception and each
student’s particular behavior in a particular perspective.
3. Informal observations tend to be subjective because they can be interpreted
differently by different observers.
4. Informal observation is descriptive or qualitative not numerical or quantitative.
5. Informal observations are often unrecorded.
Major sources of informal observations are students’ non-verbal behavior and vocal
cues that provide information about students’ physical, mental and emotional conditions.
1. Non-verbal Behavior
Non-verbal behavior can be observed through facial expression, body language, gesture
and eye contact. These non-verbal cues help the teacher to assess emotions and feelings. Non-
verbal cues are sometimes more important than verbal expressions, especially, when there is
disagreement in non-verbal message and the verbal expression. We will briefly discuss what
information teachers can get from some specific non-verbal behaviors.
Facial Expressions
Most of the non-verbal messages are conveyed through facial expressions. Different parts
of face are used in expressing different types of emotions and feelings. For example, the upper
part, i.e. eyes and forehead, express the feelings of anxiety and irritation; and the lower part mainly
mouth conveys pleasure and delight. Teachers use the information provided by facial expression
to assess students’ interest, understanding and motivation.
The nature of eye contact is another useful source of non-verbal communication. Direct
eye contact or averted eyes often convey clear messages about students’ feelings.
Body Language
Body movements and postures not only express feelings but can also substitute simple
verbal messages. Different physical signs express different feelings and communicate non-verbal
messages. Emblems are the physical indications that substitute for a simple verbal message, for
example, putting finger on lips means ‘keep quiet’. Illustrators increase the clarity of verbal
message and also indicate emotions associated with the message, for example, clenched fists
indicates anger. Affect display expresses emotions and feelings through position and posture of
body, for example, tense and slumped body indicates negative emotional state while open and

47
relaxed body indicates positive emotional state. Regulators are used to indicate different
expressions during verbal communication, for example, cues for starting or ending a statement are
provided by leaning forward or raising shoulders respectively. Adapters provide information about
affective states like attitude, confidence, nervousness, etc. For example, nail chewing shows
anxiety and nervousness.
Gestures
Hand and arms movements often add to the meaning of verbal message. Sometimes
these gestures convey the complete message without verbal expression. Young children
often use gestures to express their understanding that cannot be expressed through
language, for example, they point towards something instead of naming it. By carefully
observing gestures, teachers can get useful information about student’s understanding.
2. Vocal Cues
Different aspects of voice such as tone, loudness, intensity, pauses, emphases, etc.
provide information about students’ level of understanding, confidence, interest,
motivation and other emotional states. For example, a loud, fluent and clear speech
indicates confidence and competency while low voice with frequent pauses expresses
lack of understanding (McMillan, 2007). However, it is not appropriate to make decisions
on the basis of vocal cues only. In order to make accurate assessment other evidences
should also be taken into consideration.
For detail see McMillan (2007), pp. 119-127
Also see article 4.2.2‘Nonverbal Communications’ in Folder 4 on CD.
Activity Observe the non-verbal behavior of your students and make notes. Ask an observer to
make informal observations in your class and make notes about non-verbal behavior of
your students. Compare these notes with those made by you.
4.5 Oral Questioning
Teachers often ask questions to assess students’ learning and understanding during
instruction. It is an important and useful source of getting information that can be helpful
for teachers in improving their instructional activities.
1. Purpose of Questioning
Oral questioning during instruction serves many purposes. It is an effective way to
keep students actively involved in the instructional activities. Oral questions help in
developing students thinking and reasoning skills as they try to judge their answers,
organize their thoughts and communicate their ideas. Students also learn and clarify their
concepts by listening other students’ responses.
Teachers also use questions to highlight and refresh important concepts. Questions
also provide clues for students that what and how should they learn; and also help in self
assessment. Questioning often proves to be helpful in keeping classroom environment

48
peaceful and controlling students’ behavior. As questioning keeps students attentive and
engaged, there are minimum chances of inappropriate behavior.
An important purpose of questioning is to obtain information about students’
learning and understanding in the class. Students’ responses to the questions along with
informal observation reveal the clear picture of students’ progress during instructions.
For detail see: Airasian (2001), pp. 135-136 and McMillan (2007), pp. 129-130
2. Types of Questions
Teachers ask different types of questions. Some questions demand lower level
cognitive processes such as memorization or recall; these are called convergent
questions and have one correct answer. These questions start with words like what, how,
when, etc. Other questions require higher cognitive skills like analysis and reasoning;
these are called divergent questions and have more than one correct answer. These
questions start with words like explain, distinguish, compare, contrast, etc.
These types of questions can further be divided into different types according to their use
and structure, for example, open-ended, diagnostic, extension, information, etc. Questions
should be used according to the demands of instructional process and learning objectives.
For detail see: Airasian (2001), pp. 136-138
3. Guidelines for Effective Questioning
In order to get useful and accurate information about students’ learning and
understanding during instruction, following points should be kept in mind:
1. The statement of questions should be clear, unambiguous and understandable for
students.
2. Questions should be related to the learning objectives.
3. All students should be made involved in questioning.
4. Uniform patterns of questioning should be avoided. For example, asking questions
from brilliant students only or from dull students only.
5. Sufficient time should be given to students for organizing their responses.
6. Appropriate and effective feedback should be provided to students about their responses.
7. Follow up question should be asked for developing reasoning and thinking skills,
for example, why do you think so? Give another example, etc.
8. Questions with yes/no answer should be avoided.
9. Questions should be in an appropriate sequence, i.e., starting from simple
knowledge questions and moving to higher level questions.
10. General questions should be avoided, for example, do you all understand?
For detail see: Airasian (2001), pp. 138-139 and McMillan (2007), pp. 130-135
Also see article 4.3.2“Classroom Questions” in Folder 4 on CD.
Activity Observe a teacher in a class, note what type of questions he/she asks and compare
these questions with suggestions for effective questioning.

49
4.6 More Assessment Strategies
There are other assessment strategies that teachers use for getting information
about students’ learning and progress. Homework, in-class assignments and quizzes are
useful sources of such information. These strategies provide opportunities for students to
show their understanding as well as to apply their knowledge and skills.
1. Homework
Homework is mainly used to provide extra practice in applying knowledge and
skills (McMillan, 2007). Homework also provides useful information about students’
learning and performance. It can be used as diagnostic technique to find out students’
problems and instructional weaknesses.
Despite being an important strategy, some limitations minimize the benefits of
homework, for example, some students have assistance at home while others have to
work on their own. In order to get maximum benefits from homework, it is necessary to
provide appropriate feedback to students and make necessary changes in instructions.
2. In-class Assignments
In-class assignments provide useful information about students learning and
understanding. Teachers can use this assessment strategy to infer more accurately about
students’ knowledge, understanding and skills. These assignments may be given as
individual tasks or as group activities. In order to get useful information from in-class
assignments, teachers should be actively involved with students’ activities, monitor them
and provide frequent feedback.
3. Quiz
For assessing students’ learning and progress during instructions, quizzes are used generally
in the form of objective type tests. Quizzes provide information about students’ current status of
learning and help teachers in making appropriate changes in instructional activities.
Read article 4.4.2 on ‘Classroom Assessment Techniques’ in Folder 4 on CD.
4.7 Effective Feedback
An important aspect of assessment is providing feedback to students. It is not
possible for students to improve their performance unless they know their mistakes and
weaknesses. Therefore, providing effective feedback is essential for improving students’
learning and understanding. Effective feedback has following characteristics:
1. Feedback should be provided by comparing performance to a specific standard.
2. Feedback should be provided by relating performance with learning approach or
learning strategies.
3. Feedback should be provided in the context of previous and expected performance.
4. Feedback should include suggestions for corrections and improvements.
5. Feedback should be provided instantly after assessment.
6. Feedback should be specific, meaningful and explanatory.

50
7. Feedback should be focused on important points.
8. Feedback should be provided about students’ efforts for successful performance.
For detail see McMillan (2007), pp. 139-141
Activity Ask a group of students what kind of feedback they get from teachers and how it
affects them.
4.8 Effective Praise
Praise is also considered to be a form of feedback. Effective praise conveys
teacher’s spontaneous and sincere responses to students’ performance. It includes a
specific description of the skill or behavior being admired as well as the recognition and
appreciation of student’s effort. Verbal praise should be consistent with non-verbal
behavior because students can quickly understand teachers’ non-verbal messages.
Research shows that praise enhances positive performance. An encouraging feedback
from teacher gives far better results of students’ performance than do criticism or
unconcerned attitude.
McMillan (2007) has pointed out Do’s and Don’ts of effective praise. See table 5.5 on
page 143.
Also see article 4.5.2“Praise Vs Criticism” in Folder 4 on CD.
Self-Assessment Questions
1. Explain the importance of formative assessment in effective teaching.
2. In what ways informal observation of students help teachers in assessment?
3. What are the purposes of oral questioning? How can teachers make questioning
effective?
4. Oral questions asked in the class should match learning objectives. Give reasons.
5. How can teachers use homework, in-class assignments and quizzes as effective
assessment strategies during instructions?
6. How can effective feedback help students improve their performance?
Additional Readings
1. Airasian, P. W. (2001), Classroom Assessment: Concepts and Applications,
Boston: McGraw Hill.
2. McMillan, J. H. (2007), Classroom Assessment: Principles and Practice for
effective Standard Based Instructions, Boston: Pearson Education, Inc.

51
Web-based Material
1. Boston, Carol (2002). The concept of formative assessment. Practical Assessment,
Research & Evaluation, 8(9). Retrieved May 14, 2008 from
http://PAREonline.net/getvn.asp?v=8&n=9
2. Nonverbal Communication, Retrieved May 14, 2008 from
http://www.blatner.com/adam/level2/nverb1.htm
3. Brualdi, A. C. (1998). Classroom questions. Practical Assessment, Research &
Evaluation, 6(6). Retrieved May 27, 2007 from
http://PAREonline.net/getvn.asp?v=6&n=6
4. Classroom Assessment Techniques, Retrieved May 14, 2008 from
http://oct.sfsu.edu/assessment/effectiveness/htmls/during_stud.html
5. Praise Vs Criticism, Retrieved May 14, 2008 from
http://www.buzzle.com/editorials/2-14-2006-88940.asp

52

53
Unit–5
Portfolios
Written by:
Prof. Dr. Rehana Masrur

54

55
CONTENTS
5.1 Introduction ........................................................................................................57
5.2 Objectives ..........................................................................................................57
5.3 Portfolios ............................................................................................................57
5.4 Types of Portfolios .............................................................................................58
5.5 Strengths and Weaknesses of Portfolios ............................................................58
5.6 Planning Portfolios ............................................................................................59
1. The Purpose of Portfolios ........................................................................59
2. The Performance Criteria .........................................................................59
3. The Structure and Organization of Portfolios ..........................................59
4. Scoring Criteria ........................................................................................59
5.7 Implementation of Portfolio Assessment ...........................................................60
1. Discussion with Students .........................................................................60
2. Selection of Contents ...............................................................................60
3. Maintenance and Use ...............................................................................60
4. Evaluation ................................................................................................61
5 Feedback ..................................................................................................61
5.8 Self Assessment Questions ................................................................................61
5.9 Additional Readings ..........................................................................................61
5.10 Web-Based Material ..........................................................................................62

56

57
5.1 Introduction
Portfolio is an emerging concept in classroom assessment that is primarily
associated with performance assessment. Portfolios are not just piles of students’ work
examples rather these are systematically collected student products that show their
progress towards achieving learning objectives (McMillan, 2007). Portfolios contain
samples of students work that show their development and progress over time. Portfolios
not only help teachers in assessing students’ progress but also provide opportunity for
students to evaluate their progress in the context of time and self improvement. In this
unit we will discuss characteristics of effective portfolios, their strengths and weaknesses,
and development of portfolios.
5.2 Objectives
After completing this unit you will be able to:
1. Define and explain portfolios.
2. Explain strengths and weaknesses of portfolios.
3. Develop effective portfolios.
4. Evaluate portfolios.
5. Effectively use portfolio assessment.
5.3 Portfolios
Portfolios are collections of students’ work that show their progress and performance
over a period of time. McMillan (2007) has defined portfolios as “purposeful, systematic
process of collecting and evaluating students’ products” that is used to keep record of students’
progress towards achieving learning objectives. These are not haphazard collection of students’
works; rather, these are systematically collected and evaluated pieces of work that depict the
accomplishment of certain instructional objectives.
Johnson, Mims-cox and Doyle-Nichols (2006) assert that portfolios are powerful
ways of assessing a student’s development and his/her ability to apply the learned
knowledge. Portfolios provide better information about students’ experiences during
instructional process than do test scores or other assessment sources as they provide
concrete examples of students’ learning and understanding.
Portfolios play a part in educational settings in many ways, for example, examining
students’ accomplishments during a time period, establishing correctness and suitability
of instructional program, being a source of diagnostic information, providing opportunity
of self assessment, etc. A portfolio may contain different examples of performance in one
area or it may contain samples of performances in more than one area.
Portfolios can be used for formative as well as summative assessment. Moreover,
portfolios can be helpful in making administrative decisions such as promotion or
retention of a student in a grade, sending students to special programs, admission in a
program, etc. Portfolios provide opportunity of cooperative learning through joint tasks
and peer reviews. As portfolios are developed over time, they demonstrate students’
development in learning and can provide diagnostic information. This information can be

58
used by teachers for improving their instructional strategies.
For detail see: McMillan (2007), pp. 269-270 and Airasian (2001), pp. 272-275
Also see article “Portfolio Assessment” in Folder 5 on CD.
5.4 Types of Portfolios
There are different types of portfolios according to their purpose of use. Showcase or
celebration portfolios contain samples of the best work selected by students. Documentation or
working portfolios include informative material as well as assessment records. Growth
portfolios illustrate progress of students over time. Evaluation portfolios are used for assessing
students’ learning. Academic portfolios are used for assessment and evaluation of students.
Career advancement portfolios provide information about professional advancement. Learning
and teaching portfolios promote students’ reflection on learning and learning process.
Presentation portfolios contain sample of best work for presentation to an audience. Each type
of portfolios has a specific purpose, distinctive characteristics and appropriate use.
Johnson, Mims-cox and Doyle-Nichols (2006) have provided a brief account of different
types of portfolios, their features, purposes and uses in a table. See pages 6-7.
5.5 Strengths and Weaknesses of Portfolios
Portfolios can offer following benefits:
1. Students are involved in assessment process and have chances of self assessment.
2. Peer review of portfolios promotes learning and understanding.
3. Continuous evaluation of students’ performance helps improving instructions.
4. Portfolio assessment focuses on self improvement rather than comparison with others.
5. Portfolio assessment enhances students’ motivation as they find out a relationship
between effort and achievement.
6. Individualized assessment process help accommodate individual differences.
7. Flexibility of portfolio offers opportunity to use portfolio according to instructional
requirements and students’ needs.
There are some limitations in the use of portfolio assessment:
1. Scoring portfolio is a difficult and time consuming task. Inconsistent scoring
results in low reliability.
2. Proper teacher training is needed for effective use of portfolio assessment.
3. Portfolio assessment demands considerable time, sources and efforts.
4. Samples of work selected by students may be inappropriate for the purpose of portfolios.
5. Reporting portfolio assessment to parents is not easy as parents may find difficulty
in understanding portfolios.
6. Generalizations made by portfolio assessment are limited.
For detail see: McMillan (2007), pp. 271-273 and Linn and Gronlund (2000), pp. 308-310
Also see article “Use of Portfolios in Evaluation” in Folder 5 on CD.

59
5.6 Planning Portfolios
As defined above, portfolios are systematic collection of students’ work; therefore,
planning of portfolios should be systematically organized. The major elements in the
planning of portfolios include the purpose of portfolio, the performance criteria, the
structure and organization of portfolio, and the scoring criteria.
1. The Purpose of Portfolios
All the elements in planning portfolios depend on the purpose of portfolios. Before
starting the planning of portfolios, teachers should have a clear idea about what would be
the use of portfolios and what type of learning objectives would be evaluated on the basis
of portfolio assessment. Portfolios can be used for a number of purposes as is obvious
from the variety of their types. For example, portfolios can be used for assessment
purposes, facilitating learning process, presenting outstanding performances, making
employment decisions, etc.
The contents, structure, presentation style and scoring of portfolios subject to their
purpose. Therefore, it is essential to determine a clear purpose for portfolio assessment so
that further planning could be carried out accordingly.
For detail see Linn and Gronlund (2000), pp. 310-314
2. The Performance Criteria
Another essential element in portfolio planning is the identification of performance
criteria. For a consistent and reliable assessment, appropriate performance criteria should
be selected according to the purpose and type of the portfolio. Performance criteria
should be related to learning objectives as well as to the instructions provided in the class.
Involvement of students in identifying criteria helps them in the selection of work pieces
for entering in portfolios.
3. The Structure and Organization of Portfolios
The next step in planning portfolios is the decision about the physical structure and
contents of portfolios. The nature of container or folder in which portfolios have to be
compiled, a proper and easily accessible place for storing portfolios, the type of contents
to be included in the portfolios, the responsibility of selecting contents and the order of
arrangement of the contents are some important decisions to be made at this stage.
4. Scoring Criteria
Before putting into practice the portfolio assessment, it is important to determine
the scoring criteria for evaluating students’ performance as well as for providing a
guideline for students’ self appraisal. These guidelines and criteria should be explained to
students before they start their work. Students can be involved in the development of
criteria, however, the basic tasks of preparing and explaining scoring criteria is
accomplished by the teacher.
Portfolios can be scored by using scoring techniques such as checklists, rating
scales and rubrics. Different types of portfolios require different types of scoring

60
techniques. It is not only teacher that can assess portfolios, students can also be allowed
to self evaluate their work.
For detail see: McMillan (2007), pp. 274-279
Airasian (2001), pp. 275-282
Kubiszyn and Borich (2000), pp. 183-199
Also see article “Portfolios” in Folder 5 on CD.
Activity Plan a portfolio assignment for students. Clearly determine all the four aspects of
portfolio planning. Present it to your tutor for evaluation.
5.7 Implementation of Portfolio Assessment
Like planning of portfolio, its implementation also entail some systematic steps starting
from explaining portfolio assessment to students to finally evaluating students’ portfolios.
1. Discussion with Students
Before the commencement of portfolio assessment, it is mandatory to explain its
nature and procedures to students. Students should clearly understand what they have to
do in the light of learning objectives. Students should be explained the importance of
portfolios as well as their responsibilities in the whole process of portfolio assessment.
2. Selection of Contents
The involvement of students in selection of portfolio contents makes portfolio
assessment more meaningful. However, it is not appropriate to let students alone select
any samples of work rather teachers should provide clear guidelines for the selection of
portfolio contents. These guidelines should include the nature of work, number of
samples to be included, order of arrangement, labeling style and the time frame for
completion of portfolios.
3. Maintenance and Use
An important aspect portfolio implementation is its proper maintenance and
appropriate use. The folder of portfolios should be selected keeping in view the place
where they have to be stored. The storing place should be safe and easily accessible. The
system of adding or removing items from the portfolio should be set up.
Portfolios are used in the light of the purpose for which they are introduced. The
use of portfolios should also be clearly decided and explained to students. Who can have
access to portfolios? In what ways portfolios can be used? What type of decisions can be
made on the basis of portfolio assessment? Such questions should be clarified and the
rules should be followed strictly.
See articles ‘Student Portfolios Administrative Use’ and ‘Student Portfolios Classroom
Use’ in Folder 5 on CD.

61
4. Evaluation
Portfolio evaluation includes both student self-evaluation and teacher evaluation.
Student self-evaluation is effective only when clear guidelines have been specified
regarding the purpose of portfolios, natures of entries and scoring criteria. Peer evaluation
can also be helpful for students when they start self-evaluation. Parents’ comments can
also be included in evaluation of portfolios.
Teacher evaluation of portfolios is a formal and systematic procedure. Teachers
can use checklists to confirm that the portfolio contents are complete and well organized.
The individual entries should be evaluated in the light of scoring criteria by the use of
scoring rubrics; and the entire portfolio should be evaluated in the light of learning
objectives.
5. Feedback
Finally teachers should provide useful feedback through individual meetings with
students. Students should be explained what they have done well and where improvement
is required. In the light of these meetings teacher should make a strategy for future.
Portfolios also prove to be a good approach for providing feedback to parents about
their children’s knowledge and skills. Moreover, parents remain aware of the activities
the children carry out in the school.
For detail see: McMillan (2007), pp. 279-290 and Linn and Gronlund (2000), pp. 315-329.
5.8 Self-Assessment Questions
1. How does portfolio assessment differ from common paper and pencil tests?
2. What advantages can be obtained through portfolio assessment and how can its
limitations be minimized?
3. What should be the role of students in developing and evaluating portfolios?
4. What are the important points to be remembered while planning and implementing
portfolio assessment?
5. How should portfolios be linked to instructions?
5.9 Additional Readings
1. Airasian, P. W. (2001), Classroom Assessment: Concepts and Applications,
Boston: McGraw Hill.
2. Johnson, R. S., Mims-Cox, J. S. and Doyle-Nichols, A. (2006), Developing
Portfolios in Education: A Guide to reflection, inquiry and assessment, Thousand
Oaks: SAGE Publications.
3. McMillan, J. H. (2007), Classroom Assessment: Principles and Practice for
effective Standard Based Instructions, Boston: Pearson Education, Inc.
4. Kubiszyn, T. and Borich, G. (2000), Educational Testing and Measurement:
Classroom Application and Practice, (6th Ed), New York: John Wiley & Sons.
5. Linn, R. L. and Gronlund, N. E. (2000), Measurement and Assessment in
Teaching, (8th Ed), New Jersey: Prentice Hall.

62
5.10 Web-Based Material
1. Portfolio Assessment, Retrieved May 20, 2008 from
http://www.eduplace.com/rdg/res/literacy/assess6.html
2. Use of Portfolio in Evaluation, Retrieved May 20, 2008 from
http://ag.arizona.edu/fcs/cyfernet/cyfar/Portfo~3.htm
3. Portfolio, Retrieved May 20, 2008 from http://www.pgcps.org/~elc/portfolio1.html
4. Student Portfolios Administrative Use, Retrieved June 12, 2008 from
http://www.ed.gov/pubs/OR/ConsumerGuides/admuses.html
5. Student Portfolios Classroom Use, Retrieved June 12, 2008 from
http://www.ed.gov/pubs/OR/ConsumerGuides/classuse.html

63
Unit–6
Measures of Central Trendency
Written by:
Prof. Dr. Rehana Masrur

64

65
CONTENTS
6.1 Introduction ........................................................................................................67
6.2 Objectives ..........................................................................................................67
6.3 Basic Concepts in Statistics ...............................................................................67
6.4 Frequency Distribution ......................................................................................68
6.5 Measures of Central Tendency ..........................................................................70
1. Mean ........................................................................................................70
2. Median .....................................................................................................73
3. Mode ........................................................................................................74

66

67
6.1 Introduction
Teachers often have to deal with large number of scores and summarize them to
describe the generalization made on the basis of these scores. Descriptive statistics depict
the important attributes of a set of scores and provide sufficient information for
understanding the sense of these scores. In social sciences like education and psychology,
which deal with human nature, descriptive statistics help in describing both qualitative
and quantitative statements with maximum accuracy. Statistics are important because
they enable us to have the most exact description of any behavioral phenomenon. They
force us to be definite and exact in our procedures and thinking. In the field of research
we cannot proceed without statistics. Our ability to draw conclusions depends on
statistical information. Moreover, we can make predictions on the basis of available
statistical data. To keep our interest alive in research we need to have necessary
knowledge of statistical skills. In this unit we will discuss some important statistical
terms and measures, and their use in educational settings.
6.2 Objectives
After completing this unit, you will be able to:
1. Explain some basic concepts in statistics.
2. Arrange data in simple and grouped frequency distribution.
3. Compute mean from raw scores and grouped data.
4. Compute median from raw scores and grouped data.
5. Compute mode from raw scores and grouped data.
6. Apply measures of central tendency in educational measurement.
Basic Concepts in Statistics
1. Statistics is a branch of mathematics dealing with continuous and discrete data.
2. Data represent the numerical details in records and reports.
3. Variable is an object or event that can have different values. For example, test
results of students have different values, or subjects selected by college students
have different values, i.e. Geography, Physics, etc.
4. Frequency is the number of objects or events in a category or class interval.
5. Classification is discrimination among different objects, events or happenings.
6. Percentage is a mathematical concept denoting relationship with 100.
7. Proportion is a part or fraction of 1. A proportion is 1/100 of a percentage and a
percentage is 100 times of proportion.
8. Probability is the possibility of occurrences of some event.
9. Ratios are important index numbers, and describe rates and relationships. The IQ is
an index number denoting the rate of general mental growth─ the ratio of mental
age with chronological age.
10. Symmetric Distributions have equal spread on both sides of the center. A
symmetric distribution is also referred to as a normal distribution.

68
11. Skewness is the degree of asymmetry in a distribution. Asymmetry is caused by
extreme scores in a distribution.
12. Positively Skewed distribution has accumulation of low scores at left side. In
positively skewed distribution mean is greater than median.
13. Negatively skewed distribution has accumulation of high scores at right side. In
positively skewed distribution mean is smaller than median
For more terms see “Statistical Terms” in Folder 6 on CD.
Also find more definitions of statistical terms on internet through article 6.2 “Internet
Glossary of Statistical Terms” in Folder 6 on CD.
6.4 Frequency Distribution
The systematic arrangement of raw data by grouping them in classes is called
frequency distribution. In simple frequency distribution the scores are arranged in
descending order and the number of students having each score is indicated opposite to
the score. In grouped frequency distribution the scores are arranged into class intervals.
For clarifying the concept we take the example of raw scores of 20 students in a test. The
scores are 20, 20, 21, 25, 26, 26, 27, 28, 28, 29, 30, 30, 32, 35, 37, 37, 38, 38, 39, and 40.
The simple frequency distribution is given in table 1.
Table 1: Simple Frequency Distribution
For grouped frequency distribution, first we will find the range by subtracting the
lowest score from the highest score. The range in this example is 40-20= 20. For
facilitating further calculations the range is divided into classes. Distributing the range in
7 classes we get class interval 20/7= 3. Now the grouped data is called frequency
distribution (Table 2).

69
Table 2: Grouped Frequency Distribution
Our further computation will be based on this distribution. Statisticians prefer to
have classes between 10 and 20. If the number is higher the calculations become a bit
difficult and if the number is smaller than 10, it will be more open to error. Decision
regarding the length of an interval is always arbitrary, but it should not be higher than 10
in common distributions of 200-300 scores.
Frequency distribution can be represented graphically either in the form of line
graph called frequency polygon or in the form of bar graph called histogram. The above
distribution is shown as polygon and histogram in figure 6.1 and 6.2.
Figure 6.1: Frequency Polygon
0
1
2
3
4
5
6
20-22 23-25 26-28 29-31 32-34 35-37 38-40
Scores
Fre
qu
en
cie
s

70
Figure 6.2: Histogram
0
1
2
3
4
5
6
20-22 23-25 26-28 29-31 32-34 35-37 38-40
Scores
Fre
qu
en
cie
s
For detail see: Garrett (1967), pp. 1-23
Minium, King and Bear (1993), p. 27-38
Also see article 6.3 “Frequency Distribution” in Folder 6 on CD.
6.5 Measures of Central Tendency
An estimate of the midpoint of a distribution of values is called the central tendency of a
distribution. The major types of estimates of central tendency are:
Mean
Median
Mode
1. Mean
The most frequently used measure of central tendency is mean that is calculated by
dividing the sum of measurements with the number of measurements. Mean is a good indicator
of the values of a group only when distribution is symmetrical. When the distribution is skewed
either towards left or right the mean will not be indicating the exact natures of scores or values.
In a severely skewed distribution, mean is always misleading.
Mean of raw scores is calculated with the help of following formula:
Where:
M = Mean; Σ = Sum of; X = Scores; N = Number of scores

71
For example the mean of scores given in the above example will be:
20+ 20+ 21+ 25+ 26+ 26+ 27+ 28+ 28+ 29+ 30+ 30+ 32+ 35+ 37+ 37+ 38+ 38+ 39+ 40
= 606
M= 606/20 = 30.3
For computing mean from the grouped data, the mid point of each interval is
multiplied by frequency and the sum of all these values is divided by the number of
scores. Taking example of above grouped data the mean can be calculated as follows:
Table 3:
There is very small difference in the means computed from the raw data and the
grouped data. This difference can be attributed to the error in grouping. Another method
of computing the mean involves the assumed mean which is the mid point of the interval
with highest frequency. Taking again the above data we calculate mean with assume
mean method:
Table 4:
Sometimes we have scores of the same test taken by two or more samples and we
need to compute the combined mean. For example, on a test the mean score of one
group of 20 students is 62 while that of the other group of 50 students is 66. We can find
the combined mean by applying the following formula:

72
Sometimes we have scores of the same test taken by two or more samples and we
need to compute the combined mean. For example, on a test the mean score of one
group of 20 students is 62 while that of the other group of 50 students is 66. We can find
the combined mean by applying the following formula:
Where n represents the number of groups.
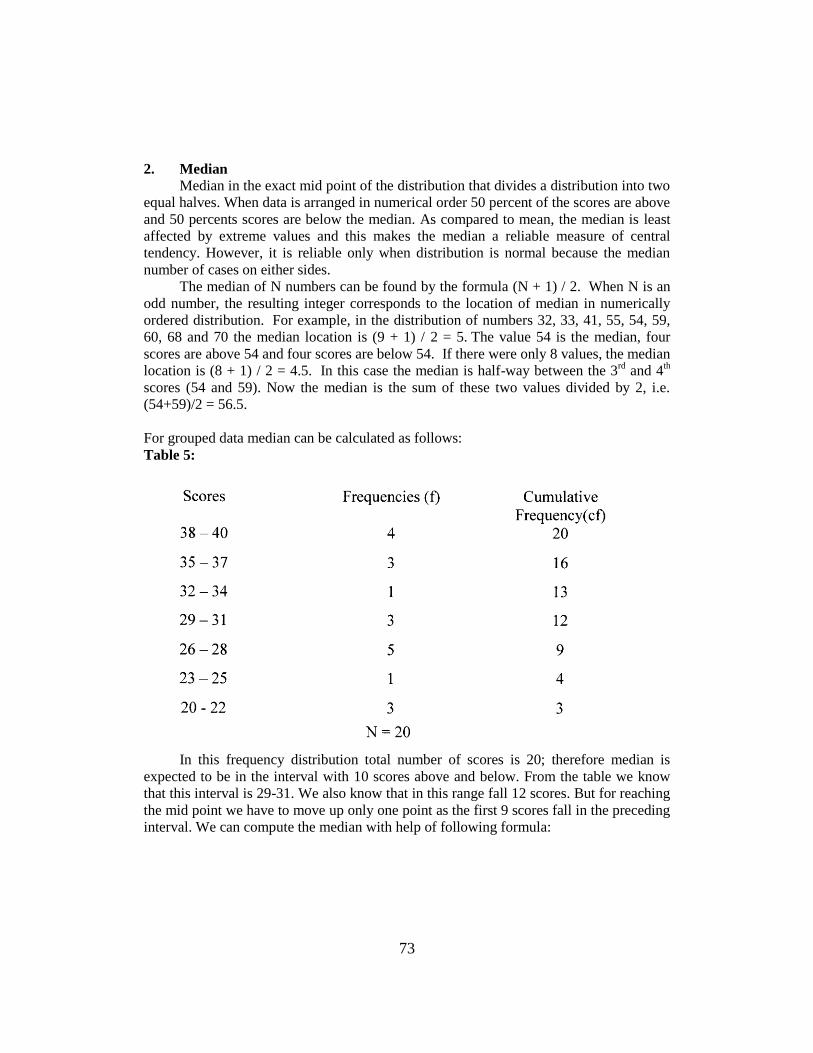
73
2. Median
Median in the exact mid point of the distribution that divides a distribution into two
equal halves. When data is arranged in numerical order 50 percent of the scores are above
and 50 percents scores are below the median. As compared to mean, the median is least
affected by extreme values and this makes the median a reliable measure of central
tendency. However, it is reliable only when distribution is normal because the median
number of cases on either sides.
The median of N numbers can be found by the formula (N + 1) / 2. When N is an
odd number, the resulting integer corresponds to the location of median in numerically
ordered distribution. For example, in the distribution of numbers 32, 33, 41, 55, 54, 59,
60, 68 and 70 the median location is (9 + 1) / 2 = 5. The value 54 is the median, four
scores are above 54 and four scores are below 54. If there were only 8 values, the median
location is (8 + 1) / 2 = 4.5. In this case the median is half-way between the 3rd
and 4th
scores (54 and 59). Now the median is the sum of these two values divided by 2, i.e.
(54+59)/2 = 56.5.
For grouped data median can be calculated as follows:
Table 5:
In this frequency distribution total number of scores is 20; therefore median is
expected to be in the interval with 10 scores above and below. From the table we know
that this interval is 29-31. We also know that in this range fall 12 scores. But for reaching
the mid point we have to move up only one point as the first 9 scores fall in the preceding
interval. We can compute the median with help of following formula:
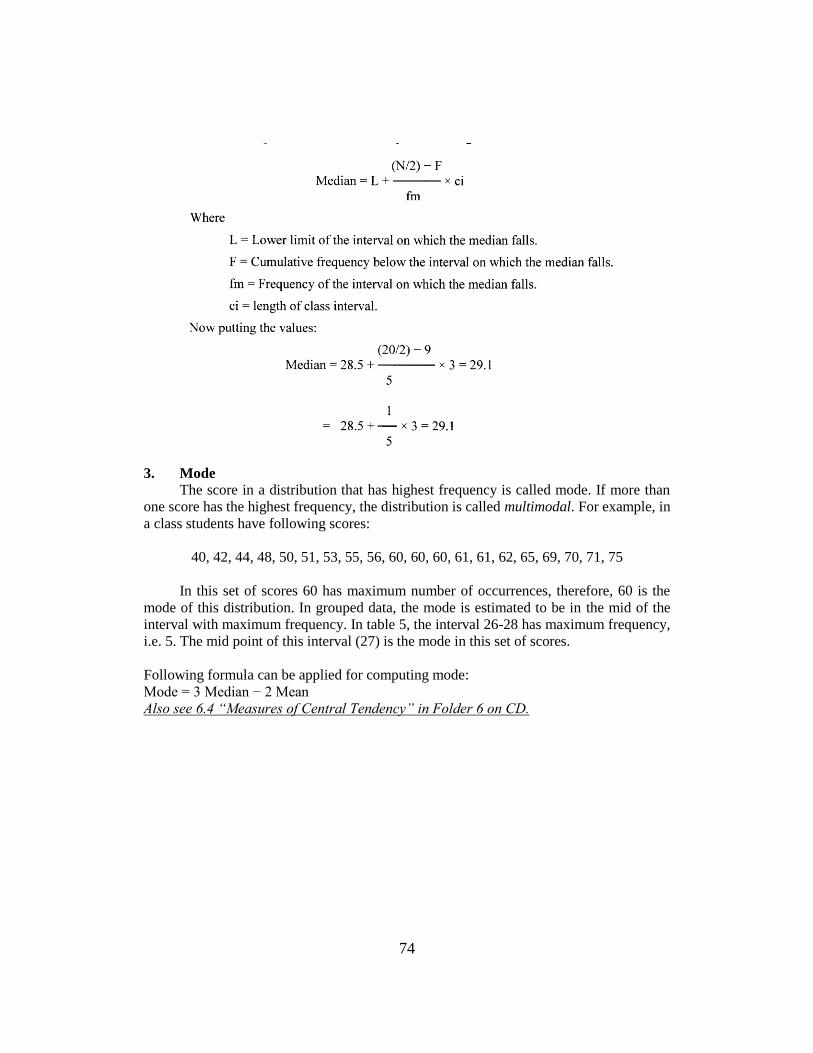
74
3. Mode
The score in a distribution that has highest frequency is called mode. If more than
one score has the highest frequency, the distribution is called multimodal. For example, in
a class students have following scores:
40, 42, 44, 48, 50, 51, 53, 55, 56, 60, 60, 60, 61, 61, 62, 65, 69, 70, 71, 75
In this set of scores 60 has maximum number of occurrences, therefore, 60 is the
mode of this distribution. In grouped data, the mode is estimated to be in the mid of the
interval with maximum frequency. In table 5, the interval 26-28 has maximum frequency,
i.e. 5. The mid point of this interval (27) is the mode in this set of scores.
Following formula can be applied for computing mode:
Mode = 3 Median − 2 Mean
Also see 6.4 “Measures of Central Tendency” in Folder 6 on CD.

75
Self Assessment Questions
1. What is the importance of statistics in educational settings?
2. Tabulate the following 25 scores into two frequency distributions, using (1) an interval of
three and (2) an interval of five units. Let the first interval begin with the score 60.
72 75 77 67 72
81 78 65 86 73
67 82 76 76 70
83 71 63 72 72
61 67 84 69 64
3. Calculate mean, median and mode from the above frequency distribution.
4. The same test is given to three groups of students. The number of students in each
group and their mean scores are given. Compute the combined mean.
Groups N M
A 32 24
B 54 31
C 16 35
Additional Readings
5. Garrett, H. E. (1967), Statistics in Psychology and Education, (6
th Ed), Longman,
Green & Co. Reprinted by National Book Foundation, Pakistan.
6. Minium, E. W., King, B. M. and Bear, G. (1993). Statistical Reasoning in
Psychology and Education, (3rd
Ed), New York: John Wiley & Sons.
Web Based Material
1. Statistical Terms, Retrieved May 06, 2008 from
http://bobhall.tamu.edu/FiniteMath/Module8/Introduction.html
2. The Internet Glossary of Statistical terms, Retrieved May 06, 2008 from
http://www.animatedsoftware.com/statglos/statglos.htm
3. Frequency distribution, Retrieved May 08, 2008 from
http://mathworld.wolfram.com/FrequencyDistribution.html
4. Measures of Central Tendency, Retrieved June 17, 2008 from
http://www.cliffsnotes.com/WileyCDA/CliffsReviewTopic/Measures-of-Central-
Tendency.topicArticleId-25951,articleId-25905.html

76

77
Unit–7
Measures of Variability and Correlation
Written by:
Prof. Dr. Rehana Masrur

78

79
CONTENTS
7.1 Introduction ........................................................................................................81
7.2 Objectives ..........................................................................................................81
7.3 Measures of Variability .....................................................................................81
1. The Quartile Deviation (Q) ......................................................................81
2. The Standard Deviation or SD ................................................................82
7.4 Percentile Ranks ................................................................................................86
7.5 Normal Distribution ...........................................................................................88
Skewness ............................................................................................................88
7.6 Measures of Relationships .................................................................................89
1. Linear Correlation ....................................................................................89
2. Prediction .................................................................................................91
7.7 Application of Descriptive Statistics for Interpreting Standardized Tests .........92
7.8 Self Assessment Questions ................................................................................92
7.9 Additional Readings ..........................................................................................93
7.10 Web-Based material ...........................................................................................94

80
81
7.1 Introduction
In the previous unit, we have learned measures of central tendency that tells us
about the average or central value of the group. However, this information is not
sufficient for making effective decisions. Other statistical measures are use to make
information more useful and reliable. For example, in an achievement test the mean score
of two groups is 70. It tells us that the two groups are at same achievement level.
However, when we take a look at individual scores, we find that in one group scores vary
from 30 to 98 while in other the spread of scores is from 50 to 80. Measures of central
tendency do not tell anything about this aspect of group. For this purpose we use
measures of variability.
Furthermore social sciences like education and psychology deal with such
complicated phenomena that are inter-related and it is impossible to discern the impact of
a single variable in the given circumstances. Therefore, social scientists just figure out the
relationships among different variable and infer the results on the basis of these
relationships.
In this unit we will discuss some important measures of variability as well as the
measures of relationships.
7.2 Objectives
After completing this unit, you will be able to:
1. Compute different measures of variability from raw data and frequency
distributions.
2. Interpret different measures of variability in terms of kind of scores.
3. Explain percentile ranks.
4. Explain the nature and use of correlation in education.
5. Compute correlation by using different methods.
6. Use correlation in daily routine work of assessment and evaluation.
7.3 Measures of Variability
Variability indicates the extent of variation in a distribution of scores. As the
central value in a distribution provides information about how scores are centered in the
distribution, the measures of variability provide information about the extent to which
scores are grouped around the central value or deviate from it.
The simplest measure of variability is the range that is the difference between the
highest and the lowest values in a distribution. For example, the range of scores 20, 20,
21, 25, 26, 26, 27, 28, 28, 29, 30, 30, 32, 35, 37, 37, 38, 38, 39, and 40 is 40-20 = 20.
Other measures of variability include the quartile deviation and the standard deviation.
1. The Quartile Deviation (Q)
It is the measure of spread of scores between first quartile (Q1) and third quartile
(Q3) in a distribution. The first quartile is the point below which lie 25% of the scores
and the third quartile is the point below which lie 75% of the scores. After identifying
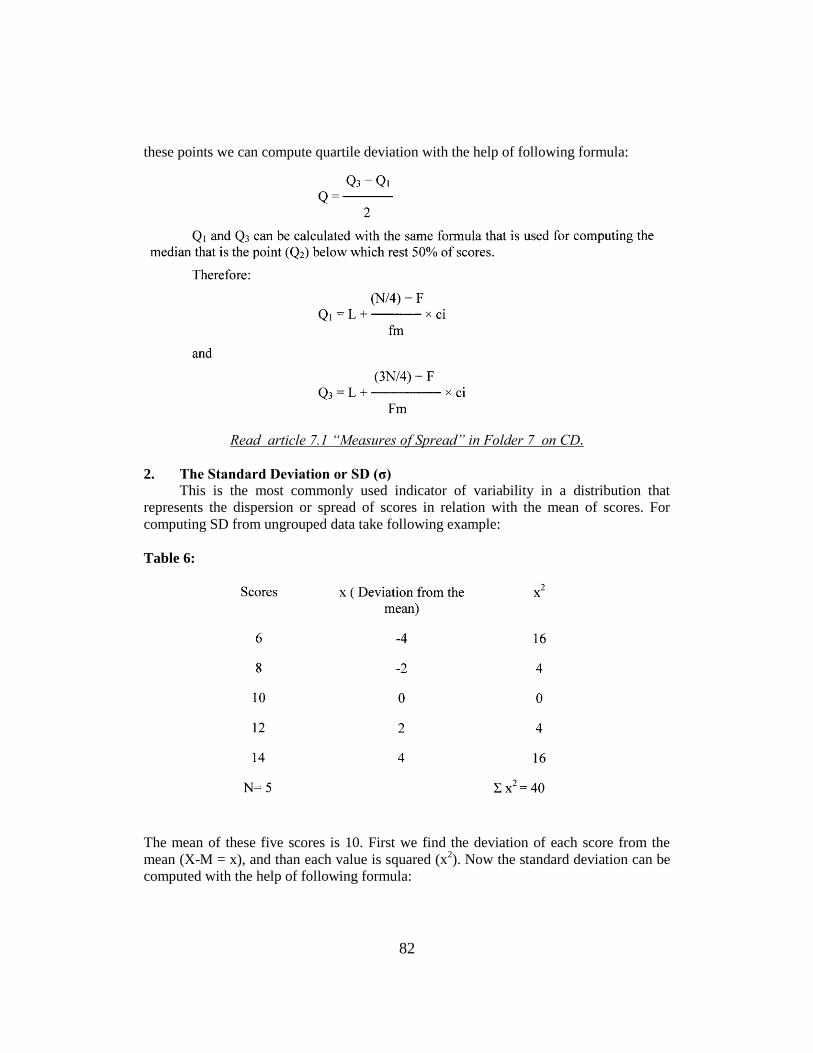
82
these points we can compute quartile deviation with the help of following formula:
Read article 7.1 “Measures of Spread” in Folder 7 on CD.
2. The Standard Deviation or SD (σ)
This is the most commonly used indicator of variability in a distribution that
represents the dispersion or spread of scores in relation with the mean of scores. For
computing SD from ungrouped data take following example:
Table 6:
The mean of these five scores is 10. First we find the deviation of each score from the
mean (X-M = x), and than each value is squared (x2). Now the standard deviation can be
computed with the help of following formula:

83
In the above table the interval with maximum frequency has been assumed as the
interval on which the mean lies. Therefore the distance on the both sides has been
counted from there. Column ‘x’ shows these distances. As upward the scores are higher
than assumed mean (172), the deviation is positive. On the lower side scores are lower;
therefore, the deviation is negative. We can compute SD with the help of following
formula:
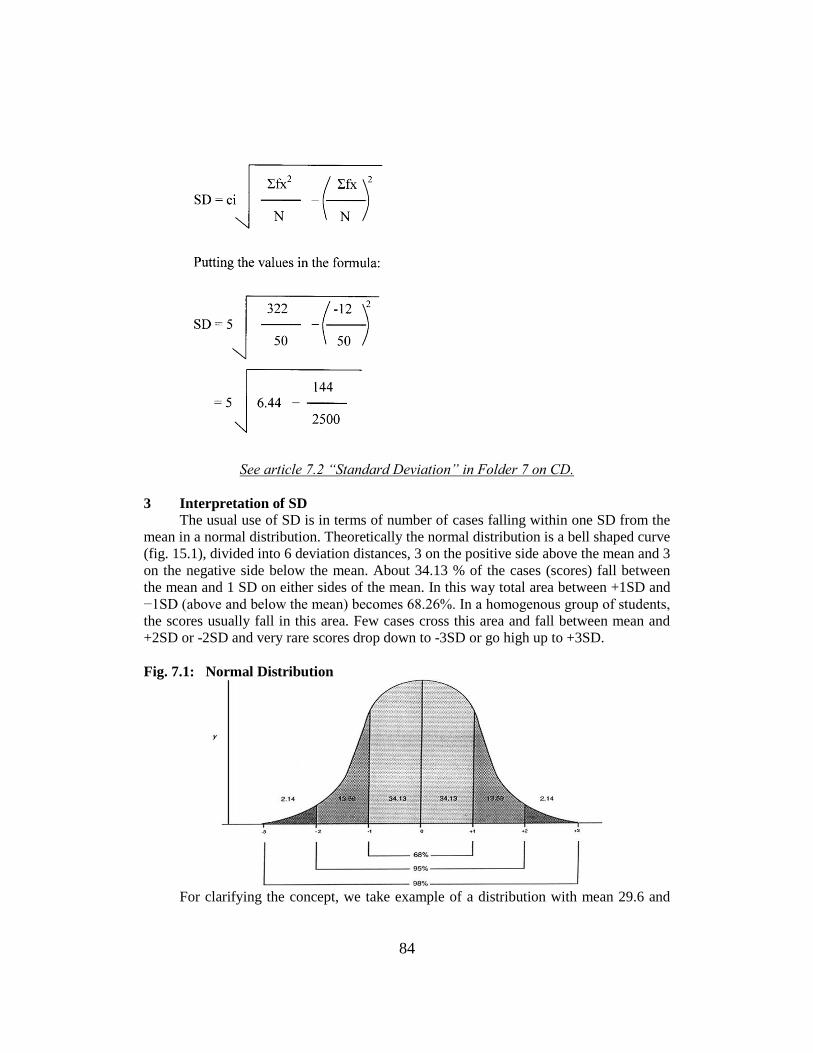
84
See article 7.2 “Standard Deviation” in Folder 7 on CD.
3 Interpretation of SD
The usual use of SD is in terms of number of cases falling within one SD from the
mean in a normal distribution. Theoretically the normal distribution is a bell shaped curve
(fig. 15.1), divided into 6 deviation distances, 3 on the positive side above the mean and 3
on the negative side below the mean. About 34.13 % of the cases (scores) fall between
the mean and 1 SD on either sides of the mean. In this way total area between +1SD and
−1SD (above and below the mean) becomes 68.26%. In a homogenous group of students,
the scores usually fall in this area. Few cases cross this area and fall between mean and
+2SD or -2SD and very rare scores drop down to -3SD or go high up to +3SD.
Fig. 7.1: Normal Distribution
For clarifying the concept, we take example of a distribution with mean 29.6 and

85
SD 10.4. We need to know what percentage of cases fall between scores 20-40. From the
given information we know that the score of 20 is 9.6 points below the mean and the
score of 40 is 10.4 points above the mean. In terms of standard deviation, 9.6 represent
−0.9 SD as it is below the mean. As the distance between mean and −0.9 SD is 31.59% of
the normal distribution (See table ‘A’ in Minium, King and Bear, 1993, p. 553),
therefore, the number of cases between 20 and 29.6 (mean) is 31.59% of the population.
On the positive side 10.4 represent +1SD and the cases between mean and 1SD are
34.13% of the total population. Now we can find the number of cases falling between the
scores 20 and 40 by adding the two percentages (31.59 + 34.13 = 65.62). If the number of
students is 50, we can find that 33 (62.62% of 50) students have scores between 20 and
40. We can conclude that most of the students fall between + 1 SD therefore, the group is
of average caliber.
For clarifying the concept of normal distribution see article 7.3 “Normal Distribution”
in Folder 7 on CD.
Activity Plot curves for the results of different subjects in your class and see whether these are
normally distributed or skewed positively or negatively.
4. Variance;
An important measure of variability is variance that can be defined as the average
of the squared deviations from the arithmetic mean. And can be calculated in the
following way:
For example, suppose that the height (in inches) of a sample of students at AIOU are as
follows:
• Height in inches
66 The following steps are used to
73 calculate the variance:
68 1. Find the arithmetic mean.
69 2. Find the difference between each observation and the mean.
74 3. Square these differences.
4. Sum the squared differences
5. Since the data is a sample, divide the number (from step 4 above) by the number of
observations minus one, i.e., n-1 (where n is equal to the number of observations in
the data set). Later on, this term (n-1) will be called the degrees of freedom.
Height.............Deviation..............Square
66....................66-70= -4............. 16
73....................73-70= +3.............. 09
68....................68-70= -2.............. 04
69....................69-70= -1.............. 01
74....................74-70= +4.............. 16

86
1. Total of column one = 350
2. Arithmetic mean = (350)/(5) = 70 inches
Total of column three = 46
Variance = (46)/(5-1) = 11.5 squared inches.
5. Coefficient of Variation (V)
The coefficient of variation is used when the means of two different groups being
compared are unequal and the units of measurement are different. As ‘V’ is a ratio value,
it is independent of the units of measurements. The formula for computing ‘V’ is:
Now we can relate that the group is more varied in height than in weight.
7.4 Percentile Ranks
Percentile is a point in a distribution below which lies a certain percentage of the
scores. As we have learned that median is a point below which 50% of the score lie, so
we can call it 50th percentile. Similarly, Q1 and Q3 are 25
th and 75
th percentiles
respectively. We can use the same formula for computing any percentile like 10th
percentile, 22nd
percentile, 90th percentile, etc.
pN − F
Where
Pp = Percentage of distribution to be computed.
L = Lower limit of the interval on which Pp lies.
pN = Part of the distribution that makes required percentage.

87
F = Cumulative frequency below the interval on which the required percentage
falls.
Fp = Frequency of the interval on which the required percentage falls.
Ci = The length of interval.
Percentile rank is the position of a score or an individual having that score, on a
scale of 100. For example, if a score of 67 is the 30th percentile, it means that 30% of
scores lie below 67. If a student has scored 67 then its percentile rank is 30. We can
compute the percentile rank of a given score using following formula:
Where
L2 = The score for which percentile rank is to be computed.
L1 = Lower limit of the interval which has the score.
Fp = Frequency of the interval.
Ci = length of the interval.
N = Number of scores in the distribution.
Cf = Cumulative frequency below the interval.
For example, we can compute the percentile rank of a score of 163 in the given distribution:
Table 8:
Scores Frequencies (f) Cumulative
Frequency(cf)
195 – 199 1 50
190 – 194 2 49
185 – 189 4 47
180 – 184 5 43
175 – 179 8 38
170 – 174 10 38
165 – 169 6 20
160 – 164 4 14
155 – 159 4 10
150 –154 2 6
145 – 149 3 6
140 – 144 1 1
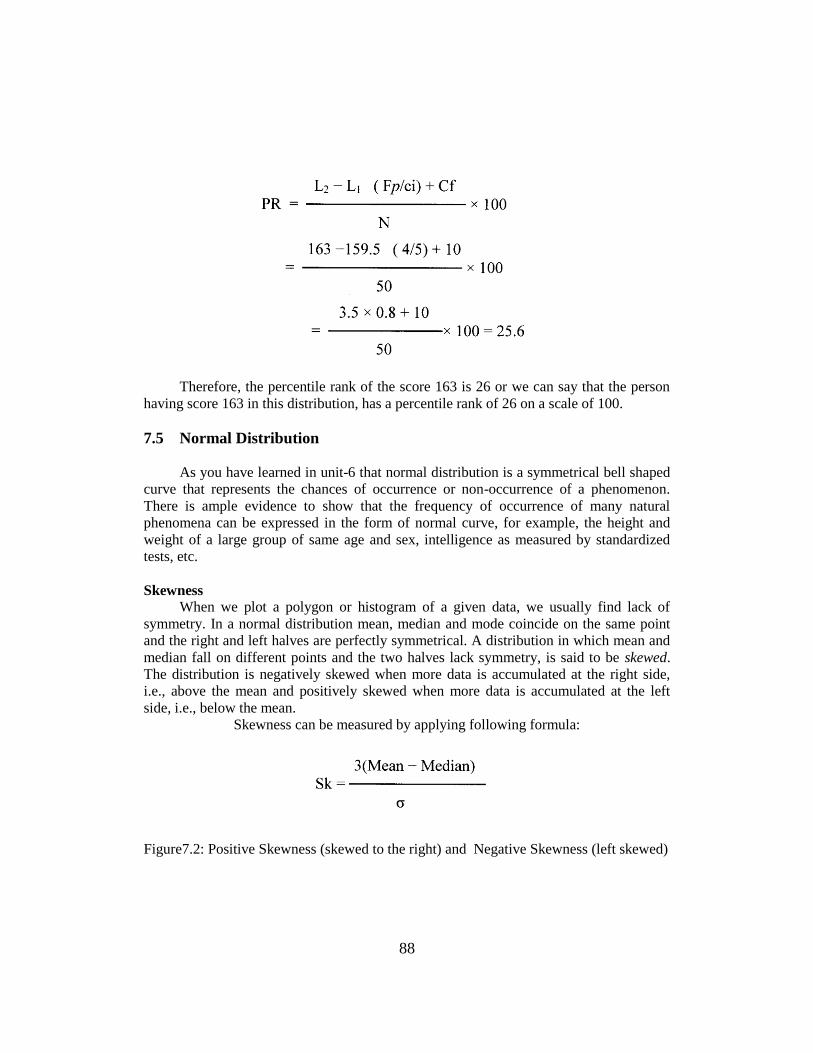
88
Therefore, the percentile rank of the score 163 is 26 or we can say that the person
having score 163 in this distribution, has a percentile rank of 26 on a scale of 100.
7.5 Normal Distribution
As you have learned in unit-6 that normal distribution is a symmetrical bell shaped
curve that represents the chances of occurrence or non-occurrence of a phenomenon.
There is ample evidence to show that the frequency of occurrence of many natural
phenomena can be expressed in the form of normal curve, for example, the height and
weight of a large group of same age and sex, intelligence as measured by standardized
tests, etc.
Skewness
When we plot a polygon or histogram of a given data, we usually find lack of
symmetry. In a normal distribution mean, median and mode coincide on the same point
and the right and left halves are perfectly symmetrical. A distribution in which mean and
median fall on different points and the two halves lack symmetry, is said to be skewed.
The distribution is negatively skewed when more data is accumulated at the right side,
i.e., above the mean and positively skewed when more data is accumulated at the left
side, i.e., below the mean.
Skewness can be measured by applying following formula:
Figure7.2: Positive Skewness (skewed to the right) and Negative Skewness (left skewed)

89
7.6 Measures of Relationships
Measures of relationships tell us to what extent two things are related and to what
extent variation in one goes with variation in other. For example, the time taken for
studies may be related with the scores in a test, i.e., more time given to study higher the
score in the test. However, we can not make any prediction out of such relationships as
explained later in this unit. Two variables may be positively related, that is, the variations
in both are in same direction or they may be negatively related, that is the variation occur
in opposite directions. The value of correlation coefficient varies from +1 to -1, depicting
perfect positive and perfect negative correlation respectively. If the value of correlation
coefficient is 0, it means no relationship exists between the variables.
1. Linear Correlation
When the relationship between two variables is expressed in a straight line, it is said to be
a linear correlation. This type of relationship is described in terms of correlation coefficient
called Product-Moment Coefficient of Correlation, denoted by ‘r’. It is the ratio which
expresses the extent to which changes in one variable are associated with changes in the other.
Product-moment coefficient of correlation is computed by the formula;
The formula can be written as:

90
Read article 7.4 “Correlation” in Folder 7 on CD.
Activity Find the correlation between test scores of your students in Science and Mathematics.
Correlation and Causation
The coefficient of correlation indicates the extent to which two variables are related to one
another; however, it does not establish any causal relationship. For example, a highly significant
correlation between two variables X and Y indicates that a change in X is related with the change in

91
Y; nevertheless, we can not suggest that the change in X causes the change in Y or vice versa. The
relationship between the two variables may be influenced by some other variables. Therefore, a
researcher should be careful while interpreting the correlation coefficient.
McMillan (2007), pp. 397-400
Also see article 7.5 “Difference between Causation and Correlation” in Folder 7 on CD.
2. Prediction
Although a correlation between two variables does not confirm any causal relationship,
we can make prediction on the basis of correlation. The product moment correlation coefficient
indicates linear relationships, so, we can make prediction with the help of the equation for the
straight line that is termed as Regression Equation. If X and Y are correlated, we can predict Y
on the basis of data for X with the help of following equation:

92
So, the probable score of the student in English, having 65 marks in History, is
60.4. Since the correlation between the two variables is seldom perfect, our prediction
will include chances of error. The amount of error can be estimated with the help of the
formula of Standard Error of Estimate.
It needs to be noted that both regression equation and standard error of estimate
give approximate values when the distribution fulfils the following conditions:
1. When the correlation between the two variables is linear, i.e., it can be described by
a straight line.
2. The values of one variable must be normally distributed for the values of the other
variable.
3. The variability of the values of two variables around their means must be same.
Also see article7.6 “The idea of Regression Equation” and
Article 7.7 “Introduction to Simple Linear Regression” in Folder 7 on CD.
7.7 Application of Statistics for Interpreting Standardized Tests
The scores of standardized tests are often interpreted in terms of statistical data.
Students’ performance is demonstrated with the help of standard scores, as indicated by
normal distribution and standard deviation. Measures of central tendency and variability
help in determining the status of a student’s performance in a particular group.
Measure of correlation coefficient helps in determining reliability of tests and also
prediction can be made on the bases of correlation coefficient. The standard error of
estimate provides more accurate status of a student’s performance, in the form of
confidence interval, than a single score does.
For detail see: McMillan (2007), pp. 406-413
Also see article 7.8 “Standardized Test Scores”
Article 7.9 “Interpretation of Standardized Test scores” in Folder 7 on CD.
7.8 Self Assessment Questions 1. Compute interquartile range and standard deviation for the following frequency
distribution.
Scores Frequencies
70 – 71 2
68 – 69 2
66 – 67 3
64 – 65 4
62 – 63 6
60 – 61 7

93
58 – 59 5
56 – 57 4
54 – 55 2
52 – 53 3
50 – 51 1
N = 39
2. Calculate standard deviation of the following ungrouped scores.
72 75 77 67 72
81 78 65 86 73
67 82 76 76 70
83 71 63 72 72
61 67 84 69 64
3. Determine P30, P60 and P90 in the frequency distribution given in question 1. What
is the percentile rank of score 65.
4. Find the correlation between the two sets of scores given below.
Students X Y
A 15 40
B 18 42
C 22 50
D 17 45
E 19 43
F 20 46
G 16 41
H 21 41
7.9 Additional Readings
1. McMillan, J. H. (2007), Classroom Assessment: Principles and Practice for
effective Standard Based Instructions, Boston: Pearson Education, Inc.
2. Garrett, H. E. (1967), Statistics in Psychology and Education, (6th Ed), Longman,
Green & Co. Reprinted by National Book Foundation, Pakistan.
3. Minium, E. W., King, B. M. and Bear, G. (1993). Statistical Reasoning in
Psychology and Education, (3rd
Ed), New York: John Wiley & Sons.

94
7.10 Web Based Material
1. Measures of Spread, Retrieved May 06, 2008 from
http://www.abs.gov.au/websitedbs/D3310116.NSF/8eded5e0a14f570aca256e1500
1c9894/b125994851d748204a2567ac0020cb2e!OpenDocument
2. Standard Deviation, Retrieved May 06, 2008 from
http://www.mathsrevision.net/gcse/pages.php?page=42
3. Normal Distribution, Retrieved May 06, 2008 from
http://www.comfsm.fm/~dleeling/statistics/notes06.html
4. Correlation, Retrieved May 06, 2008 from
http://www.socialresearchmethods.net/kb/statcorr.php
5. Difference between Causation and Correlation, Retrieved May 06, 2008 from
http://stats.org/in_depth/faq/causation_correlation.htm
6. The idea of Regression Equation, Retrieved May 06, 2008 from
http://www.people.ex.ac.uk/SEGLea/psy2005/simpreg.html
7. Introduction to Simple Linear Regression, Retrieved May 06, 2008 from
http://www.tufts.edu/~gdallal/slr.htm
8. Standardized Test Scores, Retrieved May 06, 2008 from
http://www.sizes.com/society/test_scores.htm
9. Interpreting Standardized Test scores, Retrieved May 06, 2008 from
http://www.udel.edu/educ/gottfredson/451/unit10-chap19.htm

95
Unit–8
A Program of Assessment
Written by:
Prof. Dr. Rehana Masrur

96

97
CONTENTS
8.1 Introduction ........................................................................................................99
8.2 Objectives ..........................................................................................................99
8.3 Why Teacher Self-Assessment? ........................................................................99
8.4 Informal Self-Assessment ................................................................................100
8.5 Formal Self-Assessment ..................................................................................100
8.6 Peer Assessment ..............................................................................................101
8.7 Institutional Self-Assessment...........................................................................101
8.8 What is Accreditation? .....................................................................................101
8.9 Need and Importance of Accreditation ............................................................102
8.10 Pakistan Accreditation Council for Teacher Education ...................................102
8.11 Quality Indicators for Teacher Education ........................................................103
8.12 Ten Proposed Professional Standards for Teachers in Pakistan ......................103
8.13 Self Assessment Questions ..............................................................................104
8.14 Additional Readings ........................................................................................104
8.15 Web-Based Material ........................................................................................105

98
99
8.1 Introduction
The recent issue of quality education has given rise to the concept of institutional
self assessment and accreditation. Accreditation is granted for educational institutions,
usually, by government agencies in order to ensure the quality of education provided in
these institutions. In Pakistan, Higher Education Commission has established
Accreditation councils for different types of institutions including teacher education
institutions to confirm the quality of these institutions.
So far we have discussed assessment in the perspective of students’ assessment
made by the teachers. However, an important aspect of teaching is how teachers assess
and evaluate their own performance and effectiveness and how an institution asses its
pogramms. Teachers' self-assessment involves the evaluation of teachers own knowledge
and competence. Teachers themselves assess their professional competence, methods of
teaching, knowledge of contents, effectiveness of instructional activities and other aspects
of their professional responsibilities. Airasian (2001) has described teachers’ self-
assessment as “a type of formative assessment of the teacher by the teacher and for the
teacher” (p.382).
In this unit we will discuss the need and importance of teachers’ an institutional
self-assessment and different approaches to effective self assessment of.
8.2 Objectives
After completing this unit, you will be able to:
1. Explain the need and importance of teacher self-assessment.
2. Describe informal and formal means of teacher self-assessment.
3. Describe the importance of peer assessment.
4. Describe the need of institutional self assessment.
5. Explain the need and importance of accreditation.
6. Describe main functions of Pakistan Accreditation Council for Teacher Education.
7. Describe some quality indicators for teacher education.
8.3 Why Teacher Self-Assessment?
Airasian (2001) advocates teacher self-assessment for the following reasons:
1. It is a professional responsibility of a teacher to continually assess and improve
his/her professional knowledge and skills.
2. Self-assessment focuses on classroom level that helps teachers improve their
instructional proficiency.
3. Self-assessment results in improvement from within the individual rather than
imposing change from outside.
4. Teachers become aware of their strengths and weaknesses and can make necessary
changes and improvements.
5. Self-assessment creates a sense of professionalism in teachers.
6. Planned assessment can develop interaction and learning among groups of teachers.
See Airasian (2001), pp. 282-283

100
8.4 Informal Self-Assessment
Most of the times teachers’ self-assessment takes place in informal ways during
classroom activities. In the course of instructional activities, a teacher also keeps on assessing
his/her teaching merit through reflecting on the pace of instructions, students’ reaction to
instructions, students’ interest and involvement in classroom activities, students’ understanding
of the instructions, and other spur-of-the-moment incidents occurring in the classroom. These
aspects of teaching learning process provide material for self assessment.
Though informal self-assessment is common and important, it does not seem to be
helpful in improving teaching performance on the whole due to some limitations. The
basic limitation of informal self assessment involves the questions and problems that
arise during instructions for which the teacher has to make on the spot decisions without
having enough time for careful thinking. After the instructions teachers seldom remember
those questions that were related to some particular instruction or situation. Generally
teachers do not think of these questions to be self assessment questions.
As informal self assessment is limited to classroom activities, it does not call
attention to other important aspects of teaching such as students’ assessment and grading,
planning of classroom activities, communication with parents and other professional
responsibilities. Therefore, informal teacher self assessment is not sufficient for bringing
excellence in teaching.
8.5 Formal Self-Assessment
Formal self-assessment is carried out systematically by the teachers through
conscious and careful contemplation on their teaching strategies and other professional
affairs. Formal self-assessment is based on planned and controlled collection of
information. Airasian (2001) has listed eight common methods of collecting information
for self assessment.
1. Self Assessment Questionnaire includes questions that teachers have to answer.
2. Audio Video Recordings in classroom help teachers revisit their performance
during instructions.
3. Students Feedback is provided through a questionnaire filled by the students.
4. Teachers’ portfolios include collection of exemplars of teachers’ professional
skills and experiences.
5. Students Performance Data provide information for self assessment through
review of students work examples, test results and other records.
6. External or Peer Assessment involves observation of classroom activities by a
peer or colleague.
7. Journal Writing helps teacher keep record of classroom events and problems for
reconsideration.
8. Joint Problem Solving involves group discussion and problem sharing among
teachers for bringing improvement in teaching.
For detail see Airasian (2001), pp. 384-388
Also see article 8.1“Teachers Self Assessment Checklist” and “Teachers Self Assessment
through Portfolio” in Folder 8 on CD.
101
8.6 Peer Assessment
Peer assessment and feedback are generally associated with self assessment and,
are considered to be helpful in supplementing self assessment. Observations and
comments made by peers provide reflective information that teachers may use along with
their own insight and other available information to evaluate the genuineness of their self
assessment.
Peer assessment is especially effective in group work where more than one teachers
are involved in a task, for example, team teaching. A teacher can benefit from the
experiences of co-workers and improve its teaching quality. A teacher may ask a
colleague or any experienced person to observe his/her class teaching and comment.
Group discussions and collaborative work also provide opportunities of learning and
improving professional skills. Moreover, the skills of communication and cooperation are
enhanced that are essential for teaching profession.
8.7 Institutional Self-Assessment
Institutional Self Assessment is an assessment practice carried out by the institution
to assess the extent to which its academic programs meet their educational objectives and
produce desired outcomes. Such practice is essential for improving the quality of these
programs as well as enhancing student learning.
The major purposes of institutional self assessment include improvement and
maintenance of academic standards, enhancement of students’ learning, confirmation of
achievement of objectives and providing feedback for quality assurance and
accreditation.
A productive self evaluation has following essential component:
1. Identification of the purpose of assessment.
2. Identification of the results of assessment.
3. Effective planning of evaluation design.
4. Relevant data collection.
5. Careful analysis
6. Effective decision making for necessary improvements.
A successful self assessment leads to academic excellence, quality education,
professionalism and systematic process of assessment.
8.8 What is Accreditation?
Accreditation or recognition of an institution confirms that the programs offered in
the institution meet certain minimum standards prescribed by an authorized accreditation
agency. Accreditation of an institution affirms the quality of education in the institution
by showing confidence on its performance.
The process of accreditation involves three main steps:
1. The institution applies for accreditation along with a self-study report including
information about physical facilities in the institution, institutional finances,

102
admission requirements, faculty, degree requirements, course content, co-curricular
activities and student-faculty participation in institutional development.
See article 8.2 as a sample of “Self Appraisal Report” in Folder 8 on CD.
2. The accreditation committee reviews the self-study report submitted by the
institution for deciding whether the institution meets the requirements for further
processing.
3. If the institution qualifies, a team of experts visits the institution and thoroughly
examine different aspects of the self study report. After detailed inspection and
discussion the accreditation committee presents a report with recommendations for
either approval or denial of accreditation.
See article 8.3“What is Accreditation” and “Accreditation Guidelines” in Folder 8 on CD.
8.9 Need and Importance of Accreditation
Accreditation is required to establish uniform standards of quality education in
different institutions. It helps in improving institutional efficiency through continuous
evaluation of the performance and products of the institution. The self assessment
required for accreditation process provides opportunities for bringing positive changes in
the system of institution.
Accreditation certifies the reliability of programs offered by the institution and
ensures that the criteria of quality education are met. It provides a reliable system of
public accountability so that community can place trust in the institution.
Accreditation provides opportunity for all stake holders to participate in
determining the important measures to be taken for making improvements in the field of
education. It is also a means of building confidence and positive relationships between
community and the institution.
See article 8.4 on “Importance of Accreditation” in Folder 8 on CD.
8.10 Pakistan Accreditation Council for Teacher Education
Pakistan Accreditation Council for Teacher Education has been established for the
accreditation of all the teacher education degree and postgraduate diploma programs. Any
new program in teacher education is referred to the Council for the grant of accreditation.
The accreditation is granted for specific degree programs not for institutions and
accreditation is mandatory for all relevant education academic programs offered by
public and private sector institutions. The objectives of the Council include providing
assistance and counseling to teacher education institutions in planning their academic
programs, facilitating the intellectual development of prospective teachers and providing
professional assistance to the institutions.
Main functions of the Council include:
1. Development and evaluation of policies and procedures for accreditation of teacher
education programs.
2. Establishing criteria for assessment of teacher education programs.
3. Publishing a list of ranking of teacher education programs.

103
4. Promoting intellectual development and understanding of subject areas in the
teaching profession.
5. Collection, publishing, and dissemination of information and research findings on teaching
profession and to facilitate the teacher education institutions for quality assurance.
8.11 Quality Indicators for Teacher Education
The quality indicators of teacher education express the abilities that are expected from a
prospective teacher after completing teacher education program. These indicators include:
1. Knowledge of content to be taught.
2. Knowledge of development and learning needs of students.
3. Ability to deal with individual differences in diverse students.
4. Understanding of individual and group motivation to encourage learning.
5. Competence in the use of multiple teaching methods in accordance with
instructional needs.
6. Effective communication skills and efficient use of technology.
7. Effective planning of instructional activities.
8. Effective classroom management.
9. Use of appropriate teaching and learning resources.
10. Use of appropriate techniques for informal and formal student assessment as well
as self assessment.
11. Aspiration for professional growth.
See article 8.5 “Quality Teaching Indicators” in folder 8
and article 8.6 “Teacher Education Performance Standards” in Folder 8 on CD.
8.12 Ten Proposed Professional Standards for Teachers in Pakistan
The committee has proposed following ten professional standards for teachers in
Pakistan:
1. Subject matter knowledge: Teachers shall understand the central concepts, tools
of inquiry, structures of the disciplines, especially as they relate to the National
Curriculum/Content Standards, and design developmentally appropriate learning
experiences making the subject matter accessible and meaningful to all students.
2. Human growth and development: Teachers shall understand how children and
adolescents develop and learn in a variety of school, family and community
contexts and provide opportunities that support their intellectual, social, emotional
and physical development.
3. Knowledge of Islamic/Ethical values/ Social life skills: Teachers shall understand
the Islamic/Ethical values and practices in the light Quran and Sunnah and other
religious contexts.
4. Instructional planning and strategies: Teachers shall understand instructional
planning, design long-term and short-term plans based upon knowledge of subject
matter, students, community and curriculum goals, and shall employ a variety of
developmentally appropriate strategies in order to promote critical thinking,
problem solving and the performance skills of all learners.

104
5. Assessment: To regularly and continuously assess students progress teachers shall
understand and use multiple assessment strategies and interpret results to evaluate
and promote student learning and to modify instructions in order to foster the
continuous development of students.
6. Learning environment: Teachers shall create a supportive, safe and respectful
learning environment that encourages positive social interaction and active
engagement in learning and self-motivation.
7. Communication and advocacy: Teachers shall use knowledge of effective verbal,
non-verbal and written communication techniques and the tools of information to
foster the use of inquiry, collaboration and supportive interactions.
8. Collaboration and partnerships: Teachers shall build relationships with parents,
guardians, families and professional organizations in the large community to
support students’ learning and well-being.
9. Continuous professional development and code of conduct: Teachers shall participate
as active and responsible members of the professional community, engaging in a wide
range of reflective practices, pursuing opportunities to grow professionally and
establishing collegial relationships to enhance the teaching and learning process. They
will develop and subscribe to a professional code of conduct.
10. Proficient use of information communication technologies: Teachers are able to
use instructional and information communication technologies for curriculum
enrichment, instruction, assessment and evaluation of learning outcomes.
Each standard has three parts:
Knowledge/content (what the teacher knows)
Dispositions, behavior, attitude, values.
Performances/skills (what the teacher can do and should be able to do)
For detail see allied material.
8.13 Self Assessment Questions
1. What is the importance of teachers self assessment and peer assessment in teachers’
professional development?
2. Describe some informal and formal ways of teachers self assessment.
3. How can institutional self assessment be helpful in improving quality of education?
4. What is the importance of accreditation for teacher education institutions? Describe
the functions of Pakistan Accreditation Council for Teacher Education.
5. What important abilities are expected from a prospective teacher after completing
teacher education program?
8.14 Additional Readings
1. Airasian, P. W. (2001), Classroom Assessment: Concepts and Applications,
Boston: McGraw Hill.

105
8.15 Web Based Material
1. Teacher Self Assessment, Checklist Retrieved May 23, 2008 from
http://www.nevadareading.org/resourcecenter/teacher_self_assessment.attachment/
310209/Teacher_Self-Assessment_Checklist.doc
2. Teacher Self Assessment through Portfolio, Retrieved May 23, 2008 from
http://www.viterbo.edu/uploadedFiles/faculty/Self%20Assessment%20Portfolio.doc
3. Self Appraisal Report Retrieved May 25, 2008 from http://www.ncte-
in.org/noti/..%5Cdigisaf.doc
4. What is Accreditation Retrieved May 25, 2008 from http://www.css-
msa.org/about/accredit.html
5. Importance of Accreditation Retrieved May 25, 2008 from http://www.css-
msa.org/about/whyaccredit.html
6. Accreditation guidelines, Retrieved May 25, 2008 from
http://www.pakistan.gov.pk/divisions/scienceandtechnologyresearch-
division/media/guidelines.doc
7. Teachers Education Performance Standards, Retrieved May 25, 2008 from
http://www.wce.wwu.edu/Resources/Certification/Res/TED%20Standards%20and
%20Indicators.pdf.
8. Quality Teaching Indicators Retrieved May 25, 2008 from
http://www.ero.govt.nz/EdRevInfo/Schedrevs/QualTchgPI.doc

106

107
Unit–9
Trends in Assessment
Written by:
Prof. Dr. Rehana Masrur

108

109
CONTENTS
9.1 Introduction ......................................................................................................111
9.2 Objectives ........................................................................................................111
9.3 Traditional Tests and Cognitive Psychology ...................................................111
9.4 Assessment Trends in the Light of Behavioral Views .....................................112
9.5 Assessment Trends in the Light of Cognitive Views .......................................112
9.6 Educational Assessment in 21st Century .........................................................112
1. Computer Adaptive Testing ...................................................................113
2. Computer Simulation .............................................................................113
3. E-Portfolios ............................................................................................113
9.7 Equity and Assessment ....................................................................................113
9.8 Trends in Student Testing in Pakistan .............................................................113
1. Establishment of National Educational Assessment System .................114
2. GRE Tests ..............................................................................................114
9.9 Self Assessment Questions ..............................................................................114
9.10 Web Based Material .........................................................................................115

110

111
9.1 Introduction
Since assessment has a profound effect on instruction, educators are trying to
substitute the traditional assessment techniques with alternative assessment methods such
as performance assessment, authentic assessment, portfolios and computer assisted
assessment, etc. These assessment strategies provide more significant ways to assess
what students have accomplished and how well the learning objectives have been
achieved. Moreover, teachers can adopt appropriate strategies for future in the light of
information provided by these assessments.
The modern cognitive theories have rejected the traditional views of learning and
assessing bits of knowledge through memorization. The skills learned by rote can not be
employed in novel and complex situations. Now the assessment does not only focus on
how to do something but also when to do and how to adapt in a new situation. The
isolated bits of information are not important to assess rather importance is given to the
ability of students to use the information in novel situations to solve unseen problems. In
this unit we will study recent trends in assessment in the light of psychological theories
and the use of new technology in assessment.
9.2 Objectives
After completing this unit you will be able to:
1. Analyze the traditional view of assessment in the light of cognitive psychology.
2. Compare the trends of assessment stemming from cognitive and behavioral views.
3. Describe the use of technological advancement in testing and assessment.
4. Explain the issue of equity and assessment.
5. Describe the trends in student testing in Pakistan.
9.3 Traditional Tests and Cognitive Psychology
The traditional tests put a pressure on teachers as well as learners to put emphasis
on what is to be assessed in the tests. As a result, the learning becomes narrowly focused
on memorization of facts leaving little prospect for developing high level cognitive skills.
The traditional pattern of tests containing questions with one right answer directs students
to learn the specific right answers rather than constructing their own answers depicting
what they have learned.
According to cognitive view the process of learning does not proceed in linear
fashion neither it has a uniform rate. Individuals of different capabilities learn in their
own way with varying speed and they also demonstrate personal meanings of what they
learn. This fundamental aspect of learning is seldom considered in traditional tests.
Traditional tests strongly emphasize memorization of discrete information by drill
and practice without being able to organize and use this information for problem solving.
Cognitive psychology does not view learner as a passive recorder of information rather it
suggests that learner creates its own structure of knowledge.
Recent studies on metacognitive skills indicate that the difference in individuals
that are better adept in problem solving and those who are inept does not lie in the skills

112
they have learned but in the appropriate use of these skills. So, the mere assessment of
what a student has learned does not confirm the ability of applying the learned
information when required.
The theories about the role of social context in learning suggest that group work
improves learning process. Problem solving in real life situation requires group work
while the traditional tests focus on individual work. So, it is desirable to give due
importance to group assessment.
9.4 Assessment Trends in the Light of Behavioral Views
According to behavioral views the scope of assessment is narrowly focused on
discrete information, in the form of isolated facts and skills. The learner is viewed as
passive recorder of the instructions given by the teacher that are assessed through
traditional paper and pencil tests. Students are individually assessed usually once at the
end of instructions. The assessment focuses on a particular aspect of learning and seldom
involves real life situations. The application of new technology is limited to machine
scoring.
9.5 Assessment Trends in the Light of Cognitive Views
Cognitive psychology considers knowledge as integrated information that is
acquired by the learner who is actively involved in the process of learning. Contrary to
behavioral views learning is not imparted to rather it is constructed by the learner. The
acquisition of knowledge leads to the application and use of learned skills. The
metacognitive skills and self regulation abilities are emphasized in instructional process.
The assessment is based on the periodically collected samples of work evaluated not only
by the teacher but also by parents, peers and students themselves. The assessment tasks
are related to real life situation and do not have single correct answer, rather a pre-
established criteria of evaluation is adopted for scoring or grading. Multiple aspects of
learning are assessed usually through collaborative tasks. The advancement in technology
offers such assessment techniques as computer adaptive test, computer simulations, etc.
See article 9.1 “What Does Research Say About Assessment?” in Folder 9 on CD.
9.6 Educational Assessment in 21st Century
The recent technological advancements have opened wide vistas for assessment
techniques. The use of computers and information technology has gained great
importance in assessment activities. The use of technology in assessment ranges from
managing assessment information to completely computerized and online testing. The
use of technology in managing information enables teachers to record, analyze and
present the information in a useful and efficient manner. In fully computerized
assessment, all the aspects of assessment, from preparing test to administering, scoring
and managing information, are based on technology.
Computer based assessment can be use for measuring cognitive as well as practical
abilities. Cognitive abilities can be assessed through testing software while practical

113
abilities can be assessed through e-portfolios and computer simulation.
1. Computer Adaptive Testing
This is a method of testing with the help of computers in which the test is adjusted
to the ability level of the test taker. When the examinee starts taking test, he is presented
with the items of medium difficulty level. If the test taker successfully attempts these
items, he is given more difficult items and if he fails to attempt, he is offered low
difficulty items. In this way a more accurate measure of examinee’s ability can be
obtained.
Computer adaptive testing has several advantages such as less time consumption in
administering the test, producing immediate results, more accurate measures of ability,
etc. However, the difficulty lies in preparing high quality test items and preparing item
banks as these items have to be pre-tested on an adequate sample to determine their
difficulty level. Moreover, there is chance of repetition of items in the tests taken by
individuals of same ability.
2. Computer Simulation
Simulation is an artificial replication of real life situation presented on computers.
This technique is used for assessing practical skills of problem solving. The problems
similar to real situations are created and examinees are provided with a number of options
to solve these problems.
3. E-Portfolios
E-portfolios may be used for performance assessment of students. Computer based
e-portfolios are developed by using different resources and soft-wares and creating links
among them. The quality and relevance of materials, proper linkage to different pages,
efficient use of audio and video clips, etc. can provides a reliable measure of students
learning and skills.
For detail see article 9.2 “Using Computers in Assessment” in Folder 9 on CD.
9.7 Equity and Assessment
In educational settings equity is considered as a state in which all the individuals,
regardless of gender, race, cognitive abilities and other social aspects, have equal
opportunity to learn and get benefit of their learning. The issue of equity and assessment
arise with the belief that some educational test may be biased towards gender, race,
culture, socio-economic status, etc.
Generally, assessment has a profound effect on students’ future prospects.
Therefore, it is required to provide them equal opportunities of demonstrating their
knowledge and abilities through fair assessments. The assessment that involves such
knowledge and skills that favor certain groups of student and rule out others go against
the concept of equity. Equity in assessment can be ensured by providing equal
opportunities for learning valuable knowledge and skills.
For detail see article 9.3 “Equity and Assessment”
Article 9.4 “Guidelines for Assessment Quality and Equity” in Folder 9 on CD.

114
9.8 Trends in Student Testing in Pakistan
Quality assessment is essential for quality education and the success of educational
system depends upon the effectiveness of assessment system. In Pakistan improvement in
assessment activities has been taken as a serious concern and important measures have
been taken in this regard.
1. Establishment of National Educational Assessment System
In order to evaluate/assess learning achievements of students at Elementary level,
National Education Assessment System (NEAS) has been established. The objectives of
NEAS are:
1. To assess, monitor and supplement real learning environment in schools.
2. To define and develop assessment/ achievement goals at Elementary level.
3. To set up minimum standards/ norms for performance at relevant levels.
4. To identify strengths and weaknesses of curricula, textbooks, teacher’s delivery,
school management and the education system as a whole.
5. To enhance quality of education through improvement/ revision in curricula,
textbooks, teacher education & training and examinations
See Material 9.5 on “Establishment of National Educational Assessment System” in
Folder 9 on CD.
See the website http://www.neas.gov.pk/
Government of Pakistan has proposed several administrative and academic reforms
for improving assessment system. The details of these reforms can be seen in Education
Sector Reform: Action Plan.
2. GRE Tests
In recent years the trend of entry tests in higher education institutions, especially
professional education institutions, has emerged in Pakistan. These standardized tests
provide a more reliable and impartial measure of students’ abilities than do their college
or university grades. As assessment techniques and criteria vary from institution to
institution, standardized admission tests offer a uniform measure for the selection of
candidates.
GRE (Graduate Record Examination) is a standardized test that provides a common
measure of capabilities of students intending for admission at postgraduate level. Higher
Education Commission of Pakistan has made it obligatory for the students seeking
admission in higher education institutions, to take GRE test. This test is conducted
through National Testing Service and it is called local GRE (GAT).
9.9 Self-Assessment Questions
1. How does cognitive psychology challenge traditional tests?
2. Compare the assessment trends in the light of cognitive and behavioral views.
3. Write a detailed note on the use of technology in assessment.
4. What trends of student testing are emerging in Pakistan in recent years?

115
9.10 Web-Based Material
1. What Does Research Say About Assessment, Retrieved May 20, 2008 from
http://www.finchpark.com/courses/assess/research.htm
2. Using Computers in Assessment, Retrieved May 20, 2008 from
http://www.icbl.hw.ac.uk/ltdi/implementing-it/using.htm
3. Equity and Assessment, Retrieved May 20, 2008 from
http://www.acase.org/files/equity_and_assessment.pdf
4. Guidelines for Assessment Quality and Equity, Retrieved May 20, 2008 from
http://www.acaca.org.au/pdf/guidelines.pdf
5. Establishment of National Educational Assessment System, Retrieved May 20,
2008 from http://www.moe.gov.pk/newsLetters1.htm


![Measurement & Evaluation [2006_nou Nigeria]](https://static.fdocuments.in/doc/165x107/5447f00cafaf9f41088b4698/measurement-evaluation-2006nou-nigeria.jpg)


