Measurement and analysis of household welfare: possible approaches using GGS data 29.11.2007 L....
24
Measurement and analysis of Measurement and analysis of household welfare: possible household welfare: possible approaches using GGS approaches using GGS data data 29.11.2007 L. Ovcharova, A. Pishniak, D. Popova Independent Institute for Social Policy
-
Upload
mary-pierce -
Category
Documents
-
view
215 -
download
0
Transcript of Measurement and analysis of household welfare: possible approaches using GGS data 29.11.2007 L....

Measurement and analysis of Measurement and analysis of household welfare: possible household welfare: possible
approaches using GGSapproaches using GGSdatadata
29.11.2007
L. Ovcharova, A. Pishniak, D. Popova
Independent Institute for Social Policy
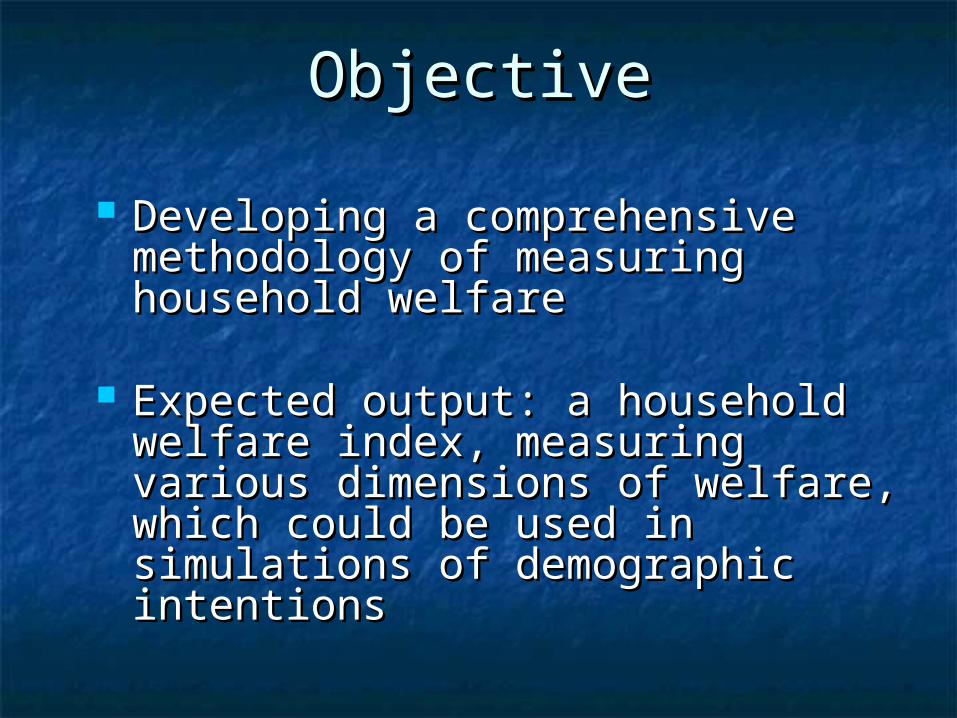
ObjectiveObjective
Developing a comprehensive Developing a comprehensive methodology of measuring methodology of measuring household welfare household welfare
Expected output: a household Expected output: a household
welfare index, measuring various welfare index, measuring various dimensions of welfare, which could dimensions of welfare, which could be used in simulations of be used in simulations of demographic intentions demographic intentions

I. MethodologyI. Methodology
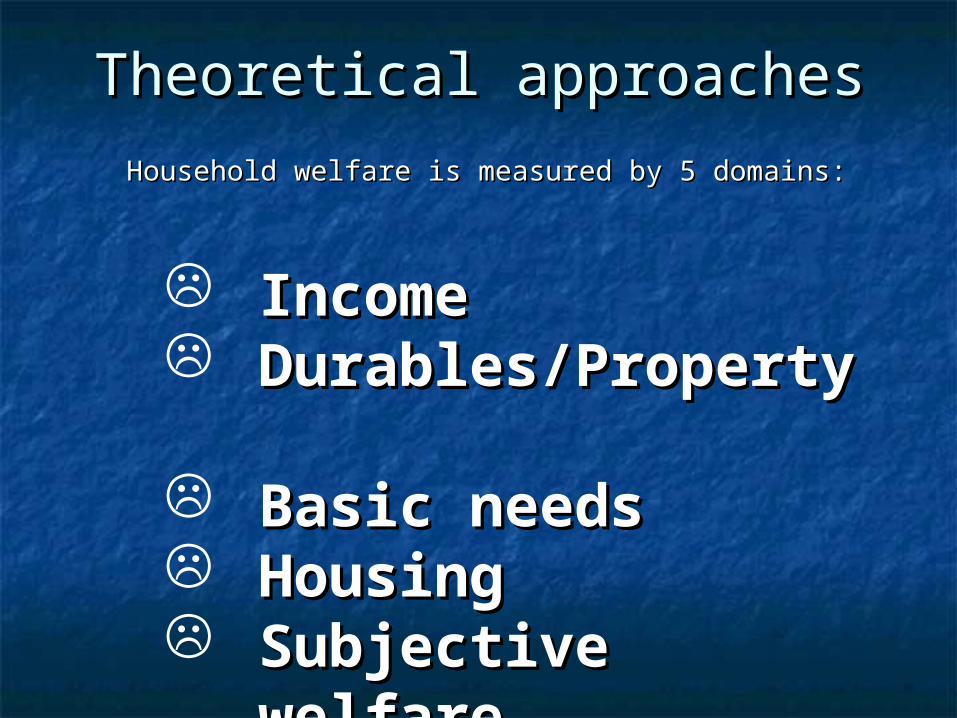
Theoretical approachesTheoretical approaches
Household welfare is measured by 5 domains: Household welfare is measured by 5 domains:
Income Income Durables/Durables/
Property Property Basic needsBasic needs Housing Housing Subjective Subjective
welfarewelfare

Income domainIncome domain Household income Household income is calculated as a maximum is calculated as a maximum
value of: value of: -- the sum of separate components of income the sum of separate components of income -- total household income estimated by the total household income estimated by the
respondent. respondent.
Missing values are imputed on the basis of Missing values are imputed on the basis of linear regression model.linear regression model.
Per capita income is adjusted for regional Per capita income is adjusted for regional disparities in purchasing power disparities in purchasing power using theusing the ratio ratio of the cost of all-Russian subsistence minimum and of the cost of all-Russian subsistence minimum and regional subsistence minimum. regional subsistence minimum.
Income outliers are capped.Income outliers are capped.

Other domainsOther domains Each domain index consists of a group of indicatorsEach domain index consists of a group of indicators
When the household is able to afford the item When the household is able to afford the item (indicator) it is awarded the score of 1. If an item (indicator) it is awarded the score of 1. If an item cannot be afforded the household is awarded the cannot be afforded the household is awarded the score of 0. score of 0.
Possible approaches to estimate the total Possible approaches to estimate the total household welfare index: household welfare index:
A simple count approachA simple count approach A prevalence weighting A prevalence weighting approachapproach
I = Σaixi / Σai *100

Durables/property domain: Durables/property domain: indicatorsindicators
There are 11 indicators availableThere are 11 indicators available
Color TV setColor TV set
Video Cassette Recorder or DVD-Video Cassette Recorder or DVD-PlayerPlayer
Washing MachineWashing Machine
MicrowaveMicrowave
Personal ComputerPersonal Computer
TelephoneTelephone
Car or Mini-van for Private UseCar or Mini-van for Private Use
A Second CarA Second Car
Second HousingSecond Housing
RefrigeratorRefrigerator
Dish-WasherDish-Washer

Basic needs domain: Basic needs domain: indicatorsindicators
There are 6 indicators availableThere are 6 indicators available
Once a year to go on 1-week vacation away Once a year to go on 1-week vacation away from home for every member of the from home for every member of the householdhousehold
To replace, if necessary, old furnitureTo replace, if necessary, old furniture
To buy new, not second-hand, clothesTo buy new, not second-hand, clothes
To eat meat, chicken, or fish at least every To eat meat, chicken, or fish at least every second daysecond day
To invite friends or relatives for lunch, dinner To invite friends or relatives for lunch, dinner at least once a monthat least once a month
To keep the house warm To keep the house warm enoughenough

Housing domain: indicatorsHousing domain: indicators
Number of rooms/equivalent Number of rooms/equivalent household size household size
Status of ownership (owner/tenant)Status of ownership (owner/tenant)
Basic utilities (constructed on the base Basic utilities (constructed on the base of RLMS, 2004)of RLMS, 2004)

Subjective welfare: Subjective welfare: indicators indicators
2 indicators of subjective welfare are available: 2 indicators of subjective welfare are available:
1) Subjective assessment of financial well-1) Subjective assessment of financial well-being “the ability to make ends meetbeing “the ability to make ends meet»»- - answers “very easy” or “easy”answers “very easy” or “easy” 11- answers “very difficult” or “difficult”- answers “very difficult” or “difficult” 00
______________________________________________________________________
2) Satisfaction with the housing – scale 2) Satisfaction with the housing – scale 0-10 0-10
- answers from 8 to 10- answers from 8 to 10 1 1- answers from 0 to 2- answers from 0 to 2
0 0

Combining the domain indices Combining the domain indices into an overall welfare indexinto an overall welfare index
The analysis of the reliability of the scale was undertaken to show The analysis of the reliability of the scale was undertaken to show whether all domain indices measure the same variable “household whether all domain indices measure the same variable “household
welfare”welfare”
Standardized ranks of domain indices:
Corrected Item-Total Correlation
Cronbach's Alpha if Item
Deleted
Income 0,5415 0,5232
Durables/property 0,4683 0,5569
Basic needs 0,5068 0,5295
Housing 0,2735 0,6619
Subjective welfare 0,2433 0,6501
Overall Cronbach's Alpha 0,6431

Combining the domain indices Combining the domain indices into an overall welfare index: into an overall welfare index:
weightingweightingWeights were generated by single factor
analysis. The weights are as follows:
Standardized ranks of domain indices:
Basic index or "gold standard"
Basic index, including housing domain
Basic index, inckuding
housing and subjective welfare domains
Income 0,33 0,29 0,26
Durables/property 0,28 0,25 0,22
Basic needs 0,39 0,35 0,31
Housing 1,00 0,10 0,09
Subjective welfare 1,00 0,12
1,00

II. ProfilesII. Profiles

Income Quintiles (mean Income Quintiles (mean rank) rank)
Quintiles
Basic needs
domain
Durables/ Property domain
Housing domain
Subjective welfare domain
INDEX-1(basic)
INDEX-2 INDEX-3
1 20.8 25.0 42.4 12.5 21.1 20.6 20.9
2 25.2 30.9 54.1 13.0 33.9 34.0 34.1
3 33.9 37.6 58.8 13.6 48.5 48.4 48.4
4 50.0 46.5 66.2 15.6 65.5 65.6 65.5
5 69.8 55.0 74.9 20.6 80.780.7 81.281.2 81.081.0
Total 39.9 39.0 59.3 15.1 50.0 50.0 50.0
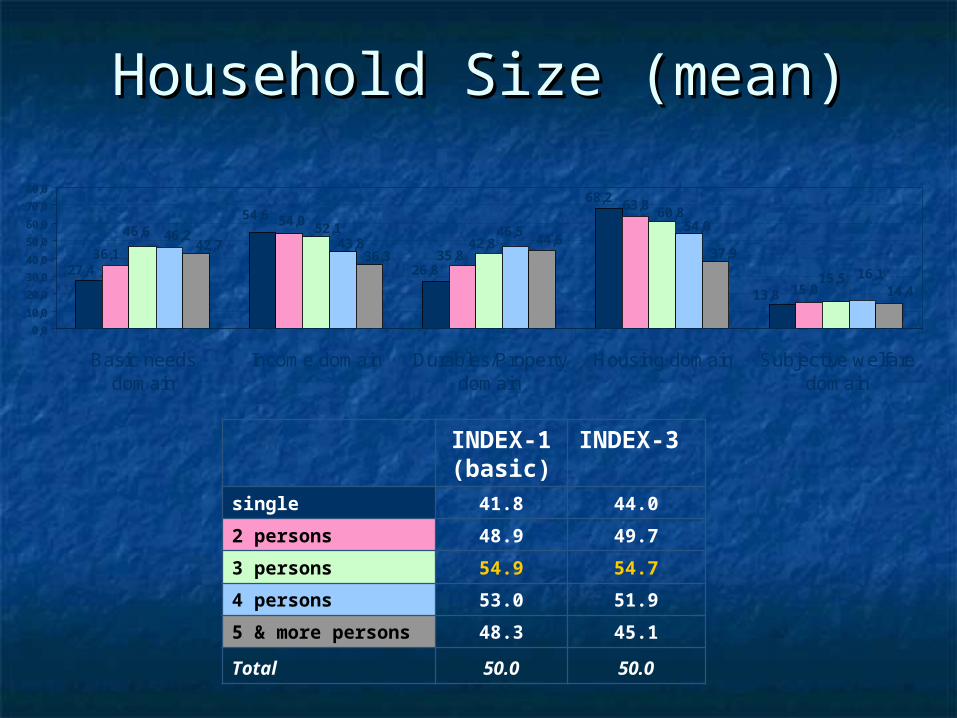
Household Size (mean)Household Size (mean)
INDEX-1 (basic)
INDEX-3
single 41.8 44.0
2 persons 48.9 49.7
3 persons 54.9 54.7
4 persons 53.0 51.9
5 & more persons 48.3 45.1
Total 50.0 50.0
63,8
13,8
68,2
27,4 26,8
54,6
15,0
36,1
54,0
35,8
15,5
60,846,6 52,1
42,8
16,1
54,046,2
43,846,5
14,4
37,942,7
36,344,6
0,0
10,0
20,0
30,0
40,0
50,0
60,0
70,0
80,0
Basic needsdomain
Income domain Durables/Propertydomain
Housing domain Subjective welfaredomain
single2 persons3 persons4 pesrons5 & more persons

Type of Settlement (mean Type of Settlement (mean rank) rank)
Basic needs
domainIncome domain
Durables/Property domain
INDEX-1(basic) Housing
domain
Subjective welfare domain
INDEX-3
Regional, territorial or republican center 45.4 57.8 44.0 57.0 70.4 16.8 58.6
Other cities 40.3 53.8 38.2 51.2 77.4 14.8 54.0
Urban-type community 39.9 48.5 38.6 49.2 59.9 16.4 49.5
Countryside 30.5 33.1 31.7 37.2 21.2 12.1 31.6
Total 39.9 49.9 39.0 50.0 59.3 15.1 50.0

Socio-Demographic Type Socio-Demographic Type (mean rank) (mean rank)
Basic needs domain
Income domain
Durables/Property domain
INDEX-1(basic) Housing
domain
Subjective welfare domain
INDEX-3
HH with able-bodied and children 46.9 44.6 43.2 52.5 53.1 15.8 51.3
HH with able-bodied and without children 42.7 53.1 41.8 53.2 61.7 15.8 53.4
Single able-bodied with children 31.3 43.0 26.4 39.0 54.6 13.8 39.2
Single able-bodied without children 45.7 70.7 28.4 56.0 76.1 17.3 58.5
Pensioners 21.8 47.7 31.9 39.3 61.0 11.9 40.1
Total 39.9 49.9 39.0 50.0 59.3 15.1 50.0

Age of Respondent (mean Age of Respondent (mean rank)rank)
Basic needs domain
Income domain
Durables/Property domain
INDEX-1(basic) Housing
domain
Subjective welfare domain
INDEX-3
18-24 51.5 53.2 43.4 57.7 58.0 18.5 57.3
25-34 53.2 52.6 40.8 57.2 58.9 14.7 56.4
35-44 44.6 48.4 41.5 52.2 56.6 15.1 51.5women 45-54 men 45-59 40.7 52.3 41.4 51.8 60.8 15.5 52.0women 55 & oldermen 60 & older 24.0 46.3 32.7 39.8 60.6 13.6 40.8
Total 39.9 49.9 39.0 50.0 59.3 15.1 50.0
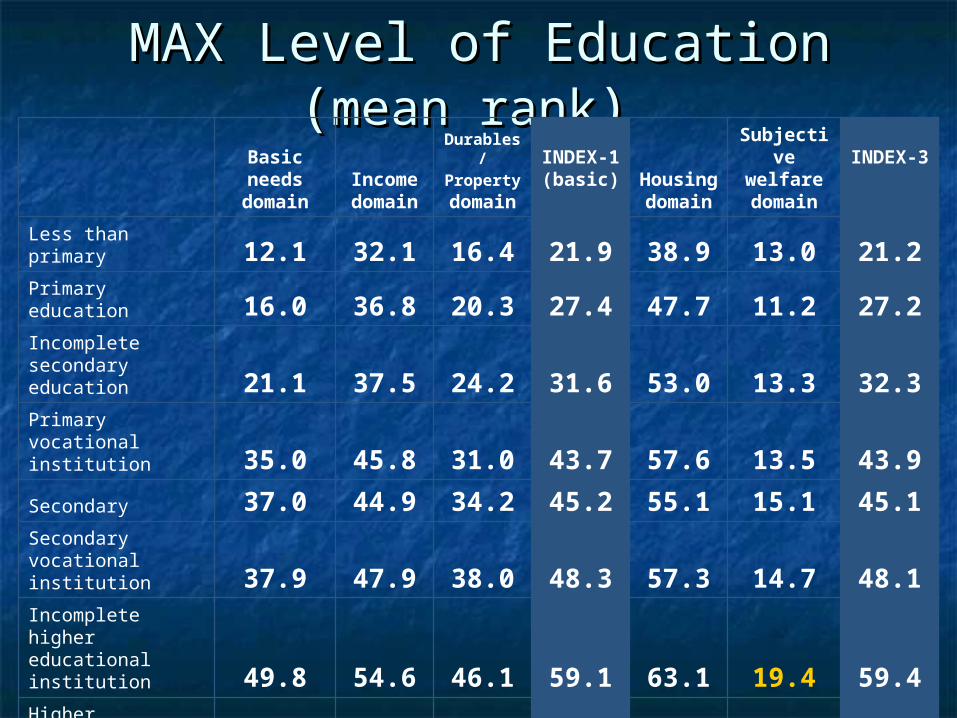
MAX Level of Education (MAX Level of Education (mean mean rankrank) )
Basic needs
domainIncome domain
Durables/ Property domain
INDEX-1(basic) Housing
domain
Subjective welfare domain
INDEX-3
Less than primary 12.1 32.1 16.4 21.9 38.9 13.0 21.2
Primary education 16.0 36.8 20.3 27.4 47.7 11.2 27.2Incomplete secondary education 21.1 37.5 24.2 31.6 53.0 13.3 32.3Primary vocational institution 35.0 45.8 31.0 43.7 57.6 13.5 43.9
Secondary 37.0 44.9 34.2 45.2 55.1 15.1 45.1Secondary vocational institution 37.9 47.9 38.0 48.3 57.3 14.7 48.1Incomplete higher educational institution 49.8 54.6 46.1 59.1 63.1 19.4 59.4Higher educational institution 55.6 62.7 53.2 66.1 68.3 17.1 66.3
Postgraduate course 63.2 69.1 62.8 73.6 77.6 19.6 74.8
Total 39.9 49.9 39.0 50.0 59.3 15.1 50.0

MAX Professional Status (MAX Professional Status (mean mean rankrank) )
Basic needs domain
Income domain
Durables/Property domain
INDEX-1(basic) Housing
domain
Subjective welfare domain
INDEX-3
Unskilled workers 25.9 38.9 26.0 35.1 55.6 13.8 36.0
Semi-skilled workers 40.7 46.7 36.2 48.2 53.3 14.1 47.3Highly -skilled workers in industry or agriculture 42.0 51.7 34.5 50.5 58.6 15.1 50.5Employees of the service sector and employees involved in information processing 46.8 52.2 41.3 55.0 58.2 15.5 54.5
Medium specialists 54.1 60.4 47.8 62.9 62.4 16.8 62.2Top specialists (including military) 56.0 63.0 52.1 66.2 65.0 15.8 65.7
Heads 76.0 67.3 70.3 80.1 69.5 24.9 79.9
Total 48.5 55.1 43.5 57.2 60.4 15.9 56.8
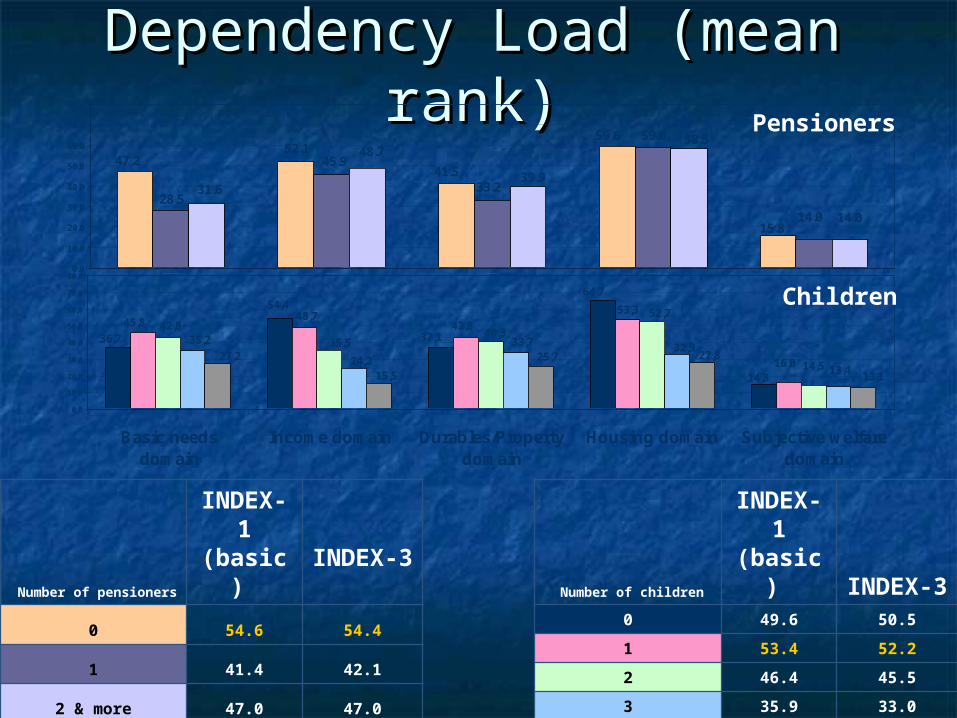
Dependency Load (mean Dependency Load (mean rank)rank)
59.0
15.8
59.6
47.241.5
52.1
14.028.5
45.9
33.2
14.0
58.5
31.6
48.7
39.9
0.0
10.0
20.0
30.0
40.0
50.0
60.0
70.0
80.0
C a p a b i l i t i e s d o m a i n I n c o m e d o m a i n P r o p e r t y d o m a i n H o u s i n g d o m a i n S u b j e c t i v e d o m a i n
0 1 2 и более
Number of children
INDEX-1(basic) INDEX-3
0 49.6 50.5
1 53.4 52.2
2 46.4 45.5
3 35.9 33.0
4 & more 25.9 23.8
Total 50.0 50.0
Pensioners
Number of pensioners
INDEX-1(basic)
INDEX-3
0 54.6 54.4
1 41.4 42.1
2 & more 47.0 47.0
Total50.0 50.0
53,3
14,8
64,7
36,7 37,1
54,4
16,0
45,848,7
42,8
14,5
52,742,8
35,540,3
13,4
32,935,2
24,2
33,7
13,1
27,827,2
15,5
25,7
0,0
10,0
20,0
30,0
40,0
50,0
60,0
70,0
80,0
Basic needsdomain
Income domain Durables/Propertydomain
Housing domain Subjective welfaredomain
01234 и более
Children

III. Empirical ApplicationsIII. Empirical Applications

Simulation of child birth Simulation of child birth intentions using the Welfare intentions using the Welfare
INDEXINDEX
B Sig. Exp(B)
INDEX-1 (basic) 0.01 0.03 1.01
Good health in comparison with bad health 1.83 0.00 6.24
Number of rooms per capita 0.34 0.04 1.40
Duration of marriage -0.12 0.00 0.88
Number of children under 18 years in household -0.72 0.00 0.49
CONST -1.94 0.01 0.14Number of cases - 3110; Log Likelihood = 620.503
Sample: Women under 45 years
Dependent variable: Intention to give birth to a child in the next three years
Income PC 0.00 0.67 1.00

Thank you!Thank you!