Measure RR Bond Implementation - bart.gov
39
Measure RR Bond Implementation BART Board May 11, 2017
Transcript of Measure RR Bond Implementation - bart.gov

Measure RR Bond Implementation
BART BoardMay 11, 2017
Investment Summary
2

Near Term Project Delivery Criteria
•Urgent Fix-it-First Needs
•Critical Path Activities on Major Core Capacity Improvement Projects
• Shovel Ready Projects
• Early Engineering on Long Lead Projects
3

Bond Project Selection Criteria
• Started with our Risk Register using industry Asset Management principles
•Created a Capital Needs Inventory (CNI)
• Evaluated risks in CNI relative to:• Safety, likelihood, impact, reliability, efficiency,
regulation compliance, human interface, sustainability, and time criticality
• Identified Scope/Schedule/Estimate
4

Renew Track – $625 Million
5

6
Renew Track
Scope:• Replace 90 miles of track• New Wheel Profile Interface• Rebuild Inter-lockings
Total Program: $625 M
Measure RR Cashflow Forecast ($ Millions)
Source: BART
Project Thru FY18 FY19 Total
Rail Replacement $35.9 $28.3 $64.2
New Wheel Interface $1.5 $2.5 $4.0
M03 Interlocking $4.5 $3.0 $7.5
C55 Interlocking $2.0 $9.5 $11.5
C35 Interlocking $2.0 $4.0 $6.0
Total $45.9 $47.3 $93.2

Renew Power – $1.225 Billion
7
8
Renew power – Cable replacement
Scope: Replace 34.5 kV Cable system-wide
Total Program: $488 M
Measure RR Cashflow Forecast ($ Millions)
Source: BART
Project Thru FY18 FY19 Total
M-Line Cable Replacement $29.7 $47.9 $77.6
A-Line Cable Replacement $4.5 $0.0 $4.5
C-Line Cable Replacement $5.5 $3.0 $8.5
R-Line Cable Replacement $1.6 $7.0 $8.6
Total $41.3 $57.9 $99.1

9
Renew power – Substation replacement
Scope:
Replacement 28 Substations
Total Program: $301 M
Measure RR Cashflow Forecast ($ Millions)
Source: Thomas Hawk –https://www.flickr.com/photos/thomashawk/96565503/in/album-72157603647764828/
Project Thru FY18 FY19 Total
ASL/KTE Substations $7.1 $10.4 $17.5
Design/Engineering $11.6 $6.3 $16.9
Total $18.7 $16.7 $35.4

10
Renew power – New Substations
Scope:
2 New added capacity substations
• Civic Center
• Montgomery
Total Program: $41.90 M
Measure RR Cashflow Forecast ($ Millions)
Source: Thomas Hawk –https://www.flickr.com/photos/thomashawk/96565503/in/album-72157603647764828/
Project Thru FY18 FY19 Total
Civic Center-Design $3.5 $2.9 $6.4
Mont.-Design $3.5 $2.9 $6.4
Total $7.0 $7.0 $12.8

11
Renew power – Electrical Systems
Scope:• TBT Generator & switchgear replacement• Uninterruptible Power Supply (UPS) Train Control • Tunnel Lighting • Station Fire Alarm replacement• Station Emergency Lighting
Total Program: $225 M
Measure RR Cashflow Forecast ($ Millions)
Project Thru FY18 FY19 Total
TBT Generator $6.5 $12.5 $19.0
UPS Train Control Room $4.0 $5.5 $9.5
Tunnel Lighting $3.0 $13.0 $16.0
Station Lighting $4.0 $5.0 $9.0
Design/Engineering $1.6 0.0 $1.6
Total $19.1 $36.0 $55.1

Renew mechanical infrastructure –$135 Million
12

13
Renew mechanical infrastructure –Mechanical Infrastructure
Scope:• Storm Water Treatment• Fire services at Yards• Replace HVAC in Facilities• Fire suppression at Lake Merritt Admin building• Replace Lake Merritt Computer Room Cooling UnitTotal Program: $135 M
Measure RR Cashflow Forecast ($ Millions)
Project Thru FY18 FY19 Total
Storm Water $0.2 $0.0 $0.2
Yard Fire Services $3.5 $3.5 $7.0
Backflow Preventers $0.5 $1.0 $1.5
LMA Cooling $0.4 $0.0 $0.4
Coverboard Replacement $0.5 $1.0 $1.5
Design/Engineering $1.9 $0.0 $1.9
Total $7.0 $5.5 $12.5

Repair tunnels & structures –$570 Million
14

15
Repair tunnels and structure –Structures
Scope:• Replace TBT Cross Passage Doors• Waterproof Tunnels & Structures• Fall Protection• Wayside Regulatory Signage• Platform Edge Structure RenewalTotal Program: $451.2 M
Measure RR Cashflow Forecast ($ Millions)
Source: Bart
Project Thru FY18 FY19 Total
TBT Cross Passage $7.6 $1.5 $9.1
Waterproof Tunnels & Structures
$2.5 $2.0 $4.5
Fall Protection $1.6 $2.7 $4.3
Wayside Signage $0.5 $0.7 $1.2
Platform Edges $0.3 $0.3 $0.6
Total $12.5 $7.2 19.7

16
Repair tunnels and structure – Transbay Tube (TBT) Retrofit options
Scope:
Full retrofit of 7 additional TBT sections
Total Program: $53.75 M
Measure RR Cashflow Forecast ($ Millions)
Project Thru FY18 FY19 Total
TBT Retrofit Options
$1.6 $8.7 $10.3

17
Repair tunnels and structure – Upper A-Line Seismic Operability Upgrade
Scope:
Preliminary engineering of the Upper A-Line retrofit (from Lake Merritt to Coliseum)
Total Program: $5 M
Measure RR Cashflow Forecast ($ Millions)
Source: Clark Construction - https://www.clarkconstruction.com/our-work/projects/barts-earthquake-safety-project
Project Thru FY18 FY19 Total
Upper A-LineRetrofit PE
$2.0 $2.0 $4.0

18
Repair tunnels and structure – Berkeley Hills Tunnel (BHT) Creep
Scope:
• Excavate interior lining of BHT tunnel
• Realign the trackway
Total Program: $60 M
Source: Jeramiah Cox - http://www.subwaynut.com/bart/macarthur/macarthur14.jpg
Measure RR Cashflow Forecast ($ Millions)
Project Thru FY18 FY19 Total
BHT Creep Repair $3.0 $7.8 $10.8

Replace train control and other infrastructure to increase peak
capacity – $400 Million
19

20
Train control and other major system infrastructure – Train Control Modernization Program (TCMP)
Scope:
Upgrade Legacy train control system to Communication-Based Train Control (CBTC)
Total Program: $396M (BART share of $915M Total project)
Measure RR Cashflow Forecast ($ Millions)
Source: Bart
Project Thru FY18 FY19 Total
TCMP $0.0 $2.0 $2.0

21
Other major system infrastructure –New Starts (Core Capacity)
Scope:• Design/Engineering for expanded yard storage
for increased fleet (HMC – Phase II) • Design/Engineering for new traction power (TP)
substation at Richmond Yard, Pleasant Hill (Minert Ave.), and Oakland 34th St.
Total Program: $6.2 M
Measure RR Cashflow Forecast ($ Millions)
Source: Bart
Project Thru FY18 FY19 Total
HMC Ph II Design $4.6 $1.0 $5.6
Richmond Traction Power Design
$0.2 $0.0 $0.2
PH Traction Power Design
$0.2 $0.0 $0.2
Oakland Traction Power Design
$0.2 $0.0 $0.2
Total $5.2 $1.0 $6.2
Renew Stations – $210 Million
22

23
Renew Stations – Escalator Renovation and Canopy Program
Scope:
• Replace platform and street escalators
• Design and construct escalator/stair canopies
Total Program: $ 190 M
Measure RR Cashflow Forecast ($ Millions)
Source: Bart
Project Thru FY18 FY19 Total
Escalator/Canopy $3.3 $12.7 $15.0

24
Renew Stations – Station Modernization
Scope:
• 4 station modernization conceptual plans
• 2 station modernization detailed design /construction
Total Program: $ 20 M
Measure RR Cashflow Forecast ($ Millions)
Source: Bart
Project Thru FY18
FY19 Total
Conceptual Plans $1.1 $0.4 $1.5
Design/Construction
$0.2 $0.5 $0.7
Total $1.3 $0.9 $2.2

Station Access – $135 Million
25

Measure RR: Expand Opportunities to Safely Access Stations
BART Station Access Policy Goals
A. Safer, Healthier, Greener. Advance the region’s safety,
public health, and greenhouse gas (GHG) and pollution-reduction goals.
B. More Riders. Invest in station
access to connect more riders cost effectively, especially where and when BART has available capacity.
C. More Productive and Efficient. Manage access
investments, programs, and current assets to achieve goals at the least cost.
26
D. Better Experience. Be
a better neighbor, and strive for an excellent customer experience, including on the first and last mile of the trip to and from BART stations.
E. Equitable Services. Invest in access
choices for all riders, particularly those with the fewest choices.
F. Innovation and Partnerships. Be an
innovation leader, and establish durable partnerships with municipalities, access providers, and technology companies.
BART Board adopted June 9, 2016

Measure RR: Expand Opportunities to Safely Access Stations
Station Access Performance Measures
27
Policy
Performance Measures
Work Plan
Implement Work Plan Tasks
Measures address: • Mode-share
• Pedestrian and bicycle safety
• Ridership
• Parking access & management
• Carpool utilization
• Secure bike parking
• Intermodal access
• Collaboration
• Access for people of all abilities
• Equitable access
• Innovation

Active Access
52%Shared Mobility
32%
Drive & Park16%
2025 TARGET ACCESS MODE SHARE
Active Access
44%
Shared Mobility
29%
Drive & Park27%
2015 ACCESS MODE SHARE*
Active Access
35%
Shared Mobility
31%
Drive & Park34%
2008 ACCESS MODE SHARE
Measure RR: Expand Opportunities to Safely Access Stations
Access Mode Share Targets (home-based)
28
*Preliminary 2015 Station Profile Survey DataActive Access: Walk, Bike
Shared Mobility: Transit, Shuttle, TNC, Drop-Off, Carpool
Drive & Park: Drive Alone

Seniors, People with Disabilities,
$24 , 18%
Active Access, $77 , 57%
Shared Mobility , $25 , 18%
Drive & Park, $9 ,
7%
Measure RR: Expand Opportunities to Safely Access Stations
Proposed Allocation by Mode ($135 M)
Safe Routes to BART, $25
BART Active Access Projects, $52
• Invest to meet policy objectives
• Invest to meet targets• Home-based mode-share
targets require estimated:
• 43,000 increase in active access riders
• 22,000 increase in shared mobility riders
• Reduction of 14,000 drive alone riders (shift to other modes, carpool)
29

Measure RR: Expand Opportunities to Safely Access Stations
Project Examples by Mode
30
Active Access
• Safe Routes to BART Program*
• Bike stations
• Bike Channels
• Regional connections
• Station Area Access: • Plazas, pathways,
sidewalks, lighting• Intersection
improvements• Placemaking / Art
• Accessible faregates
• Wayfinding
Shared Mobility
• Comprehensive Redesign at priority stations (coordinated with TOD)
• Upgrade Transit Connections (benches, lighting, ADA improvements)
Drive & Park
• Wayfinding
• Improve safety/security and enforcement
• Strategic Parking Expansion
Seniors & People with Disabilities• Fire Alarm
Strobe Lights
• Hearing Loop
• Beacons
• Braille
• Handrails
• Elevator controls/ improvements
*Confirm eligible for bond funding
Project Examples by Mode30

• Multimodal Design Guidelines
• N. Concord to Antioch BART Access Study
• Pedestrian and Bicycle Network Gap Closure Study
• Curb Use Study
• Bike Parking Capital Plan
• Accessibility Improvement Program
• Interdepartmental Staff Apply Board Adopted Policy to Prioritize Projects Every 6 Months
• Project Selection based on policy-based criteria
Project Selection & Implementation
Ongoing Planning & Project Identification
Planning Efforts Underway
Advance & Construct Pipeline Projects
31
Measure RR: Expand Opportunities to Safely Access Stations
Project Delivery Approach
• Station Area Improvements: MacArthur Station Access: Plaza & 40th Street Underpass Lighting, Concord Plaza, Coliseum & Fremont connections, WSX Ped Bridge, LM Plaza
• Bike stations: LM, D/P, Fremont, SL, 19th St, WO, NB, Rockridge, Ashby, El Cerrito del Norte Regional connections: Ohlone Greenway at El Cerrito del Norte, Iron Horse Trail at D/P
• Real-time Parking displays, P/BP Drop-Off, El Cerrito del Norte Intermodal

Measure RR: Expand Opportunities to Safely Access Stations
Safe Routes to BART (SR2B)
• Fill funding gaps in active access projects • Annual Project Selection
• Locally led projects that connect BART to other destinations/hubs• Regional trails• Job Centers• High-density Residential Areas • Planned TOD
• Match up to 30%
• Projects must have conceptual design completed
• Pilot in 2018 with $5 million program
• SR2B Committee Selects Projects Based on Criteria & Notifies Board of Project Selection
32

33
Expand Opportunities to Safely Access Stations
• Scope:⁻ Achieve Station Access Policy Goals & Targets ⁻ Improve Active Transportation and enhance
Access for Seniors & People with Disabilities⁻ Renew Transit Transfer Facilities ⁻ Improve Parking Availability
• Total Program: $135 M⁻ Funds will leverage other sources
Measure RR Cashflow Forecast ($ Millions)
Project Thru FY18
FY19 Total
Active Access $8.0 $13.6 $21.6
Shared Mobility $2.2 $3.3 $5.5
Drive & Park $2.3 $3.1 $5.4
Seniors & Disabled $1.5 $3.0 $4.5
Total $14.0 $23.0 $37.0

Relieve crowding/system redundancy– $200 Million
34

35
Relieve crowding/system redundancy –Transbay Crossing Phase 2
• Scope:
⁻ Partner with mainline rail agencies
⁻ Examine governance and funding
⁻ Conduct regional market analysis
⁻ Develop service plan for rail networks
⁻ Develop operations plan and detailed transportation model
⁻ Initiate conceptual engineering
• Initial Phase: $10 M
Measure RR Cashflow Forecast ($ Millions)
Project Thru FY18 FY19 Total
Transbay Crossing $2.9 4.0 $6.9
36
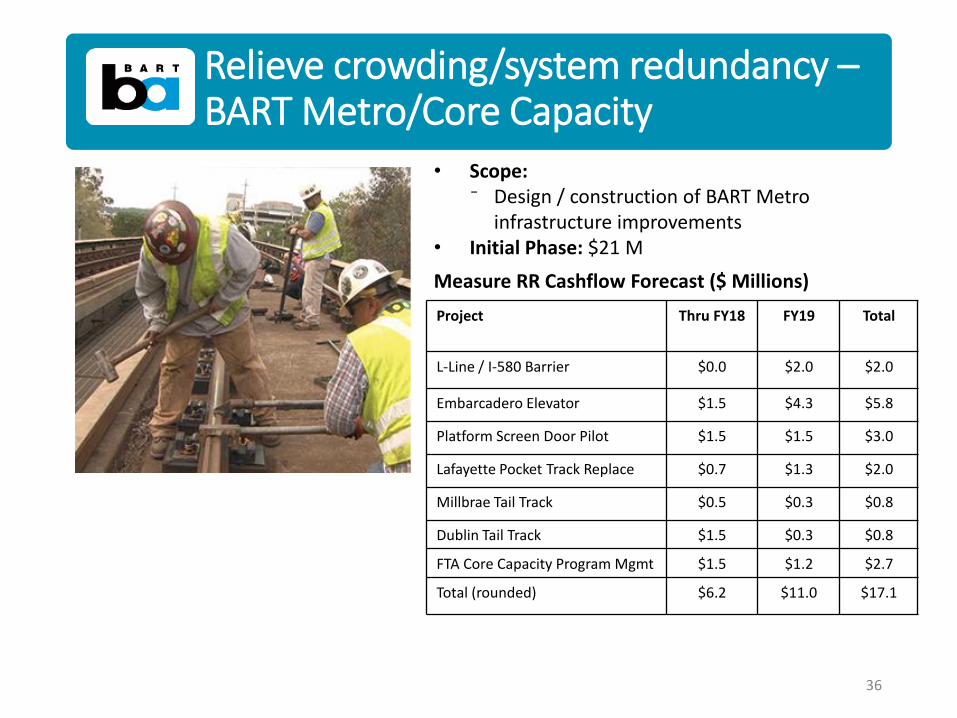
Relieve crowding/system redundancy –BART Metro/Core Capacity
• Scope:⁻ Design / construction of BART Metro
infrastructure improvements• Initial Phase: $21 M
Measure RR Cashflow Forecast ($ Millions)
Project Thru FY18 FY19 Total
L-Line / I-580 Barrier $0.0 $2.0 $2.0
Embarcadero Elevator $1.5 $4.3 $5.8
Platform Screen Door Pilot $1.5 $1.5 $3.0
Lafayette Pocket Track Replace $0.7 $1.3 $2.0
Millbrae Tail Track $0.5 $0.3 $0.8
Dublin Tail Track $1.5 $0.3 $0.8
FTA Core Capacity Program Mgmt $1.5 $1.2 $2.7
Total (rounded) $6.2 $11.0 $17.1

Cashflow DrawdownSummary thru FY19
37

38
Measure RR Cashflow by Program Category
Program Thru FY18 FY19 Total
Renew Track $45.9 $47.3 $93.2
Renew Power Infrastructure $85.2 $117.2 $202.4
Repair Tunnels & Structures $19.1 $25.6 $44.7
Renew Mechanical $7.0 $5.5 $12.5
Replace Train Control/Increase Capacity $5.2 $3.0 $8.2
Renew Stations $4.6 $13.6 $18.2
Expand Safe Access to Stations $14.0 $23.0 $37.0
Design/Engineer to Relieve Crowding $9.1 $14.9 $24.0
Total $190.1 $250.1 $440.2
Implementation Next Steps – In Progress
• Establish Bond Oversight Committee
• Adopt Small Business Program Modification
• Award 6 General Engineering Service Contracts (GECs) totaling $150 M
• Complete hiring plan
• Determine work space needs
• Develop work flow master plan
39