Measure of mood 1 - Welcome to USQ ePrints - USQ … of mood 6 confirmatory factor analysis. The...
39
Measure of mood 1 Development and Validation of a Mood Measure for Adolescents Peter C. Terry, Andrew M. Lane, Helen J. Lane, and Lee Keohane Accepted for publication in Journal of Sports Sciences Keywords: Measurement, Sport, Structural Equations, Model Testing, Emotions Running Head: Measure of mood
-
Upload
trinhhuong -
Category
Documents
-
view
220 -
download
0
Transcript of Measure of mood 1 - Welcome to USQ ePrints - USQ … of mood 6 confirmatory factor analysis. The...
Measure of mood
1
Development and Validation of a Mood Measure for Adolescents
Peter C. Terry, Andrew M. Lane, Helen J. Lane, and Lee Keohane
Accepted for publication in Journal of Sports Sciences
Keywords: Measurement, Sport, Structural Equations, Model Testing, Emotions
Running Head: Measure of mood
Measure of mood
2
Development and Validation of a Mood Measure for Adolescents
Measure of mood
3
Abstract
The purpose of the present study was to develop and validate a shortened version of
the Profile of Mood States (McNair et al., 1971) suitable for use with adolescents.
The Profile of Mood States-Adolescents (POMS-A) was administered to 1,693
participants from two populations; (a) school children, and (b) young athletes.
Confirmatory factor analysis supported the factorial validity of a 24-item six-factor
model using both independent and multisample analyses. Correlations of POMS-A
scores with previously validated inventories, which were consistent with theoretical
predictions, provided evidence of criterion validity. It is proposed that the POMS-A
is a valid instrument for the assessment of mood in adolescents.
Measure of mood
4
Introduction
The quest to understand the psychology of emotion has generated persistent
investigation of the construct of mood. Substantial attention has been paid to self-
reported mood states and their attendant impact upon behaviour. Such research
relies heavily upon parsimonious methods of assessing transient emotions. To date,
psychometric development in this area has focused primarily upon adult populations,
particularly students and psychiatric out-patients. The purpose of the present study
was to develop and validate an inventory for assessing mood states that can be used
with adolescent populations in the context of classroom and athletic environments.
There are at least three arguments to suggest that there is a need to develop such a
measure.
First, there has been considerable research to examine mood among
adolescents. Mood has typically been assessed using the Profile of Mood States
(POMS; McNair et al., 1971). The POMS describes six subcomponents of the
overall mood construct: Anger, Confusion, Depression, Fatigue, Tension, and
Vigour. The factor structure of the POMS and the associated tables of normative
values were derived from groups of adult students and psychiatric out-patients. In
the test manual, POMS is recommended for use with “subjects aged 18 and older
who have had at least some high school education” (McNair et al., 1971, p. 6). No
data from individuals under the age of 18 were used in the original validation studies
and therefore the degree to which the POMS and its derivatives are suitable for
research involving young participants is unknown.
Despite this limitation, the POMS has been used as a research tool with
adolescents in physical education (Green et al., 1995; Newcombe and Boyle, 1995),
Measure of mood
5
sport environments (Goss, 1994; Fry et al., 1995), and clinical settings (Walker and
Sprague, 1988). Further, Hollander et al. (1995) proposed using the POMS to screen
young athletes for mood changes as a pre-cursor for overtraining syndrome (see
Budgett, 1990). Given the research interest in mood in adolescents and the extent to
which tests of theory rely upon valid measurement, demonstration of the construct
validity of mood measures in the population of interest is an imperative.
Second, the original 65-item POMS has been criticised for taking too long to
complete (Shacham, 1983; Grove and Prapavessis, 1992; Curren et al., 1995), a
criticism which would apply equally to the 72-item bipolar version (Lorr and
McNair, 1984). This point is particularly relevant when mood is assessed in an
ecologically valid setting, such as before competition or at the start of a lesson,
where brevity is paramount. This has contributed to the development of several
shortened versions of the POMS (Grove and Prapavessis, 1992; McNair et al., 1992;
Shacham, 1983). However, it is important to recognise that completion time is
influenced not just by the number of items but also their comprehensibility. Items in
the original POMS and its shortened derivatives were generated from the responses
of undergraduate students who were all aged 18 years or over. It has also been noted
(Grove and Prapavessis, 1992) that some items of the POMS have a distinct North
American orientation, such as “bushed” and “blue”, which may require explanation
in other cultural contexts.
Third, recent developments of computer software to test the factor structures
of psychological questionnaires have prompted researchers (see Hendrick and
Hendrick, 1986; Schutz and Gessaroli, 1993; Bentler, 1995; Thompson and Daniel,
1996) to emphasise the benefits of structural equation modelling techniques such as
Measure of mood
6
confirmatory factor analysis. The traditional method of choice to demonstrate
factorial validity has been exploratory factor analysis techniques. Previously, it was
suggested that the replication of factors through exploratory analyses among
disparate samples was evidence of factorial validity (Gorsuch, 1983; Kerlinger,
1979). However, contemporary views suggest that a more rigorous procedure to test
the generalisability of a measure is to use multisample confirmatory factor analysis
(CFA) to test the extent to which data support hypothesised relationships specified in
a prior model across a number of different samples (Bentler, 1995; Tabachnick and
Fidell, 1996; Thompson and Daniel, 1996). To date, neither the POMS (McNair et
al., 1971), nor its shortened versions (Grove and Prapavessis, 1992; McNair et al.,
1992; Shacham, 1983) have been scrutinised using either single-sample or multi-
sample CFA.
In summary, there is a need for a shortened version of the POMS developed
specifically for younger populations and therefore the purpose of the present study
was to develop and validate such an inventory.
Research Strategy
The validity of a self-report measure is defined as the “degree to which a test
or instrument measures what it purports to measure” (Thomas and Nelson, 1990, p.
527). A self-report measure is considered valid when it has demonstrated content
validity, factorial validity, criterion validity, and construct validity (see Anastasi and
Urbina, 1997; American Psychological Association (APA), 1974; Thomas and
Nelson, 1990). According to Anastasi and Urbina (1997), construct validity is of
paramount importance, and can be seen as “inclusive validity, insofar as it specifies
what the test measures” (p.114). Content, factorial, and criterion validation
Measure of mood
7
procedures are among the sources of information which contribute to the definition
and understanding of the constructs assessed by the self-report measure and therefore
act as the basis by which construct validity is judged.
An important research decision in the development of a questionnaire is the
number of items included in each factor, particularly when brevity is important. It is
suggested that, theoretically, there are an infinite number of items potentially
available for the measurement of any construct (Anastasi and Urbina, 1997).
Consequently, the strategy for identifying a construct typically starts with a relatively
large pool of items that is reduced through subsequent analyses. Kline (1993)
cautioned that item reduction might yield a factor containing items with an extremely
similar meaning. He suggested that this may lead to two issues regarding the validity
of the factor. The first is that the factor might show high validity coefficients, and
thereby show evidence of construct validity. Second, the factor might assess a
limited dimension of the construct, and therefore the factor should be re-labelled to
reflect the dimension of the construct it is assessing. Therefore, in the present study,
validation of the inventory was done over a series of different stages with each stage
acting as a check on the findings from the previous stage.
As the purpose of the study was to develop a short questionnaire, this raises
the question on the optimum number of items needed to assess a construct. Jackson
and Marsh (1996) argued that the optimum number of items needed to describe a
construct in a short questionnaire is four. Further, Bollen (1989) cautioned against
reducing the number of items in a factor to less than three. From a statistical
perspective, Watson and Clark (1997) reported that factors with less than four items
typically fail to yield an internal consistency (alpha) coefficient (Cronbach, 1951)
Measure of mood
8
above the generally accepted criterion value of 0.70 (Tabachnick and Fidell, 1996).
As alpha coefficients are influenced by the number of items in a factor, it is
suggested that each factor of a questionnaire should contain the same number of
items to facilitate accurate comparisons of internal consistency. Therefore, the aim
of the current research was to produce a version of the POMS with six factors of four
items each.
The research process had three stages. First, to establish content validity, the
suitability of an initial item pool was assessed by a panel of experts and by school
children. Second, to establish factorial validity, the hypothesised factor structure of
the item pool was assessed using CFA of the mood responses of school children. A
revised model was then tested among samples of school children and young athletes
simultaneously using multisample CFA. The third stage, to establish criterion
validity, tested the extent to which the subscales of the questionnaire correlated with
previously validated measures.
Stage 1: Content Validity
Content validity refers to the extent to which items represent the construct
they are purported to measure. A standard approach to establishing content validity
is to use experts (e.g., McNair et al., 1971; Martens, et al., 1990) or a representative
sample of participants (e.g., Jones et al., 1990) or both (e.g., Widmeyer et al., 1985)
to select or confirm items which best describe the construct in question. The
preliminary stages in developing the Profile of Mood States-Adolescents (POMS-A)
involved experts and school children in the process of refining the selection of
appropriate mood descriptors.
Measure of mood
9
An initial item pool of 83 mood descriptors was established comprising the
65 adjectives derived from the original POMS plus, where it was suspected that
existing items might prove inappropriate for adolescents, 18 additional adjectives
taken from a thesaurus. Ten teachers of English at secondary schools identified
those adjectives whose meaning they believed “would be understood by the vast
majority of children in the 14-16 age group”. Items were eliminated if four or more
teachers identified them as inappropriate, resulting in 13 items being discarded.
To maximise comprehensibility among children and retaining the original
conceptualisation of the mood construct, a sample of 50 children (age range: 14 - 15
years) rated the extent to which the remaining 70 items described the original factors
(Anger, Confusion, Depression, Fatigue, Tension, and Vigour). Participants
identified items that, according to their understanding, were closest in meaning to the
six mood factors. The top seven items under each of the six headings were selected
for an initial 42-item inventory and were assigned randomly to order. The rationale
for using the top seven items was to retain a sufficient number of items to allow
further item reduction following CFA among a larger sample. It was also judged,
based on the characteristics of the Cronbach alpha estimates described earlier, that
each factor should contain the same number of items.
Stage 2.1: Preliminary test of factorial validity
CFA was used to test factorial validity. Schutz (1994) argued that when
researchers have a hypothesised model to test, the first test of factorial validity
should be confirmatory. As CFA is a test of theory, it is important to also assess the
theoretical integrity of the proposed item groupings. To this end, the nature of the
six factors is described and proposed relationships among factors are hypothesised.
Measure of mood
10
Anger is typified by feelings which vary in intensity from mild annoyance or
aggravation to fury and rage and is associated with arousal of the autonomic nervous
system (Spielberger, 1991). Confusion is proposed to be a feeling state characterised
by feelings of bewilderment, uncertainty, and is associated with a general failure to
control attention and emotions. Depression is associated with a negative self-schema
characterised by themes such as hopelessness, personal deficiency, worthlessness,
and self-blame (Beck and Clark, 1988). Fatigue is typified by feelings of mental and
physical tiredness. Tension is typified by feelings such as nervousness,
apprehension, worry, and anxiety. Vigour is typified by feelings of excitement,
alertness, and physical energy.
It was hypothesised that Depression would show moderate positive
relationships with Anger, Confusion, Fatigue, and Tension, and a weak inverse
relationship with Vigour. Vigour would show a moderate inverse relationship with
Fatigue and be unrelated to Anger, Confusion, and Tension. This pattern of
intercorrelations among mood dimensions has been found with both athletes (Grove
and Prapavessis, 1992; Terry and Slade, 1995) and students (McNair et al., 1971)
when mood is assessed using the “How do you feel right now” response set. A
general limitation of mood research in sport is that intercorrelations among POMS
dimensions have rarely been reported.
The research strategy at this stage was to use CFA to refine the 42-item, six
factor model by removing the three psychometrically weakest items in each scale,
and thereby produce an instrument of greater psychometric integrity. Model testing
involved two stages, the first stage tested the 42-item, six-factor model, and the
second stage tested a revised 24-item, six-factor model. It could be argued that the
Measure of mood
11
research strategy should test alternative models of mood, rather than refine the six-
factor model. In the present study, alternative models of mood would be explored at
stage if the POMS model of mood was rejected.
Method
Participants. Students at a secondary school1 in the suburbs of west London
(England) participated in a study to test the factor structure of an initial 42-item and a
revised 24-item version of the Profile of Mood States-Adolescents (POMS-A). The
school population had a mixed socio-economic and ethnic composition.
The sample comprised 416 children ranging from 14 to 16 years of age (M =
14.8 yr., SD = 1.0 yr.). In 48 cases, participants failed to respond to one or more
items and their responses were discarded. Therefore, 368 completed questionnaires
(Male = 199, Female = 169) were available for analysis.
Procedure. The inventory was completed by participants in a classroom
setting. Participants were asked to rate “How are you feeling right now” in terms of
the mood descriptors, e.g., “Worried”, “Unhappy”, etc. Responses were provided on
a scale from 0 (“not at all”) to 4 (“extremely”). To ensure consistency during data
collection, instructions were read from a prepared script. Further, a culturally-
appropriate alternative word list (c.f., Albrecht and Ewing, 1989) was available to
participants for reference in case mood descriptors could not be understood although
no participants referred to this list.
1 Most secondary schools in England teach students in the age range 11 - 18 years.
Measure of mood
12
Data Analysis.
CFA using EQS V5 (Bentler and Wu, 1995) was used to test the 42-item, six-
factor structure of mood. As multivariate non-normality was evidenced (Mardia’s
value = 117.50), data were analysed using the Maximum Likelihood (ML) Robust
estimation method (see Hoyle, 1995). The model specified that items were related to
their hypothesised factor with the variance of the factor fixed to 1. Anger,
Confusion, Depression, Fatigue, and Tension were allowed to inter-correlate.
Vigour was allowed to correlate with Depression and Fatigue only, as it was
hypothesised that the Vigour-Anger, Vigour-Confusion, and Vigour-Tension
relationships would not differ significantly from zero.
According to Hu and Bentler (1995), there is little agreement among
researchers about the best index of the overall fit of a model tested by confirmatory
factor analysis. Consequently, it has been suggested that researchers should report a
number of different fit indices (Hoyle and Panter, 1995). First, the chi2 : df ratio has
been proposed as a superior index to the chi-square because with large samples and
complex models there is a tendency for chi-square values to be inflated, causing
good fitting models to be rejected erroneously (Byrne, 1989). Although Byrne
(1989) suggested that a chi2 : df ratio of < 2 indicates an acceptable fit, researchers
have suggested examining fit indices which use the chi-square in conjunction with
other fit indices (see Hu and Bentler, 1995 for review).
Other fit indices used to assess the model included the Goodness-of-Fit Index
(GFI) and Adjusted Goodness-of-Fit Index (AGFI). The GFI and AGFI are indices
that “assess the relative amount of the observed variance and covariances accounted
for by the model” and, as such, are analogous to the R2 typically used in multiple
Measure of mood
13
regression (Hoyle and Panter, 1995, p. 166). The AGFI is similar to the GFI but
takes into account the complexity of the model. Hu and Bentler (1995) contend that
the GFI is the most reliable absolute fit index. The criterion value for an acceptable
fit is 0.90 for both indices.
Two incremental fit indices were also used to judge factorial validity, the
Non-Normed Fit Index (NNFI: Tucker and Lewis, 1973) and the Robust
Comparative Fit Index (RCFI: Bentler, 1990). The NNFI takes into account sample
size, hence is suggested to provide a better estimate of the fit of a model than the
Normed Fit Index when multivariate normality is violated. The RCFI evaluates the
adequacy of the hypothesised model in relation to the worst (independent) model. If
the hypothesised model is not a significant improvement on the independent model
the fit index will be close to zero (Bentler, 1995). These indices have been found to
effectively control for overestimation of chi2, under-estimation of incremental fit
indexes, and under-identification of errors when data are not normally distributed
(see West, Finch, & Curran, 1995). The criterion value for both incremental fit
indices is 0.90 (Bentler, 1995). Finally, the Root Mean Square Error of
Approximation (RMSEA; Steiger, 1990) was used as a measure of the extent to
which the model was supported per degree of freedom. Browne and Cudeck (1993)
proposed that a value of 0.05 or lower indicates a close fit, and values up to 0.08
represent a reasonable fit.
Multiple selection criteria were used in the process of identifying the best
four items per scale: a) the highest four factor loadings, b) the lowest error
measurements, and c) a Cronbach alpha coefficient above 0.70 for the resultant
factor. Previous research has used a similar strategy to reduce the number of items to
Measure of mood
14
produce a more parsimonious version of an existing questionnaire (see Jackson and
Marsh, 1996).
Results and Discussion
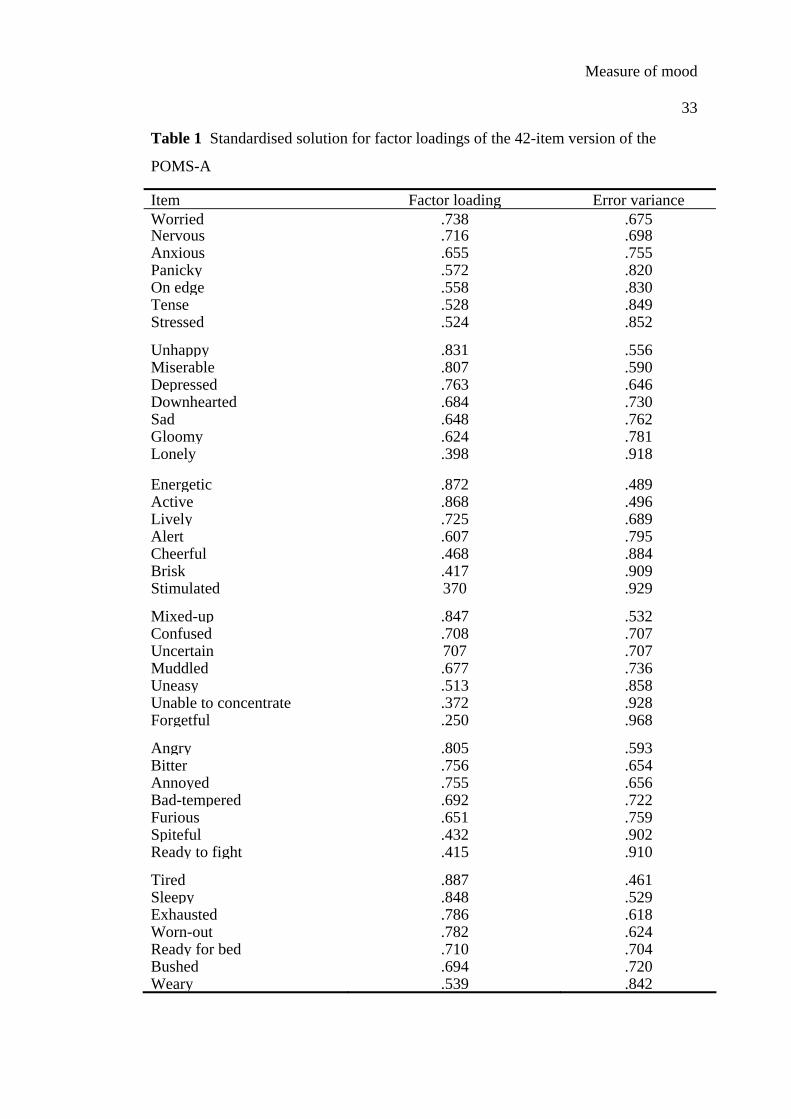
The purpose of this stage of the research was to test a 42-item and a 24-item
six-factor model of mood using confirmatory factor analysis. Results for the 42-item
model showed poor fit (GFI = 0.780; AGFI = 0.754; NNFI = 0.823; RCFI = 0.854)
except the Satorra-Bentler scaled chi2: df ratio of 1.48. The standardised solution
results (see Table 1) offered support for the hypothesised relationships between the
majority of the items although several items showed a weak relationship with their
hypothesised factor (“Forgetful”, “Lonely”, “Ready to fight”, “Spiteful”; and
“Stimulated”).
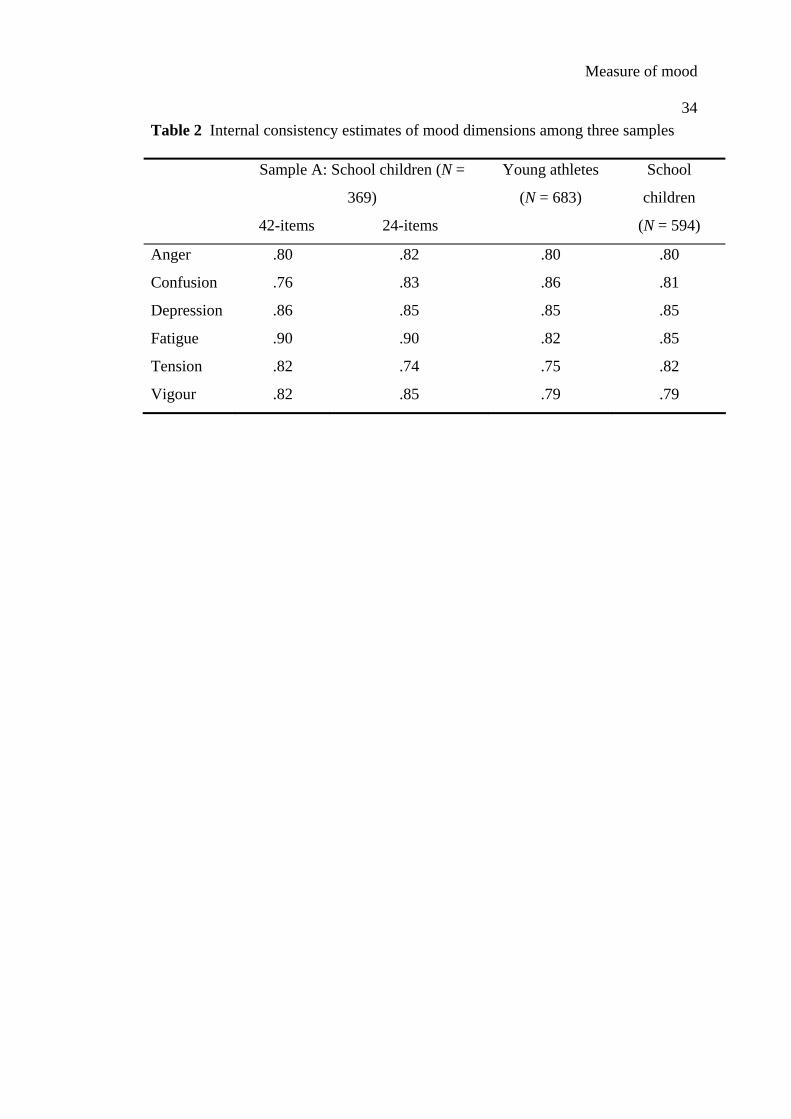
Following removal of the weakest three items from each scale, CFA results of
the revised 24-item POMS-A yielded acceptable fit indices for the NNFI (0.92),
RCFI (0.93), and RMSEA (0.06). The GFI (0.89) and AGFI (0.86) were below the
.90 criterion value. Cronbach alpha coefficients all exceeded the 0.70 criterion value
(see Table 2). Collectively, the results indicated that the 24-item, six-factor model
should go forward to the next stage of validation.
Stage 2.2: Test of the generalisability of the factor structure
The establishment of factorial validity involves demonstrating that the
hypothesised factor structure can be replicated in disparate samples. Only when such
consistency has been demonstrated can findings justifiably be extrapolated to other
populations (Taylor, 1987). In the present study, validity testing was extended to a
new sample of school children and a sample of young athletes. CFA was used to test
the extent to which the data from the two samples supported the relationships

Measure of mood
15
specified in the 24-item, six-factor model.
Measure of mood
16
Method
Participants
Sample 1 comprised 683 young athletes (Age: M = 14.7 yr., SD = 1.8 yr.;
Male: n = 301; Female: n = 382). Participants were from the sports of archery, field
hockey, judo, netball, soccer, table-tennis, track and field, trampolining, triathlon,
and volleyball. Sample 2 comprised 594 school children (M = 14.7 yr., SD = 1.4 yr.;
Male = 339, Female = 313).
Procedure
POMS-A was administered 1 hr. Before competition for the athletic sample
and at the start or the end of a class lesson for the school children. The remaining
procedures used to gather data replicated those used in Stage 2.1 of the research.
Results and Discussion
The chi2 : df ratio indicated an acceptable fit of the data to the model in both
samples (school children: chi2 : df ratio = 2.06; young athletes: chi2 : df ratio = 2.19).
The fit indices provided further support for the fit of the model in both samples with
fit indices above the .90 for the GFI (school children = 0.908; young athletes =
0.905), NNFI (school children = 0.919; young athletes = 0.901), RCFI (school
children = 0.925; young athletes = 0.912), and RMSEA (school children = 0.052;
young athletes = 0.062), although AGFI values were marginally below the .90
criterion value (school children = 0.884; young athletes = 0.881). Alpha coefficients
ranged from 0.75 to 0.86 indicating that the factors contain items which are
internally consistent (see Table 2).
The standardised solution showed that all factor loadings were higher than
0.50 except “Anxious” (.456) in the young athlete sample and “Alert” (.491) in the
Measure of mood
17
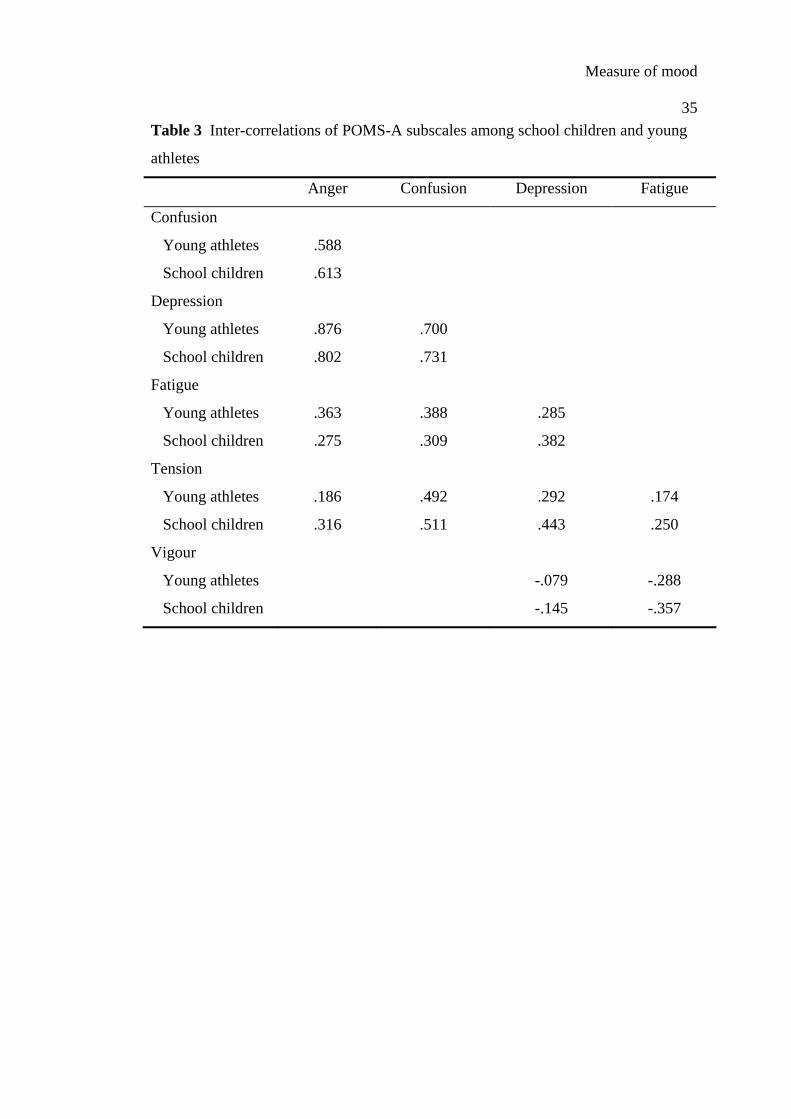
school children sample. Correlation coefficients among mood dimensions were
consistent with the hypothesised model (see Table 3). Depression showed moderate
to strong positive relationships with Anger, Confusion, Fatigue, and Tension, and a
weak inverse relationship with Vigour. Lagrange Multiplier Test results indicated
that the fit of the model would not be improved by allowing Vigour to correlate with
Anger, Confusion, and Tension.
The strength of the intercorrelations among factors was weaker than those
typically reported by researchers using the original POMS (see Grove and
Prapavessis, 1992; McNair et al., 1971, 1992; Terry and Slade, 1995). This suggests
that the POMS-A shows greater factorial independence than the original version.
Collectively, results strongly supported the factorial validity of the 24-item POMS-A
in the two samples independently. The next step in the validation process was to test
the hypothesised model using multisample analysis.
Stage 2.3: Multisample Analysis
Multisample CFA was conducted to investigate the strength of the factor
solution across the samples of young athletes (N = 683) and school children (N =
594) simultaneously. In multisample analysis, it is assumed that data from more than
one sample provide comparable information about the hypothesised model. This
assumption is tested by analysing data from different samples simultaneously to
verify the extent to which the model reproduces the data of each sample to within
sampling accuracy (see Bentler, 1995). As with one-sample confirmatory factor
analysis, chi2 statistics, the GFI, AGFI, NNFI, and CFI represent the extent to which
variance/covariance matrices from different samples are identical. It is important to
note that EQS V5 does not give Robust estimates in multisample analysis.
Measure of mood
18
In multisample confirmatory factor analysis, it is possible to test a number of
different hypotheses regarding the similarity of relationships across samples using
the Lagrange Multiplier (LM) Test. In multisample analysis, the LM Test examines
the extent to which the fit of the model would be improved if equality constraints
were removed. Following recommendations of Bentler (1995), a hierarchical
procedure was used to place equality constraints on hypothesised relationships. The
first multisample analysis tested the model with no equality in order to get a baseline
score on which to compare more restricted models. The second analysis placed
equality constraints on factor loadings. The third analysis placed equality constraints
on factor loadings and correlation coefficients between factors. It was hypothesised
that equality constraints on all relationships would hold between the two groups.
Prior to conducting multisample analyses, differences in the intensity of
mood responses between the two samples were examined. Demonstration of
differences in the intensity of mood lends support to the notion that the participant
groups derive from two different populations. Factor scores were calculated by
summing item scores within each factor; multivariate analysis of variance
(MANOVA) was then used to assess differences in the intensity of factor scores
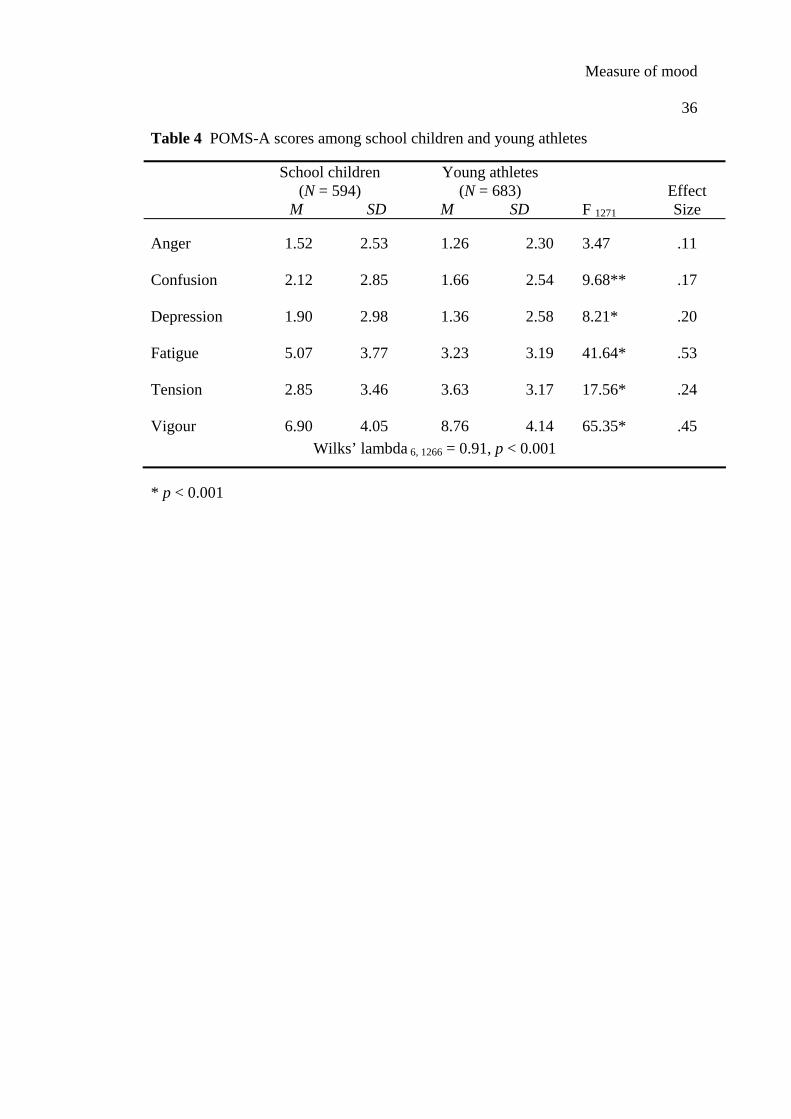
between the two samples. MANOVA showed significant differences in the intensity
of mood responses between school children and young athletes (Wilks’ lambda 6, 1266
= 0.91, p < 0.001, see Table 4). Univariate differences indicated that the group of
school children reported significantly higher Confusion, Depression, and Fatigue, but
lower Tension and Vigour scores than the young athlete group. Calculation of effect
sizes showed that the group differences were relatively small for Confusion,
Depression and Tension and moderate for Fatigue and Vigour (see Table 4).
Measure of mood
19
Differences between school children and young athletes in the intensity of
reported mood were consistent with results from a previous large scale between-
group comparison of mood responses (Terry and Lane, in press), which found that
adult athletes reported lower Anger, Confusion, Depression, Fatigue, and Tension
than adult students but higher Vigour scores. The higher Tension scores reported by
the young athletes in the present study can be attributed to the assessment of mood
prior to competition for that sample. Terry and Lane (in press) also found that
athletes reported higher Tension scores prior to competition than when away from
the competition environment. Abele and Brehm (1993) reported that mood changes
in competitive sport are typified by a decrease in Tension scores from the beginning
to the end of the period of competition. Collectively, the results of the MANOVA
confirmed significant variations in reported mood between school children and
young athletes, and thus support the notion that the two participant groups
represented disparate populations even though most of the young athletes would also
have been school children.
Results and Discussion
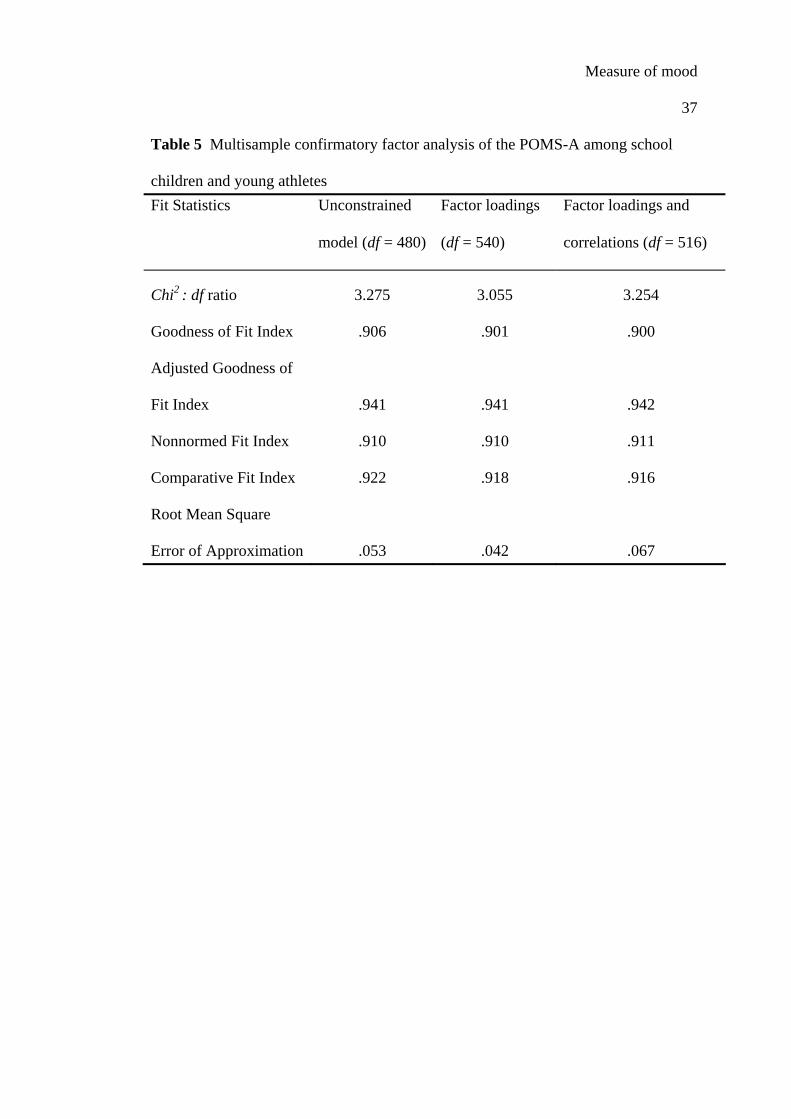
Multisample sample CFA results are in Table 5. Results supported the
baseline model (GFI = 0.906; CFI = 0.922) and the model which constrained factor
loadings to be equal (GFI = 0.901; CFI = 0.918). A test of the extent to which
relationships among factors, and relationships between items and factors were equal
in the two participants groups showed acceptable fit indices (GFI = 0.900; CFI =
0.916).
The LM Test showed that 3 of 36 equality constraints differed between the
two samples. Specifically, relationships between Depression and Fatigue (chi2 =
Measure of mood
20
12.207, p < 0.01) and factor loadings for “Annoyed” (chi2 = 18.323, p < 0.01) and
“Worn-out” (chi2 = 9.834, p < 0.01) differed significantly. Although these statistics
may appear to question the generalisability of the solution, further analysis with the
equality constraints removed indicated only a marginally improved fit of the model
(see Table 5).
A multisample CFA with constraints imposed on the hypothesised
relationships is proposed to provide a very rigorous test of factorial validity (Bentler,
1995). Results of the present study show that hypothesised relationships remain
stable between different participant groups even when the intensity of mood
responses differ significantly. Collectively, it is proposed that the POMS-A shows
strong evidence of factorial validity for use with school children and young athletes.
Stage 3: Test of criterion validity
Criterion validity is defined as the “degree to which scores on a test are
related to some recognised standard, or criterion” (Thomas & Nelson, 1990, p. 516).
Criterion validity can be demonstrated using either concurrent validity or predictive
validity. Concurrent validity is defined as when “a measuring instrument is
correlated with some criterion that is administered at the same time, or concurrently”
(Thomas & Nelson, 1990, p. 515). Concurrent validity is typically examined by
correlating scores from two questionnaires that were administered concurrently, with
the previously validated questionnaire being the criterion variable (see McNair et al.,
1971, 1992). Concurrent validity is inferred from the strength of correlations
between two questionnaires which measure the same construct.
The criterion measure for the Vigour scale was the Positive Affect scale from
the Positive and Negative Affect Schedule (PANAS; Watson, Clark, and Tellegen,
Measure of mood
21
1988). The criterion measure for the Anger, Confusion, Depression, Fatigue, and
Tension scales was the Negative Affect scale from the PANAS. A further criterion
measure for Anger was provided by the State-Trait Anger-Expression Inventory
(STAXI; Spielberger, 1991).
Participants
A total of 182 participants completed the POMS-A and a second
questionnaire. Ninety-one participants (Age: M = 14.3 yr.; SD = 1.2 yr.) completed
the PANAS and the POMS-A. A separate sample of 91 participants (Age: M = 13.3
yr., SD = 0.9 yr.) completed the STAXI and the POMS-A. Participants were school-
children at a mixed secondary school in North West London.
Measures of criterion validity
Positive and Negative Affect Schedule.
Watson et al. (1988) developed the PANAS to assess independent markers of
positive and negative affect. Items are rated on a 5-point scale anchored by ‘Not at
all’ (1) and ‘Extremely’ (5). Examples of Positive Affect items include “Excited”,
“Enthusiastic”, and “Determined”. Examples of negative mood items include
“Distressed”, “Guilty”, and “Scared”.
The validation studies for the PANAS, which involved 3,554 completion’s of
the inventory, demonstrated strong content validity with all items loading at 0.50 or
higher onto their hypothesised factor. Cronbach alpha coefficients ranged from 0.84
to 0.90. Recent research has confirmed the factor structure of the PANAS among
young athletes (Crocker, 1997). With reference to the present study, this finding
suggests that the PANAS is a) valid for use in sport, and b) valid for use with
Measure of mood
22
children. Consequently the PANAS is an excellent research tool to test the criterion
validity of the POMS-A.
State-Trait Anger-Expression Inventory (STAXI).
The factor structure of the 10-item State-Anger scale was validated by
Spielberger (1991) using a sample of 550 individuals. Factor analysis yielded a
single factor with a Cronbach alpha coefficient of 0.93. Items are rated on a 4-point
scale anchored by “Almost never” (1) and “Very Often” (4).
Procedure
Participants completed the questionnaires in accordance with the procedure
used in Stages 2.1 and 2.2. Pearson product moment correlation was used to assess
the relationship between POMS-A scores and the criterion measure.
Results and Discussion
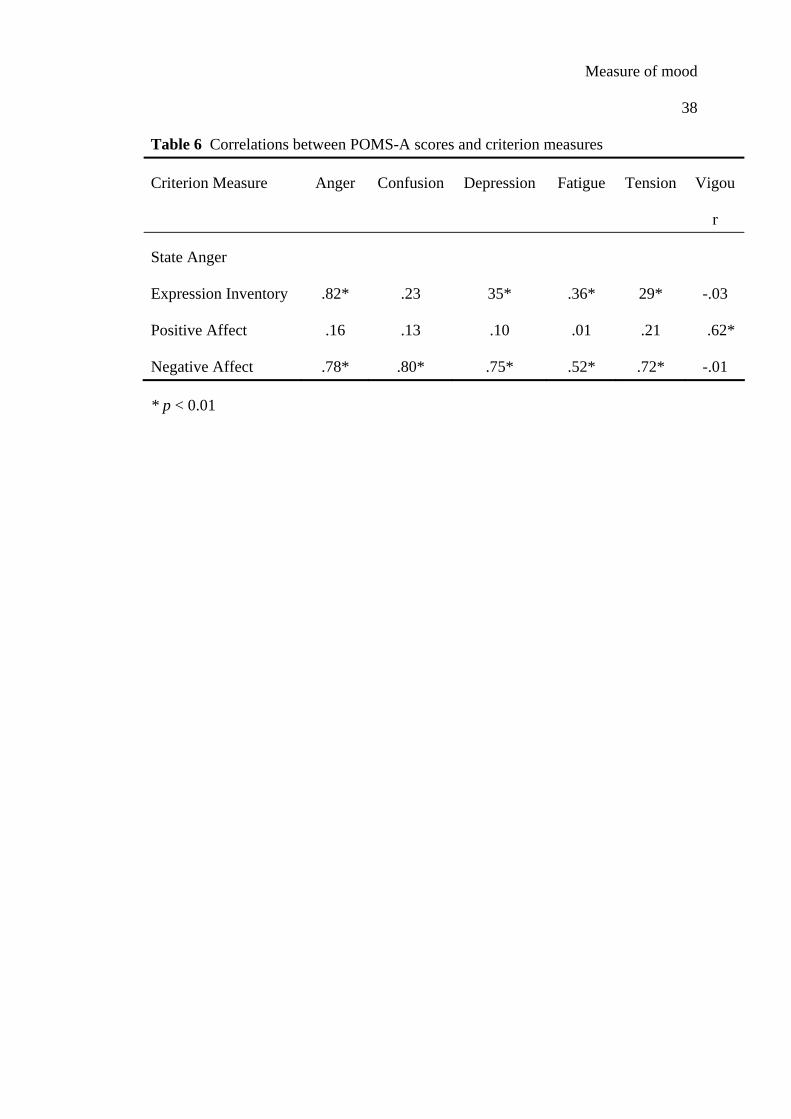
Correlation coefficients between the POMS-A measures and the criterion
measures are in Table 6. Consistent with hypothesised predictions, scores on the
POMS-A Anger scale showed the strongest correlation with STAXI scores and
Vigour significantly correlated with Positive Affect. Anger, Confusion, Depression,
Fatigue, and Tension significantly correlated with Negative Affect. Also consistent
with theoretical proposals, Negative Affect did not significantly correlate with
Vigour, and Positive Affect did not significantly correlate with the other POMS-A
factors. Consistent with previous research, Negative Affect showed a moderate
relationship with Anger, Confusion, Depression, Fatigue, and Tension (Watson et al.,
1988). Collectively, results suggest that the POMS-A shows evidence of concurrent
validity.
Measure of mood
23
General Discussion
The purpose of the study was to develop and validate a shortened version of
the POMS suitable for use with children in the context of classroom and athletic
environments. Theory testing and construct measurement are inextricably linked. It
is suggested that the development of a valid measure of the theoretical construct to
be examined should be the first step in the research process (Hendrick & Hendrick,
1986). If the construct validity of the instrument is questionable, then it is not
possible to accurately test the theory under investigation. Watson et al. (1988)
argued that poorly developed and validated mood inventories contributed to the
ambiguity of research findings surrounding the nature of mood in the psychology
literature. The three stage validation process used in the present paper tested content
validity, factorial validity, and criterion validity and has provided strong support for
the 24-item version of the POMS. Collectively, it is proposed that the POMS-A
shows clear evidence of construct validity. However, as validation is an ongoing
process (Anastasi & Urbina, 1997), it is suggested that future research should
continue to investigate the validity of the POMS-A. A limitation of the present
concurrent validity process was that the STAXI criterion measures were validated on
samples from student rather than athletic populations. Therefore, it is suggested that
researchers investigate the validity of measures such as the STAXI (Spielberger,
1991) in sport. Indeed, there is a need for more thorough validation in the sport
environment of many of the inventories used in sport psychology research which
have been validated on other populations (Schutz, 1994).
Comparison with the original POMS
Measure of mood
24
Out of the 24-items on the POMS-A, 17-items are also on the original POMS
(“active”, “alert”, “angry”, “annoyed”, “anxious”, “bad-tempered”, “bitter”,
“confused”, “energetic”, “exhausted”, “lively”, “miserable”, “muddled”, “nervous”,
“panicky”, “uncertain”, “unhappy”, and “worn-out”). There were 14-items discarded
from the POMS-A which are on the original POMS (“bushed”, “cheerful”,
“forgetful”, “furious”, “gloomy”, “lonely”, “on-edge”, “ready to fight”, “sad”,
“spiteful”, “tense”, “unable to concentrate”, “uneasy”, and “weary”). Previous
research has questioned whether athletes interpret items such as “ready to fight”
literally (Terry and Slade, 1995). Additionally, “cheerful” appears to be part of a
construct labelled happiness, rather than vigour. In the present study, vigour
comprises items associated with positive feelings and high arousal (active, alert,
energetic, and lively), which appear to be more appropriate descriptors of the vigour
construct.
Uses of the POMS-A
Recent research has seen the development of a conceptual model to explain
relationships between mood and athletic performance (Lane and Terry, 1998). The
conceptual model proposes that mood should be measured through the six mood
dimensions identified in the POMS. Lane and Terry (1998) suggested that depressed
mood was associated with increased anger, confusion, fatigue, and tension, and
reduced vigour. In addition, depressed mood was also proposed to moderate mood
and performance relationships for anger and tension. It is suggested therefore, that,
the POMS-A should be used to investigate the hypotheses made in the conceptual
model proposed by Lane and Terry (1998).
Measure of mood
25
The POMS-A may provide a useful tool for applied sport psychology
research as it is short, easy to complete, and suitable for use with adolescents.
Consequently, the POMS-A can be used to assess mood shortly prior to competition
without excessively disturbing athlete’s normal pre-competition routines. The
brevity of the questionnaire also means that it provides an instrument for assessing
mood changes in education settings and for screening young athletes for mood
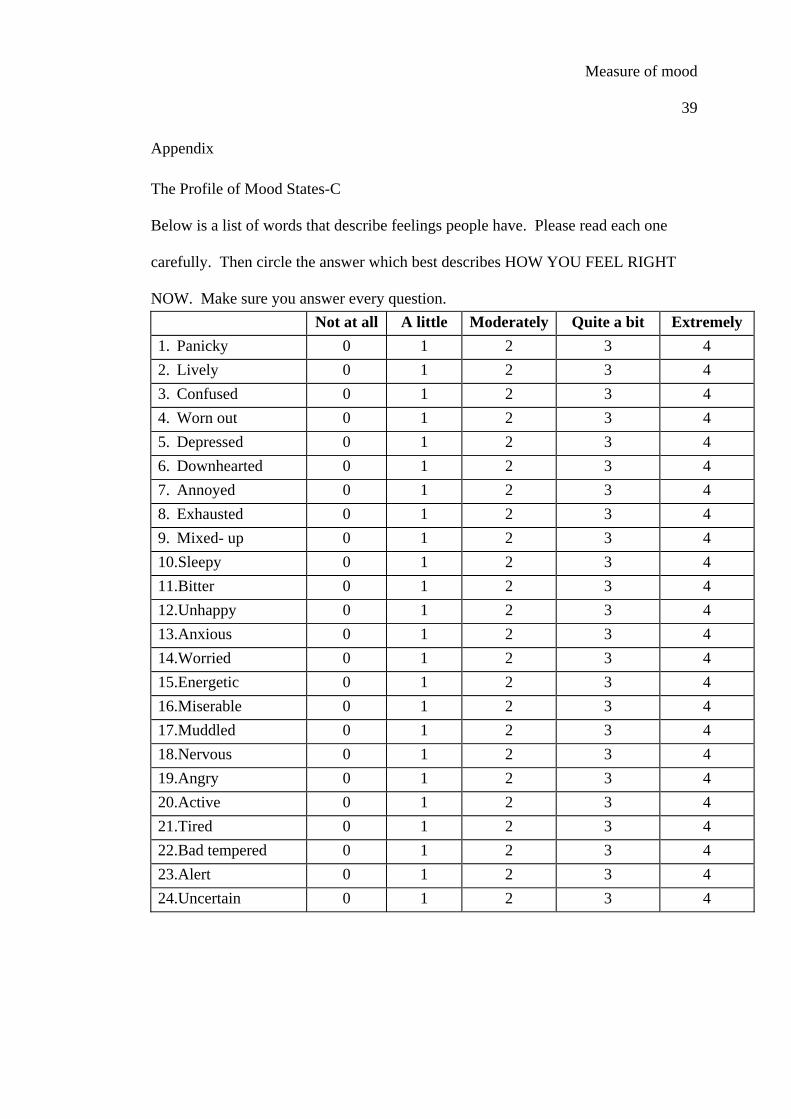
disturbance as a pre-cursor to overtraining syndrome. The POMS-A is contained in
the Appendix and researchers are invited to use the scale without written permission
from the authors.
Conclusions
In conclusion, the purpose of the study was to develop and validate a measure
of mood for adolescents. CFA supported the factorial validity of a 24-item six-factor
model using both independent and multisample analyses. Criterion validity was
demonstrated through correlating POMS-A scores with previously validated
inventories. It is proposed that the POMS-A demonstrates construct validity for the
assessment of mood in the 11-18 year age old group. It is suggested that future
research extends the validation process of the POMS-A to adults and adult athletes.
Measure of mood
26 References
Abele, A. and Brehm, W. (1993). Mood effects of exercise versus sports games:
Findings and implications for well-being and health. International Journal of
Health Psychology, 2, 53-81.
Albrecht, R.R. and Ewing, S.J. (1989). Standardizing the administration of the
Profile of Mood States (POMS): Development of alternative word lists. Journal of
Personality Assessments, 53, 31-39.
American Psychological Association (1974). Standards for Educational
Psychological Testing. Washington, DC: APA.
Anastasi, A. and Urbina, S. (1997). Psychological Testing (7th ed.). New York:
Prentice-Hall.
Beck, A.T. and Clark, D.A. (1988). Anxiety and depression: An information
processing perspective. Anxiety Research, 1, 23-56.
Bentler, P.M. (1990). Comparative fit indices in structural models. Psychological
Bulletin, 107, 238-246.
Bentler, P.M. (1995). EQS Structural Equation Program Manual. Los Angeles. CA:
BMDP Statistical Software.
Bentler, P.M. and Wu, E.J.C. (1995). EQS/Windows User’s Guide. Los Angeles:
BMDP. Statistical Software.
Bollen, K.A. (1989). Structural Equations with Latent Variables. New York:
Wiley.
Budgett, R. (1990). Overtraining syndrome. British Journal of Sports Medicine, 24,
231-236.
Measure of mood
27 Byrne, B.M. (1989). A primer of Lisrel: Basic Applications Programming for
Confirmatory Factor Analytic Models. New York, NY: Springer-Verlag.
Browne, M.W. and Cudeck, R. (1993). Alternative ways of assessing model fit. In
K.A. Bollen & J.S. Long (Eds.), Testing Structural Equation Models (pp.132-
162). Newbury, CA: Sage.
Crocker P.R.E. (1997). A confirmatory factor analysis of the Positive Affect
Negative Affect Schedule (PANAS) with a youth sport sample. Journal of Sport
and Exercise Psychology, 19, 91-97.
Cronbach, L.J. (1951). Coefficient alpha and internal structure of tests.
Psychometrika, 16, 297-334.
Curren, S.L., Andrykowski, M. A. and Studts, J. L. (1995). Short form of the Profile
of Mood States (POMS-SF): Psychometric information. Psychological
Assessment, 7, 80-83.
Fry, A.C., Stone, M.H., Thrush, J.T. and Fleck, S.J. (1995). Precompetition training
sessions enhance competitive performance of high anxiety junior weightlifters.
Journal of Strength and Conditioning Research, 9, 37-42.
Gorsuch, R.L. (1983). Factor Analysis (2nd Edition). Hillsdale, NJ: Lawrence
Erlbaum.
Goss, J.D. (1994). Hardiness and mood disturbance in swimmers while overtraining.
Journal of Sport and Exercise Psychology, 16, 135-149.
Green, E.K., Burke, K.L., Nix, C.L., Lambrecht, K.W. and Mason, C. (1995).
Psychological factors associated with alcohol use by high school athletes.
Journal of Sport Behavior, 18, 195-208.
Measure of mood
28 Grove, J.R. and Prapavessis, H. (1992). Preliminary evidence for the reliability and
validity of an abbreviated Profile of Mood States. International Journal of Sport
Psychology, 23, 93-109.
Hendrick, C. and Hendrick, S. (1986). A theory and method of love. Journal of
Personality and Social Psychology, 50, 392-402.
Hollander, D.B., Meyers, M.C. and LeUnes, A. (1995). Psychological factors
associated with overtraining: Implications for youth sport coaches. Journal of
Sport Behavior, 18, 3-20.
Hoyle, R.H. (1995). Structural Equation Modeling: Concepts, Issues, and
Applications. Sage, London.
Hoyle, R.H. and Panter, A.T. (1995). Writing about structural equation models. In
Hoyle, R.H. (1995). Structural Equation Modeling: Concepts, Issues, and
Applications. (pp. 158-175) London, Sage.
Hu. L. and Bentler, P.M. (1995). Evaluating model fit. In Hoyle, R. H. (1995).
Structural Equation Modeling: Concepts, Issues, and Applications. (pp. 76-99)
London, Sage.
Jackson, S.A. and Marsh, H.W. (1996). Development and validation of a scale to
measure optimal experience: The flow state scale. Journal of Sport and Exercise
Psychology, 18, 17-35.
Jones, J.G., Swain, A.B.J. and Cale, A. (1990). Antecedents of multidimensional
state anxiety and self-confidence in elite intercollegiate middle-distance runners.
The Sport Psychologist, 4, 107-118.
Kerlinger, F.N. (1979). Behavioral Research: A Conceptual Approach. New York,
NY: Holt, Rinehart and Winston.
Measure of mood
29 Kline, P. (1993). Handbook of Psychological Testing. London, Routledge.
Lane, A.M., & Terry, P.C. (1998). Mood state as predictors of performance: A
conceptual model. Journal of Sports Sciences, 16, 93.
Lorr, M., & McNair, D. (1984). Manual for the Profile of Mood States Bipolar
Form. San Diego, CA: Educational and Industrial Testing Service.
Martens, R., Vealey, R.S., Burton, D., Bump, L. and Smith, D. E. (1990).
Development and validation of the Competitive Sports Anxiety Inventory 2. In
Competitive Anxiety in Sport (edited by R. Martens, R.S. Vealey and D. Burton),
pp. 117-178. Champaign, IL: Human Kinetics.
McNair, D.M., Lorr, M. and Droppleman, L.F. (1971). Manual for the Profile of
Mood States. San Diego, CA: Educational and Industrial Testing Services.
McNair, D.M., Lorr, M. and Droppleman, L.F. (1992). Revised Manual for the
Profile of Mood States. SanDiego, CA: Educational and Industrial Testing
Services.
Newcombe, P.A. and Boyle, G.J. (1995). High school students' sports personalities:
Variations across participation level, gender, type of sport, and success.
International Journal of Sport Psychology, 26, 277-294.
Schutz, R.W. (1994). Methodological issues and measurement problems in sport
psychology. In International Perspectives on Sport and Exercise Psychology
(edited by S. Serpa, J. Alves, J. and V. Pataco) pp. 35-57. Morgantown, Fitness
Information Technology.
Schutz, R.W. and Gessaroli, M.E. (1993). Use, misuse, and disuse of statistics in
psychology research. In Handbook of Research on Sport Psychology (edited by R.
N. Singer, M. Murphey, and L.K. Tennant) pp. 901-921. NY, MacMillan.
Measure of mood
30 Shacham, S. (1983). A shorten version of the Profile of Mood States. Journal of
Personality Assessment, 47, 305-306.
Spielberger, C.D. (1991). Manual for the State-Trait Anger Expression Inventory.
Odessa, FL: Psychological Assessment Resources.
Steiger, J.H. (1990). Structural model evaluation and modification: An interval
estimation approach. Multivariate Behavioural Research, 25, 173-180.
Tabachnick, B.G. and Fidell, L.S. (1996). Using Multivariate Statistics. New York,
NY: Harper and Row.
Taylor, J. (1987). A review of validity issues in sport psychological research: types,
problems, solutions. Journal of Sport Behavior, 10, 3-15.
Terry, P.C. and Lane, A.M. (in press). Development of normative data for the
Profile of Mood States for use with athletic samples. Journal of Applied Sport
Psychology.
Terry, P.C. and Slade, A. (1995). Discriminant capability of psychological state
measures in predicting performance outcome in karate competition. Perceptual
and Motor Skills, 81, 275-286.
Thomas, J.R. and Nelson, J.K. (1990). Research Methods in Physical Activity.
Champaign, IL: Human Kinetics.
Thompson, B. and Daniel, L.G. (1996). Factor analytic evidence for the construct
validity of scores: A historical overview and some guidelines. Educational and
Psychological Measurement, 56, 197-208.
Tucker, L.R. and Lewis, C. (1973). A reliability coefficient for maximum likelihood
factor analysis. Psychometrika, 38, 1-10.
Measure of mood
31 Walker, M.K. and Sprague, R.L. (1988). Effects of methyphenidate hydrochloride on
the subjective reporting of mood in children with attention deficit disorder.
Special Issue: Interface between mental and physical illness. Issues in Mental
Health Nursing, 9, 373-385.
Watson, D., Clark, L.A. and Tellegen, A. (1988). Development and validation of
brief measures of positive and negative affect: The PANAS scales. Journal of
Personality and Social Psychology, 54, 1063-1070.
Watson, D. and Clark, L.A. (1997). Measurement and mismeasurement of Mood:
Recurrent and emergent issues. Journal of Personality Assessment, 68, 267-296.
West, S.G., Finch, J.F. and Curren, P.J. (1995). Structural equations models with
nonnormal variables: Problems and remedies. In Hoyle, R. H. (1995). Structural
Equation Modelling: Concepts, Issues, and Applications. (pp. 56-73) London,
Sage.
Widmeyer, W.N., Brawley, L.R. and Carron, A.V. (1985). The development of an
instrument to assess cohesion in sport team: The Group Environment
Questionnaire. Journal of Sport Psychology, 7, 244-266.
Measure of mood
32 Author Note
Peter C. Terry, Andrew M. Lane, Helen, J. Lane, and Lee Keohane,
Department of Sport Sciences, Brunel University.
Correspondence concerning this article should be addressed to Dr. Andrew
Lane, Department of Sport Sciences, Brunel University, Osterley Campus, Borough
Road, Isleworth, Middlesex, TW7 5DU, United Kingdom. Tel: 44 181 891 0121. E-
mail: [email protected]
Measure of mood
33
Table 1 Standardised solution for factor loadings of the 42-item version of the
POMS-A
Item Factor loading Error varianceWorried .738 .675 Nervous .716 .698 Anxious .655 .755 Panicky .572 .820 On edge .558 .830 Tense .528 .849 Stressed .524 .852
Unhappy .831 .556 Miserable .807 .590 Depressed .763 .646 Downhearted .684 .730 Sad .648 .762 Gloomy .624 .781 Lonely .398 .918
Energetic .872 .489 Active .868 .496 Lively .725 .689 Alert .607 .795 Cheerful .468 .884 Brisk .417 .909 Stimulated 370 .929
Mixed-up .847 .532 Confused .708 .707 Uncertain 707 .707 Muddled .677 .736 Uneasy .513 .858 Unable to concentrate .372 .928 Forgetful .250 .968
Angry .805 .593 Bitter .756 .654 Annoyed .755 .656 Bad-tempered .692 .722 Furious .651 .759 Spiteful .432 .902 Ready to fight .415 .910
Tired .887 .461 Sleepy .848 .529 Exhausted .786 .618 Worn-out .782 .624 Ready for bed .710 .704 Bushed .694 .720 Weary .539 .842
Measure of mood
34 Table 2 Internal consistency estimates of mood dimensions among three samples
Sample A: School children (N =
369)
42-items 24-items
Young athletes
(N = 683)
School
children
(N = 594)
Anger .80 .82 .80 .80
Confusion .76 .83 .86 .81
Depression .86 .85 .85 .85
Fatigue .90 .90 .82 .85
Tension .82 .74 .75 .82
Vigour .82 .85 .79 .79
Measure of mood
35 Table 3 Inter-correlations of POMS-A subscales among school children and young
athletes
Anger Confusion Depression Fatigue
Confusion
Young athletes .588
School children .613
Depression
Young athletes .876 .700
School children .802 .731
Fatigue
Young athletes .363 .388 .285
School children .275 .309 .382
Tension
Young athletes .186 .492 .292 .174
School children .316 .511 .443 .250
Vigour
Young athletes -.079 -.288
School children -.145 -.357
Measure of mood
36
Table 4 POMS-A scores among school children and young athletes
School children (N = 594)
M SD
Young athletes (N = 683)
M SD
F 1271
Effect Size
Anger 1.52 2.53 1.26 2.30 3.47 .11
Confusion 2.12 2.85 1.66 2.54 9.68** .17
Depression 1.90 2.98 1.36 2.58 8.21* .20
Fatigue 5.07 3.77 3.23 3.19 41.64* .53
Tension 2.85 3.46 3.63 3.17 17.56* .24
Vigour 6.90 4.05 8.76 4.14 65.35* .45 Wilks’ lambda 6, 1266 = 0.91, p < 0.001
* p < 0.001
Measure of mood
37
Table 5 Multisample confirmatory factor analysis of the POMS-A among school
children and young athletes Fit Statistics Unconstrained
model (df = 480)
Factor loadings
(df = 540)
Factor loadings and
correlations (df = 516)
Chi2 : df ratio 3.275 3.055 3.254
Goodness of Fit Index .906 .901 .900
Adjusted Goodness of
Fit Index
.941
.941
.942
Nonnormed Fit Index .910 .910 .911
Comparative Fit Index .922 .918 .916
Root Mean Square
Error of Approximation
.053
.042
.067
Measure of mood
38
Table 6 Correlations between POMS-A scores and criterion measures
Criterion Measure Anger Confusion Depression Fatigue Tension Vigou
r
State Anger
Expression Inventory
.82*
.23
35*
.36*
29*
-.03
Positive Affect .16 .13 .10 .01 .21 .62*
Negative Affect .78* .80* .75* .52* .72* -.01
* p < 0.01
Measure of mood
39
Appendix
The Profile of Mood States-C
Below is a list of words that describe feelings people have. Please read each one
carefully. Then circle the answer which best describes HOW YOU FEEL RIGHT
NOW. Make sure you answer every question. Not at all A little Moderately Quite a bit Extremely
1. Panicky 0 1 2 3 4 2. Lively 0 1 2 3 4 3. Confused 0 1 2 3 4 4. Worn out 0 1 2 3 4 5. Depressed 0 1 2 3 4 6. Downhearted 0 1 2 3 4 7. Annoyed 0 1 2 3 4 8. Exhausted 0 1 2 3 4 9. Mixed- up 0 1 2 3 4 10.Sleepy 0 1 2 3 4 11.Bitter 0 1 2 3 4 12.Unhappy 0 1 2 3 4 13.Anxious 0 1 2 3 4 14.Worried 0 1 2 3 4 15.Energetic 0 1 2 3 4 16.Miserable 0 1 2 3 4 17.Muddled 0 1 2 3 4 18.Nervous 0 1 2 3 4 19.Angry 0 1 2 3 4 20.Active 0 1 2 3 4 21.Tired 0 1 2 3 4 22.Bad tempered 0 1 2 3 4 23.Alert 0 1 2 3 4 24.Uncertain 0 1 2 3 4