Means Testing Pensions: The Case of Australia · This brief was prepared for the Michigan...
12
POLICY BRIEF MEANS TESTING PENSIONS: THE CASE OF AUSTRALIA By Rafal Chomik and John Piggott * * ARC Centre of Excellence in Population Ageing Research (CEPAR), University of New South Wales. This brief was prepared for the Michigan Retirement Research Center. The authors acknowledge the helpful comments provided by George Kudrna. INTRODUCTION In an era of population aging, the tension between adequate retirement incomes and sustainable budgets is increasingly challenging. Three broad strategies can improve both pension adequacy and sustainability: better targeting, increased levels and coverage of private saving, and delayed retirement. This policy brief revisits the first of these policy options by describing the experience of Australia, where, unlike in most countries in the Organisation for Economic Co operation and Development (OECD), means-tested transfers play a primary role in retirement income provision. Complemented by mandated private savings, it is a setting that is expected to remain of primary importance and is fiscally sustainable even as the population ages. Australia has one of the lowest public pension outlays, as a proportion of GDP, among developed countries. With poverty defined using United States parameters, Australia also has a low proportion of its elderly in poverty. The brief also looks at the emerging economic literature on means testing. It suggests that the costs of a means- tested scheme, which may result in some disincentives to work and save, need to be weighed against the benefit of a cheaper, targeted scheme with fewer economy-wide distortions. TYPICAL APPROACHES A much-used framework for retirement income provision posits a system with three “pillars.” The first operates as a noncontributory transfer program. That is, it pays benefits regardless of work history. It typically takes the form of welfare payment aimed at reducing poverty, often part of a non-age-related welfare policy. The second pillar provides payments related to pre retirement labor income by linking benefits with mandatory contributions. This is typically based on some - proportion of wages or salary, paid either by employer, employee, or both. Where the second pillar is based on a defined benefit paradigm, the defined benefit formula can incorporate progressive features. Second pillar schemes are typically run on a pay-as-you-go basis through the conduit of a social security program. The broad policy aim is related to helping with consumption smoothing between working life and retirement. The third pillar comprises voluntary retirement saving, often with tax breaks that are contingent on these savings being preserved to a given access age. While parametric settings vary widely, this basic structure is widely deployed across developed countries, as well as some rapidly growing Asian countries. THE AUSTRALIAN SYSTEM The three pillar framework is depicted in Figure 1, in which the Australian and U.S. structures are highlighted. A key difference between the Australian and U.S. systems relates to the size and importance of different pillars. In the U.S. system, which is close to a prototypical OECD structure, the first pillar (Supplemental Security Income) is relatively small. Most Americans rely on the unfunded contributory pillar (Social Security) for retirement income. Figure 1. Three pillars of a retirement income system Safety net for adequacy Mandatory income replacement Voluntary saving Universal Pay As You Go Funded Public provision Public provision Employment related Other Non tax preferred AUS: large Age Pension USA: small Supplemental Security Income Private provision AUS: large Superannuation Guarantee AUS: concessions for additional Super savings USA: concessions for 401(k) Private provision Targeted Tax preferred USA: large Old-Age Social Security By contrast, Australia’s first pillar (Age Pension) is large. It is generous enough to provide a modest standard of living when combined with home ownership (85 percent of older Australians own a home; Australian Bureau of Statistics, 2012). -
Transcript of Means Testing Pensions: The Case of Australia · This brief was prepared for the Michigan...

POLICY BRIEF
MEANS TESTING PENSIONS: THE CASE OF AUSTRALIA By Rafal Chomik and John Piggott*
* ARC Centre of Excellence in Population Ageing Research (CEPAR), University of New South Wales. This brief was prepared for the Michigan Retirement Research Center. The authors acknowledge the helpful comments provided by George Kudrna.
INTRODUCTION In an era of population aging, the tension between adequate retirement incomes and sustainable budgets is increasingly challenging. Three broad strategies can improve both pension adequacy and sustainability: better targeting, increased levels and coverage of private saving, and delayed retirement. This policy brief revisits the first of these policy options by describing the experience of Australia, where, unlike in most countries in the Organisation for Economic Cooperation and Development (OECD), means-tested transfers play a primary role in retirement income provision. Complemented by mandated private savings, it is a setting that is expected to remain of primary importance and is fiscally sustainable even as the population ages. Australia has one of the lowest public pension outlays, as a proportion of GDP, among developed countries. With poverty defined using United States parameters, Australia also has a low proportion of its elderly in poverty. The brief also looks at the emerging economic literature on means testing. It suggests that the costs of a means-tested scheme, which may result in some disincentives to work and save, need to be weighed against the benefit of a cheaper, targeted scheme with fewer economy-wide distortions. TYPICAL APPROACHES A much-used framework for retirement income provision posits a system with three “pillars.” The first operates as a noncontributory transfer program. That is, it pays benefits regardless of work history. It typically takes the form of welfare payment aimed at reducing poverty, often part of a non-age-related welfare policy. The second pillar provides payments related to preretirement labor income by linking benefits with mandatory contributions. This is typically based on some
proportion of wages or salary, paid either by employer, employee, or both. Where the second pillar is based on a defined benefit paradigm, the defined benefit formula can incorporate progressive features. Second pillar schemes are typically run on a pay-as-you-go basis through the conduit of a social security program. The broad policy aim is related to helping with consumption smoothing between working life and retirement.
The third pillar comprises voluntary retirement saving, often with tax breaks that are contingent on these savings being preserved to a given access age. While parametric settings vary widely, this basic structure is widely deployed across developed countries, as well as some rapidly growing Asian countries.
THE AUSTRALIAN SYSTEM The three pillar framework is depicted in Figure 1, in which the Australian and U.S. structures are highlighted. A key difference between the Australian and U.S. systems relates to the size and importance of different pillars.
In the U.S. system, which is close to a prototypical OECD structure, the first pillar (Supplemental Security Income) is relatively small. Most Americans rely on the unfunded contributory pillar (Social Security) for retirement income.
Figure 1. Three pillars of a retirement income system
Safety net for adequacy
Mandatory income
replacement
Voluntary saving
Universal
Pay As You Go
Funded Public provision
Public provision
Employment related
Other Non tax
preferred
AUS: large Age Pension USA: small Supplemental Security Income
Private provision
AUS: large Superannuation Guarantee
AUS: concessions for additional Super savings USA: concessions for 401(k)
Private provision
Targeted
Tax preferred
USA: large Old-Age Social Security
By contrast, Australia’s first pillar (Age Pension) is large. It is generous enough to provide a modest standard of living when combined with home ownership (85 percent of older Australians own a home; Australian Bureau of Statistics, 2012).
2
According to the Australia Treasury, roughly 50 percent of the age-eligible population receives the maximum amount of the Age Pension (including spouse and service pensions), which is gradually withdrawn in line with the recipients’ income and assets so that about 30 percent of the population receives a part pension and only the top 20 percent are excluded completely. The proportion receiving a full pension has been gradually decreasing, and is expected to continue to do so as a result of higher income and savings among new cohorts of older people (Australian Treasury, 2010).
Australia’s first pillar is supplemented by second pillar savings, mandatory for almost all employees, known as the Superannuation Guarantee. It requires all employers to contribute 9.5 percent of employee earnings (increasing to 12 percent between 2021 and 2025) into a tax-preferred Defined Contribution (DC) plan (or equivalent Defined Benefit (DB) plan, but these are rare). The accounts are portable and allow choice of fund and investment strategy. The scheme was legislated in the early “90s, so it is still maturing. It is similar to the 401(k) regime in the US, but its standardised, obligatory nature makes it more significant. There is no legislated structure focused on drawdowns. There is complete freedom to draw funds as a lump sum, annuity, or phased withdrawal, and the majority of members choose the latter option.
Voluntary retirement saving, often occupation- or workplace-based and again tax-preferred, completes the Australian retirement income system. Often, employment contracts provide for employer contributions above the Superannuation Guarantee minimum. The nature of the pillars means that the Age Pension acts as the main mechanism for most individuals to manage longevity, investment, and inflation risks. The parameters for each pillar are summarised in Table 1.
Michigan Retirement Research Center
NEEDS VERSUS RIGHTS The Australian approach to social program payments is built around a notion of vertical equity and the perception of need, rather than the more common entitlements framework. The different emphasis results in means testing applying to most social programs in Australia – more than 95 percent of such spending is subject to means testing (or comprises benefits available only to those already receiving means-tested payments). For example, unemployment benefits, again noncontributory, are paid to the unemployed subject to a means test. If a spouse is working and earning above a threshold, for instance, no benefit is payable.
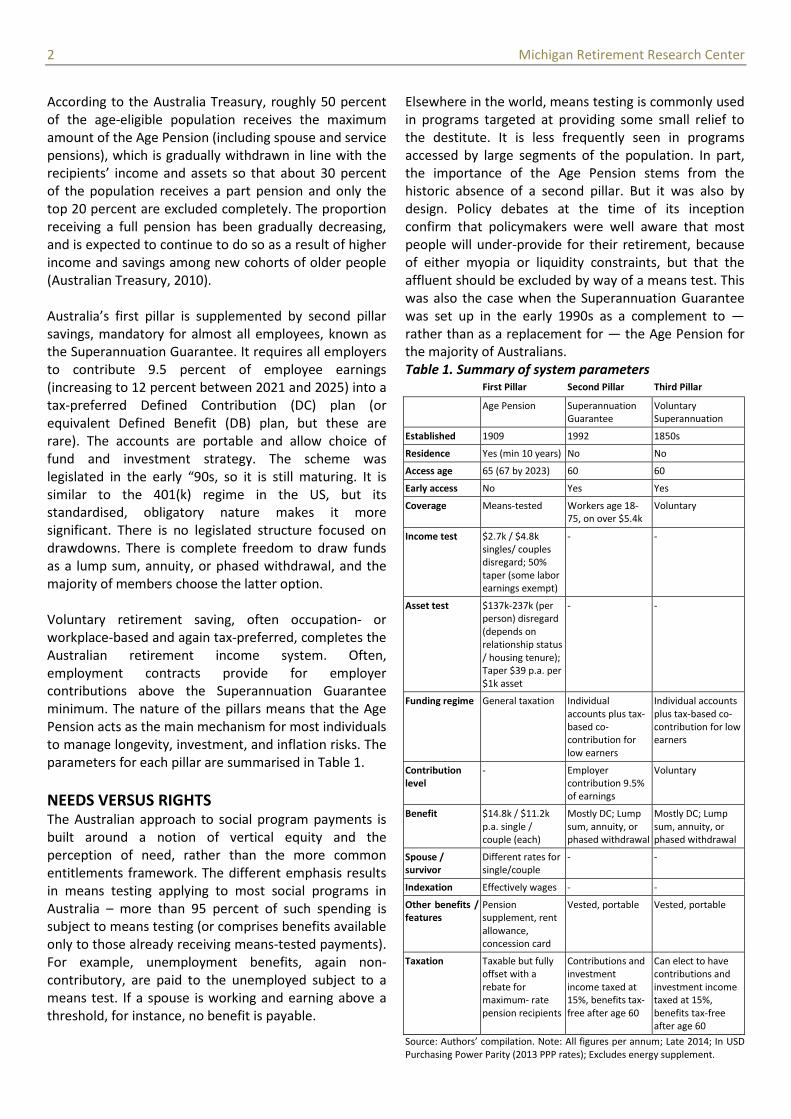
Elsewhere in the world, means testing is commonly used in programs targeted at providing some small relief to the destitute. It is less frequently seen in programs accessed by large segments of the population. In part, the importance of the Age Pension stems from the historic absence of a second pillar. But it was also by design. Policy debates at the time of its inception confirm that policymakers were well aware that most people will under-provide for their retirement, because of either myopia or liquidity constraints, but that the affluent should be excluded by way of a means test. This was also the case when the Superannuation Guarantee was set up in the early 1990s as a complement to — rather than as a replacement for — the Age Pension for the majority of Australians. Table 1. Summary of system parameters First Pillar Second Pillar Third Pillar
Age Pension Superannuation Guarantee
Voluntary Superannuation
Established 1909 1992 1850s
Residence Yes (min 10 years) No No
Access age 65 (67 by 2023) 60 60
Early access No Yes Yes
Coverage Means-tested Workers age 18 75, on over $5.4k
Voluntary
Income test $2.7k / $4.8k singles/ couples
disregard; 50% taper (some labor
earnings exempt)
- -
Asset test $137k-237k (per person) disregard
(depends on relationship status
/ housing tenure); Taper $39 p.a. per
$1k asset
- -
Funding regime General taxation
Individual accounts plus tax-
based co- contribution for
low earners
Individual accounts plus tax-based co-
contribution for low earners
Contribution level
- Employer contribution 9.5%
of earnings
Voluntary
Benefit $14.8k / $11.2k p.a. single /
couple (each)
Mostly DC; Lump sum, annuity, or
phased withdrawal
Mostly DC; Lump sum, annuity, or
phased withdrawal
Spouse / survivor
Different rates for single/couple
- -
Indexation Effectively wages - -
Other benefits / features
Pension supplement, rent
allowance, concession card
Vested, portable Vested, portable
Taxation Taxable but fully offset with a
rebate for maximum- rate
pension recipients
Contributions and investment
income taxed at 15%, benefits tax-
free after age 60
Can elect to have contributions and
investment income taxed at 15%,
benefits tax-free after age 60
Source: Authors’ compilation. Note: All figures per annum; Late 2014; In USD Purchasing Power Parity (2013 PPP rates); Excludes energy supplement.
3 Michigan Retirement Research Center
DESIGNING THE MEANS TEST Developing a means-tested retirement income program requires that a number of general issues relating to its design be resolved. These can be grouped into three broad categories: eligibility, scope of resource testing, and benefit value.
Who is eligible? Most countries apply residence (or citizenship) requirements for eligibility to noncontributory pensions to avoid pension-based migration. In some countries current permanent residence suffices (e.g., United Kingdom and Belgium). In others, such as Norway and the Netherlands, residency of one year is sufficient for receipt of the basic pension, but the benefit level is adjusted as a proportion of the stipulated full years of residency (e.g., 1/40th for each year). It is also common to require a certain number of years in a lifetime, either after a certain age or within a certain number of years of claiming the pension. In Australia eligibility requires residence of at least 10 years with one continuous period of at least five years.
The other basic eligibility criterion is age. This is consistent with the policy’s purpose — to provide financial support to those who have largely depleted their productive capacity. Both fairness and sustainability are relevant to the choice of access age. An access age that is too high may be unfair to groups in physically demanding occupations, and to groups whose life expectancy has not increased commensurately with the average. Setting it too low can distort retiremen t behaviour and affect program costs. The average pension age in the OECD declined between 1950 and the mid-1990s but has since been increasing in most OECD countries (and equalizing between the sexes; Chomik and Whitehouse, 2010). Australia has legislated to increase its Age Pension age to 67. A further increase to age 70 has been announced. If enacted, it will be the highest legislated pension access age in the OECD.
Which resources are tested? Whether and how each class of asset or source of income is included is usually the outcome of trade-offs between comprehensiveness to minimise avoidance behaviour, the feasibility of credible valuation, and political sensitivity.
For Australia’s Age Pension both income and assets are assessed through separate tests, with the pension amount determined by the more binding of the two. The setting of test parameters means that the income test tends to be binding for more people. A separate asset test takes account of the fact that people can live off both asset income and principal, and ensures that where individuals own significant wealth it is not simply
shielded from the income test by investment in lowincome-producing assets. Secondary residences, such as holiday homes, are also captured under the assets test.
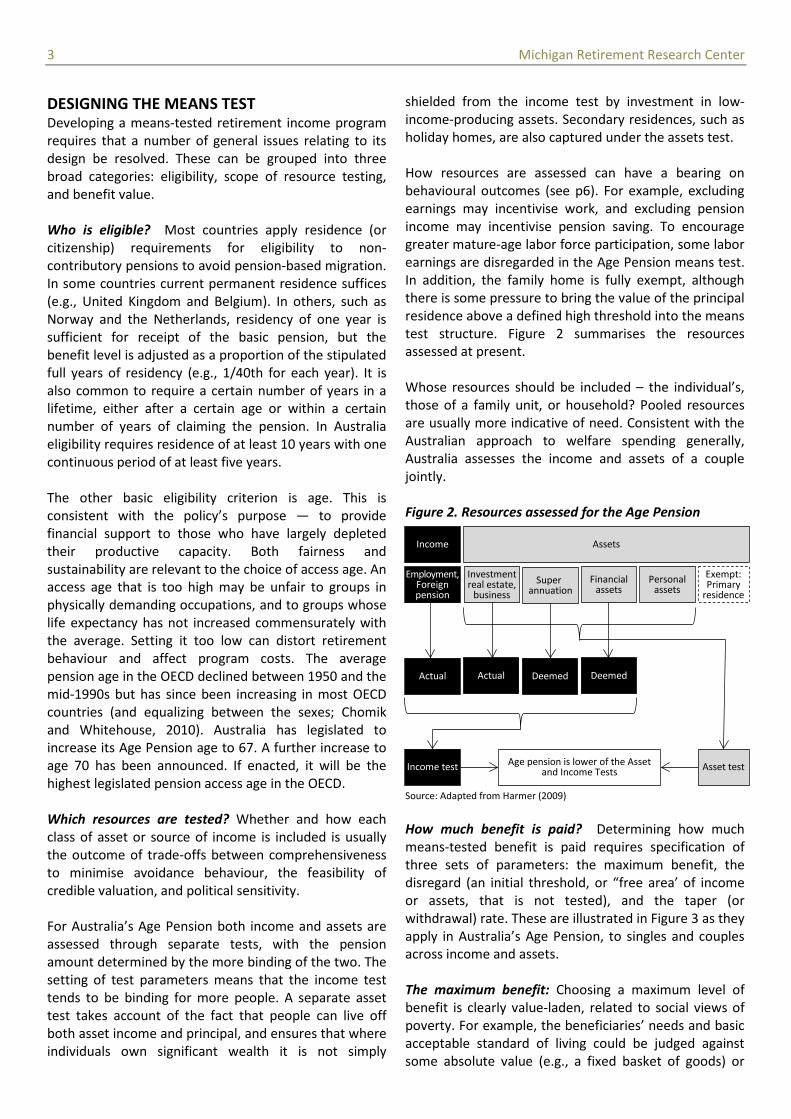
How resources are assessed can have a bearing on behavioural outcomes (see p6). For example, excluding earnings may incentivise work, and excluding pension income may incentivise pension saving. To encourage greater mature-age labor force participation, some labor earnings are disregarded in the Age Pension means test. In addition, the family home is fully exempt, although there is some pressure to bring the value of the principal residence above a defined high threshold into the means test structure. Figure 2 summarises the resources assessed at present.
Whose resources should be included – the individual’s, those of a family unit, or household? Pooled resources are usually more indicative of need. Consistent with the Australian approach to welfare spending generally, Australia assesses the income and assets of a couple jointly.
Figure 2. Resources assessed for the Age Pension
Source: Adapted from Harmer (2009)
Superannuation
Investment real estate,
business Financial
assets Personal
assets Exempt:Primary
residence
Deemed Actual Deemed
Age pension is lower of the Assetand Income Tests Asset test Income test
Actual
Employment,Foreignpension
Income Assets
How much benefit is paid? Determining how much means-tested benefit is paid requires specification of three sets of parameters: the maximum benefit, the disregard (an initial threshold, or “free area’ of income or assets, that is not tested), and the taper (or withdrawal) rate. These are illustrated in Figure 3 as they apply in Australia’s Age Pension, to singles and couples across income and assets. The maximum benefit: Choosing a maximum level of benefit is clearly value-laden, related to social views of poverty. For example, the beneficiaries’ needs and basic acceptable standard of living could be judged against some absolute value (e.g., a fixed basket of goods) or

$0k
$5k
$10k
$15k
$0k
$5k
$10k
$15k
$0k $10k $20k $30k $40k $200k $400k $600k
Age
Pens
ion
amou
nt (U
SD P
PP)
Age
Pens
ion
amou
nt (U
SD P
PP)
Assessable income (USD PPP) Assessable assets (USD PPP)
Couples (per person) Couples (per person)
Singles Singles
Earnings
Other income
Renter
Home owner
Renter
Home owner
Earnings
Other income
4 Michigan Retirement Research Center
against prevailing, economy-wide community standards. Australian policy has tended to focus on the latter, relative concept. In turn, a number of benchmarks can guide this decision (e.g., minimum wages, community budget standards, or relative poverty lines). Australia has opted to benchmark the maximum Age Pension to a given proportion of average wages, based on poverty studies. This translates to a benefit of approximately 28 percent and 42 percent of Male Total Average Weekly Earnings for singles and couples, respectively (an additional supplement for cost-of-living expenses, such as utilities, is also paid).
The base rate of the Age Pension is indexed by the higher of the percentage increase in the Consumer Price Index and the percentage increase in the Pensioner and Beneficiary Living Cost index. This amount is then compared to the wages benchmark and increased to equal it, if necessary. The current government, however, has announced its intention to link pension changes to prices from 2017. Even if the policy is passed into law, it is unclear how politically sustainable such an indexation policy is in the long term.
The different benefit levels for singles and couples take account of the cost-sharing economies of scale available to households. The majority of OECD countries maintain such a difference in noncontributory pension benefit levels (OECD, 2013). In Australia, the approach has been to match households on the basis of outcome (e.g., financial stress). The method involves finding the ratio of incomes for different households with the same level of outcome. Recently, it was found that, on this basis, the ratio between the Age Pension for singles and couples was about 66 percent, which resulted in a substantial increase in the single rate (Harmer, 2009).
The disregard: While the maximum amount affects the Age Pension received by those at the bottom of the income and asset distribution, the disregard and taper determine how those with greater means are affected. These instruments can also act as useful policy levers. As noted earlier, the Age Pension income test includes an additional disregard for earned income. Known as the Work Bonus, it was introduced in 2009 and expanded in 2011. Individuals can now earn up to about $7,200 (U.S., Purchasing Power Parity/PPP) and still receive a full Age Pension. About six percent of pensioners have so far taken advantage of the Work Bonus (DSS, 2013).
Within the asset test, the level of assets disregarded is higher for renters than home owners, to reflect a greater need for renters to store savings in what would otherwise be assessable assets.
The taper: Beyond the disregard, the benefit is withdrawn for every extra dollar of income and assets based on a taper. A shallower taper is more generous but will be more expensive and affect more people up the income or asset distribution. The Age Pension income test has a 50 percent taper rate: every extra dollar of income results in 50c less pension. A single person with a private income of just over $30,000 (U.S., PPP) still receives some Age Pension.
With the asset test, every $1,000 in excess of the disregard results in $1.50 less pension per fortnight (or $39 per annum). Since the asset test is designed to capture those holding low-income-producing assets, it has a large disregard but an aggressive taper. Nevertheless, based on the asset test, an eligible couple can hold more than a combined $850,000 (U.S., PPP) in assets, other than the principal residence, and still receive some pension — an unusual outcome, since in most cases, the income test would be binding.
Recent reforms demonstrate how the means test parameters can interact. In 2009, when Government sought to increase the maximum benefit rate for the poorest pensioners, it simultaneously increased the taper from 40 to 50 percent. The more aggressive taper meant that increases in pension were more tightly targeted and affordable.
Figure 3. Age Pension by income and asset level
Source: Authors’ compilation based on www.dhs.gov.au. Note: In USD PPP
ADMINISTERING THE MEANS TEST A common criticism of the means test is that it is operationally burdensome. But various techniques can be deployed to make the means test both effective and administratively manageable.
5 Michigan Retirement Research Center
Operational responsibility: Most customer-facing government services relating to social security, employment, education, and health benefits are provided by a single agency, the Department of Human Services (DHS), on behalf of a number of client departments. Centralization of delivery is part of a series of ongoing reforms intended to integrate services and generate economies of scale and scope.
Assessment and reassessment: Administering the Age Pension consists of initial claim processing and subsequent reassessments. A claim entails similar processes and costs found in any payment system, regardless of means testing: proof of identity, age, and residency, as well as bank account details. In addition, it involves the initial collection and assessment of income and asset information. To ensure timely payment, prelodging claims ahead of eligibility is possible.
Determining payment for some individuals is more complex than others. For example, assessments involving income from business holdings or trusts are considered more complex and costlier to administer. These comprised about eight percent of assessments and involved two percent of benefits paid in 2006-07 (such cases are increasing over time; Australian National Audit Office, 2007). But most cases are much simpler.
Once the pension is being paid, reassessments are triggered by several mechanisms. The recipient has an obligation to notify DHS of changes in work status, relationship status, or significant changes relating to income and assets such as investment, inheritance, or gifts. Those with very volatile employment income are registered as a “variable reporter,” and need to report earnings on a regular basis. Those in a stable job only need to report when their income changes. The Work Bonus allows the unused earnings disregard to be “banked” and used over the course of the year without affecting fortnightly payments. Business owners can provide evidence that recent profits are about to turn into an imminent loss.
Automatic reassessments of financial investments take place on a six-monthly basis. Listed securities and managed investments are routinely revalued on 20 March and 20 September each year in accordance with social security legislation. In addition, a recipient can request Centrelink to update the values of their listed securities and managed investments at any time.
Both the initial assessment and further self-reporting can be made via online systems. Current self-service options include a smartphone app that allows pensioners to update contact details, report labor
income, view payments, and capture and upload documents (DSS, 2013)
Error and fraud: Compliance issues arising from systematic errors and fraud are dealt with via a quality control framework of prevention, detection, and deterrence. This primarily involves an automated sample survey and audit that identifies systematic problems, whether these are related to errors by customer, staff, procedure, or guidance material (ANAO, 2012). An early review found significant under- and over-payment resulting from initial assessments, but the net effect was statistically insignificant (ANAO, 2001). Benefit fraud is relatively low. For all social security payments, about 25,000 fraud investigations were initiated in 2008-09, and only around 3,000 led to convictions (ANAO, 2011). Compliance checks include matching with data sources held by banks, Superannuation funds, the stock exchange, land registry, and the tax authority.
Simplifying design: Several design features of the means test have a pragmatic purpose to simplify and lower costs of assessment. For example, as noted earlier, the income test is designed to be less generous than the asset test. Making the former more binding is easier for administration: income is often easier to identify and value than, say, a work of art, which may require an independent valuation and be subject to more volatility.
Also, the income from financial and Superannuation assets is assessed on a “deemed” basis. This means that it is calculated from the asset value by using a set rate based on returns available in the market from a range of investments, rather than by looking at actual income received.
Cost: Taken together, a number of features contribute to the operational cost efficiency of the Australian means-testing regime. It is difficult to isolate the cost of administering the means test itself, let alone compare it to an alternative of collecting and keeping more than 30 years’ worth of social security claims. In terms of overall operational costs of the benefit system, we calculate that benefit administration in Australia (including depreciation of assets) costs approximately 3.6% of total benefit outlays. It assumes equal administrative effort across all benefits (DHS, 2014; DSS, 2013, 2014).
Comparing countries across different administrative arrangements means that we are not necessarily comparing like with like. Nonetheless, for reference, the administrative expense of the U.S. Social Security Administration is estimated at around 1.4% of total benefit outlays in 2013 (SSA, 2014).
6 Michigan Retirement Research Center
INCENTIVES AND ECONOMIC EFFICIENCY The case for means testing has been strengthened in recent years not only by the imperatives of demographic transition, but also by new analytical insights which indicate that a means-tested program may have features that enhance economic efficiency in an economy with pre-existing distortionary taxes.
If these analyses of the benefits of means tests are correct, then research is needed to understand how to best capture their efficiency-improving potential. Means tests, where they do exist, are often crudely and arbitrarily designed and have received limited attention from academic researchers. For policymakers they represent a policy lever with an unrealised potential.
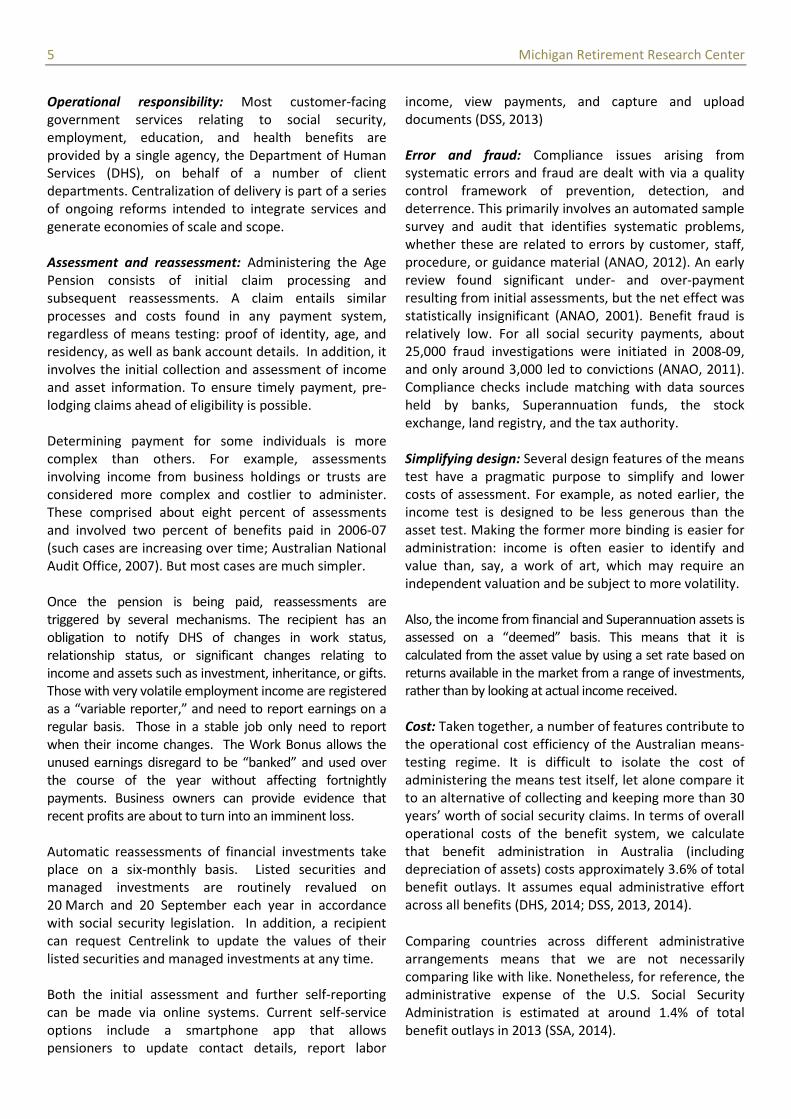
Assessing incentives: The usual place to start when assessing the incentive effects of retirement income transfers (and targeted social assistance programs in general), is to look at the effective marginal tax rates (EMTRs) facing potential beneficiaries as the benefit is withdrawn. Targeted programs can induce large EMTRs and can reduce incentives to work and save for individuals close to or within the withdrawal range (see Figure 4). Because efficiency costs, or excess burdens increase disproportionately with EMTRs, their estimation is a natural focus for analysis.
Figure 4. EMTR for single Age Pensioner, 2014
100%
90%
80%
70%
60%
50%
40%
30%
20%
10%
0% $0k $5k $10k $15k $20k $25k $30k $35k $40k $45k
yearly private earned income (USD PPP)
Note: Rounded; Includes effect of pension taper, Medicare levy and tax (including offsets). Source: Adapted from Plunkett (Unpublished)
In the context of means testing retirement transfers, however, there are potentially important trade-offs between the EMTR, the number of people affected by the targeting, and other explicit taxes in the economy, especially when the transfer program is large. We discuss these issues next.
Direct incentive effects: Assume for the moment that we wish to compare a targeted with a universal social pension. A universal pension affects everyone. The entitlement of an income late in life will impact on labor supply and saving rates of workers responding rationally to the existence of the program, since the payment acts as a substitute for private income in retirement. On the other hand, a targeted pension will affect three groups of people differentially.
First, poorer people will be affected just as they would be with a universal pension — no matter how they behave, they’ll end up with the maximum benefit. Second, rich people will have no access to the means-tested pension, so they will be affected less than they would be with a universal pension. Third, there will be a group of people in the middle who will confront the higher EMTRs associated with the withdrawal of the means-tested pension. It is important to distinguish between these groups. In particular, those who save most and whose labor is most valuable are likely to mostly lie within the rich group, so their behaviour will be unaffected by a means-tested program.
The problem is complicated by dynamic inter-temporal effects: the prospect of benefiting from a transfer during old-age might affect decisions about labor supply and savings during working life. So individuals who would behave so as to render themselves ineligible for a transfer if a transfer program did not exist may alter their behaviour to become eligible for a transfer because the program is in place. Although this may occur at the margins of the groups, it is impractical for most people to structure their life decisions, especially earlier in life when decisions about education and occupation are made, to target a particular means test position.
The direct impact of the means test on the three groups is visible in modelling of lifecycle labor supply in Australia by Kudrna (2014), shown in Figure 5. The poorest two quintiles and the richest quintile demonstrate a smooth transition to retirement unaffected by the means test. The third and fourth quintiles, however, reduce their labor supply to avoid high EMTRs as soon as they become eligible for the Age Pension. In the model, their labor earnings drop to a level of the earnings disregard in the income test.
Almost no empirical work has been done to estimate the impacts of the means tests on labor supply and saving behaviour. Atalay and Barrett (2012) have analysed the impact of Age Pension eligibility age on retirement and program dependence, and find that increasing access age has a major impact on mature labor force

7 Michigan Retirement Research Center
participation. Warren and Oguzoglu (2010) examine the trade-offs of working longer when both a means-tested Age Pension and a mandatory DC accumulation plan exist. They find that the existing system does provide an incentive to retire early, especially for men, and that increasing Age Pension access age would lead to higher labor force participation. These findings are consistent with a large international literature pointing to the importance of the age at which retirement entitlements become accessible, on labor supply behaviour.
Figure 5. Modelled lifecycle labor supply, Australia
40
35
30
25
20
15
10
5
0
Highest Fourth Third Second Lowest
20 30 40 50 60 70 80
Hrs w
orke
d pe
r wee
k
Age Source: Kudrna (2014)
Another concern is that the means test introduces incentives to spend and invest assets in a way that increases benefit receipt. This is feasible in Australia, where savings from the second and third retirement income pillars can be spent with no restriction after reaching preservation age or invested in the family home and shielded from the asset test. While a genuine policy concern, there is conflicting anecdotal evidence of such attempts to “game’ the system (Rice Warner, 2014; Challenger, 2012), and limited empirical evidence. Piggott and Sane (2011) suggest that the exemption of the principal residence from the asset test discourages trade-downs among pensioners. Unpublished administrative data suggests that there is some underspending of Superannuation assets, possibly for self-insurance purposes.
Beyond partial analysis of incentives: Like any other tax-financed financial transfer, retirement income transfers impact incentives at two points in economic transactions: when the tax is levied, and when the transfer is received. These two points of price distortion must both be taken into account in assessing the economic efficiency effects of a tax-transfer policy. To capture both these points of intervention, however, it is
necessary to adopt an economy-wide conceptual framework. Critical here is to appreciate that the revenue requirement to finance a retirement transfer implies higher taxes elsewhere.
If, for example, labor income taxes are used to finance the Age Pension, then labor supply distortions will be affected by pension design. For a given value of full pension, the taper rate will impact on this. The lower the taper rate, the lower will be the EMTR, but the higher the proportion of people affected, both by the taper rate itself, and by the transfer rights. Second, as the taper rate (and the associated EMTR) is reduced, the overall revenue requirement of the program will increase, and this will require higher tax rates to be applied to others in the economy, probably workers. If they already pay high taxes, as is the case in developed countries, then the same argument about disproportionate efficiency costs of high marginal tax rates will apply, offsetting the EMTR reduction among pension recipients.
Economy-wide empirical research: An empirical analysis undertaken by Kudrna (2014), introduced in Figure 5, uses an Overlapping Generations (OLG) model calibrated to the Australian economy which has a rich treatment of retirement policy, to assess the impacts of varying the means test taper in the Australian Age Pension.
Recently, several changes in the income test of the Age Pension were implemented, with aims to better target the pension payments to those in need and to encourage labor supply of older Australians. These include an increase in the taper rate from 40 to 50 percent in 2009 and a new labor earnings disregard. Kudrna examines the model impact of tightening the taper rate, and of extending the earned income exemption.
His modelling suggests that a high taper has positive effects on aggregate labour supply and asset accumulations, as well as on long term welfare. Also, while relaxing the income test for earned income has little aggregate impact (including on total government spending on the Age Pension), due to the relatively small numbers of people affected and assumed productivity rates of the elderly workforce, the policy has largely positive effects on labour supply at older ages.
The major welfare improvements come from the reduced income taxes needed to support an Age Pension with tighter withdrawal rates. These results support those reported by Tran and Woodland (2011). They emphasise the importance of thinking about major policy change in economy-wide terms.
8 Michigan Retirement Research Center
Liquidity, uncertainty, and the taxation of capital: More complicated models, introducing uncertainty and liquidity constraints, suggest even more strongly that means testing may have a role in overall tax design. A means-tested pension of the kind under discussion here is essentially a tax on capital. The received wisdom since the 1980s has been that it is inefficient to tax capital (Judd, 1985; Chamley, 1986). The reasoning is based on the idea that taxing capital discourages savings and investment, and in turn, affects economic growth.
But some researchers have identified a number of qualifications to this conclusion. Take liquidity constraints for example. Some people are unable to insure against sudden drops in income and can’t borrow in the financial market if income does drop. Hubbard and Judd (1986) show that taxing income instead of capital results in efficiency losses from a reduced lifetime consumption of these constrained individuals.
A lifecycle framework is particularly helpful here. Since individuals’ productivity and optimal consumption-work plans vary with age, it would be possible to design age-specific taxes without distorting consumption and labor supply. Such taxes are unlikely to be popular, but Erosa and Gervais (2002) find that a positive capital income tax rate can act as a substitute. Instead of paying the tax in prime-age, workers would pay it later, from their accumulated savings.
Conesa et al. (2009) quantitatively characterize the optimal capital and labor income tax by using an OLG model in which individuals face uninsurable idiosyncratic income shocks and permanent productivity differences. They find that the optimal capital income tax rate is significantly positive at 36 percent. Further, taxing capital income, which is most important later in life, may act as a second best tax on retirement capital’s complement, retirement leisure.
What is the implication for means testing? The above studies strengthen the economic rationale for pension means testing since it is exactly a tax on assets or capital income. Moreover, it is better targeted than a generic capital income tax because it directly addresses the complementarity between retirement saving and retirement leisure.
Relatively little quantitative research has been undertaken using this kind of model to assess behavioural response to means testing. Kumru and Piggott (2010) find higher taper rates are welfare-improving in the context of the U.K. economy and means-tested elements within the pension system.
So far, all these studies assume “plain vanilla” means test designs. Means test withdrawal rates potentially could be far better tailored than they currently are. Taper rates could vary with the value of wealth and income, and also the age of the pension recipient. This is an important research program which has barely begun. But it may hold the key to resolving the tension between providing adequate income to the retired, and keeping the associated fiscal requirement under control.
OUTCOMES AND CONCLUDING DISCUSSION Retirement income policy is complex, and is usually bound to the culture and values of the society to which it applies. Presenting the policy of one country and applying it to another can therefore be seen as over-simplistic, or at best naïve. At the same time, however, outcome comparisons can point to possible directions for reform.
In this spirit, we show below the outcomes for Australia and the U.S. of government funded retirement transfers, for elderly poverty rates and fiscal outlays as a proportion of GDP.
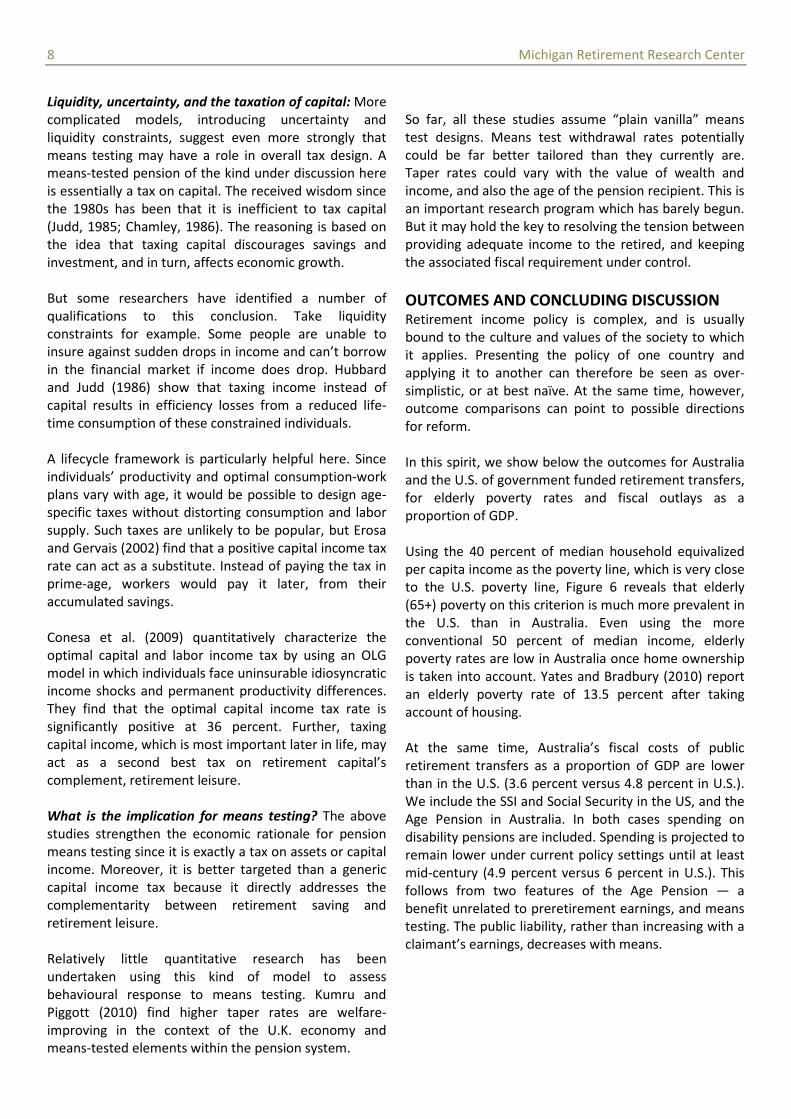
Using the 40 percent of median household equivalized per capita income as the poverty line, which is very close to the U.S. poverty line, Figure 6 reveals that elderly (65+) poverty on this criterion is much more prevalent in the U.S. than in Australia. Even using the more conventional 50 percent of median income, elderly poverty rates are low in Australia once home ownership is taken into account. Yates and Bradbury (2010) report an elderly poverty rate of 13.5 percent after taking account of housing.
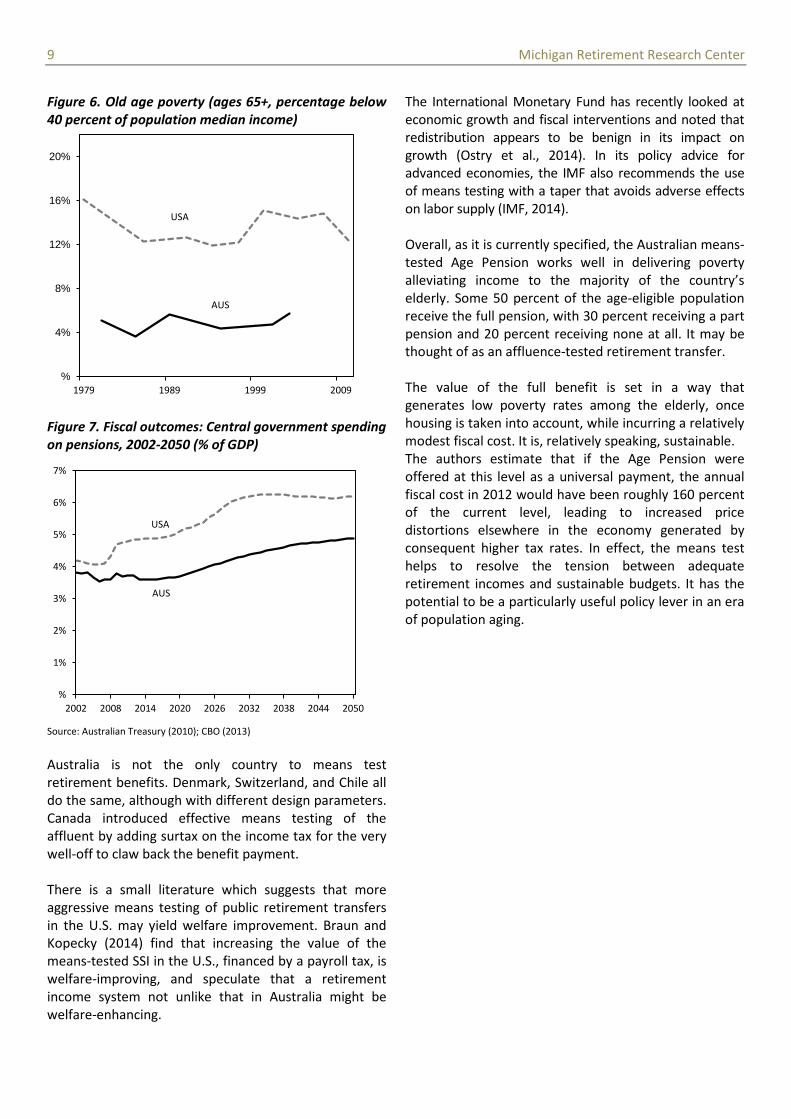
At the same time, Australia’s fiscal costs of public retirement transfers as a proportion of GDP are lower than in the U.S. (3.6 percent versus 4.8 percent in U.S.). We include the SSI and Social Security in the US, and the Age Pension in Australia. In both cases spending on disability pensions are included. Spending is projected to remain lower under current policy settings until at least mid-century (4.9 percent versus 6 percent in U.S.). This follows from two features of the Age Pension — a benefit unrelated to preretirement earnings, and means testing. The public liability, rather than increasing with a claimant’s earnings, decreases with means.
9 Michigan Retirement Research Center
Figure 6. Old age poverty (ages 65+, percentage below 40 percent of population median income)
20%
16% USA
12%
8% AUS
4%
% 1979 1989 1999 2009
Figure 7. Fiscal outcomes: Central government spending on pensions, 2002-2050 (% of GDP)
7%
6%
5%
4%
AUS
USA
3%
2%
1%
% 2002 2008 2014 2020 2026 2032 2038 2044 2050
Source: Australian Treasury (2010); CBO (2013)
Australia is not the only country to means test retirement benefits. Denmark, Switzerland, and Chile all do the same, although with different design parameters. Canada introduced effective means testing of the affluent by adding surtax on the income tax for the very well-off to claw back the benefit payment.
There is a small literature which suggests that more aggressive means testing of public retirement transfers in the U.S. may yield welfare improvement. Braun and Kopecky (2014) find that increasing the value of the means-tested SSI in the U.S., financed by a payroll tax, is welfare-improving, and speculate that a retirement income system not unlike that in Australia might be welfare-enhancing.
The International Monetary Fund has recently looked at economic growth and fiscal interventions and noted that redistribution appears to be benign in its impact on growth (Ostry et al., 2014). In its policy advice for advanced economies, the IMF also recommends the use of means testing with a taper that avoids adverse effects on labor supply (IMF, 2014).
Overall, as it is currently specified, the Australian means-tested Age Pension works well in delivering poverty alleviating income to the majority of the country’s elderly. Some 50 percent of the age-eligible population receive the full pension, with 30 percent receiving a part pension and 20 percent receiving none at all. It may be thought of as an affluence-tested retirement transfer.
The value of the full benefit is set in a way that generates low poverty rates among the elderly, once housing is taken into account, while incurring a relatively modest fiscal cost. It is, relatively speaking, sustainable. The authors estimate that if the Age Pension were offered at this level as a universal payment, the annual fiscal cost in 2012 would have been roughly 160 percent of the current level, leading to increased price distortions elsewhere in the economy generated by consequent higher tax rates. In effect, the means test helps to resolve the tension between adequate retirement incomes and sustainable budgets. It has the potential to be a particularly useful policy lever in an era of population aging.
10 Michigan Retirement Research Center
REFERENCES ABS (Australian Bureau of Statistics) (2012) “Year book
Australia, 2012” Cat 1302.0, Canberra, Australia http://www.abs.gov.au/ausstats/[email protected]/Lookup/by%20S ubject/1301.0~2012~Main%20Features~Housing%20and%2 0life%20cycle%20stages~132
ANAO (Australian National Audit Office) (2001) “Assessment of New claIms for the Age Pension by Centrelink.” The Auditor-General Audit Report No.34 2000–2001 Performance Audit http://www.anao.gov.au/~/media/Uploads/Documents/20 00%2001_audit_report_34.pdf
ANAO (Australian National Audit Office) (2007) “Administration of Complex Age Pension Assessments,” The Auditor-General, Audit Report No.26 2006–07, Performance Audit http://www.anao.gov.au/~/media/Uploads/Documents/20 06%2007_audit_report_26.pdf
ANAO (Australian National Audit Office) (2011) “Centrelink Fraud Investigations,” The Auditor-General, Audit Report No.10 2010–11, Performance Audit http://www.anao.gov.au/uploads/documents/201011_Audit_Report_No_10.pdf
ANAO (Australian National Audit Office) (2012) “Quality On Line Control for Centrelink Payments,” The Auditor-General, Audit Report No.28 2011–12, Performance Audit http://www.anao.gov.au/~/media/Uploads/Audit%20Repor ts/2011%2012/201112%20Audit%20Report%2028/201112 %20Audit%20Report%20No%2028.pdf
Atalay, K., and Barrett, G., (2012) “The impact of Age Pension eligibility age on retirement and program dependence: Evidence from an Australian experiment,” Social and Economic Dimensions of an Aging Population Research Papers, McMaster University
Australian Treasury (2010) “Australia to 2050: Future Challenges,” Commonwealth of Australia
Braun, R., Kopecky, K., and Koreshkova, T., (2013) “Old, sick, alone, and poor: A welfare analysis of old-age social insurance programs,” Working Paper 2013-02, Federal Reserve Bank of Atlanta
Challenger (Retirement Income Research) (2012) How much super do Australians really have? Retirement Income Research: April 2012
Chamley, C. (1986) “Optimal taxation of capital income in general equilibrium with infinite lives,” Econometrica, 54, 607-622
Chomik, R., and Whitehouse, E., (2010) “Trends in pension eligibility ages and life expectancy, 1950-2050’ OECD Social, Employment and Migration Working Papers, OECD, Paris
Conesa, J., Kitao, S., and Krueger, D., (2009) “Taxing capital? Not a bad idea after all!’ American Economic Review, 99,
DHS (Department of Human Services) (2014) “Portfolio budget statements 2014-15: Budget related paper no. 1.15b,” The Australian Government Department of Human Services http://www.humanservices.gov.au/spw/corporate/publicat ions-and-resources/budget/1415/resources/2014-15-dhspbs.pdf
DSS (Department for Social Services) (2014) “Portfolio budget statements 2014–15: Budget related paper No. 1.15a,” The Australian Government Department of Human Services http://www.dss.gov.au/sites/default/files/documents/05_2 014/2014-2015_dss_pbs.pdf
DSS (Department of Social Services, formerly FaHCSIA) (2013) “Annual Report,” The Australian Government Department of Social Services http://www.dss.gov.au/sites/default/files/documents/10_2 013/facs_41449_ar123_accpdf_fa5.pdf
Erosa, A., and Gervais, M., (2002) “Optimal taxation in life-cycle economies’ Journal of Economic Theory, 105, 338-369
Harmer, J., (2009) “Pension Review Report,” Former Department of Families, Housing, Community Services and Indigenous Affairs (DSS), Commonwealth of Australia, Canberra
Hubbard, R., and Judd, K., (1986) “Liquidity constraints, fiscal policy, and consumption,” Brookings Papers on Economic Activity, 1, 1-50
IMF (International Monetary Fund) (2014) “Fiscal policy and Income Inequality,” IMF Policy Paper
Judd, K. (1985) “Redistributive Taxation in a Simple Perfect Foresight Model,” Journal of Public Economics, 28, 59-83
Kudrna, G., (2014) “Means testing of Australia’s Age Pension: A numerical analysis with an OLG model,” ARC Centre of Excellence in Population Ageing Research (CEPAR) working paper
Kumru, C., and Piggott, J., (2010) “Should Public Retirement Provision be Means-tested?,” mimeo
OECD (Organisation for Economic Cooperation and Development) (2013) “Pensions at a Glance,” OECD, Paris
Ostry, J., Berg, A., and Tsangarides, C., (2014) “Redistribution, Inequality, and Growth “ International Monetary Fund, SDN/14/02
Plunkett, D., (Unpublished) “Age pension EMTR,” ravebydave.blogspot.com.au
Rice Warner (2014) “Rice Warner submission to the Financial System Inquiry: Retirement income solutions’ http://ricewarner.com/media/101438/Rice-WarnerSubmission-to-the-Financial-System-Inquiry.pdf
Sane, R., and Piggott, J. (2011) “The Impact on Residential Choice of the Family Home Exemption in Resource-Tested Transfer Programs,” CEPAR Working Paper 2011/12
SSA (Social Security Administration) (2014) “SSA FY 2014 budget justification,” U.S. Government http://www.socialsecurity.gov/budget/FY14Files/2014AE.p df
Tran, C., and Woodland, A., (2011) “Trade-offs in means tested pension design,” ARC Centre of Excellence in Population Ageing Research (CEPAR) working paper
Warren, D., and Oguzoglu, U., (2010) “Retirement in Australia: A closer look at the financial incentives," Australian Economic Review, The University of Melbourne, Melbourne Institute of Applied Economic and Social Research, vol. 43(4), pages 357-375
Yates, J., and Bradbury, B., (2010) “ Home ownership as a (crumbling) fourth pillar of social insurance in Australia,” Journal of Housing and the Built Environment, vol. 25, no. 2, 193 – 211
25-48


Acknowledgements This work was supported by a grant from the Social Security Administration through the Michigan Retirement Research Center (Grant # 2 RRC08098401-06-00). The findings and conclusions expressed are solely those of the authors and do not represent the views of the Social Security Administration, any agency of the Federal government, or the Michigan Retirement Research Center.
Regents of the University of Michigan Mark J. Bernstein, Ann Arbor; Julia Donovan Darlow, Ann Arbor; Laurence B. Deitch, Bloomfield Hills; Shauna Ryder Diggs, Grosse Pointe; Denise Ilitch, Bingham Farms; Andrea Fischer Newman, Ann Arbor; Andrew C. Richner, Grosse Pointe Park ; Katherine E. White, Ann Arbor; Mark S. Schlissel, ex officio