ME4331 – DSC Review APR 29, 2008 Jeung Hwan Choi.
30
ME4331 – DSC Review APR 29 , 2008 Jeung Hwan Choi
-
date post
21-Dec-2015 -
Category
Documents
-
view
217 -
download
1
Transcript of ME4331 – DSC Review APR 29, 2008 Jeung Hwan Choi.
ME4331 – DSC Review
APR 29 , 2008
Jeung Hwan Choi

CALORIMETRY
Calorimetry
- The science of counting the heat of chemical reactions or physical changes.
- In constant-pressure calorimetry, the heat measured represents the enthalpy change.
Differential Scanning Calorimetry
Differential Scanning Calorimetry (DSC) is a thermal analysis method in which the difference in the amount of heat applied (or removed) to increase (or decrease) the temperature of a sample material and a reference material are measured as a function of temperature.
- Höhne et al. (1996) Differential Scanning Calorimetry- Perkin Elmer, Inc. - Wikipedia.org
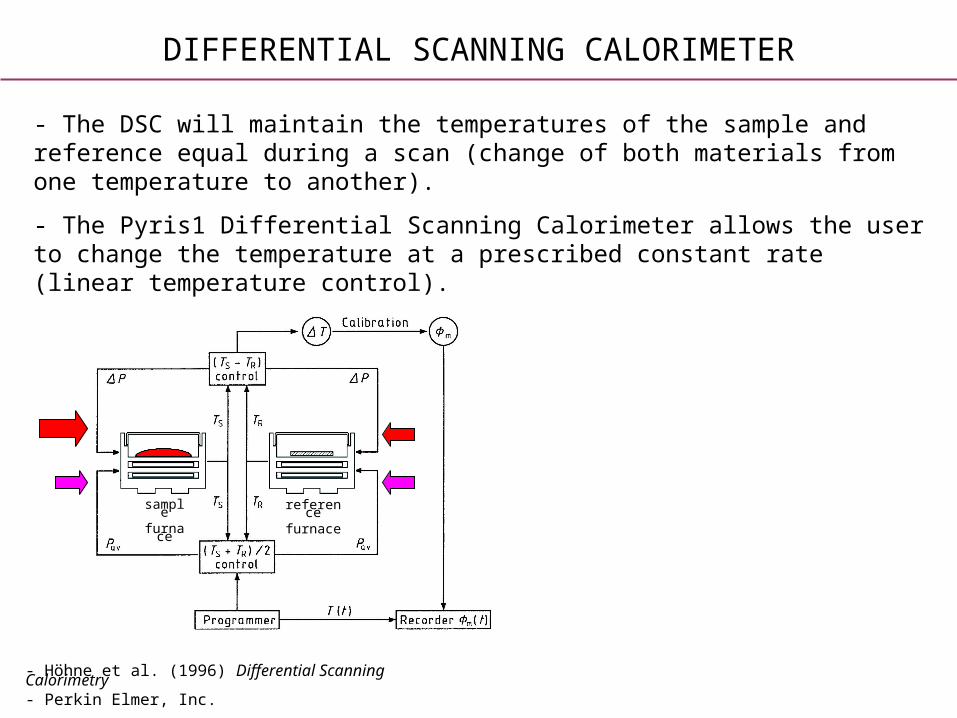
DIFFERENTIAL SCANNING CALORIMETER
samplefurnace
referencefurnace
- Höhne et al. (1996) Differential Scanning Calorimetry- Perkin Elmer, Inc.
- The DSC will maintain the temperatures of the sample and reference equal during a scan (change of both materials from one temperature to another).
- The Pyris1 Differential Scanning Calorimeter allows the user to change the temperature at a prescribed constant rate (linear temperature control).
DSC – ENDOTHERMIC VS. EXOTHERMIC
- Höhne et al. (1996) Differential Scanning Calorimetry- Perkin Elmer, Inc.
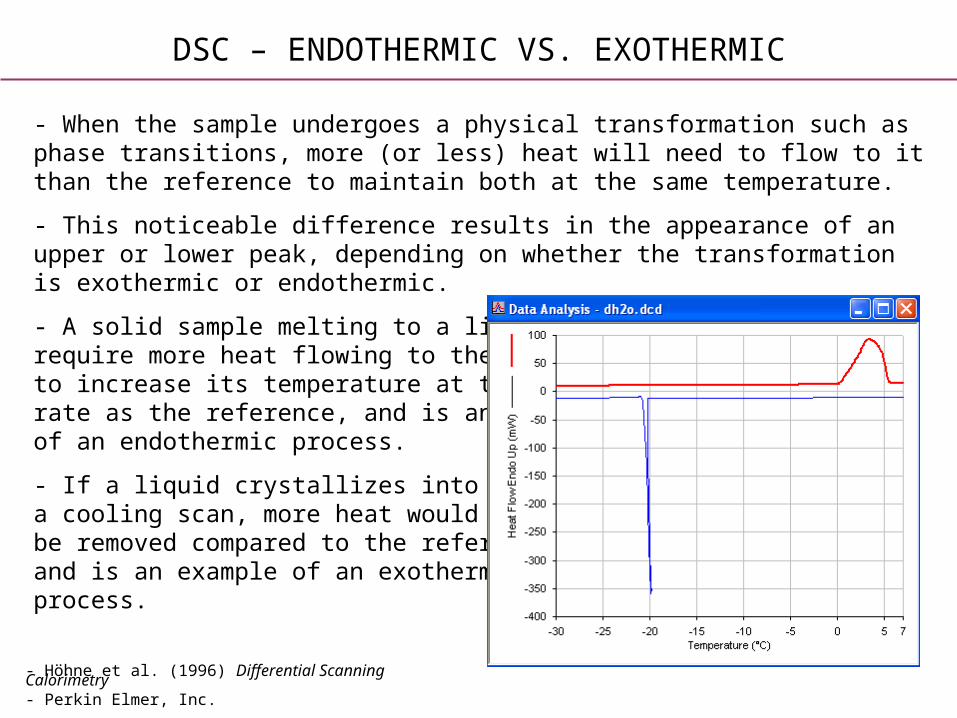
- When the sample undergoes a physical transformation such as phase transitions, more (or less) heat will need to flow to it than the reference to maintain both at the same temperature.
- This noticeable difference results in the appearance of an upper or lower peak, depending on whether the transformation is exothermic or endothermic.
- A solid sample melting to a liquid willrequire more heat flowing to the sampleto increase its temperature at the samerate as the reference, and is an exampleof an endothermic process.
- If a liquid crystallizes into a solid duringa cooling scan, more heat would have tobe removed compared to the referenceand is an example of an exothermicprocess.

DSC outline – latent heat
DSC – MELTING POINT
• Melting point measurement
Reference : Höhne et al. Differential Scanning Calorimetry 1996 Perkin Elmer, Inc.
heating rate = 5 °C/min
- Melting point of a pure substance (i.e. ice) is the onset temperature
- Onset is determined from the intersection of the slopes of the base and the rising curve
DSC outline – latent heat
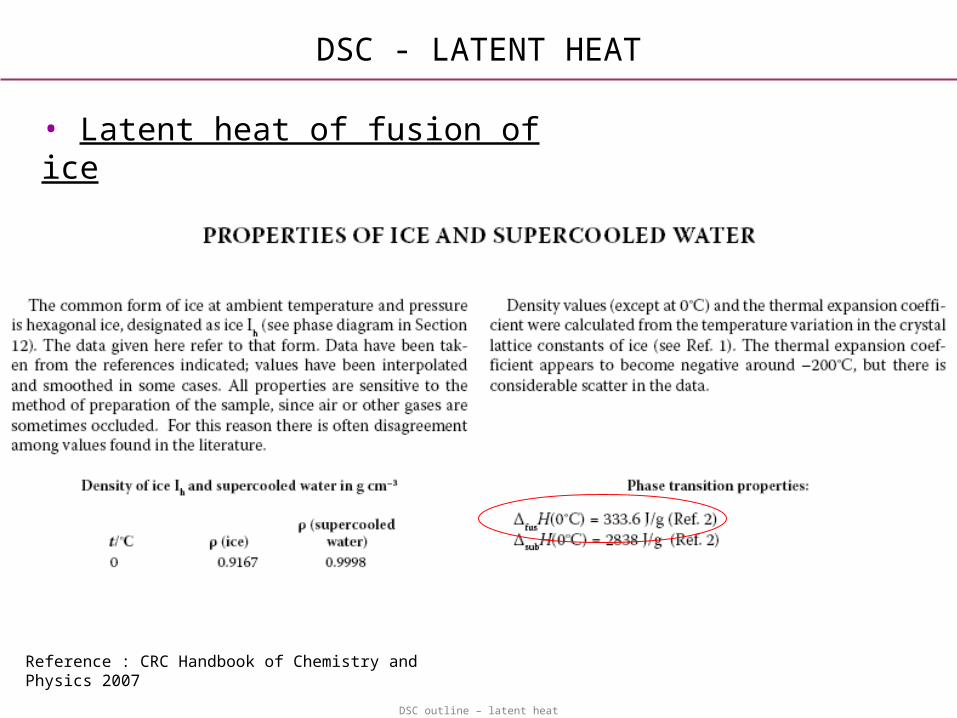
DSC - LATENT HEAT
• Latent heat of fusion of ice
Reference : CRC Handbook of Chemistry and Physics 2007

DSC outline – latent heat
DSC - LATENT HEAT
• Latent heat measurement
Reference : Höhne et al. Differential Scanning Calorimetry 1996 Perkin Elmer, Inc.
2
1
2
1
11T
T
t
t
dTdT
dt
dt
dH
mdt
dt
dH
mh dT
RateingCoolHeat
onCompensatiPower
m
T
T2
1)(
1
heating rate = 5 °C/min
Possible errors
- Weight value
- Evolution width
- Baseline error (Instrument based)
- Baseline error (sample based)
DSC outline – latent heat
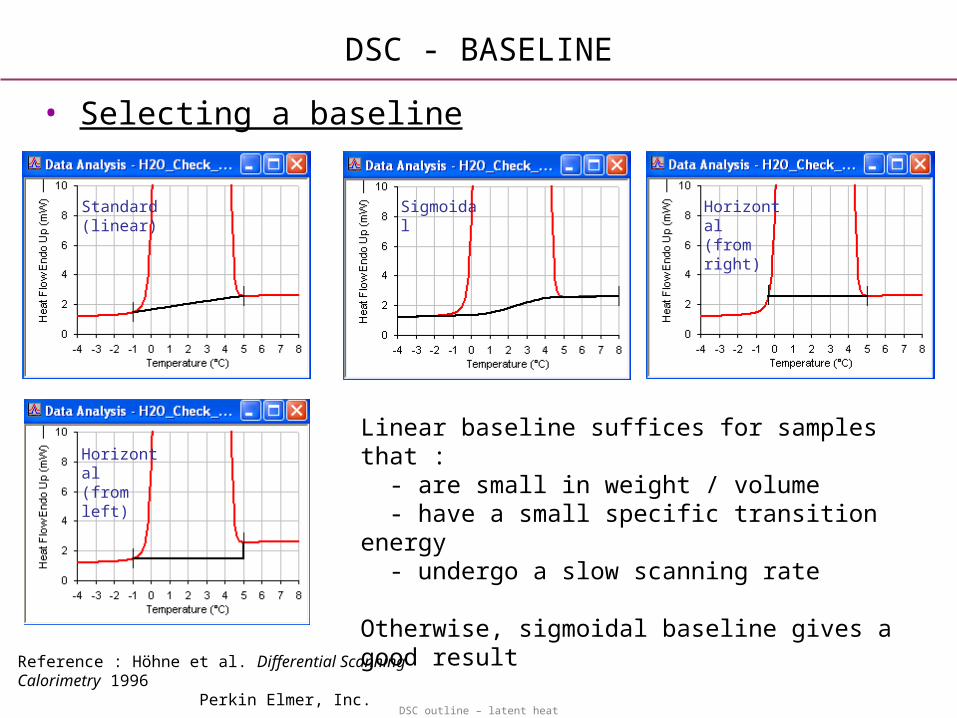
DSC - BASELINE
• Selecting a baseline
Reference : Höhne et al. Differential Scanning Calorimetry 1996 Perkin Elmer, Inc.
Standard(linear)
Sigmoidal Horizontal(from right)
Horizontal(from left)
Linear baseline suffices for samples that : - are small in weight / volume - have a small specific transition energy - undergo a slow scanning rate
Otherwise, sigmoidal baseline gives a good result

DSC outline – specific heat
DSC - SPECIFIC HEAT
• Specific heat of ice / water
Reference : CRC Handbook of Chemistry and Physics 2007

DSC outline – specific heat
DSC - SPECIFIC HEAT
• Specific heat measurement
Reference : Höhne et al. Differential Scanning Calorimetry 1996 Perkin Elmer, Inc.
dT
dt
dt
dH
mdT
dH
mcp
11
RateingCoolHeat
onCompensatiPower
m )(
1
heating rate = 5 °C/min
Red :with water
Blue :empty
Green :specific heat
DSC outline – specific heat
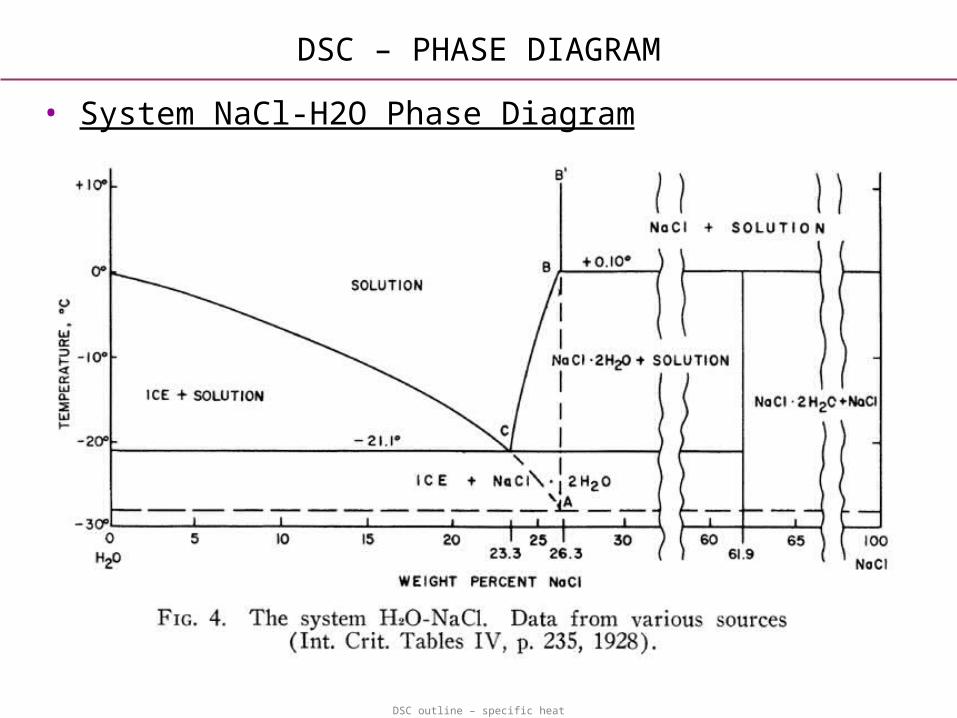
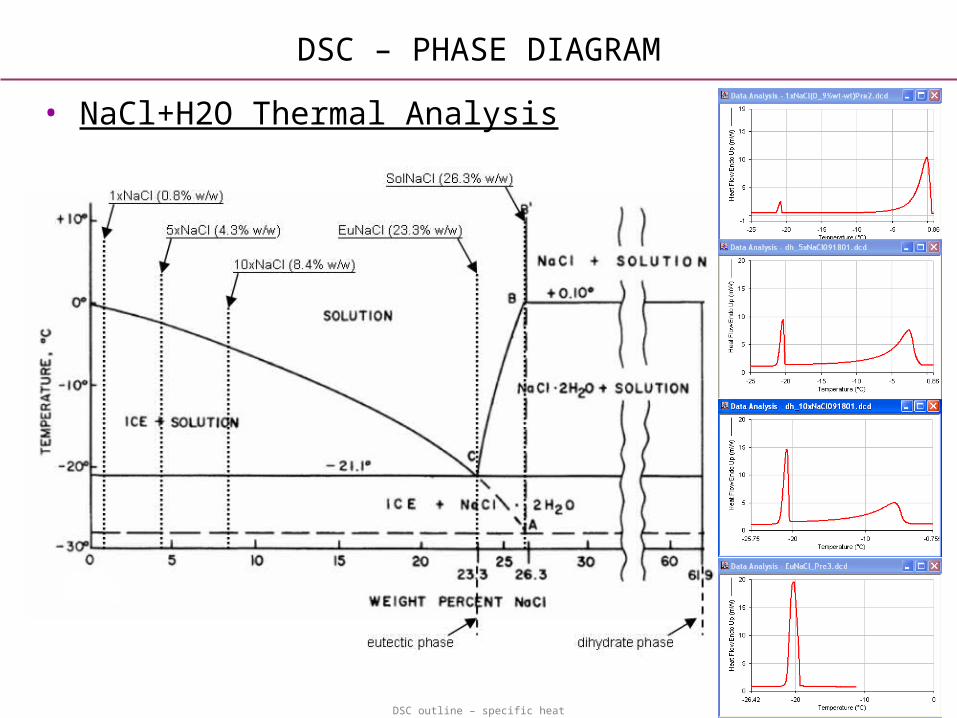
DSC – PHASE DIAGRAM
• System NaCl-H2O Phase Diagram
DSC outline – specific heat
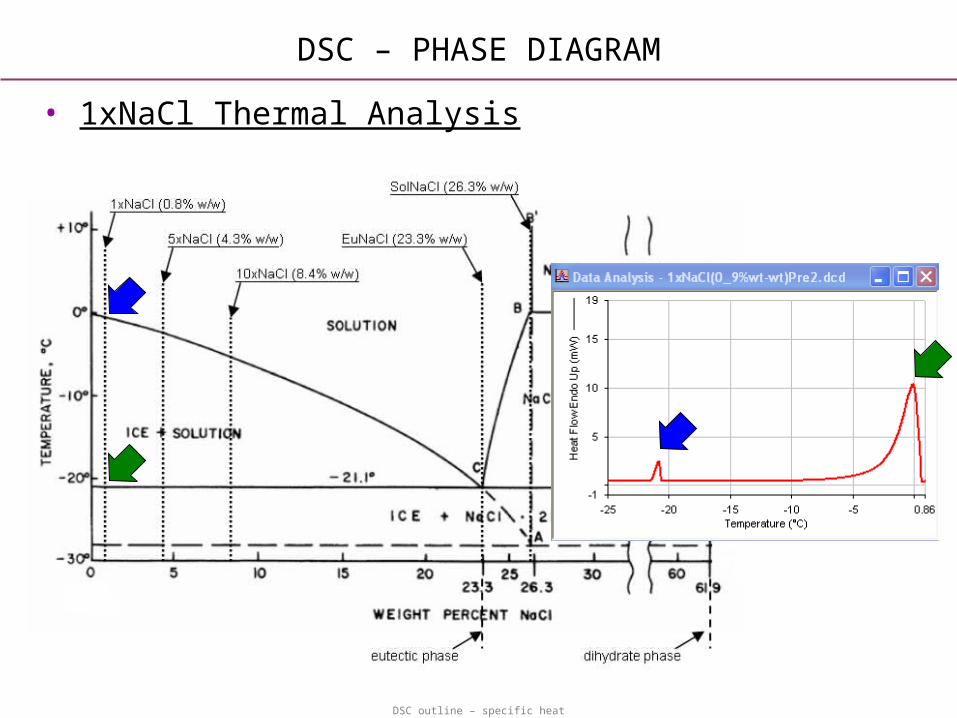
DSC – PHASE DIAGRAM
• 1xNaCl Thermal Analysis
DSC outline – specific heat
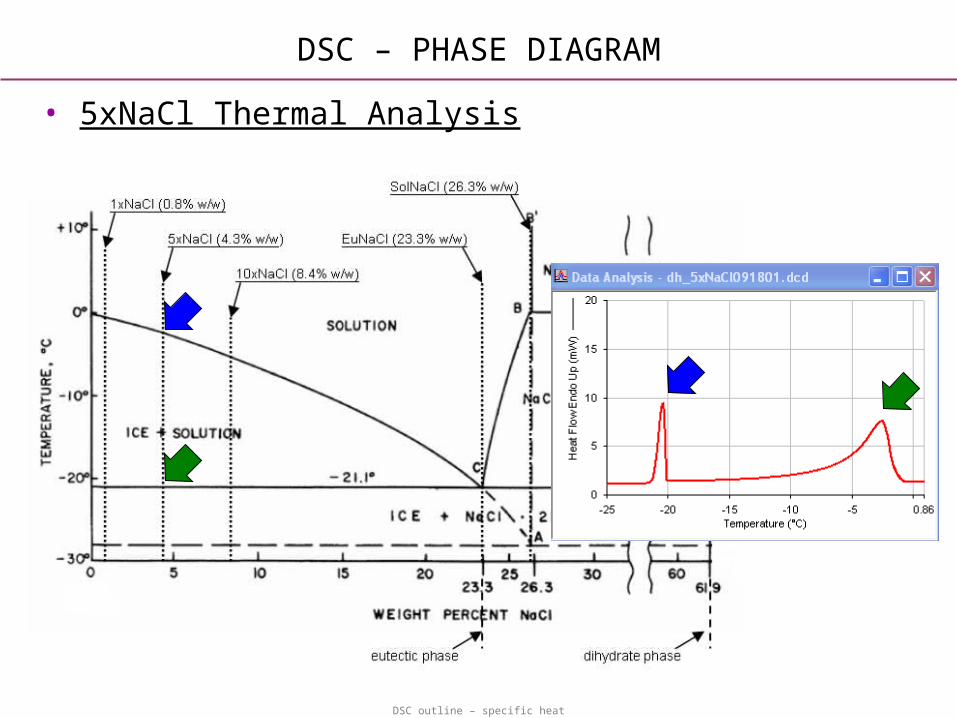
DSC – PHASE DIAGRAM
• 5xNaCl Thermal Analysis

DSC outline – specific heat
DSC – PHASE DIAGRAM
• 10xNaCl Thermal Analysis
DSC outline – specific heat
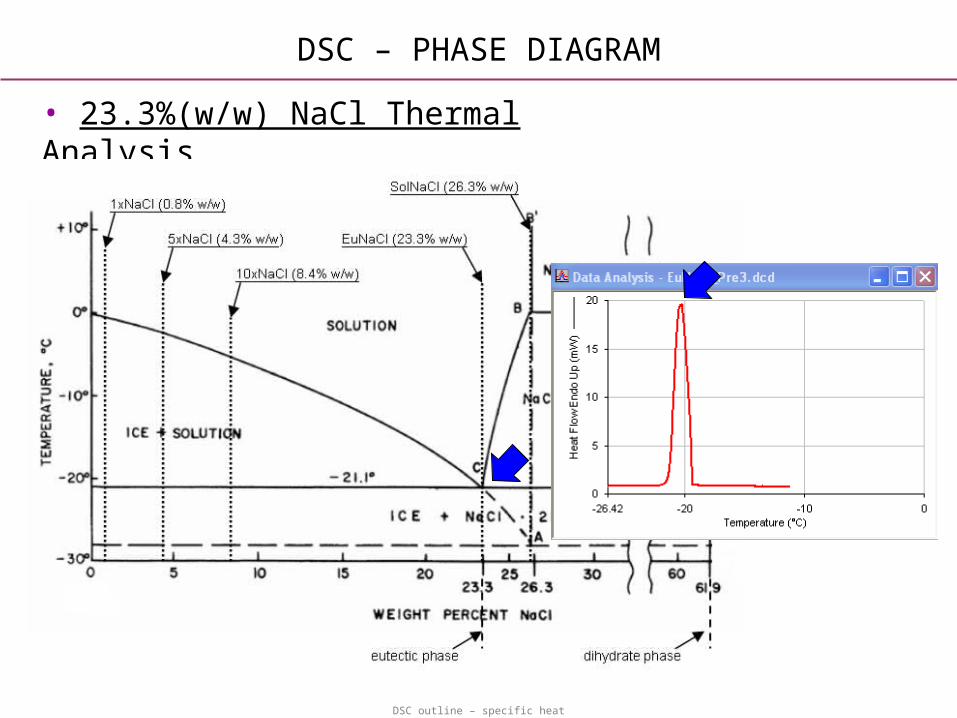
DSC – PHASE DIAGRAM
• 23.3%(w/w) NaCl Thermal Analysis
DSC outline – specific heat
DSC – PHASE DIAGRAM
• NaCl+H2O Thermal Analysis

DSC outline – specific heat
DSC – PHASE DIAGRAM
• NaCl+H2O Thermal Analysis

Cryomicroscopy - layout
CRYOMICROSCOPY
• Visualization of freeze-thaw events
Reference : Linkam Scientific Instruments
video text overlay
computer interfaced temperature controller
cooling pump
LN2 dewarmicroscope
cryostage

DSC outline – specific heat
CRYOMICROSCOPY
• Growth of Primary Ice
Video credits : Bumsoo Han

DSC outline – specific heat
CRYOMICROSCOPY
• Solidification of the Eutectic
Video credits : Bumsoo Han

ADD: 10xPBS eutectic (photo)
EUTECTIC SOLIDIFICATION
• Phase change behavior in salt solutions (10xPBS)
Photo credits : Adam Grovender
pre-eutectic @ -26°C eutectic @ -26°C(after supercooling)
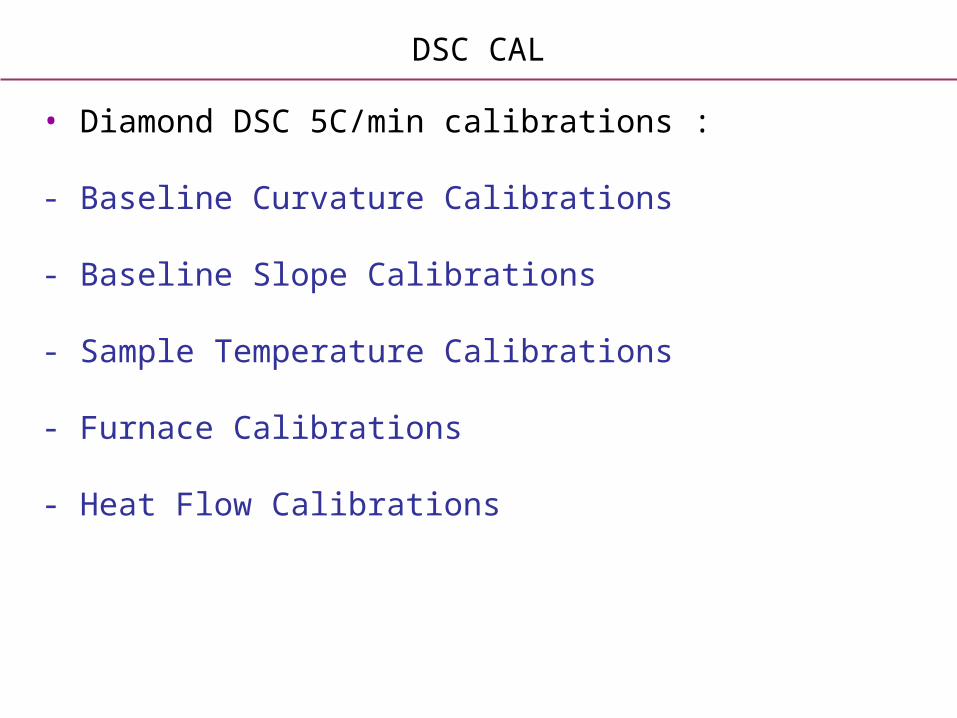
DSC CAL
• Diamond DSC 5C/min calibrations :
- Baseline Curvature Calibrations
- Baseline Slope Calibrations
- Sample Temperature Calibrations
- Furnace Calibrations
- Heat Flow Calibrations
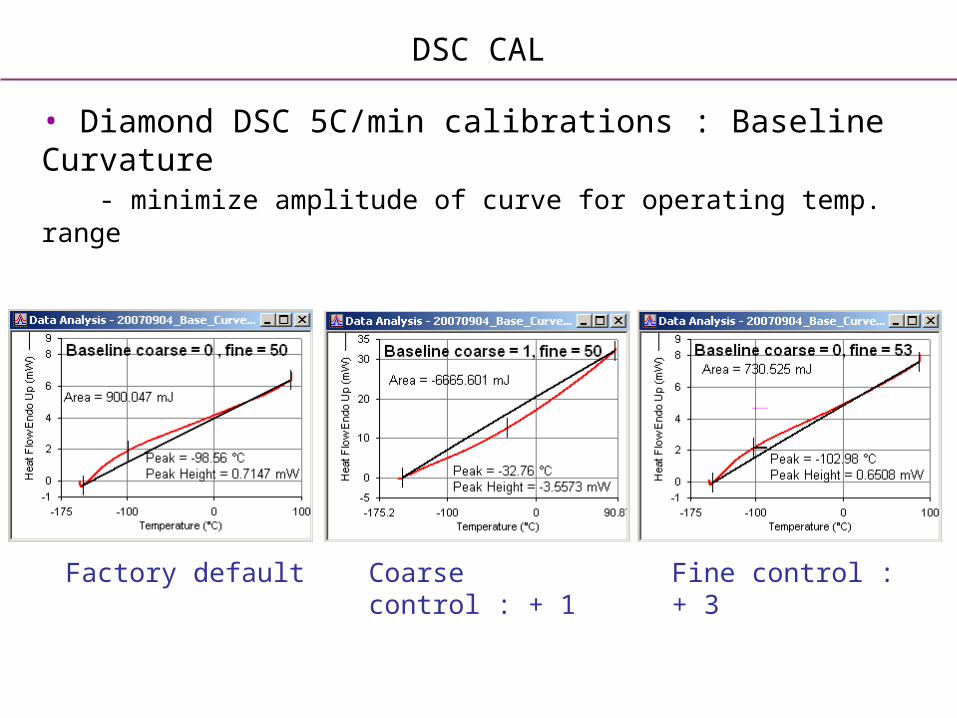
DSC CAL
• Diamond DSC 5C/min calibrations : Baseline Curvature - minimize amplitude of curve for operating temp. range
Factory default Coarse control : + 1 Fine control : + 3
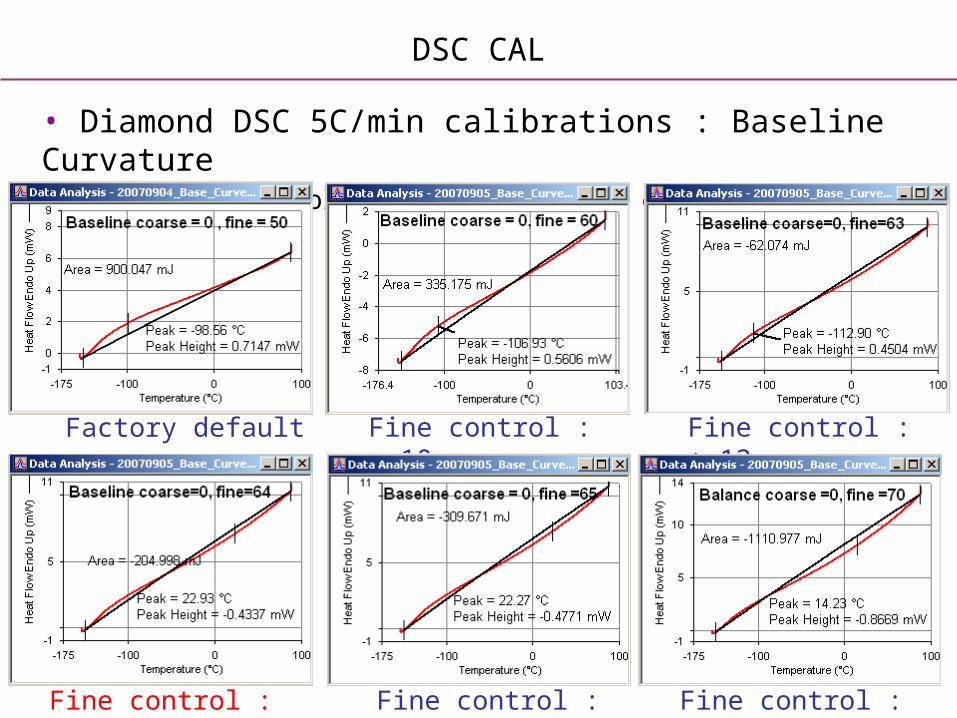
DSC CAL
• Diamond DSC 5C/min calibrations : Baseline Curvature - minimize amplitude of curve for operating temp. range
Factory default Fine control : + 10 Fine control : + 13
Fine control : + 14 Fine control : + 15 Fine control : + 20

DSC CAL
• Diamond DSC 5C/min calibrations : Baseline Slope - minimize slope of curve for operating temp. range
Factory default Slope : - 5 Slope : - 4
FSlope : - 3 Slope : + 5

DSC CAL
• Diamond DSC 5C/min calibrations : Sample Temp. Cal. - Correctly predict transition temperatures of standards
n-Decane : Expected = -29.66 , Measured = -31.73
Scyclohexane : Expected = -87.06 & 6.54 , Measured = -87.1 & 5.2
DSC CAL
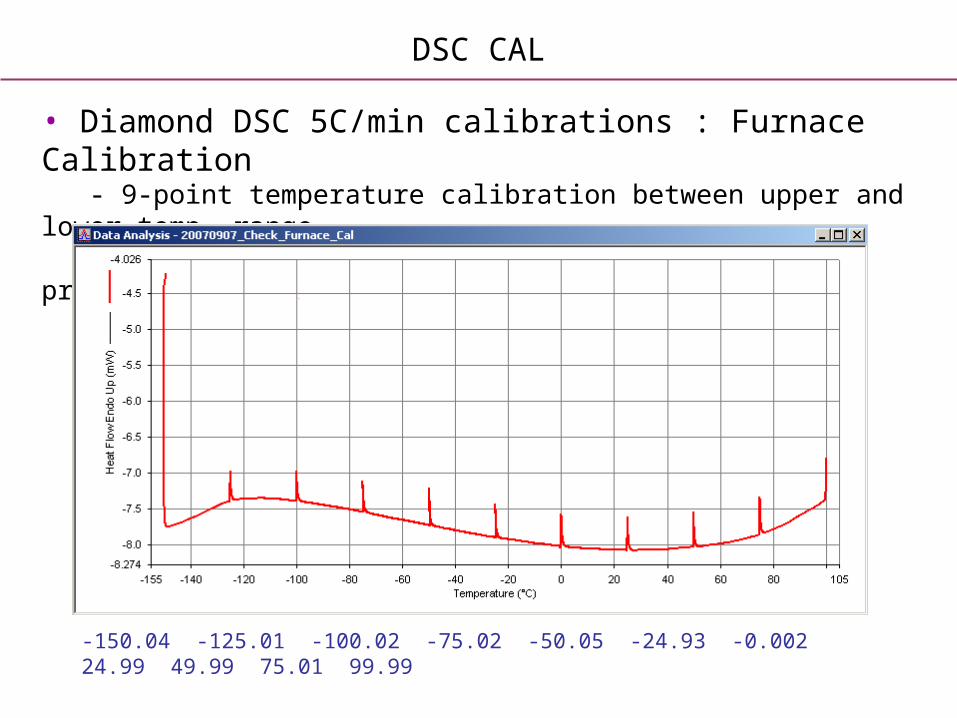
• Diamond DSC 5C/min calibrations : Furnace Calibration - 9-point temperature calibration between upper and lower temp. range - matches platinum resistance thermometer and programmed temp.
-150.04 -125.01 -100.02 -75.02 -50.05 -24.93 -0.002 24.99 49.99 75.01 99.99
DSC CAL
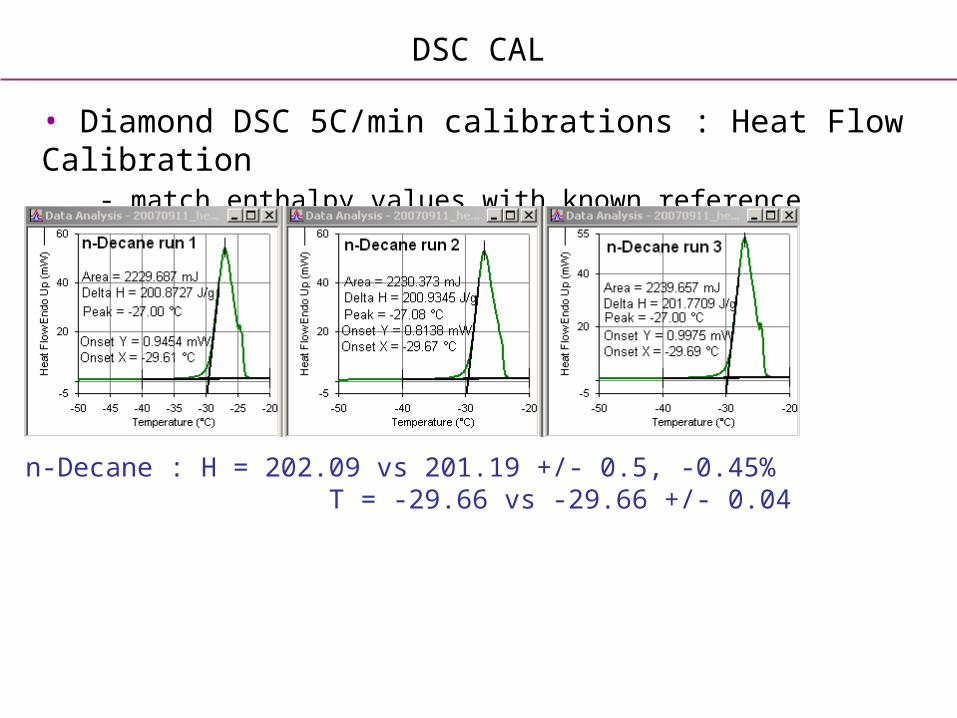
• Diamond DSC 5C/min calibrations : Heat Flow Calibration - match enthalpy values with known reference materials
n-Decane : H = 202.09 vs 201.19 +/- 0.5, -0.45% T = -29.66 vs -29.66 +/- 0.04

DSC CAL
• Diamond DSC 5C/min calibrations : Heat Flow Calibration - match enthalpy values with known reference materials
H2O : H = 333.8 vs 338.6 +/- 0.15, +1.07% T = 0 vs -0.43 +/- 0.01

END OF SLIDES