ME Lab Report 1
18
Title Compression Properties of Ceramics, Polymers, & Composites Objective To conduct a compression test on three types of samples and obtain material properties for the tested samples. Abstract This experiment focus on determining the compressive strength of each material tested that is ceramics, polymers and composites. Stress and strain values are noted as load or force is applied on the material. The material is seen whether it fractures or retains its original shape. In theory, the compression test is simply the opposite of the tension test with respect to the direction of loading. In compression testing the sample is squeezed while the load and the displacement are recorded. Compression tests result in mechanical properties that include the compressive yield stress, compressive ultimate stress, and compressive modulus of elasticity. Ultimate compressive strength is the stress required to rupture a specimen. This value is much harder to determine for a compression test than it is for a tensile test since many material do not exhibit rapid fracture in compression. Introduction Compressive strength is the capacity of a material to withstand axially directed pushing forces. When the limit of compressive strength is reached, materials are crushed. When a simple compressive load is applied to a specimen, the following types of deformation may take place: elastic or plastic shortening in ductile materials, crushing and fracture in brittle materials, a sudden bending deformation called buckling in long, slender bars, or combinations of these. Ductile materials, such as mild steel, have no meaningful
-
Upload
praven-indran -
Category
Documents
-
view
76 -
download
0
description
stress strain for materials experiment
Transcript of ME Lab Report 1
Title Compression Properties of Ceramics, Polymers, & Composites
ObjectiveTo conduct a compression test on three types of samples and obtain material properties for the tested samples.
Abstract
This experiment focus on determining the compressive strength of each material tested that is ceramics, polymers and composites. Stress and strain values are noted as load or force is applied on the material. The material is seen whether it fractures or retains its original shape. In theory, the compression test is simply the opposite of the tension test with respect to the direction of loading. In compression testing the sample is squeezed while the load and the displacement are recorded. Compression tests result in mechanical properties that include the compressive yield stress, compressive ultimate stress, and compressive modulus of elasticity. Ultimate compressive strength is the stress required to rupture a specimen. This value is much harder to determine for a compression test than it is for a tensile test since many material do not exhibit rapid fracture in compression.
Introduction
Compressive strength is the capacity of a material to withstand axially directed pushing forces. When the limit of compressive strength is reached, materials are crushed. When a simple compressive load is applied to a specimen, the following types of deformation may take place: elastic or plastic shortening in ductile materials, crushing and fracture in brittle materials, a sudden bending deformation called buckling in long, slender bars, or combinations of these. Ductile materials, such as mild steel, have no meaningful compressive strength. Lateral expansion and thus an increasing cross-sectional area accompany axial shortening. The specimen will not break: excessive deformation rather than loss of strength often characterize failure. Brittle material, such as the wood specimens commonly fracture along a diagonal plane which is not the plane of maximum compressive stress, but rather one of high shear stress which accompanies the uniaxial compression. Strain is a measure of the intensity of deformation (deformation per unit length).
Theory
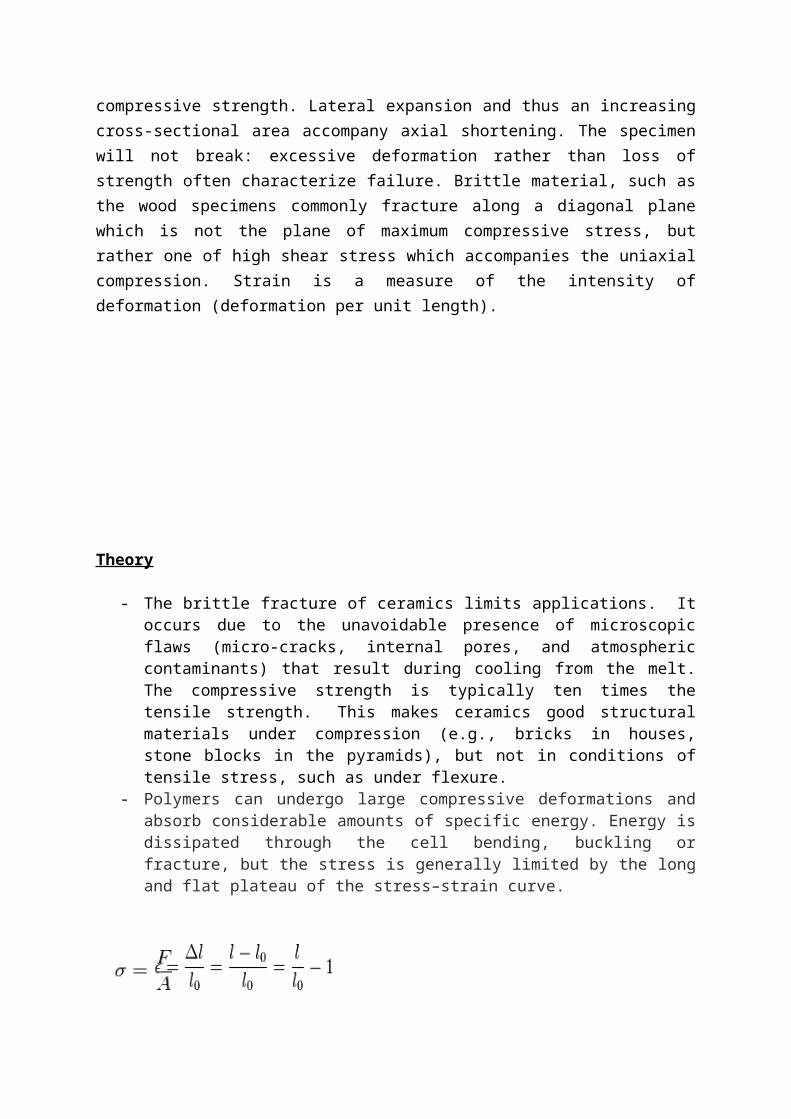
- The brittle fracture of ceramics limits applications. It occurs due to the unavoidable presence of microscopic flaws (micro-cracks, internal pores, and atmospheric contaminants) that result during cooling from the melt. The compressive strength is typically ten times the tensile strength. This makes ceramics good structural materials under compression (e.g., bricks in houses, stone blocks in the pyramids), but not in conditions of tensile stress, such as under flexure.
- Polymers can undergo large compressive deformations and absorb considerable amounts of specific energy. Energy is dissipated through the cell bending, buckling or fracture, but the stress is generally limited by the long and flat plateau of the stress–strain curve.
,
Figure 1 Figure 2

Stress ( ) is shown as a function of strain ( ). The stress–strain behaviour for brittle (curve A), plastic (curve B), and highlyelastic (elastomeric) (curve C) polymers.
Apparatus
- Universal compression machine- Computer to obtain data- Vernier callipers- Ceramics, Polymers and Composites
Computer to record data and universal pressure machine
Polymers, Composites and Ceramics
Procedures
Three samples of ceramics, three samples of polymer, and three composite were used. The compression testing device is the same as the hardness testing zone of the test unit. The compressive sample was clamped between the lower cross-member and the cross-head. Before applying any force on the sample, the initial height and cross-sectional area of the sample was measured and recorded. The loading should be up to 20–50% of the damaged load of the cylindrical sample.

Results and Data AnalysisCeramics 1
t Time Index l Distance F Force EPS Strain SIGMA TEST Testh:min:s mm KN % N/mm^215:10:22.7 0.000 0.000 0.000 0.000 2.00015:10:23.7 0.000 0.006 0.000 0.007 2.00015:10:24.7 0.086 1.651 0.448 1.978 2.00015:10:25.7 0.159 7.373 0.832 8.833 2.00015:10:26.7 0.196 11.395 1.025 13.652 2.00015:10:27.7 0.220 14.067 1.153 16.853 2.00015:10:28.7 0.245 14.938 1.281 17.896 2.00015:10:29.7 0.294 14.944 1.537 17.903 2.00015:10:31.7 0.294 14.938 1.537 17.896 2.00015:10:30.7 0.306 14.950 1.601 17.910 2.000

Ceramic 2
t Time Index l Distance F Force EPS Strain SIGMA TEST Testh:min:s mm KN % N/mm^215:07:18.7 0.012 0.018 0.066 0.021 2.00015:07:19.7 0.012 0.240 0.066 0.279 2.00015:07:20.7 0.061 2.323 0.331 2.700 2.00015:07:21.7 0.110 6.058 0.595 7.040 2.00015:07:22.7 0.159 10.717 0.859 12.454 2.00015:07:23.7 0.159 11.593 0.859 13.473 2.00015:07:24.7 0.171 13.208 0.926 15.350 2.00015:07:25.7 0.196 14.781 1.058 17.178 2.00015:07:26.7 0.220 14.775 1.190 17.171 2.00015:07:27.7 0.220 14.781 1.190 17.178 2.00015:07:28.7 0.220 14.781 1.190 17.178 2.000

Ceramic 3
t Time Index l Distance F Force EPS Strain SIGMA TEST Testh:min:s mm KN % N/mm^215:12:21.7 0.061 0.006 0.320 0.007 2.00015:12:23.7 0.073 0.720 0.384 0.832 2.00015:12:24.7 0.306 5.061 1.601 5.846 2.00015:12:25.7 0.416 10.513 2.177 12.144 2.00015:12:26.7 0.477 13.178 2.497 15.223 2.00015:12:27.7 0.501 13.713 2.625 15.840 2.00015:12:28.7 0.538 14.818 2.818 17.116 2.00015:12:29.7 0.624 14.944 3.266 17.262 2.00015:12:31.7 0.636 14.956 3.330 17.276 2.00015:12:30.7 0.660 14.950 3.458 17.269 2.000

Polymer 1
t Time Index l Distance F Force EPS Strain SIGMA TEST Testh:min:s mm KN % N/mm^214:55:24.7 0.000 0.030 0.000 0.033 2.00014:55:26.7 0.000 0.018 0.000 0.020 2.00014:55:33.7 0.000 0.030 0.000 0.033 2.00014:55:35.7 0.000 0.012 0.000 0.013 2.00014:55:36.7 0.000 0.024 0.000 0.026 2.00014:55:38.7 0.000 0.018 0.000 0.020 2.00014:55:40.7 0.000 0.024 0.000 0.026 2.00014:55:23.7 0.012 0.012 0.068 0.013 2.00014:55:22.7 0.012 0.018 0.068 0.020 2.00014:55:25.7 0.012 0.054 0.068 0.060 2.00014:55:27.7 0.012 0.024 0.068 0.026 2.00014:55:32.7 0.012 0.018 0.068 0.020 2.00014:55:34.7 0.012 0.012 0.068 0.013 2.00014:55:37.7 0.012 0.018 0.068 0.020 2.00014:55:39.7 0.012 0.024 0.068 0.026 2.000

14:55:41.7 0.012 0.072 0.068 0.079 2.00014:55:42.7 0.049 0.793 0.272 0.873 2.00014:55:43.7 0.098 2.624 0.544 2.890 2.00014:55:44.7 0.171 5.331 0.951 5.872 2.00014:55:45.7 0.208 8.405 1.155 9.258 2.00014:55:47.7 0.294 12.578 1.631 13.854 2.00014:55:46.7 0.306 11.996 1.699 13.212 2.00014:55:48.7 0.318 14.403 1.767 15.864 2.00014:55:49.7 0.342 14.775 1.903 16.274 2.00014:55:55.7 0.342 14.769 1.903 16.267 2.00014:55:50.7 0.355 14.769 1.971 16.267 2.00014:55:54.7 0.355 14.769 1.971 16.267 2.00014:55:56.7 0.355 14.781 1.971 16.281 2.000
Polymer 2
t Time Index l Distance F Force EPS Strain SIGMA TEST Testh:min:s mm KN % N/mm^215:00:53.7 0.012 0.000 0.068 0.000 2.00015:00:54.7 0.012 0.000 0.068 0.000 2.00015:00:52.7 0.024 0.000 0.137 0.000 2.00015:00:51.7 0.037 0.000 0.205 0.000 2.00015:00:48.7 0.086 0.036 0.478 0.041 2.00015:00:49.7 0.086 0.162 0.478 0.183 2.00015:00:49.7 0.086 0.162 0.478 0.183 2.00015:00:55.7 0.110 1.951 0.615 2.201 2.00015:00:56.7 0.208 6.016 1.162 6.785 2.00015:00:57.7 0.257 8.429 1.435 9.507 2.00015:00:58.7 0.306 11.449 1.708 12.913 2.00015:00:59.7 0.367 14.932 2.050 16.840 2.00015:01:00.7 0.379 14.920 2.118 16.826 2.000
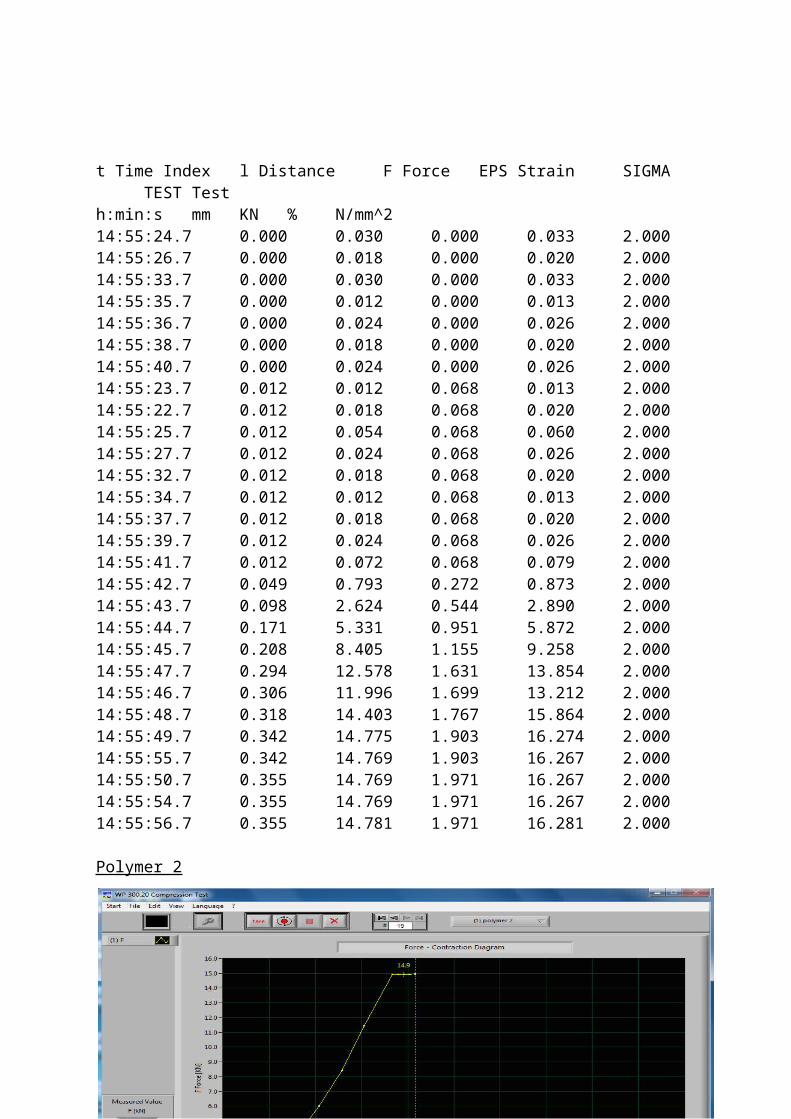
15:01:01.7 0.391 14.932 2.187 16.840 2.00015:01:03.7 0.391 14.932 2.187 16.840 2.00015:01:04.7 0.391 14.938 2.187 16.847 2.00015:01:05.7 0.404 14.932 2.255 16.840 2.00015:01:02.7 0.416 14.962 2.323 16.874 2.00015:01:06.7 0.416 14.932 2.323 16.840 2.000
Polymer 3
t Time Index l Distance F Force EPS Strain SIGMA TEST Testh:min:s mm KN % N/mm^215:03:39.7 0.061 0.000 0.346 0.000 2.00015:03:38.7 0.073 0.006 0.415 0.007 2.00015:03:40.7 0.086 0.000 0.484 0.000 2.00015:03:41.7 0.159 1.021 0.898 1.138 2.00015:03:42.7 0.232 3.308 1.313 3.687 2.00015:03:43.7 0.294 5.902 1.658 6.577 2.00015:03:44.7 0.391 10.351 2.211 11.536 2.00015:03:45.7 0.416 11.912 2.349 13.275 2.00015:03:46.7 0.465 13.887 2.626 15.477 2.00015:03:47.7 0.501 14.938 2.833 16.648 2.000

15:03:48.7 0.514 14.938 2.902 16.648 2.00015:03:49.7 0.514 14.938 2.902 16.648 2.00015:03:50.7 0.526 14.944 2.971 16.655 2.000
Composite 1
t Time Index l Distance F Force EPS Strain SIGMA TEST Testh:min:s mm KN % N/mm^215:14:39.7 0.024 0.024 0.127 0.022 2.00015:14:40.7 0.049 0.907 0.253 0.812 2.00015:14:41.7 0.220 7.247 1.141 6.492 2.00015:14:42.7 0.269 11.239 1.394 10.068 2.00015:14:43.7 0.306 12.104 1.584 10.843 2.00015:14:44.7 0.342 14.938 1.774 13.382 2.00015:14:45.7 0.355 14.938 1.838 13.382 2.00015:14:46.7 0.379 14.926 1.965 13.371 2.00015:14:47.7 0.391 14.938 2.028 13.382 2.00015:14:48.7 0.391 14.938 2.028 13.382 2.000

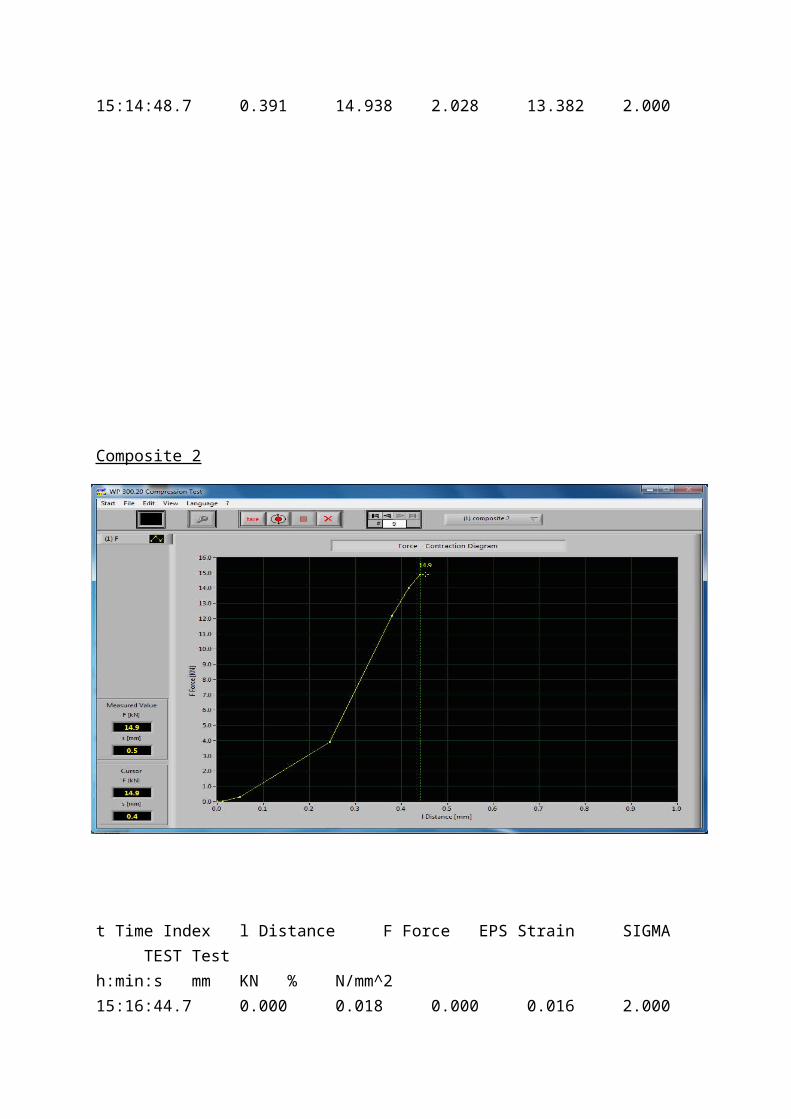
Composite 2
t Time Index l Distance F Force EPS Strain SIGMA TEST Testh:min:s mm KN % N/mm^215:16:44.7 0.000 0.018 0.000 0.016 2.00015:16:45.7 0.012 0.018 0.064 0.016 2.00015:16:46.7 0.049 0.300 0.255 0.266 2.00015:16:47.7 0.245 3.909 1.274 3.465 2.00015:16:48.7 0.379 12.176 1.975 10.793 2.00015:16:49.7 0.416 14.019 2.166 12.426 2.00015:16:50.7 0.440 14.908 2.293 13.214 2.00015:16:51.7 0.440 14.908 2.293 13.214 2.00015:16:52.7 0.440 14.914 2.293 13.219 2.000

Composite 3
t Time Index l Distance F Force EPS Strain SIGMA TEST Testh:min:s mm KN % N/mm^215:21:12.7 0.012 0.012 0.063 0.011 2.00015:21:13.7 0.024 0.630 0.127 0.571 2.00015:21:14.7 0.135 3.716 0.697 3.365 2.00015:21:15.7 0.183 6.412 0.951 5.806 2.00015:21:10.7 0.245 0.240 1.267 0.217 2.00015:21:16.7 0.245 11.443 1.267 10.361 2.00015:21:17.7 0.306 14.830 1.584 13.427 2.00015:21:23.7 0.318 14.932 1.648 13.519 2.00015:21:18.7 0.330 14.944 1.711 13.530 2.000
15:21:19.7 0.330 14.938 1.711 13.525 2.00015:21:22.7 0.330 14.938 1.711 13.525 2.00015:21:27.7 0.330 14.938 1.711 13.525 2.00015:21:20.7 0.342 14.932 1.774 13.519 2.00015:21:21.7 0.342 14.944 1.774 13.530 2.00015:21:24.7 0.342 14.932 1.774 13.519 2.00015:21:25.7 0.342 14.926 1.774 13.514 2.00015:21:26.7 0.342 14.968 1.774 13.552 2.00015:21:28.7 0.342 14.944 1.774 13.530 2.00015:21:29.7 0.342 14.926 1.774 13.514 2.000
Tabulation of Data
1. Ceramic is much more brittle compared to polymers and composites. Referring to the three graphs the distance varies may be due to initial height of material. However the maximum force that could be applied range from 14.8KN- 15.0KN that is very near for the three ceramics tested
2. Polymers are less brittle compared to ceramics with a little of rubbery character and has more resistance to force. This could be observed from the distance in graph, where the distance indicates that polymer is compress but no cracks observed.
3. Composite are normally reinforced materials and are hard to fracture making it tougher than polymers and ceramics. The machine limits the testing where actually composite can actually take more force. From graphs it is observed almost the same pattern.
4. Calculations
e = (h - ho) / ho
Discussion
1. When premature crushing occurs at the end of the specimen experimental values will be destructed because the specimen has already reached its maximum impact strength or there were impurities present in specimen. Strain values will be difficult to calculate, hence making drawing of graphs are merely impossible.
2. Polymers are dull sheen (usually), slightly flexible, light weight, can be any colour, warm to the touch. Polymers tensile behaviour varies with its structure, temperature and strain rate. The compression rate of polymer is low due to its slight rubbery characteristic. Ceramics are not shiny unless glazed, hard, often brittle, heavy, can be any colour (often white, pale brown to dark brown), cold to the touch. Besides that ceramics has high tensile strength as well as strong under compression. However it is

brittle due to flaws present such as surface cracks, porosity, inclusions and large grains that are produced during processing. Composites are very strong, usually tough and durable. Dull sheen, can be any colour, usually warm to touch.
3. Impact testing involves applying a sudden stress to a specimen for determining the energy absorbed in fracturing a test piece at high velocity. For plastics it usually involves carrying out an Izod test which involves allowing a pendulum to fall and impact a notched specimen. It gives an indication of the performance of the plastic
under suddenly applied loads. For a given material the impact energy will be seen to
decrease if the yield strength is increased. Fatigue testing involves applying cyclic loading to specimens in order to determine their properties over prolonged periods of
time. A creep test involves a tensile specimen under a constant load maintained at a
constant temperature. At relatively high temperatures creep appears to occur at all
stress levels, but the creep rate increases with increasing stress at a given temperature.
4. During the experiment it is important to start experiment with a material that is in good condition. Ensure that all measuring instrument are calibrated to avoid zero errors. Always reset the computer data collector to avoid overlapping of data resulting to wrong data that practically screws up the graph.
Conclusion
This experiment proves that composite is the hardest material compared to polymer and ceramic. Meanwhile ceramic is a brittle material that cracked during experiment; all three materials tested have their own characteristics. Materials can change their characteristics when there are impurities present or due to environmental factors.