MDGs Provincial Status Report 2010 Philippines Romblon
103
1 Philippines Fourth Progress Report on the Millennium Development Goals using CBMS Data - Province of Province of Marinduque Province of ROMBLON
-
Upload
united-nations-in-the-philippines -
Category
Documents
-
view
5.556 -
download
3
Transcript of MDGs Provincial Status Report 2010 Philippines Romblon

1Philippines Fourth Progress Report on the Millennium Development Goals using CBMS Data - Province of Province of Marinduque
Province of ROMBLON

Status Report on the Millennium Development Goals
(MDGs)Using CBMS Data
Province of Romblon

2Status Report on the Millennium Development Goals Using CBMS DataProvince of Romblon
I personally take recognition of the work and dedication spent by our Community-Based Monitoring System (CBMS) Provincial Team in making this document, the Status Report on the Millennium Development Goals Using CBMS Data (Province of Romblon).
This report gives every reader the 2007 general situation of the province of Romblon and its municipalities vis-à-vis their achievement of the Millennium Development Goals. It presents not only the threats and weaknesses we have as a community, but also the equivalents strengths and the opportunities we can pursue.
Specifi cally, this report pictures to us how have we specially faired in the following eight (8) develop-ment goals set by the United Nations:
1. Eradication of extreme poverty and hunger2. Achievement of universal primary education3. Promotion of gender equality and women empowerment4. Reduction of child mortality5. Improvement in maternal health6. Combat of HIV/AIDS, malaria and other diseases7. Ensuring environmental sustainability, and8. Developing a global partnership for development
Towards the end of this report, the reader is led to the proposed programs, projects and activities, and their equivalent project costs. It also strongly suggests for the continuous updating of our CBMS.
This document therefore can be a great resource for all development institutions, workers, and specially our local and national leaders whose love for the development of Romblon and its people is real, sincere and overfl owing. This can help them decide what programs, projects and activities will they commit to fund and undertake; how much fund and when will they give.
Then we can be able to project what of these plans are achievable fi rst, until 2015, and then beyond.
Again, sincere thanks to our Provincial Team, Dr. Celia Reyes and the PEP-CBMS Network, UNDP, NEDA-SDS, the municipal governments in the province, the provincial offi ces and agencies, and to all those who supported the preparation of this document.
ALICE CAPA-FETALVERO Vice Governor
ForewordRepublic of the PhilippinesPROVINCE OF ROMBLON
OFFICE OF THE VICE-GOVERNOR

3Status Report on the Millennium Development Goals Using CBMS Data Province of Romblon
Preface
The province of Romblon is blest with abundant natural resources yet has difficulty harnessing development due to limiting factors such as being archipelagic in nature. Foremost in the agenda of the Local Development Councils is the eradication of poverty and upliftment of the socioeconomic conditions of all Romblomanons. To achieve this goal, we need massive financial resources and technical inputs to overcome our geophysi-cal constraints. In our pursuit of the achievement of the Millennium Development Goals (MDGs), aligning our meager resources in support of the universal development thrust will enable the province to respond meaningfully to the challenge. We particularly need to strengthen local governance and pass local legislations to effectively implement national policies.
This report aims to present the status of the province and its component municipalities in terms of the MDG targets based on data generated from the first implementation of the Community-Based Monitoring System (CBMS). The data revealed that we have a very good performance in combating malnutrition and promoting gender equality. We need to maintain or even surpass what we have achieved so far while devising innovative strategies to improve on the other indicators which are lagging behind. There is a need for a concerted effort to engender a paradigm shift regarding the environment including climate change if we want an immediate response to reverse environmental loss.
Poverty continued to be our vulnerability as majority of the population is below poverty threshold. This is our greatest challenge. With the MDG report, we believe that the Local Chief Executives and the Local Development Councils would realize the necessity to act now by prioritizing plans/programs/activities that would enable us to make a decent improvement in the lives of the people and make headways in achieving the MDG targets.
OSCAR VICENTE L. YLAGAN, JR.
Provincial Government Department HeadProvincial Planning and Development Office
Provincial Development Council Secretary

4Status Report on the Millennium Development Goals Using CBMS DataProvince of Romblon
EVELYN M. MAGAYAM GEMMA M. ETIS Planning Officer IV Project Evaluation Officer IV CBMS Focal Person CBMS TWG Member [email protected] [email protected]
MELODINA M. VILLALUZ LIANY G. ROMERO Project Evaluation Officer III Planning Officer II CBMS TWG Member CBMS TWG Member [email protected] [email protected]
Acknowledgments
It has been a great honor and opportunity that Romblon was among the nine provinces in the country chosen to participate in this laudable endeavor and come up with this document that shows our status on the Millennium Development Goals. The preparation of this report is made possible by the PEP-CBMS Network through the support of the United Nations Devel-opment Programme (UNDP) and the National Economic and Development Authority-Social Development Staff (NEDA-SDS).
We would like to express our deepest gratitude to Dr. Celia Reyes and her Team in concep-tualizing this project. We are also thankful for them in relentlessly providing us with technical assistance and coaching sessions in generating the MDG indicators. For their patience and understanding, and for being with us all the way, until we fi nish the report, we are heartily grateful.
A million thanks also goes to the UNDP for supporting this undertaking and for the unique experience we encountered in preparing the report.
Finally, we would also like to acknowledge the contributions of the Municipal Planning and Development Coordinators (MPDCs), the Municipal Health Offi cers (MHOs) and other pro-vincial offi ces and agencies, in sharing with us their insights regarding data analysis at their areas of concern as well as their best practices.
The CBMS Provincial Team
OSCAR VICENTE L. YLAGAN, JR. Provincial Government Dept. Head – PPDOCBMS Provincial Lead Person [email protected]

5Status Report on the Millennium Development Goals Using CBMS Data Province of Romblon
Message
The preparation of provincial MDGs reports is a critical step that Local Govern-ment Units (LGUs) have taken in the overall effort to localize the MDGs. As it is often said, the MDGs will be ‘won or lost’ at the local level given the conditions of uneven progress and disparities across regions and provinces in the country.
Beyond the national averages, one can see wide disparities on the gains in poverty reduction, universal education, child mortality and maternal health. This situation reinforces the notion that the progress of each province is just as important as the achievements of the country as a whole. After all, the Philippines’ progress towards the MDGs, is the sum of the efforts and gains of all LGUs.
By preparing provincial reports, LGUs are provided vital information on the status of the MDGs in their areas of infl uence. These reports are important
sources of information for planning, resource allocation and priority setting that LGUs are tasked under their mandate of effective local governance. Likewise, in the course of the preparation of the reports, the capacity of LGUs to collect, monitor and use data for decision making has been greatly enhanced. The reports also show how far the Community Based Monitoring System (CBMS) that UNDP has supported can go in terms of its use.
Against the backdrop of renewed optimism emanating from the new political leadership, this fi rst set of nine Provincial Reports on the MDGs is a timely and important milestone. The reports provide crucial insights on how to overcome the constraints in achieving the MDGs locally as the country gears towards the last stretch to attain the eight goals by 2015. They also emphasize the important role of active collaboration of political leaders, stakeholders, and donors in achieving the MDGs.
I wish to commend the nine Provincial Governments that prepared their reports – the Agusan del Norte, Agusan del Sur, Biliran, Camarines Norte, Eastern Samar, Marinduque, Romblon, Sa-rangani, and Siquijor Province – the Community-Based Monitoring System (CBMS) Network and the National Economic and Development Authority (NEDA) for working together in bringing about this important accomplishment.
With this initiative, it is hoped that other provinces will follow suit to attain nationwide support for the need to accelerate the pace of the achievement of the MDGs by 2015.
Dr. Jacqueline BadcockUN Resident Coordinator and
UNDP Resident Representative
s by 2015.
Dr Jacqueline Badcock

6Status Report on the Millennium Development Goals Using CBMS DataProvince of Romblon
The Declaration of the Millennium Development Goals (MDGs) by member states of the United Nations including the Philippine Government (PG) has posed a great challenge to the country and to the Local Government Units (LGUs) as well. At the onset, the absence of baseline data at the grass-root level and the lack of local monitoring tool to determine the status of the LGUs in terms of the MDG targets has been a hindrance in setting local targets.
The Regional Development Council (RDC) Region IV-B (MIMAROPA) initiative to implement a common database system in the region and the subsequent implementation of the Community-Based Monitoring System (CBMS) in the Province of Romblon has proven to be a very provident endeavor. With CBMS, the availability of data at each geo-political level—barangay, municipality and province—has been a great help in our assessment of the demographic and socioeconomic condition of the province and its 17 component municipalities as well as the indicators monitored under the MDG.
Since this is the first round of CBMS implementation in the province, we still cannot track our progress in attaining the MDGs. What we can offer instead is a glimpse of where we stand at present, and strive to contribute to the achievement of the national target. Our current status can also be our benchmark in monitoring the impacts of projects being implemented and gauge the effects of the general services provided aimed at improving the general welfare of our people.
The province and its 17 component municipalities have agreed to update the CBMS database this 2010 and we are very optimistic that the data generated will provide us insights as to our response to MDG challenge as well as the impact of our services to the lives of our constituents. This will help us a lot in focusing our interventions to where and whom it is most needed.
Hopefully, the preparation of the provincial MDG report can provide us with meaningful analysis not only on the MDG indicators but also on our general situation and shall be the basis in formulating development plans and strategies that would be responsive to achieve our objectives as well as the MDGs. The MDG Report will steer us to our quest for a better future and will further aid us in our quest for a unified, self-reliant and ecologically-balanced province.
NATALIO F. BELTRAN III Governor
Republic of the PhilippinesPROVINCE OF ROMBLON
OFFICE OF THE GOVERNOR
s to our quest for a better futecologically-balancedddd p rovivvvvvvvvvvvvvv n
NATALIO F. BELTRANGover
Message

7Status Report on the Millennium Development Goals Using CBMS Data Province of Romblon
Table of Contents
Foreword Vice-Governor Alice Capa-Fetalvero ....................................Preface Provincial Government Department Head Oscar Vicente L. Ylagan, Jr. ..................................................Acknowledgments ......................................................................................
Messages UN Resident Coordinator Dr. Jacqueline Badcock ................. Governor Natalio F. Beltran III ..................................................
Table of Contents ....................................................................................... List of Acronyms ........................................................................................ List of Tables .............................................................................................. List of Figures ............................................................................................
Executive Summary .............................................................................
Part I. Provincial Profile
1. Brief Historical Background ............................................................... 2. Geo-Physical Environment .................................................................3. Population & Social Environment ....................................................... 4. Local Economy ................................................................................... 5. Infrastructure/Utilities/Facilities .......................................................... 6. Local Institutional Capability .............................................................
Part II. Status Report on the Millennium Development Goals (MDGs)
1. Goal 1 - Eradicate Extreme Poverty and Hunger .......................................
2. Goal 2 - Achieve Universal Primary Education ..........................................
3. Goal 3 - Promote Gender Equality ............................................................ 4. Goal 4 - Reduce Child Mortality .............................................................
5. Goal 5 - Improve Maternal Health .........................................................
2
34
56
791113
14
222324262728
30
41
48
55
61

8Status Report on the Millennium Development Goals Using CBMS DataProvince of Romblon
Table of Contents
6. Goal 6 - Combat HIV / AIDS, Malaria and Other Diseases ....................................
7. Goal 7 - Ensure Environmental Sustainability .....................................................
8. Goal 8 - Develop Global Partnership for Development ........................................
Part III. Meeting the 2015 Challenge
1. Priority Programs and Policy Responses ........................................................ 2. Financing the MDGs ..................................................................................... 3. Monitoring the MDGs ...................................................................................
Explanatory Text ..............................................................................................
66
71
79
85889091

9Status Report on the Millennium Development Goals Using CBMS Data Province of Romblon
ADP Annual Development PlanAHYD Adolescent Health & Youth DevelopmentAICS Aid in Crisis SituationALS Alternative Learning ServiceBBB Buntis Baby BankBEMONC Basic Emergency Obstetric and Newborn CareBHS Barangay Health StationBHW Barangay Health WorkersBLR Botika ng Lalawigan ng RomblonBNB Botika ng BarangayBNS Barangay Nutrition ScholarCBFM Community-Based Forest ManagementCBMIS Community-Based Management Information SystemCBMS Community-Based Monitoring SystemCDA Cooperative Development AgencyCEMONC Comprehensive Emergency Obstetric and Newborn CareDepEd Department of EducationDMFDH Don Modesto Formilleza District Hospital DOLE Department of Labor and EmploymentDSWD Department of Social Worker and DevelopmentEC European CommissionECCD Early Childhood Care & DevelopmentF1 FOURmula OneFIC Fully Immunized ChildrenGAD Gender and DevelopmentIAD/U Internal Audit Department/UnitICMRM Integrated Coastal and Marine Resources Management IRA Internal Revenue AllotmentIRS International Reference StandardISF Integrated Social ForestryIT Information TechnologyLCE Local Chief ExecutiveLDC Local Development CouncilLGU Local Government UnitMDG Millennium Development GoalsMDH Malipayon District Hospital MHO Municipal Health OfficeMIMAROPA Mindoro, Marinduque, Romblon and PalawanMOA Memorandum of AgreementMPDC Municipal Planning and Development Coordinator
List of Acronyms

10Status Report on the Millennium Development Goals Using CBMS DataProvince of Romblon
List of AcronymsNEDA National Economic and Development AuthorityNGO Non Government OrganizationNPC National Power CorporationNSCB National Statistical Coordination BoardOPT Operation TimbangOTELCO Odiongan Telephone CorporationPCS Provincial Communication SystemPEP Progressive Economic PolicyPG Philippine GovernmentPHIC/Phil-Health Philippine Health Insurance CorporationPHO Provincial Health OfficePIPH Provincewide Investment Plan for HealthPNAO Provincial Nutrition Action OfficerPNC Provincial Nutrition CommitteePPAN Philippine Plan of Action for NutritionPPDO Provincial Planning and Development Office4Ps Pantawid Pamilyang Pilipino ProgramPTWG Provincial Technical Working GroupRDC Regional Development CouncilRDH Romblon District Hospital RHU Rural Health UnitRIC Rural Improvement ClubROMELCO Romblon Electric CooperativeRPH Romblon Provincial Hospital RSU Romblon State University RW3SP Rural Water Supply Sanitation Sector ProgramSEDIP Secondary Education Development & Improvement ProgramSEF Special Education FundSPED Special EducationSWMP Solid Waste Management PlanSUC State University/CollegeSWMP Solid Waste Management PlanTB DOTS Tuberculosis Directly Observed Treatment SchemeTEEP Third Elementary Education ProgramTELOF Telecommunication OfficeTIDH Tablas Island District Hospital TIELCO Tablas Island Electric CooperativeUN United NationsUNDP United Nation Development ProgrammeVAWC Violence Against Women and their Children

11Status Report on the Millennium Development Goals Using CBMS Data Province of Romblon
List of Tables
Table 1. Summary of Findings of MDG Indicators, Province of Romblon, 2007
Table 2. Demographic Features, by Municipality, 2007
Table 3. Number of Schools and Enrollment, SY 2007 – 2008
Table 4. Participation and Completion Rate, SY 2007 – 2008
Table 5. Magnitude and Proportion of Households and Population Living Below Poverty Threshold, by Sex, by Urbanity, by Municipality, 2007
Table 6. Magnitude and Proportion of Households and Population Living Below Food Threshold, by Sex, by Urbanity, by Municipality, 2007
Table 7. Poverty Gap Ratio, by Urbanity, by municipality, 2007
Table 8. Employment Rate, by Sex, by Urbanity, by Municipality, 2007
Table 9. Magnitude and Proportion of Households and Population who Experienced Food Shortage, by Sex, by Urbanity, by Municipality, 2007
Table 10. Magnitude and Proportion of Underweight Children Under 5 years of Age, by Sex, by Urbanity, by Municipality, 2007
Table 11. Magnitude and Proportion of Children Aged 6-12 Years Old Enrolled in Elementary School, by Sex, by Urbanity, by Municipality, 2007
Table 12. Magnitude and Proportion of Children Aged 13-16 Years Old Enrolled in High School, by Sex, by Urbanity, by Municipality, 2007
Table 13. Magnitude and Proportion of Children Aged 6-16 Years Old Enrolled in School, by Sex, by Urbanity, by Municipality, 2007
Table 14. Literacy Rate of 15-24 Year-Olds, by Sex, by Urbanity, by Municipality, 2007
Table 15. Ratio of Girls to Boys in Primary Education, by Urbanity, by Municipality, 2007
Table 16. Ratio of Girls to Boys in Secondary Education, by Urbanity, by Municipality, 2007
Table 17. Ratio of Girls to Boys in Tertiary Education, by Urbanity, by Municipality, 2007
Table 18. Ratio of Literate Females to Literate Males (15-24 years old), by Urbanity, by Municipality, 2007
Table 19. Proportion of Seats Held by Women in Municipality and Province, by Municipality, 2007
Table 20. Magnitude and Proportion of Children Aged 0 to Less than 5 Years Old who Died, by sex, by Urbanity, by Municipality, 2007
Table 21. Magnitude and Proportion of Infants who Died, by Sex, by Urbanity, by Municipality, 2007
Table 22. Magnitude and Proportion of Children Aged 1 to Less than 5 Years Old who Died, by Sex, by Urbanity, by Municipality, 2007
Table 23. Magnitude and Proportion of Women Deaths Due to Pregnancy-Related Causes, by Urbanity, by Municipality, 2007
Table 24. Magnitude and Proportion of Couples who Use Contraception, by Urbanity, by Municipality, 2007
Table 25. Magnitude and Proportion of Couples Using Condom Among Those who are Practicing Contraception, by Urbanity, by Municipality, 2007
Table 26. Magnitude and Proportion of Deaths Associated with Malaria, by Sex, by Municipality, 2007
Table 27. Magnitude and Proportion of Deaths Associated with Tuberculosis, by Sex, by Urbanity, by Municipality, 2007
Table 28. Magnitude and Proportion of Households and Population with Access to Safe Drinking Water, by Sex, by Urbanity, by Municipality, 2007
Table 29. Magnitude and Proportion of Households and Population with Access to Sanitary Toilet Facility, by Sex, by Urbanity, by Municipality, 2007
Table 30. Magnitude and Proportion of Households and Population who are Informal Settlers, by Sex, by Urbanity, by Municipality, 2007
Table 31. Magnitude and Proportion of Households and Population Living in Makeshift Housing, by Sex, by Urbanity, by Municipality, 2007
Table 32. Magnitude and Proportion of Households and Population Living in Inadequate Housing Conditions, by Sex, by Urbanity, by Municipality, 2007

12Status Report on the Millennium Development Goals Using CBMS DataProvince of Romblon
List of Tables
Table 33. Magnitude and Proportion of Households with Landlines/Telephone Lines, by Urbanity, by Municipality, 2007
Table 34. Magnitude and Proportion of Households with Cellphones, by Urbanity, by Municipality, 2007
Table 35. Magnitude and proportion of Households with Computers, by Urbanity, by Municipality, 2007
Table 36. Estimates of Funding Requirements
Table 37. The CBMS-MDG Indicators and their Definition
Table 38. Poverty and Food Thresholds

13Status Report on the Millennium Development Goals Using CBMS Data Province of Romblon
List of Figures
Figure 1. Location of Romblon Province
Figure 2. Proportion of Population Living Below Poverty Threshold
Figure 3. Proportion of Population Living Below Food Threshold
Figure 4. Poverty Gap Ratio
Figure 5. Employment Rate
Figure 6. Proportion of Population Who Experienced Food Shortage
Figure 7. Prevalence of Underweight Children Under 5 Years of Age
Figure 8. Proportion of Children Aged 6-12 Years Old Enrolled in Elementary School
Figure 9. Proportion of Children Aged 13-16 Years Old Enrolled in High School
Figure 10. Proportion of Children Aged 6-16 Years Old Enrolled in School
Figure 11. Literacy Rate of 15-24 Years Olds
Figure 12. Ratio of Girls to Boys in Primary Education
Figure 13. Ratio of Girls to Boys in Secondary Education
Figure 14. Ratio of Girls to Boys in Tertiary Education
Figure 15. Ratio of Literate Females to Literate Males Aged 15-24 Years Old
Figure 16. Proportion of Seats Held by Women in Municipality and Province
Figure 17. Proportion of Children 0 to Less than 5 Years Old who Died
Figure 18. Proportion of Infants who Died
Figure 19. Proportion of Children Aged 1 to Less than 5 Years Old who Died
Figure 20. Proportion of Women Deaths Due to Pregnancy-Related causes
Figure 21. Proportion of Couples who Use Contraception
Figure 22. Proportion of Couples Using Condom Among Those who are Practicing
Contraception
Figure 23. Death Rates Associated with Malaria
Figure 24. Death Rates Associated with Tuberculosis
Figure 25. Proportion of Population with Access to Safe Drinking Water
Figure 26. Proportion of Population with Access to Sanitary Toilet Facility
Figure 27. Proportion of Population who are Informal Settlers
Figure 28. Proportion of Population who are Living in Makeshift Housing
Figure 29. Proportion of Population Living in Inadequate Housing Condition
Figure 30. Proportion of Households with Landlines/ Telephone Lines
Figure 31. Proportion of Households with Cellphones
Figure 32. Proportion of Households with Computers
Figure 33. CBMS Coverage in the Philippines (as of May 12, 2010)

14Status Report on the Millennium Development Goals Using CBMS DataProvince of Romblon
EXECUTIVE SUMMARY
The endeavor to prepare a provincial MDG report was a result of a collaborative effort of the PEP-CBMS Network Coordinat-ing Team, the Provincial Government of Romblon and the UNDP-Philippines which aims to track progress towards the achieve-ment of MDGs in the province and create a document that would increase awareness of local stakeholders regarding the universal development thrust.
The report utilized the result of the 2007 CBMS survey and other administrative data.
The result presented in this report suggest-ed that there has been some good news, and not so good news in some indicators but there are those that pose a great challenge for the remaining five years until the 2015 target. Without doubt, there is a need for a concerted effort among all stakeholders, from the national down to the local level, to make urgent response to achieve the MDG targets that would make a better life for every person in the province.
Good news:• Prevalence of underweight children
under 5 years old was 8.12 percent which is already below the national target of 17.25 percent by 2015.
• Literacy rate among the 15-24 years old was high at 97.7 percent and was only
2.3 percentage point away from the 100 percent target.
• Ratio of girls to boys in elementary is 0.9 but this is due to the higher popula-tion of boys than girls. In high school and college, ratio is higher in favor of girls attending higher education at 1.0 and 1.1 respectively.
• Ratio of literate females to males age 15-24 years old is lower at 0.9 accounting for the higher male population than females in this age group.
• No HIV/AIDs case in the province.• The proportion of informal settlers in
the population was low at 1.3 percent and those living in makeshift housing was 2.1 percent.
Not so good news: • Proportion of population who experi-
enced food shortage was minimal at 3.0 percent.
• Employment rate was high at 97.7 percent although employment opportunities provide low economic returns.
• Poverty gap ratio was moderate at 0.3.• Proportion of children’s death at age 0
to less than five years old was 0.6 percent, infants at 1.8 percent and those 1 to less than 5 years old was 0.8 percent.
• Proportion of women deaths due to pregnancy related causes was 0.2 percent.
• Proportion of population with access to

15Status Report on the Millennium Development Goals Using CBMS Data Province of Romblon
safe drinking water was 76.3 percent and the proportion of population with access to sanitary toilet facilities was 71.4 percent.
• Proportion of households with landlines/telephone lines was a meager 1.2 percent but this is due to the province’s geophysical characteristics.
• Proportion of population with cellular phones was 27.0 percent but increasing.
• Proportion of population with computers was low at only 3.34 percent because of the difficulty in obtaining internet connection.
Posing great challenge:• Proportion of population below poverty
threshold was staggering at 68 percent and those below food threshold was 55.7percent.
• Proportion of children 6-12 years old enrolled in elementary education was 77.1 percent, those 13-16 years old enrolled in high school was 78.4 percent and those
children aged 6-16 enrolled in school was 88.5 percent which is more than 10 percentage points short of the 2015 target of universal education.
• Only 26.4 percent of women held elective positions in the province at the barangay, municipal and provincial levels.
• Contraceptive prevalence rate was 32.0 percent while the proportion of couples using condom among those who are practicing family planning was only 1.4 percent.
• Prevalence of death rates associ-ated with tuberculosis was high at 46.68 percent.
• Proportion of population under inadequate l iving condition was 43.1 percent because of the water and sanitation component.
Here is the summary of the status of the MDG indicators based on the 2007 CBMS result.

16Status Report on the Millennium Development Goals Using CBMS DataProvince of Romblon
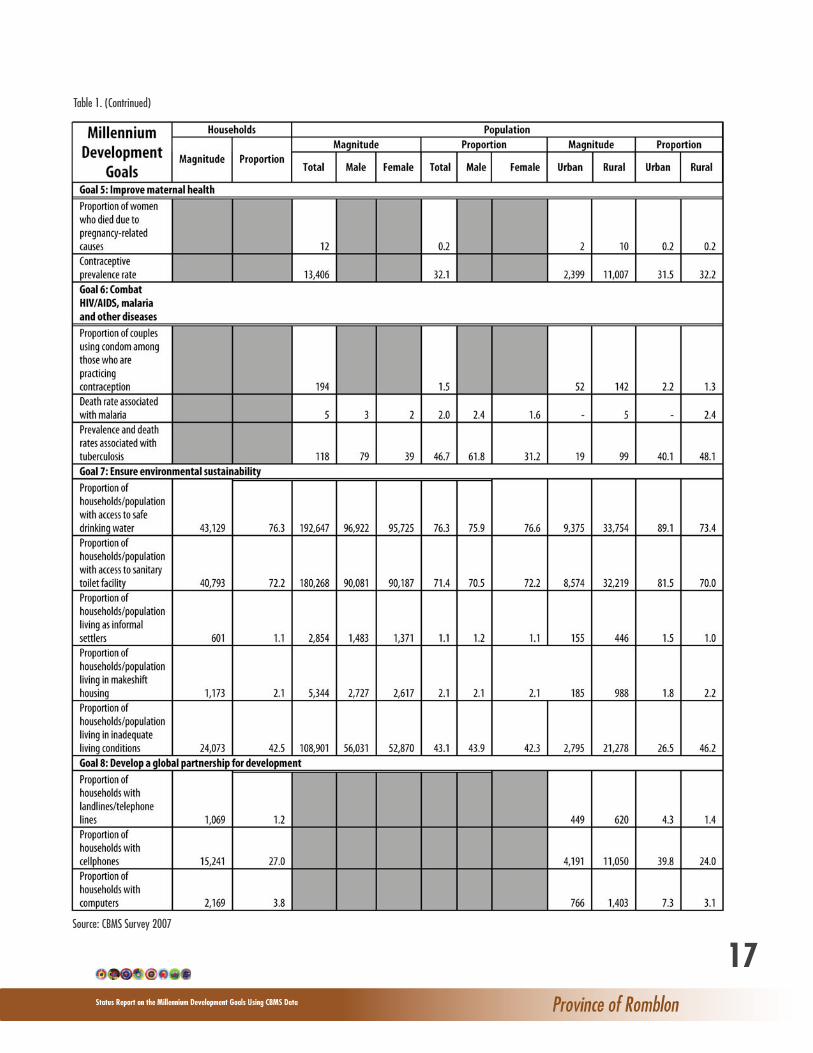
Table 1. Summary of findings of MDG indicators, Province of Romblon, 2007
17Status Report on the Millennium Development Goals Using CBMS Data Province of Romblon
Table 1. (Contrinued)
Source: CBMS Survey 2007

18Status Report on the Millennium Development Goals Using CBMS DataProvince of Romblon
To achieve the MDG targets, the conver-gence of service providers from the national down to the local level is required. Likewise, the concerted efforts of all stakehold-ers, including participation of NGOs is necessary to overcome the great challenge, particularly on poverty and education. The prioritization of our meager financial resources to engender the desired results will help in the realization of our targets but we still need to seek outside fund sources to be able to implement the myriad strategies and projects essential for the attainment of the MDGs.
Recommendations
1. Eradicate Extreme Poverty and HungerTo make an inroad in conquering poverty,
the national and provincial governments together with the LGUs must align provision of intervent ions needed to upl i f t the socioeconomic conditions. Microfinancing and small scale industries could trigger progress coupled with strengthening of marketing linkages, particularly for the marble and coconut based products. It would be advantageous if each LGU can put up one industry to boost and increase the earning power of the people.
Due to our geophysical characteristics, it is desirable to promote the tourism industry that could create job opportunities. To provide alternative sources of income we should encourage our students to take technical/vocational courses. To enhance agricultural production, our Agricultural Technologists must go out of their way to teach the marginalized farmers with innova-tive farming techniques, including use of modern farm inputs. Likewise, we should tap
the potential of our vast surrounding seas and develop industries based on marine resources.
2. Achieve Universal Primary EducationIt is noted that completion rate for both
elementary and high school is quite low. Strengthening the Early Childhood Care and Development (ECCD) program/daycare services and expanding the pre-elementary education services of the Department of Education (DepEd) would help the students for the transition into the elementary education system including their readiness; hence will reduce dropouts.
Intensify the Alternative Learning Service for the areas very far from educational institutions and provide additional Special Education (SPED) classes for those children with special needs. The Tuloy Aral Walang Sagabal (TAWAG) program of the Depart-ment of Social Welfare and Development (DSWD) should be expanded to cover all municipalities. Improvement of school facilities including provision of books and instructional materials will also inspire children to study. We also need to provide scholarship programs for deserving but poor students. Local School Boards should look deeper into the issue of low participa-tion in both elementary and high school. Reasons for dropouts must be evaluated for proper strategies and solutions to be implemented.
3. Promote Gender Equality and Women Empowerment
There is a pronounced trend that fewer males attend secondary and tert iary education. Provision of livelihood projects to augment family income and short term technical and practical courses would

19Status Report on the Millennium Development Goals Using CBMS Data Province of Romblon
encourage some of them to at least finish high school. To address this concern, a study must be made to determine the real reasons so that adequate policies and interventions could be put in place.
For women empowerment, provision of livelihood skills training with gender advocacy could increase their self-esteem and will enable them to be productive members of the community. The establish-ment of a One-Stop-Shop for victims of abuse and the Women’s Desk wil l encourage more women to report cases of atrocities. Information and dissemina-tion of the VAWC law will help decrease marital abuses including maltreatment of children. To encourage more women to seek elected position and serve their communities, women’s success stories in
the area of governance could make them realize that they could also make a differ-ence and contribute to the well being of the community.
4. Reduce Child MortalityInstitutionalizing the facility based birthing
through upgrading of health facilities into standard Comprehensive Emergency Obstetric and Newborn Care (CEMONC) facility in the case of hospitals and for the Rural Health Units (RHUs) into a standard Basic Emergency Obstetric and Newborn Care (BEMONC) facility. Improve services of RHUs to include regular weekly/monthly visit to remote barangays. Implementation of the Responsible Parenting Movement (RPM) through parents association could generally encourage couples to practice birth spacing using whatever method is
20Status Report on the Millennium Development Goals Using CBMS DataProvince of Romblon
acceptable to them. Provision of Adoles-cent Health and Youth Development programs would also address the issues of teenage pregnancies.
5. Improve Maternal HealthInvolvement and active participation of
all stakeholders, particularly the Municipal Health Officers (MHOs) can make a lot of difference, particularly in service delivery and implementation of innovative program interventions. Utilize the Barangay Nutrition Scholars (BNS) to monitor pregnant women in their areas and encourage them to submit themselves for prenatal check-ups. Replicate the innovative practices like the Buntis Baby Project of LGU Cajidiocan that encourages mothers to seek prenatal consultations through a savings scheme for use at birth. Continuous information, education, and communication (IEC) on Reproductive Health and encourage would be mothers to submit for prenatal checkup.
6. Combat HIV/AIDs, Malaria and other DiseasesBe vigilant to maintain the situation by
providing the much needed information dissemination campaign on the prevention as well as providing medical examination to suspected carrier or infected individual. On tuberculosis, encourage all RHUs to seek accreditation to be a Tuberculosis Directly Observed Treatment Scheme (TB DOTS) facility to better respond to the challenge of providing treatment and cure to TB positive patients. Provision of a sustained IEC campaign to encourage client to submit for sputum test and take complete treatment coupled with advocacy for a tuberculosis-free LGU.
7. Ensure Environmental SustainabilityStrict implementation of environmental
laws must be adhered to stop the degrada-tion of our environment and start reversing the process. Approval of the Sangguniang Panlalawigan of the proposed Environmen-tal Code is a priority to guide us in our quest for environmental sustainability.
Expansion and establishment of fish sanctuaries, rehabilitation of mangroves and regular coastal cleanup can improve our marine resources. Reforestation of all forest lands, including Mt. Guiting-guiting Natural Park and support the Integrated Social Forestry (ISF) and Community-Based Forestry Management (CBFM) programs to hasten the recovery of our forest cover. Immediate attention must be made to rehabilitate our watershed areas to improve current water sources. Strengthen the implementation of the Integrated Coastal and Marine Resources Management (ICMRM) to cover all areas so that all economic activities could be monitored. Proper mobilization of “Bantay Dagat” agents to apprehend encroaching commercial fishing vessels in municipal waters and strict implementation of fishery laws and fines to discourage them.
For the informal/illegal settlers, establish-ment of housing projects for their reloca-tion including provision of l ivel ihood opportunities will dramatically improve their socioeconomic condition. For waterless families, improvement of water system facility and provision of toilet bowls for those without sanitary latrines would ensure their health.
For those living in makeshift housing, expanding the core shelter assistance of the DSWD would address some of them together with the provision of skills training

21Status Report on the Millennium Development Goals Using CBMS Data Province of Romblon
and livelihood assistance. Expansion of the 4Ps (Pantawid Pamilyang Pilipino Program) would significantly improve the conditions of the poorest of the poor.
8. Development for Global PartnershipProvision of career options particularly
for our younger generation could bring in development because of a highly educated labor force. Priority is the establishment of a Research Facility for research studies in any field, particularly, on the endemic species and biodiversity found in Sibuyan Island, and high value agricultural products suited to the province’s unique land characteris-tics.
Improvement of internet access including relay stations for cell signal to increase communication within and even outside the country is a must. Encourage all High School Principals provincewide to include computer literacy in their academic curricu-lum for students to be ready for college and their chosen field in the future.
Funding Requirements
The province including the component LGUs are h igh ly dependent on the
Internal Revenue Allotment (IRA), hence, the 20 percent allocation for develop-ment projects of the provincial govern-ment is a meager P80M yearly which is further allotted to social services sector, economic services sector and general public sector, including payment for loan obligations.
The estimated funding requirement for the proposed plans/programs/activities for the next six years for the achievement of the MDG targets in 2015 is around P560M which partly has to be sourced out f rom funding agencies including Official Development Assistance (ODA) for the province to realize local targets.
For the health reform program, the prov ince rece ived a grant f rom the E u r o p e a n C o m m i s s i o n a m o u n t i n g t o P 7 7 M a n d a n a d d i t i o n a l P 3 5 M from the Department of Health (DOH) counterpart for a total of P112M health p a c k a g e u n d e r t h e P r o v i n c e - w i d e Investment Plan for Health (PIPH) for a four-year implementation period which is not reflected in the proposed plans/program/activit ies found in the latter part of this report under Financing the MDGs.

22Status Report on the Millennium Development Goals Using CBMS DataProvince of Romblon
Part 1. Provincial Profile
1. History
The Negritoes were the aborigines of the islands comprising the province of Romblon. The Mangyans were the fi rst settlers. Today, these groups of inhabitants are almost extinct with only a few of their descendants living in the mountain of Tablas and in the interior of Sibuyan Island. A great portion of the present population descended from the Nayons and the Onhans who immigrated to the islands from Panay and the Bicols and Tagalogs who came from Luzon as early as 1870.
Romblon was created as a regular province in 1901 but due to insufficient income, it became a subprovince of Capiz in 1907 until December 7, 1917, when Act No. 2724 reestablished the former province of Romblon. Under Commonwealth Act No. 581, enacted without executive approval on June 8, 1940, the province was reorganized with four towns, namely: Tablas (embracing Odiongan, Looc, Badajos, Santa Fe and Despujols), Romblon (comprising Logbon, Cobrador and Alad), Banton (involving Simara and Maestre de Campo), and Sibuyan (with the towns of Cajidiocan, Magdiwang and San Fernando).
The Japanese Imperial Forces maintained
a garr ison in Romblon during World War II from 1942 until the Naval Battle of Sibuyan on October 25, 1945. The islands became the center of considerable resistance movement under the direction of General Macario Peralta, Jr. from his Panay headquarters. One of the most exciting incidents of the Pacific War took place in the waters of Romblon, the Naval Air Battles between Japanese Admiral Kurita’s Fleet from Singapore and Admiral Halseys’ carrier planes from the American Third Fleet then stationed east of the Philippines.
The province of Romblon was liberated on
March 12, 1945 by units of the 24th Infantry Division under the command of a Colonel Clifford. On January 1, 1947, Romblon regained her Provincial Status through the passage of Republic Act No. 38, which was sponsored by Congressman Modesto Formilleza. The law not only repealed C.A. 581 but also restored the regular provincial government and the Municipalities of Romblon and created the municipality of Santa Fe.

23Status Report on the Millennium Development Goals Using CBMS Data Province of Romblon
Figure 1. Location of Romblon Province
2. Geo-Physical Environment
The province of Romblon is strategi-cally situated at the center of the Philippine Archipelago. It is composed of three major islands (Tablas, Sibuyan and Romblon) and seventeen minor and small islands. It is surrounded by deep waters, and is bounded by the islands of Masbate in the east, Mindoro in the west, Marinduque in the north and Panay in the south. It is approximately 187 nautical miles and 169 air miles south of Manila. The islands are dispersed and accessible only by sea transportation except for Tablas Island where a domestic airport is located in the municipality of Alcantara.
The total land area of the province is approximately 1,355.9 sq. km. represent-ing about 5.30 percent of the total land area of Region IV-B (MIMAROPA). Of
its 17 municipalities, nine are located in Tablas Island (San Agustin, Calatrava, San Andres, Odiongan, Ferrol, Santa Fe, Looc, Alcantara and Santa Maria), three in Sibuyan Island (Magdiwang, Cajidiocan and San Fernando) and five (Romblon, San Jose, Banton, Concepcion and Corcuera) are island municipalities.
The province is generally mountainous with about 40 percent of its land area having slopes greater than 50 percent. Only 4 percent of the total area has 3 to 8 percent slopes while a sparse 10 percent has 0 to 3 percent inclination. Narrow strips of coastal lowlands, low hills and plains typify the topography of some of the islands.
The major locations of areas that are highly product ive and bui ldable are basically in Tablas and Sibuyan Islands. In Tablas, these maybe found in Odiongan,

24Status Report on the Millennium Development Goals Using CBMS DataProvince of Romblon
How Romblon Got Its NameA legendary tale tells of how Romblon got its
name. When Loarca’s expedition touched sand in Romblon, one of the soldiers rumbled in the beach. Tired of strolling, he felt thirsty, went up a house and asked for a drink. Th e low-built hut where he went up was a primitive one-room shelter. Inside it was a hen’s nest somewhere at the top of a post near the window. A hen was hatching eggs therein. Th e Castillan soldier in-quired if he could get the chicken for free. Th e house occupant, a young woman, did not com-prehend what the visitor said so she answered in the dialect “nagalomlom”, meaning the chicken was brooding. Perplexed, the Spanish soldier left the house muttering in disgust the word “naga-lomlom”. Th en when he returned to the ship he was asked where he had been and he answered mockingly - “nagalomlom”.
When the Iberians left, they named the island “Nagalomlom” until it was corrupted to Domblon, and later on modifi ed to Romblon.
Since then, the group of islands scattered in the surrounding water area was named Romblon.
San Andres, Looc and Santa Fe. All three municipalities in Sibuyan Island on the other hand, have substantial level to gently sloping lands. Overall, good developable lands represent only about 13 percent of the province’s total area.
The province of Romblon falls under Type III of the Corona’s climatic classification system. It is characterized by no pronounced wet and dry seasons. Generally, the wet season is from June to November and sometimes extends up to December when the southwest monsoon is predominant. The dry season is from January to May that is sometimes interrupted by erratic rainfall.
3. Population and Social Environment
PopulationAs of Census 2007, Romblon has a
population of 279,774. I t ranked 4th among the five provinces of Region IV-B (MIMAROPA) and had about 11 percent share of the total regional population. The most populous municipalities in the province are Odiongan, Romblon and San Fernando. Combined, these three municipalit ies accounted for 36 percent of the provincial population.
The municipalities with the least popula-tion are Concepcion and Ferrol with only 4,166 and 6,595 population, respectively.
Population growth rate for the province was registered at 0.78 for the period 2000 to 2007, the second lowest in the MIMAROPA region. The municipalities that showed the highest population growth rates are Santa Fe and San Jose with 1.99 and 1.90. Two municipalities registered a negative growth rate, Concepcion with -1.60 and Corcuera with -0.90, both island municipalities.
Population density for the province stood at around 206 persons per sq. km. Population density is highest in the island municipalities of Corcuera with 465 and San Jose with 326 persons per sq. km. The least densely populated municipalities are Calatrava and Magdiwang with 112 and 115 persons per sq. km. respectively.
Health ServicesThere are eight hospitals in the province,
all of which are government-owned. The hospitals in Tablas Island are the follow-ing: Romblon Provincial Hospital (RPH) in Odiongan (75 beds), Tablas Island District Hospital (TIDH) in San Agustin (25 beds) Don Modesto Formilleza District Hospital

25Status Report on the Millennium Development Goals Using CBMS Data Province of Romblon
(DMFDH) in Looc (25 beds) and San Andres District Hospital (6 beds). In Sibuyan Island, the Sibuyan District Hospital in Cajidiocan can accommodate 25 in-patients. In the island municipalities, the San Jose District Hospital in San Jose has 10 beds, the Malipayon District Hospital in Corcuera has 10 beds and the Romblon District Hospital in the capital town of Romblon has 75 beds. The total bed capacity of the eight hospitals is 251 or a bed to population ratio of 1:1,115.
3.3 EducationBased on the report from the
DepEd Division of Romblon for CY 2007-2008, there are 477 schools offering pre-elementa-ry, elementary and secondary education in the province. For pre-elementary, a total of 200 schools of which 18 are private and 182 are public serves the province. For elementary, a total of 226 schools, 11 of them private and 215 publ ic schools. For secondary, a total of 51 schools are available, 10 are private, 38 are public and 3 are under State University/College (SUCs). Enroll-
ment for the same schoolyear totals 8,307 for pre-school, 51,995 for elementary and 27,122 for secondary. The report further shows that almost 95 percent of the basic education enrollees in the division are in public schools, as can be gleaned from the table below.
For elementary school participation rate, Gross Enrollment Ratio (GER) or those enrolled in elementary regardless of age
Source: NSO, 2007 Census of Population
Table 3. Number of Schools and Enrollment Data, SY 2007-2008
Table 2. Demographic Features, By Municipality

26Status Report on the Millennium Development Goals Using CBMS DataProvince of Romblon
for CY 2007-2008 is 98.7 percent while Net Enrollment Ratio (NET) or those enrolled in elementary age 6-12 is only 80.22 percent. For the same year, elementary comple-tion rate is recorded at 68.05 percent. For secondary participation rate for the same period, the division recorded a GER of 72.8 percent while NET or those enrolled in high school aged 13-16 is only 52.3 percent.
Completion rate for secondary school for the same period is recorded at 72.22 percent.
4. Local Economy
Agriculture and Livestock
Agriculture is the main industry in the province. Coconut is the number one crop with a total planted area of 58,270.44 hectares. San Agust in has the most extensive area with coconut plants followed by Romblon and Cajidiocan. Rice is the next crop being produced particularly in Odiongan, Looc, Cajidiocan and Santa Fe. Other crops grown include root crops, vegetables and fruits. Odiongan, Banton and Magdiwang have the greatest areas planted with root crops and correspond-ingly, with the highest volume of production. Vegetable production is mostly for home consumption and grown in small scale.
L ivestock development and poultry production is a viable smallscale enterprise for farmers in the province. The provincial government maintains breeding facilities in strategic locations provincewide to encourage farmers to engage in livestock and poultry production to augment their income. Livestock and poultry manage-ment training and seminars is provided to interested clients.
Due to the geographical condition of the province, crops and livestock production is generally deficient as compared to the food requirements of Romblon population. To meet the rice requirements, Romblon relies on imports from the neighboring provinces where vegetables, poultry meat, vegetables and fruits are supplied mostly by Luzon.
Coastal Marine Resources
Fishing industry can be a major enterprise as Romblon is surrounded by bodies of water. The fishing ground of Romblon is a migratory path of fishes from Sulu and Visayan Seas passing Tablas Strait, Sibuyan Sea and Romblon Pass. The waters also abound with demersal fishes due to the coral reefs surrounding the islands.
Because the province has a great potential for aqua/marine development, the province implemented a coastal and resource management program. Each municipality established a fish sanctuary and passed laws on fishery. The use of compressor in the municipal waters was regulated and banned altogether in some municipalities.
Mineral Resources
Marble is the most significant mineral deposi t of Romblon and is the most renowned product of the province. Based on statistics, Romblon is the second biggest provincial marble producer of the country next to Bulacan. Romblon marble is of very high quality and comes in shades of white, green, pink, red and black. The Mines and Geosciences Bureau has estimated that Romblon is endowed with about 150 million metric tons of marble. At current rates of extraction, the supply may last for

27Status Report on the Millennium Development Goals Using CBMS Data Province of Romblon
three more centuries. Tablas Island is also believed to have vast reserves of marble.
Marble quarrying and processing are major activities in Romblon. Among the most common marble products are catego-rized into the following: novelty items (gifts, ashtray, table bars), furniture (dining tables, baptismal fonts) and construction materials (tiles, balusters, marble chips).
Other mineral resources with consider-able quantity include nickel ore and gold mostly to be found in Sibuyan Island. Gold panning and smallscale mining is a lucrative undertaking in the municipality of Magdiwang.
TourismRomblon’s exotic blend of sun, sea and
forest, together with its peaceful and friendly people make it an enchanting destination for nature and adventure travelers. Both local and international tourists can have their pick of diverse and interesting places and activi-ties they can fi nd in our 20 islands and islets. The province has white sand beaches, secret coves and serene islets, waterfalls, historic sites, old churches and caves believed to be ancient burial sites. Mt. Guiting-Guiting Natural Park in Sibuyan Island is a famous site for mountain climbing. Moreover, it is a center for plant diversity and home to many native, endangered and rare and vulnerable birds, mammals and reptiles.
5. Infrastructure/Utilities/Facilities
Road NetworkThe coastal roads traversing the major
islands of Romblon, Sibuyan and Tablas Island form the backbone of the road network of the province. Roughly 70
percent of these road networks are located in Tablas Island. By road category, majority are national roads with total length of 311.046 kilometers, followed by provincial roads with 239.005 kilometers. There is no available data for municipal and barangays roads. By surface type, most of the roads were paved by gravel/earth, portions of circumferential roads are also concrete as well as most roads in Poblacion.
The primary modes of land transportation in the province are jeepneys, motorcy-cles, mini-buses and tricycles that serve inter-municipal movements and linkages. Motorized bancas provide transport means from island to island. At present, there is an available domestic flight in Tablas Island to and from Manila three times a week. Roll-on/roll-off (RORO) ships facilitate movement outside the province via the port of Batangas.
Water SupplyOut of 17 municipalities, 14 have Level III
water supply systems serving about 32.57 percent of the total provincial households. Level III has a reservoir with house-to-house connections. Majority of households in the province were serviced by Levels II and I water system. Level I category is a common facility where the community members get their water supply from shallow wells and deep wells while Level II has a reservoir with communal faucet. Based on the 2007 CBMS report, the proportion of population with access to safe drinking water is 76.28 percent.
Power SupplyPower supply is generated by the National
Power Corporation (NPC) and serviced by two electric cooperatives.

28Status Report on the Millennium Development Goals Using CBMS DataProvince of Romblon
Tablas Island Electric Cooperatives (TIELCO) serves the power needs of Tablas Island including the island municipality of San Jose. As of 2006, TIELCO has a total of 21,097 house connections.
R o m b l o n E l e c t r i c C o o p e r a t i v e (ROMELCO) supplies the capital town of Romblon as well as Sibuyan Island. As of the year 2007, ROMELCO has 5,288 house connections in Romblon and 5,150 house connections in the three municipali-ties located in Sibuyan Island or a total of 10,438 house connections in their franchise area.
The Islands of Banton, Concepcion and Corcuera are attended to by the National Power Corporation (NPC) through the municipal governments.
TelecommunicationsThe province has several operating
telecommunication exchanges, namely: Kayumanggi, Romblontel , Odiongan Telephone Corporation (OTELCO), the Te lecommunicat ion Of f ice (TELOF) , Telegram System, Liberty Phone, Public Calling Stations under the DOTC and the Provincial Communication System (PCS) radio transceivers and receivers. SMART and GLOBE telecommunications have relay stations in the three urban centers of Romblon, Odiongan and Cajidiocan. Most areas in the province are already connected through cellphones except in some places were the signal is weak or non-existent because of towering mountains that block the signal. The triple peak in Santa Maria has a relay station for GMA, PLDT and Liberty Phones.
6. Local Institutional Capability
Romblon has been reclassified as a third class province as of CY 2002. A lone congressional district, it is made up of 17 municipalities and 219 barangays. Below is a list of the municipalities, the number of barangays and income classification.
1. Romblon – 3rd class, the capital town comprising 31 barangays
2. Alcantara – 5th class municipality with 12 barangays
3. Banton – 5th class municipality with 17 barangays
4. Cajidiocan – 4th class municipality with 14 barangays
5. Calatrava – 5th class municipality with 7 barangays
6. Concepcion – 6th class municipality with 9 barangays
7. Corcuera – 5th class municipality with 15 barangays
8. Ferrol – 6th class municipality with 6 barangays
9. Looc – 4th class municipality with 12 barangays
10. Magdiwang – 5th class municipality with 9 barangays
11. Odiongan – 2nd class municipality with 25 barangays
12. San Agustin – 4th class municipality with 15 barangays
13. San Andres – 5th class municipality with 13 barangays
14. San Fernando – 4th class municipality with 12 barangays
15. San Jose – 6th class municipality with 5 barangays
16. Santa Fe – 5th class municipality with 11 barangays

29Status Report on the Millennium Development Goals Using CBMS Data Province of Romblon
17. Santa Maria – 5th class municipality with 6 barangays
There are several banking facilities in the municipalities of Odiongan and Romblon. Rural banks facilitate loans and savings account in the municipalit ies without commercial banks like San Agustin, Looc, Alcantara, Santa Fe, Cajidiocan and San Fernando.
Based on the latest report from the Romblon Police Office, the province is considered one of the most peaceful in the country with a minimal volume of crimes. It has maintained the peace and tranquility of the place and never contributed to the destabiliza-tion of the country. The local communist movement is hardly felt in any part of the province wi th no a t roc i ty commi t ted against government personnel or establishment. Syndicated crime groups and criminal gangs continue to be non-existent and crime incidents are more often non-index crimes.

30Status Report on the Millennium Development Goals Using CBMS DataProvince of Romblon
30Status Report on the Millennium Development Goals Using CBMS DataProvince of Romblon
Part 2. Status Report on the Millennium Development Goals
Goal 1: Eradicate Extreme Poverty and HungerTarget 1.A : Halve between 1990 and 2015, the proportion of people whose income is less than one dollar a day.
A. Status and Trends
Proportion of Population Below Poverty Threshold
The province of Romblon belongs to the 10 poorest provinces in the Philippines in 2000.
Based on the report from the National Statisti-cal Coordination Board (NSCB), Romblon ranked 10th poorest in 2000 (52.2%), 25th in both 2003 (37.5%) and 2006 (41.9%) among the 81 provinces of the country. According to the 2007 CBMS data, the proportion of population below poverty threshold is a staggering 68.00 percent. The underlying cause of widespread poverty in the province is due to low economic returns as majority

31Status Report on the Millennium Development Goals Using CBMS Data Province of Romblon
of the people are marginal farmers and fi shermen with very little income generated in traditional farming and fi shing.
By municipali ty, the LGU that posted the highest proportion of population below poverty threshold is Ferrol with 80.47 percent followed by Magdiwang with 78.93 percent. Ferrol is a 6th class municipality and most of the employees working in the LGU are residents of the neighboring more prosperous town of Odiongan. The municipality that recorded the lowest proportion in this indicator is Odiongan with 56.27 percent. Odiongan is the only municipality classified as second class LGU, and where the only SUC in the province is located.
Source: CBMS Database 2007
Figure2. Proportion of Population Living Below Poverty Threshold
Table 5: Magnitude and Proportion of Households and Population Living Below Poverty Threshold, by Sex, by Urbanity, by Municipality, 2007

32Status Report on the Millennium Development Goals Using CBMS DataProvince of Romblon
Table 6: Magnitude and Proportion of Households and Population Living Below Food Threshold
Proportion of Population Living Below Food Threshold
More than half (55.68%) of the Romblon’s popula-tion are living below food threshold. Ferrol ranked highest with 71.67 percent followed by Magdiwang w i t h 6 8 . 9 6 p e r c e n t . Odiongan has the lowest with 43.55 percent.
Figure 3. Proportion of Population Living Below Poverty Threshold
Source: CBMS Database 2007

33Status Report on the Millennium Development Goals Using CBMS Data Province of Romblon
Poverty Gap Ratio
The poverty gap ratio or the mean distance separat ing the population from poverty line is only 0.34. This suggests that the people of the province are not without hope of overcoming poverty i f they were to be given a perfectly targeted intervention to improve their economic status. On this indicator, San Andres posted the highest ratio of 0.6 while Corcuera and Santa Fe posted the lowest ratios of .26. San Andres is basical-ly an agricultural area with farmers and tenants. On the other hand, Corcuera is an island municipality where most inhabitants engage in fishing activities.
Table 7: Poverty Gap Ratio, by Urbanity, by Municipality, 2007
Source: CBMS Database 2007 Figure 4. Poverty Gap Ratio

34Status Report on the Millennium Development Goals Using CBMS DataProvince of Romblon
Source: CBMS Database 2007
Target 1.B: Achieve full and productive employment and decent work for all, including women and young people
Employment Rate
Based on the 2007 CBMS data, employ-ment rate for the period is high at 97.73 percent for the province. Although most of the people in the province are employed, their jobs offer very little economic return. The LGU that posted the highest employment rate is Banton with 99.70 percent followed by Corcuera with 99.39 percent. Both are island municipalities whose major economic activi-ties are farming and fi shing. San Andres has
Figure 6. Employment Rate
Table 8: Employment Rate, by Urbanity, by Municipality, 2007

35Status Report on the Millennium Development Goals Using CBMS Data Province of Romblon
the lowest employment rate with 84.78 percent and posted the highest poverty gap ratio in the entire province. Majority of the people employed in San Andres are tenant farmers with very low income.
Target 1.C: Halve between 1990 and 2015, the proportion of people who suffer from hunger.
Proportion of Population Who Experienced Food Shortage
Based on the 2007 CBMS data, the province recorded a proportion of 3.02 percent of population who experi-enced food shortage. Considering
Table 9: Magnitude and Proportion of Households and Population who Experienced Food Shortage, by Sex, by Urbanity, by Municipality, 2007
Figure 6. Proportion of Population who Experienced Food Shortage
Source: CBMS Database 2007

36Status Report on the Millennium Development Goals Using CBMS DataProvince of Romblon
Table 10: Magnitude and Proportion of Underweight Children Under 5 Years of Age, by Sex, by Urbanity, by Municipality, 2007
the high proportion of poverty incidence, it is interesting to note that only a scant proportion of the population experienced food shortage. This is due to the fact that Romblon is blest with abundant natural resources. One can get food in the forest, rivers and the vast surrounding seas.
The LGUs that posted a two digit proportion in this particular indicator are Magdiwang with 16.19 percent and San Fernando with 10.32 percent, both in Sibuyan Island. These two municipalities have indigenous people living in the mountains and are dependent on traditional farming. The rest of the LGUs posted zero or a low proportion of below 5 percent.
Source: CBMS Database 2007
Prevalence of Underweight Children Under 5 years of Age
In the case of the province of Romblon, the indicator on the prevalence of underweight children under five years old shows a very promising trend. Based on the data from the Office of the Provincial Nutrition Action Officer (PNAO), the malnutrition prevalence rate in 1991 for the province was recorded at 20.02 percent. The figure had steadily gone down since. However, with the implementation of the International Reference Standard (IRS), a high 19.04 percent was recorded in 2003. Data from the PNAO record of the yearly Operation Timbang (OPT) has shown a gradual

37Status Report on the Millennium Development Goals Using CBMS Data Province of Romblon
Figure 7. Proportion of Underweight Children Under 5 Years of Age
decrease on the malnutrition prevalence rate since then.
Based on the 2007 CBMS data, prevalence of underweight children under five years old is recorded at 8.15 percent. The national baseline data on this particular indicator is 34.5 percent and the national target for 2015 is 17.3 percent. The current statistics shows that the province’s data is below the national target and will likely maintain this trend. At the municipal level, Magdiwang registered the highest prevalence of underweight children under five years old based on the 2007 CBMS data with 16.93 percent. It was followed by Alcantara with 16.53 percent and Ferrol with 16.07 percent. The municipality with the lowest prevalence rate is San Jose with only 1.52 percent.
B. Current Policies and Programs
The elected officials of the province are very much aware that Romblon is among the poorest provinces in the country. Hence, most plans, program and activi-ties prioritized in the 20 percent Annual Development Fund (ADF) were geared towards the upliftment of the socioeconomic condition of the people. The province and the LGUs have targeted the marginalized sector and provided them assistance in the form of livestock dispersal, vegetable seeds distribution and other livelihood opportuni-ties to help eradicate extreme poverty and hunger. For those people in crises situation and those affected by disaster or calamities, the provincial and municipal governments provided them with financial assistance

38Status Report on the Millennium Development Goals Using CBMS DataProvince of Romblon
and materials to help them overcome their dire situation. However, due to financial constraints, the provincial and local govern-ments can only provide very minimal intervention and cannot really sustain the effort as other priority needs have also to be given preference.
The National Government has also launched the Hunger Mitigation program which the provincial and local governments is trying to institutionalize in their local programs to help achieve national target.
C. Challenges
The primary challenge for economic development and the eradication of poverty and hunger is basically our geo-physical environment. Being archipelagic in nature, accessibility to some island municipalities is very diffi cult particularly during inclem-
ent weather. Coupled with the fact that the province is generally mountainous, develop-ment initiatives are limited to smallscale economic enterprises, not enough to spur massive economic growth. Because of these limitations, the province does not attract outside investment that could generate more job opportunities for our people.
Another hindrance in our efforts to allevi-ate poverty is the meager income derived from local sources. The province has no tax base to generate income aside from real property taxes which is scant; hence the province is very much dependent on its share of the Internal Revenue Allotment (IRA). Because there are not enough funds to pursue relevant economic initiatives or even provide pump priming activities for short term relief, the province and most LGUs are hard pressed to make do of what they can with their limited resources.

39Status Report on the Millennium Development Goals Using CBMS Data Province of Romblon
3939
Although the province is technically poor because of the low income of most people, it is very pleased to report that malnutrition is an area given priority and attention resulting to low prevalence. Th is can be attributed to the relentless eff orts of the provincial government, LGUs, as well as barangay offi cials in providing supplemental feeding for malnourished children. Feeding programs in the province are a concerted eff ort among stakeholders, thus, usually achiev-ing the desired eff ect. Th e annual Nutrition Month celebration has proven to be an eff ective advocacy mechanism that provides information on health and nutrition related issues. Th e local
implementation of the seven (7) Philippine Plan of Action for Nutri-tion (PPAN) impact programs and its facilitating activities were opera-tionalized provincewide. Under this program, the Provincial Nutrition Committee was formed. Some of the facilitating factors that helped improve the malnutrition situation are:
1. Deployment of Barangay Nutrition Scholars (BNS) in all barangays
2. Provision of prescribed salter-type weighing scales to all BNS province-wide
3. Active involvement of PNC members
Mr. Joey B. Morale-PNAO, watching the children falling in line to get „lugaw‰
Mrs. Gloria Elizabeth M. Merida –Nutrition Officer IV while holding the pot, while Mrs. Ara M. Magallon-Engineering Aide and Mrs. Estrella
M.Galindez-office helper , watching.
Supplemental Feeding Program for Malnourished Children

40Status Report on the Millennium Development Goals Using CBMS DataProvince of Romblon
including NGOs like the Red Cross and the Rural Improvement Clubs (RICs) in the ac-tivities
4. LGUs initiative to provide supplemental feeding to target pre-school children and pro-vision of fi nancial assistance/income generat-ing project materials to prioritized families with malnourished children
5. Annual monitoring and evaluation of local level plan implementation in all municipalities
6. Active organization of Rural Improve-ment Clubs
7. Provision of Nutri-noodles, GRO biscuits and iodized salt to underweight pre-school children in all municipalities
8. The parents of nutritionally deficient children were taught how to prepare simple yet nutritious food using locally available vegetables like malungay and camote tops. to correct imbalance diet.
Mrs. Gloria Elizabeth Madali Merida (holding the banner)-Nutrition Officer IV, Mr. Joey B. Morales-PNAO (peach uniform) and others who cooperated/helped
during the Mass Feeding
Children eating „lugaw‰ as prepared by the nutrition committee and staff

41Status Report on the Millennium Development Goals Using CBMS Data Province of Romblon
4411Status Report on the Millennium Development Goals Using CBMS Data Province of Romblon
Goal 2: Achieve Universal Primary EducationTarget 2.A: Ensure that, by 2015, children everywhere, boys and girls alike, will be able to complete a full course of primary schooling.
A. Status and Trends
Proportion of Children Aged 6-12 Years Old Enrolled in Elementary School
Education data for Romblon has been erratic as the fi gure tends to go up and down and vice versa for the past two decades. In 2007, data from CBMS reveals that the proportion of children aged 6-12 years old enrolled in elementary education is 77.06 percent. The low proportion could be due to the specifi c age group, hence, those in elementary school whose age are above
12 years old were not captured. The male proportion is slightly lower at 76.12 percent compared to the 78.08 percent for girls. This means that more boys than girls do not attend primary education. There is no pronounced difference on data based on urbanity when it comes to elementary education. The munici-pality that registered the highest proportion of children enrolled in elementary schools are Looc and Alcantara with 81.40 and 81.08 percent respectively. Both municipalities are located in Tablas Island with relatively flat to gently rolling terrain. The lowest proportion was recorded by Cajidiocan with 73.6 percent, a mountainous municipality in Sibuyan Island. The diffi culty of going to school by those living far from school is one of the reasons for the low participation rate in this municipality.

42Status Report on the Millennium Development Goals Using CBMS DataProvince of Romblon
Proportion of Children Aged 13-16 Years Old Enrolled in High School
For high school education, the propor-tion of children going to school age 13-16 is very low at 62.52 percent. Even if we consider those in high school whose age are more than 16 years old, the data is still low. Males in high school comprised 56.16 percent compared to the 69.49 percent females. Based on this data, a consider-able number of males in the province do not attend secondary education. The reason could be due to poverty - they opt to find work early to contribute to the family income, rather than continue higher education. In urban areas, there are 70.18
Source: CBMS Database 2007
Figure 8 .Proportion of Children Aged 13-16 Years Old Enrolled in Elementary School
Table 11: Proportion of Children Aged 6-12 Years Old Enrolled in Elementary School, by Sex, by Urbanity, by Municipality, 2007

43Status Report on the Millennium Development Goals Using CBMS Data Province of Romblon
percent of 13-16 years old youth who go to school while in rural areas, there are only 60.79 percent. This data also shows that more 13-16 years old in the rural areas do not attend secondary education. One reason could be the distance of secondary schools in the rural areas as each school serves about an average of 4 barangays (only 51 secondary schools serve the 219 barangays provincewide). The accessibility to the schools coupled with lack of pocket money could be the deterring factors for most 13-16 years old to attend secondary education in the rural areas. The municipal-ity that registered the highest proportion of participation rate is Concepcion with 81.67 percent, an island municipality farthest from
Figure 9 .Proportion of Children Aged 13-16 Years Old Enrolled in High School
Source: CBMS Database 2007
Table 12: Proportion of Children Aged 13-16 Years Old Enrolled in High School, by Sex, by Urbanity, by Municipality, 2007

44Status Report on the Millennium Development Goals Using CBMS DataProvince of Romblon
the provincial capital with gently rolling terrain. Four municipalities registered less than 60 percent participation rate in this age bracket, Calatrava (52.66%), San Jose (55.10%), San Fernando (56.04%) and Cajidiocan (56.33%). With the exception of San Jose, the three LGUs are generally mountainous while the former is very near Boracay Island, hence, some youths are drawn to peddling goods to the tourists in the area, rather than continue their second-ary education.
Proportion of Children Aged 6-16 Enrolled in School
The proportion of 6-16 years old children enrolled in school is 88.86 percent. There are more schooling children in the urban
Figure 10 .Proportion of Children Aged 6-16 Enrolled in School
Source: CBMS Database 2007
Table 13: Proportion of Children Aged 6-16 Enrolled in School, by Sex, by Urbanity, by Municipality, 2007

45Status Report on the Millennium Development Goals Using CBMS Data Province of Romblon
areas (90.86%) compared to the 87.93 percent in the rural areas. Accessibility to school is a factor causing the disparity of enrollment. The town of Banton has the highest percentage (94.51%) of 6-16 years old schooling children. This is an island municipality with gently rolling terrain. The municipality with the least proportion is San Fernando with 84.54 percent, a mountain-ous municipality south of Sibuyan Island. An indigenous community is present in the island.
Literacy Rate of 15-24 Year-Olds
For ages 15-24 years old, the province recorded a 97.71 percent literacy rate, a bit higher than the national baseline and
Figure 11. Literacy rate of 15-24 year-olds
Source: CBMS Database 2007
Table 14: Literacy Rate of 15-24 Year-Olds, by Sex, by Urbanity, by Municipality, 2007

46Status Report on the Millennium Development Goals Using CBMS DataProvince of Romblon
2003 figure of 96.6 percent. There is no pronounced disparity for the urban and rural areas when it comes to the literacy indicator. The municipality of Alcantara registered the highest proportion for 15-24 years literacy rate with 98.73 percent. A trade school, Alcantara National Trade School (ANTS) is present in the municipal-ity. Meanwhile, Concepcion hit the lowest proportion with 93.36 percent.
B. Current Policies and Programs
The education program in the country is national based. However, with the implementation of the Local Govern-ment Code of 1991 (RA 7160) the Local Government Units were given authority to implement education related programs by giving them authority to levy funds in the form of the Special Education Fund (SEF) which is taken from real property taxes. With the national policy for free education for both elementary and high school and the augmentation of funds from SEF for the local government units, the national and local government units are empowered to provide the necessary intervention to achieve universal primary education.
To achieve this goal, numerous national and local initiatives were implemented. There was the Third Elementary Education Program (TEEP) which includes construction of new classroom, renovation of dilapidated elementary school buildings, procurement of tables and chairs including provision of textbooks. There was also the Secondary Education Development and Improvement Program (SEDIP) which likewise provided for construct ion and improvement of secondary schools with counterpart from the LGU.
On education services, the Department of Education also provides specialized programs that cater for those with special needs, such as Special Education (SPED) for children with disabilities. However, SPED classes are only given in major urban areas and not all special children can avail of the service. Another program of the DepEd Division of Romblon is the Alternative Learning System (ALS) which cater to those children that cannot really go to school for some reasons.
C. Challenges
The major cha l lenge in ach iev ing universal education is poverty. Parents who cannot buy the necessary needs of the children such as bags, notebooks, papers and pencils, are more prone to defer sending their children to school. More l ikely, the chi ldren themselves would not like to go to school if their parents themselves do not encourage them to enroll. With this kind of environ-ment, the children are discouraged to study and if they skip school for a year, most likely, they would not go to school anymore. There is also the problem of great distance from school. Some parents are reluctant to send their small children to school because they have to walk great distances and have to wake up by dawn to prepare so that they will not be late. There are instances that they have to climb mountains and cross rivers in order to reach school. This is usually the case for secondary education where one institution caters to around 4 to 5 remote barangays. These aggravating circum-stances sometimes led to negative attitude towards going to school and eventually led to school dropouts.

47Status Report on the Millennium Development Goals Using CBMS Data Province of Romblon
Initiatives on policies and programs aimed to reduce dropouts and improve academic perfor-mance are being sustained by the DepEd Division Offi ce of Romblon. Initial gains in the improve-ment of student academic achievement as mea-sured by the National Achievement Test (NAT) Mean Percentage Score and in the reduction of student absences and eventual dropouts are at-tributed by the teachers to the much-improved learning environment. Modest initial gains in-clude 6.2 and 0.6 incremental improvements of MPS in the second year and fourth year NAT results respectively in 2006 and 2007. Reduction of student dropouts on the other hand is initially indicated by a 2.27% dropout rate in SY 2005-2006 from 5.0% in SY 2004-2005.
“Pagpasok mo, bantay ko” (PMBK) is an at-tendance tracking mechanism where a student leader is assigned as an attendance monitor of a particular group of students in a particular subject area. Th e attendance report is consolidated by the attendance monitor and submitted to the class adviser who addresses observed problems on ab-sences or cutting of classes. When needed, a case is a subject of a teacher-parent dialogue during the quarterly homeroom PTCA meeting. PMBK was introduced in 2006 and has been sustained over the last two years.
Quarterly Homeroom PTCA meetings. Each homeroom organizes a homeroom PTCA. A quarterly meeting is conducted in time with the release of student report cards as a forum for parents to get feedback on their children’s school performance and for the homeroom adviser to
take up concerns with a parent whose child needs special follow up.
Adopt a Student Pro-gram. LGU offi cials, teach-ers and generous community members help avert students from dropping out by providing miscellaneous fees, school supplies or lodging house especially for needy students from outlying barangays. Since the program’s introduction in the early years of Calatrava National High School when it was still Calatrava Community High School, on the average, 25 student benefi ciaries are assisted annually.
Supplementary Values Teaching. To reinforce regular values education classes, religious groups are accommodated to conduct 30-minute teach-ings off ered to students on voluntary basis during lunch break. Th is school year, the Lamp Founda-tion has sustained its Monday to Th ursday teach-ings particularly off ered to First Year students.
Class Enhancement Program. Additional 20 minutes of daily enhancement activities except on Fridays are spent to reinforce ear-lier developed competencies in Science, Math and English. Th e intention is to reinforce the identifi ed least learned competencies based on formative and summative tests. Th ese are on top of the regular teaching to introduce and develop new competencies in the three subject areas. Th e program was introduced as a Division initiative in June 2002 and has been sustained over the last six years.
School-Community collaboration reduces student dropouts and improves academic performance

48Status Report on the Millennium Development Goals Using CBMS DataProvince of Romblon
4488Status Report on the Millennium Development Goals Using CBMS DataProvince of Romblon
Goal 3: Promote Gender Equality
Target 3.A: Eliminate gender disparity in primary and secondary education, preferably by 2005, and in all levels of education no later than 2015.
A. Status and Trends
Ratio of Girls to Boys in Primary Education
With regards to gender equality, the data for Romblon shows that for the ratio of girls to boys in primary education, it is 0.90 because of the higher male population
and enrollment in the 6-12 age bracket as compared to the female data. The munici-pality of San Jose recorded the highest ratio of 0.98 percent while Concepcion the lowest with 0.80 percent. There is no discernable disparity for the data based on urbanity.
Ratio of Girls to Boys in Secondary Education
On the other hand, the ratio of girls to boys in secondary education is 1.03 despite the higher male population in the 13-16 age group compared to female popula-tion. The data reveals that there are more

49Status Report on the Millennium Development Goals Using CBMS Data Province of Romblon
female students in high school, suggesting that more males in the 13-16 age bracket does not enroll in secondary education or more males are dropping out of school. The municipality that registered the highest ratio is Santa Maria with 1.17 while the lowest is Banton with 0.80. The data for Banton is understandable as there is a considerable number of male population (284 males against 225 females) and enrollment (201 males as against 173 females) in the 13-16 age bracket. There is no discernable dispar-ity in the urbanity data for this particular indicator.
Ratio of Girls to Boys in Tertiary Education
Likewise, the ratio of girls to boys in tertiary education is 1.14 for the province.
Source: CBMS Database 2007
Figure 12. Ratio of girls to boys in primary education
Table 15: Ratio of Girls to Boys in Primary Education, by Urbanity, by Municipality, 2007

50Status Report on the Millennium Development Goals Using CBMS DataProvince of Romblon
The data shows that more females are enrolled in tertiary education than males. This further reiterates the trend that more boys stayed out of school as they grow old. The municipality that recorded the highest ratio is Santa Maria with 1.86 while Concepcion recorded the least ratio of 0.43.
Ratio of Literate Females to Literate Males Aged 15-24 Years Old
Another indicator on gender equality is the ratio of literate females to males age 15-24. On this indicator, the ratio is 0.88 for the province. The reason for the lower ratio is the much higher male population for the 15-24 age bracket which is 22,381 males against 19,573 females. The municipality
Source: CBMS Database 2007
Figure 13. Ratio of girls to boys in tertiary education
Table 16: Ratio of Girls to Boys in Secondary Education, by Urbanity, by Municipality, 2007

51Status Report on the Millennium Development Goals Using CBMS Data Province of Romblon
Source: CBMS Database 2007
Table 18: Ratio of Literate Females to Literate Males Aged 15-24 Years Old, by Urbanity, by Municipality, 2007
that registered the highest ratio is Santa Maria with 0.97 while Corcuera registered the lowest ratio of 0.74. The data for urban area is slightly higher at 0.94 compared to the rural area at 0.86.
Proportion of Seats Held by Women in the Munici-pality and Province
When it comes to the proportion of seats held by women in the province, the propor-tion is only 26.37 percent. The municipality that registered the highest proportion is the municipality of San Agustin with 36.92 percent while the lowest was registered by San Jose with a scant proportion of 18
Figure 14. Ratio of Girls to Boys in Tertiary Education

52Status Report on the Millennium Development Goals Using CBMS DataProvince of Romblon
percent. In the political arena, the data reveals that in the province, it is dominated by male politicians. The reason for this is that majority of our women still believe that holding public office is more of a male occupation and that women’s first priority is the home and family.
B. Current Policies and Programs
Although the current national policy is education for all, there seems to be a gender bias in favor of girls attending education in the province. The preceding indicators showed that more males are dropping out of school and not pursuing higher education, particularly in the 13-16
Source: DILG
Figure 15. Ratio of Literate Females to Literate Males Aged 15-24 Years Old
Table 19: Proportion of Seats Held by Women in the Municipality and Province 2007

53Status Report on the Millennium Development Goals Using CBMS Data Province of Romblon
age group and in the tertiary education. In the province, this is due to the fact that more males opt to work rather than continue to a higher education to contribute to the income of the family. Provision of livelihood projects to augment family income and short term technical and practical courses would encourage some of them to at least finish high school. However, studies must be made to determine the real underly-ing causes of this trend so that adequate interventions or policies can be made to address this problem.
The concept of more males wielding power, be i t at home or in the work p lace, has been the pract ice in the pas t cen tu ry . Whi le equa l r igh ts i s enshrined in the Philippine constitution, in practice, women submit to men as the country adheres to the Christ ian teaching that wives should submit to their husbands. To promote Gender Equal i ty and Women Empowerment, both the nat ional and local govern-ment units have implemented Gender and Development (GAD) projects. The
Figure 16. Proportion of Seats Held by Women in the Municipality and Province

54Status Report on the Millennium Development Goals Using CBMS DataProvince of Romblon
Gender Sensitivity Training Seminar has been streamlined in the DSWD Program and a l l the i r se rv ices have gender component. Aside from this, various Gender Advocacy Activities are in place, in order to orient the women on their rights. Gender Advocacy is a bit slow due to accessibility problems in remote areas that post a challenge to provide this type of service. However, currently, mass ive e f for ts to promote Gender Equality can be gleaned in government init iatives such as the Women’s Desk and the Violence Against Women and their Children (VAWC) seminars, up to barangay level. During yearly conven-tion under the DSWD and Kalipunan ng L iping Pi l ip ina (KALIPI) program, symposium about Gender Sensitivity is continually made part of the featured activities. This is the ultimate direction of our LGU to combat the existing manifes-tations of gender bias to wit:
1. lower wages, last hired-first fired policy, little or no access to loans
2. women concentrated in low positions in bureaucracy, few women in policy-making level
3. child care and household responsibili-ties shouldered mainly by women on top of regular working hours outside the home
4. women portrayed either as homemak-
ers/virgins or as temptress/sinners in most advertisement
5. wife beating, rape, incest, and sexual harassment
C. Challenges
Filipinos being God-fearing people and steep in patriarchal tradition posed the major challenge in achieving the goal. In most of the rural areas, it is still the men who are the head of the family, meaning, they decide for the family even if it is the women who earn the family income. This has been the practice of past generations and the concept of gender equality is still novel. There are still plenty of cases of women’s abuse such as battered women and rape cases all throughout the province, hence, there is still a need to vigorously disseminate gender laws and advocate for women to assert themselves, particularly housewives who do not earn a living. It is also a big challenge how to reach these marginal ized women and another bigger challenge how to empower them in order for them to be able to enjoy parity rights with their male counterparts. All of these forms of gender bias are hindrances to development, thus, the challenge is to address these issues in every program implementation.

55Status Report on the Millennium Development Goals Using CBMS Data Province of Romblon
55Status Report on the Millennium Development Goals Using CBMS Data Province of Romblon
Goal 4: Reduce Child Mortality
Target 4.A: Reduce by two-thirds, between 1990 and 2015, the under-five mortality ratio
A. Status and Trends
Proportion of Children Aged 0 to Less Than 5 Years Old Who Died
Out of the total 29,728 children aged 0 to less than 5 years old in the province, there were 166 who died giving a 0.56 percent proportion. The data for the province is a bit high because of cases of diarrhea and some communicable or infectious diseases with acute respiratory infection as among the top leading cause of morbidity, followed by bronchitis and diarrhea. Magdiwang
has the highest proportion of 0 to less than 5 years old who died with 24 deaths (1.63%) followed by Ferrol with 8 deaths (1.10%). These two municipalities have no hospitals and only a Rural Health Unit provides health services to the people. The municipalities that registered the lowest proportion of 0 to less than 5 years old who died is San Jose with a proportion of 0.16 percent and San Andres with a proportion of 0.18 percent or a magnitude of 2 and 3 deaths, respectively. Male deaths are slightly higher at 0.63 percent than the female deaths at 0.47 percent. In terms of urbanity, rural areas registered a higher proportion of 0.58 percent compared to urban areas of 0.45 percent. This could be due to the accessibility of health facility in the urban areas.

56Status Report on the Millennium Development Goals Using CBMS DataProvince of Romblon
Proportion of Infants who Died
On the proportion of infant deaths, the province reported a magnitude of 96 out of the 5,221 children aged 0 to less than 1 year old or a proportion of 1.81 percent. Based on the report from the Provincial Health Office, Sepsis Neonatorum and Sudden Infant Death are among the top leading causes of infant mortality. Again, the municipalities that recorded the highest proportions are Magdiwang with 19 deaths out of 280 children aged 0 to less than 1 year old or a staggering proportion of 6.35 percent, followed by Ferrol with 7 deaths out of 144 or a proportion of 4.64 percent. The municipality that registered the lowest
Figure 17. Proportion of Children Aged 0 to Less than 5 years old who Died
Source: CBMS Database 2007
Table 20: Magnitude and Proportion of Children aged 0 to Less Than 5 Years Old who Died, by Sex, by Urbanity, by Municipality, 2007

57Status Report on the Millennium Development Goals Using CBMS Data Province of Romblon
infant death is San Andres with 1 death out of 225 or a proportion of 0.44 percent. On gender, male proportion of infant death is higher at 2.09 percent compared to the female data of 1.50 percent. On urbanity, rural areas registered a slightly higher proportion of 1.73 percent as compared to the 1.6 registered by the urban areas.
Proportion of Children Aged 1 to Less than 5 Years Old who Died
On the proportion of children aged 1 to less than 5 years old who died, the province registered 70 deaths out of 24,507 popula-tions or a proportion of 0.28 percent. The
Figure 18. Proportion of Infants who Died
Source: CBMS Database 2007
Table 21: Magnitude and Proportion of Infants who Died, by Sex, by Urbanity, by Municipality, 2007

58Status Report on the Millennium Development Goals Using CBMS DataProvince of Romblon
municipality that registered the highest death for this particular age group is Santa Fe with 11 deaths out of 1,603 population or a proportion of 0.68 percent followed by Alcantara with 0.45 and Magdiwang with 0.43 percent. Two municipalit ies registered no deaths aged 1 to less than 5 years old: Concepcion and San Jose. Meanwhile, there is a slightly higher propor-tion registered for male at 0.31 percent compared to the female proportion of 0.26 percent. For urbanity, the proportion for rural area is higher at 0.31 percent while only 0.18 percent in urban area. Again, the proximity of the health facility in the urban area could be the reason for the much lower proportion of deaths in urban areas.
Figure 19. Proportion of Children Aged 1 to Less than 5 Years Old Who Died
Source: CBMS Database 2007
Table 22: Magnitude and Proportion of Children Aged 1 to Less Than 5 Years Old who Died, by Sex, by Urbanity, by Municipality, 2007

59Status Report on the Millennium Development Goals Using CBMS Data Province of Romblon
B. Current Policies and Programs
The provincial officials have prioritized health services as evidenced by the many health related programs and projects being implemented provincewide. Currently, the Provincial Government is implementing the Provincewide Investment Plan for Health (PIPH) with a grant from the European Commission (EC) to finance the much needed Health Reform Program. The LGUs are also aggressively advocating for the enrollment of indigents to the Philippine Health Insurance Corporation (PhilHealth). Under the PIPH, priority programs are the upgrading of health facilities into a Comprehensive Emergency Obstetric and Newborn Care (CEMONC) and Basic Emergency Obstetric and Newborn Care
(BEMONC) facilities. Municipal Health Officers (MHOs) are also advocating for facility-based birthing to avoid unnecessary birth complications that could reduce, if not eliminate, neonatal deaths.
C. Challenges
The provincial government operates 8 hospitals in the province. Because the province is dependent on the IRA, there is a budgetary constraint particularly in the provision of medicines and health personnel. The province has to divide its meager resources in the operation of the 8 hospitals. At the LGU level, the rural health units are having difficulty in providing basic health care because of inadequate health facilities.

60Status Report on the Millennium Development Goals Using CBMS DataProvince of Romblon
The project seeks to revitalize and refur-bish all BHSs into full functional facilities which are able to provide complete basic health services to the community as well as birthing facilities in identified barangays. Key elements of the project are as follows:
1. Establishment of functional BHS that meets the health needs of community mem-bers;
2. Better health outcomes, specially im-proved maternal and child health indices;
3. Health-empowered, educated and self-reliant community;
4. Institution of better, efficient, orga-nized health and referral system within communities.
Cajidiocan Barangay Health Station (BHS) Full Fix Project
The project brings into light the impor-tance and usefulness of integrating a primary health care approach, bringing healthcare as close as possible to the people and ensuring availability, accessibility and affordability of promotive, preventive, curative and reha-bilitative services. Health workers and ba-rangays leaders are now empowered as they are trained and are mainly involved in this endeavor. It promotes maximum community and individual self reliance and participation in the planning, organization, operation and control of health programs in the barangay. Ultimately, it will contribute to the attain-ment of MDG targets of reducing child mor-tality and improving maternal health.

61Status Report on the Millennium Development Goals Using CBMS Data Province of Romblon
61Status Report on the Millennium Development Goals Using CBMS Data Province of Romblon
Target 5.A: Reduce by three quarters, between 1990 and 2015, the maternal mortality ratio
A. Status and Trends
Proportion of Women Deaths Due to Pregnancy-Related Causes
Based on CBMS data, the province recorded a magnitude of 12 women deaths due to pregnancy-related causes in 2007, registering a proportion of 0.23. The reason for the high occurrence of maternal deaths is due to lack of adequate health facility and apparatus, such as life support system and other modern technology that could prevent loss of lives.
The municipality that registered the
highest proportion of women deaths due to pregnancy related causes is Concepcion with a proportion of 1.72 percent while the municipality that registered the highest number of deaths is San Fernando with a magnitude of three deaths. Nine municipali-ties registered no deaths due to pregnancy related causes. On urbanity, there is no pronounced disparity between the rural and urban area when it comes to this indicator.
Target 5.B: Achieve by 2015, universal access to reproductive health
Proportion of Couples Who Use Contraception
On contraceptive prevalence rate, the provincial data for the same period showed a proportion of 32.08. This shows that
Goal 5: Improve Maternal Health

62Status Report on the Millennium Development Goals Using CBMS DataProvince of Romblon
majority of the couples in the province do not practice any family planning method. The provincial data is much lower than the national benchmark of 40 percent prevalence rate in 1993 and 50.7 percent in 2008. The municipality that registered the highest contraceptive prevalence rate in the province is Odiongan with a propor-tion of 46.43 while San Fernando registered the lowest proportion of 19.64 percent. The municipality of Odiongan is a 2nd class municipality with the most number of population as well as the most urbanized municipality in the province. San Fernando on the other hand is relatively parochial with remote barangays.
Figure 20. Proportion of Women Deaths due to Pregnancy-Related Causes
Source: CBMS Database 2007
Table 23: Magnitude and Proportion of Women Deaths due to Pregnancy Related Causes, by Urbanity,
by Municipality, 2007

63Status Report on the Millennium Development Goals Using CBMS Data Province of Romblon
B. Current Policies and Programs
The national government together with the local health functionaries is implement-ing the policy of facility-based birthing to address maternal health concerns. Measures have been undertaken to ensure that all deliveries should be attended by trained health personnel. Efforts to train all “hilots” provincewide were facilitated by the Center for Health Development (CHD) IV-B and the Provincial Health Office (PHO) to reduce maternal deaths as well as neonatal deaths. All hospitals under the provincial government are equipped to handle obstetric emergencies including caesarean operations. With the European
Figure 21. Proportion of Couples who Use Contraception
Source: CBMS Database 2007
Table 24: Magnitude and Proportion of Couples who Use Contraception, by Urbanity,
by Municipality, 2007

64Status Report on the Millennium Development Goals Using CBMS DataProvince of Romblon
Commission (EC) grant under the FOURmu-la One (F1) for Health program, the provin-cial government is currently implementing a provincewide health investment plan designed to upgrade health facilities includ-ing the Rural Health Units (RHUs). Under the program, all hospitals will be upgraded into a standard CEMONC facility and the RHUs into a standard BEMONC facility. Currently, the province has started an initiative on massive training of medical staff as well as non-health personnel to enhance delivery of health services in the province.
Local initiatives to improve maternal health care includes the deputizing of Barangay Health Workers (BHWs) to monitor pregnant women in their areas and make sure that they submit themselves to pre-natal check-ups. The MHOs and midwives schedule area visits to barangays to conduct examinations on a regular basis. Both provincial and municipal local govern-ment units are also pursuing Philhealth accreditation of health facilities so that health services will be more accessible to the poor members of the community. Enroll-ment to the Philhealth Sponsorship Program for indigents are also given attention so that the less fortunate can readily avail of health services/facilities through the Philippine Health Insurance Corporation (PHIC).
C. Challenges
Despite the efforts of both the national and local governments to provide basic maternal health care services, there are still cases of maternal deaths as well as
neonatal deaths. This can be attributed to the inadequacy of modern facilities in the province, particularly diagnostic facilities and life support system for dire conditions. Moreover, the absence of specialized medical practitioners in times of compli-cated situations is another concern as the province cannot afford to employ them. On the side of the populace, there are still pregnant women who refuse to seek prenatal check-up and engage untrained hilots during delivery. There is still a need for massive information dissemination to the community on the risk involved regarding maternal health in order to achieve a 100 percent prenatal/post-partum consultations and facility based deliveries. High-Risk pregnancies, including old age and short birth spacing also pose a challenge.
Although the concept of family planning has been institutionalized in the maternal health care packages and reproductive health services, acceptance of the program continued to be lukewarm. In the province, most people, particularly the members of the marginalized sector, still believe that children are wealth, hence, the more the better, without giving thought on how to feed them and provide them proper health coverage and education. On the other hand, for those people who wanted to avail of certain family planning commodities, shortage of supply are also noted in certain Family Planning Centers because of limited funds of the LGUs to procure these goods. There is also the issue of the church against contraceptives and some elective officials are reluctant to go against the church.

65Status Report on the Millennium Development Goals Using CBMS Data Province of Romblon
With the implementation of the Province-wide Investment Plan for Health (PIPH), there is a massive promotion of innovative practices that may be replicated in the prov-ince. The doctors and health practitioners in the province participated in several “Lakbay Aral” to see the best practices and innova-tive approaches on health related initiatives of other provinces. Some MHOs are trying to duplicate these undertakings in their re-spective areas of responsibilities.
Th e Buntis Baby Bank (BBB) Project aims to achieve better maternal health outcomes by encouraging mothers to avail of complete and quality maternal care thru prenatal check-ups as well as facilitate postnatal visits.
BBB functions by assigning a “baby bank” made of bamboo to all pregnant mothers seeking pre-natal care at the RHU. Every visit to the RHU, the mother is reminded to drop their savings to their bank. Relatives, friends, RHU staff , LGU offi cials or any person willing to drop any amount are encouraged to do so until delivery date. Th e mother is required to deliver either at the RHU or hospital. Home deliveries forfeit the mother’s withdrawal of the savings.
Th e project encouraged more prenatal visits especially from mothers in their 1st trimester. Risk of maternal mortality and neonatal mortal-ity has been decreased through implementation of facility-based deliveries. Th e health fi nancing scheme has assisted the mothers fi nancially to prepare for a safe delivery.
With the success of the project in the mu-nicipalities, other LGUs are also signifying their intent to replicate the BBB scheme. In the mu-nicipality of Cajidiocan, four (4) barangays also adopted the Buntis Baby Bank Project.
Cajidiocan Buntis Baby Bank Project

66Status Report on the Millennium Development Goals Using CBMS DataProvince of Romblon
66Status Report on the Millennium Development Goals Using CBMS DataProvince of Romblon
Goal 6: Combat HIV/ AIDS, Malaria and Other Diseases
Target 6.A: Have halted by 2015 and begun to reverse the spread of HIV/AIDS
A. Status and Trends
Proportion of Couples Using Condom Among Those who are Practicing Contraception
HIV/AIDS cases in the province is basical ly ni l or non-existent as there is no case recorded by the Provincial Heal th Of f ice . Wi th regard to data on the propor t ion of couples us ing condom among those who are practicing contraception, the province recorded a very negl igible proport ion of 1.45 percent or a magnitude of 194 out of a
total 13,379 couples practicing family planning based on CBMS 2007 data. The national statistic is 1.6 percent in 2006. The municipali ty that recorded the highest proportion of couples using condom among those who are practic-ing contraception is Magdiwang with 3 .93 percent whi le the munic ipa l i ty that registered the lowest proportion is Calatrava with 0.20 percent. Couples in the province are basically not worried about being in fected wi th Sexual ly-Transmitted Disesases (STDs) since most of them are faithful to their partners. For urban areas, the proportion of couples using condom among those practicing family planning is visibly higher at a

67Status Report on the Millennium Development Goals Using CBMS Data Province of Romblon
2.17 percent proportion compared to the proportion of 1.29 percent for rural areas.
Target 6.C: Have halted by 2015 and begun to reverse the incidence of malaria and other major diseases
Death rates associated with malaria
Based on the report from the Provincial Health Office, the province has been declared malaria-free for several years already. However, CBMS data recorded a magnitude of 5 deaths—3 males and 2 females—out of the total population of
Source: CBMS Database 2007
Figure 22. Proportion of Couples Using Condom Among Those who are Practicing Contraception
Table 25: Magnitude and Proportion of Couples Using Condom Among Those who are Practicing Contraception, by Urbanity, by Municipality, 2007

68Status Report on the Millennium Development Goals Using CBMS DataProvince of Romblon
252,690 or a proportion of 1.98 percent. The reason for this is that, local folks have no knowledge regard-ing the disease and may have associated chills and high fever with malaria and responded to the survey with such belief. According to the MHOs, since it is not an ordinary illness but rather a technical term and needs thorough medical examina-tions, caution should be exercised in asking them survey questions. Death certificates that state the cause of death need to be presented to avoid misunderstanding.
Death Rates Associated with Tuberculosis Figure 23. Death rates associated with Malaria
to the attitude of the people of ignoring the symptoms and not seeking early treatment. Santa Maria had the highest proportion with 8 out of 7,163, or a staggering proportion of 111.56 percent followed by Alcantara with 12 deaths out of 12,330 (97.23%). Only San Andres did not register any deaths associated with tuberculosis.
On this particular indicator, data shows that there are more male deaths associated with the disease at a proportion of 61.83 percent, almost double the proportion of 31.19 percent registered by female deaths. This is probably due to the fact that more males drink alcohol and take cigarettes than females, and cause to aggravate the illness, resulting to more cases and eventually may lead to mortality. The current status shows that there is a consid-erable magnitude of people infected with tuberculosis as the proportion of deaths implied. But the LGUs/RHUs need to verify these findings so as to properly document
On prevalence and death rates associat-ed with tuberculosis, the province registered a total magnitude of 118 deaths—79 males and 39 females—out of the 252,690 popula-tion or a very high proportion of 46.68 percent. The high proportion of deaths associated with tuberculosis is attributed
Source: CBMS Database 2007
Table 26. Magnitude and Proportion of Deaths Associated with Malaria, by Sex, by Municipality

69Status Report on the Millennium Development Goals Using CBMS Data Province of Romblon
the cases—from containing the disease to curing those infected—and considerably lower the prevalence and death associated with tuberculosis by 2015. For urbanity, the proportion for rural areas is much higher at 48.00 percent compared to the urban proportion of only 40.10 percent. This could be due to the fact that cases in the urban areas are easily monitored than in the rural areas.
B. Current Policies and Programs
The national government has a long term policy on treatment and cure of communicable diseases including malaria, tuberculosis and dengue. The Center for Health Development provides medicines
Figure 24. Death rates associated with tuberculosis
Source: CBMS Database 2007
Table 27: Magnitude and Proportion of Deaths Associated with Tuberculosis, by Sex, by Urbanity, by Municipality, 2007

70Status Report on the Millennium Development Goals Using CBMS DataProvince of Romblon
and logistics support to local governments to combat these diseases. The LGUs on the other hand implement these programs and try to contain cases and provide curative treatment. The RHUs conduct sputum and/or x-ray tests and provide treatment to those with positive results.
C. Challenges
Although tuberculosis is now a curable disease, it is sad to note that there are still plenty of cases of death associated with the disease. One major hindrance in fully implementing the tuberculosis control program is the attitude of the people themselves, particularly those in remote barangays, of ignoring the symptoms associated with tuberculosis. Unless the patient actually coughs blood, most people showing symptoms of the disease do not seek consultation and just go on with their daily lives, as if everything is fine. Hence, if the disease is already at its worst stage with complications, even if they seek treatment at
this stage, it is already too late. At this point, sometimes death is inevitable because the body’s resistance is already gone. The “bahala na” (come what may) attitude that consigns their fate to God sometime hinders the immediate provision of treatment that can prevent loss of life. This is one of the tough challenges for the LGUs and the province to surmount, and to effectively provide the necessary intervention to those in need of medical attention.
Another challenge relative to the issue is how to encourage the people to submit themselves for sputum test. People in remote areas tend to be unaware of the varied health services provided by the government. Likewise, poverty also played a major role in their choice of not availing the services as they really have to spend money for transportation expenses and minimal amount for the sputum test. These reasons discourage the really poor people to seek medical intervention even if they suspect that they are ill.
With the implementation of the PIPH, there is a massive information campaign on improv-ing health statistics through LGU scorecards that shows each municipality’s past and current standing on program implementation. Th is en-courages those that do not fare well to improve their standing by closely scrutinizing the causes and reasons for such lower accomplishments and exploring ways to improve them. RHUs are also encouraged to seek accreditation to be a Tuber-culosis Directly Observed Treatment Scheme (TB DOTS) center to better provide rehabilita-tive intervention to patients with tuberculosis.
LGU Health Scorecard

71Status Report on the Millennium Development Goals Using CBMS Data Province of Romblon
71Status Report on the Millennium Development Goals Using CBMS Data Province of Romblon
Target 7.C: Halve by 2015, the proportion of people without sustainable access to safe drinking water and basic sanitation
A. Status and Trends
Proportion of Population With Access to Safe Drinking water
CBMS database 2007 reveals that the magnitude of population with access to safe drinking water in the province is 192,647 (76.28%). For urbanity, accessibility to safe drinking water is better at the urban areas (89.07%) compared to the 73.37 percent recorded for the rural areas. Available data at the national level is 80.2 percent in 2004.
The municipality that registered the highest proportion is Alcantara with a proportion of 92.19 percent. On the other hand, Banton registered the lowest proportion with only 46.63 percent, showing that more than half of its population has no access to safe drinking water, followed by Cajidiocan with a proportion of 53.41 percent, or a population magnitude of 2,379 and 10,591 respectively. The scarcity of water in the island municipality of Banton is a perennial problem while Cajidiocan has some water sources but needs massive logistics support to tap them for household consumption. With careful allocation of resources to finance water development initiatives, the province has a big chance in attaining the national target of 86.5 percent come 2015.
Goal 7: Ensure Environmental Sustainability

72Status Report on the Millennium Development Goals Using CBMS DataProvince of Romblon
Proportion of Population With Access to Sanitary Toilet Facility
On access to sanitary toilet facility, the provincial data revealed that there are 180,268 magnitude of population with access to sanitary toilet facility representing a proportion of 71.38 percent. Available national data for 2004 is 86.2 percent. Like in water access, the data for the proportion of population with access to sanitary toilet facility is more than 10 percent higher in the urban areas with a proportion of 81.47 percent compared to the 70.03 percent proportion for the rural areas. The munici-pality that posted that highest proportion
Source: CBMS Database 2007
Figure 25. Proportion of Population with Access to Safe Drinking Water
Table 28: Magnitude and Proportion of Households and Population With Access to Safe Drinking Water, by Sex, by Urbanity, by Municipality, 2007

73Status Report on the Millennium Development Goals Using CBMS Data Province of Romblon
is Concepcion with 89.36 percent followed by Banton with 80.60 percent. Lowest propor t ion was posted by San Jose with 58.02 percent and Corcuera with 58.36 percent. With massive information campaign on the importance of having sanitary toilet facil i ty to avoid diseases, there is a possibility that we can improve on this indicator to contribute to the national target of 83.8 percent come 2015.
Source: CBMS Database 2007
Figure 26. Proportion of Population With Access to Sanitary Toilet Facility
Table 29: Magnitude and Proportion of Households and Population With Access to Sanitary Toilet Facility, by Sex, by Urbanity, by Municipality, 2007

74Status Report on the Millennium Development Goals Using CBMS DataProvince of Romblon
Target 7.D: By 2020, to have achieved a significant improvement in the lives of at least 100 million slum dwellers
Proportion of Population Who are Informal Settlers
Categorically, there are no slum dwellers in the province. What it has instead are informal settlers. The CBMS definition of informal settlers are those living in houses without permission from the land owner. Based on the data, there are 2,854 Romblomanons (1.13%) in 601 households considered as informal settlers. There is a discernable difference in urbanity with the proportion in urban areas slightly higher at 1.48 percent compared to the 0.97 percent proportion for rural areas.
Figure 27. Proportion of Population who are Informal Settlers
Source: CBMS Database 2007
Table 30: Magnitude and Proportion of Households and Population Who Are Informal Settlers, by Sex, by Urbanity, by Municipality, 2007

75Status Report on the Millennium Development Goals Using CBMS Data Province of Romblon
Magdiwang registered the highest propor-tion of informal settlers with 6.39 percent, followed by Santa Fe with a proportion of 2.38 percent. Majority of the informal settlers in Magdiwang can be found along the wharf and surrounding the coastal areas. The local chief executive (LCE) of Magdiwang has already provided intervention of relocating some of these families in a housing resettle-ment area. Corcuera is the only municipality with no informal settlers.
Proportion of Population who are Living in Makeshift housing
Makeshift housing refers to those houses built from scrap or salvage materials. On
Figure 28. Proportion of Population who are Living in Makeshift Housing
Source: CBMS Database 2007
Table 31: Magnitude and Proportion of Households and Population Lliving in Makeshift Housing, by Sex, by Urbanity, by Municipality, 2007

76Status Report on the Millennium Development Goals Using CBMS DataProvince of Romblon
this particular indicator, there are 5,344 members (2.12%) in 1,173 households living in makeshift housing. Concepcion registered the highest proportion with households living in makeshift housing with 4.66 percent. Concepcion is an island municipality and farthest from the provincial capital. Most of these people are marginal farmers and fishermen with no alternative or additional sources of income, hence, cannot really afford to buy durable materials for their houses. The lowest proportion in this indicator was recorded at Banton with a meager proportion of 0.37 percent. The reason for this is that there are a lot of members living abroad who send remittances to
Figure 29. Proportion of Population Living in Inadequate Housing Conditions
Source: CBMS Database 2007

77Status Report on the Millennium Development Goals Using CBMS Data Province of Romblon
their relatives in the province as well as the many professionals in the municipality, particularly teachers.
Proportion of Population Living in Inadequate Housing Conditions
People l iv ing in inadequate l iv ing conditions are in one or more of the following conditions: without access to safe drinking water, without access to sanitary toilet facility, living in makeshift housing and without security of tenure. The 2007 CBMS data revealed that 108,901 of the Romblomanons (43.12%) are having inadequate living conditions of which more of them are found in rural areas (46.18%) as against the 26.45 percent in the urban areas. Due to the problem of water access in Banton, the municipality likewise registered the highest proportion of population living in inadequate situation (58.96%), followed by Corcuera with 56.94 percent and Cajidiocan with 55.57 percent. The three municipalities showed that more than half of their population is living in inadequate living condition. However, if accessibility to water and sanitation is addressed, this indicator would greatly improve. The municipality that registered the lowest proportion in this indicator is Alcantara with 25.01 percent.
B. Current Policies and Programs
The local governments in the province have always prioritized programs and projects that would have a direct impact on the three targets under environmental sustainability as can be gleaned in the projects implemented under the Annual Development Plan.
To reverse the loss of environmental resourc-es, the provincial government implemented several programs, such as the Romblon Integrated Coastal and Marine Resources Management for Sustainable Development (RICMRM). Under the program, each local government unit is encouraged to provide for a marine sanctuary and rehabilitate the mangroves to sustain marine life. Likewise, LGUs are encouraged to implement a Solid Waste Management Program to make sure that waste are properly disposed and does not pose a threat to the community and the environment. In addition, the province continuously support the Community Forest Resource Management Program and discour-aged the “kaingin system” (slash and burn) way of farming to preserve the water resources and watershed areas.
On water accessibility, the local govern-ments have been pursuing spring develop-ment initiatives, including provision of artesian wells to provide water access to most of the households. Every year, the province allocates a certain amount under the 20 percent ADF for water supply facili-ties and monitors the Rural Water Supply Sanitation Sector Project (RW3SP) program of the national government to rehabilitate the facilities. On the other hand, sanitary toilet facilities are periodically assessed by local sanitary inspectors and are being monitored by the Provincial Health Office.
All these programs/projects/activities are being undertaken by the local govern-ments to make sure that their constituents are well provided with the basic services that would improve the general welfare of the people and relieve the impoverishment experienced by the marginalized sector of the community.

78Status Report on the Millennium Development Goals Using CBMS DataProvince of Romblon
C. Challenges
Inadequate financial resources is the major hindrance in providing the basic services for the people and improving their situation. The local government can only prioritize certain programs but cannot implement all the necessary interventions to make l i fe easier for everybody. In the case of island municipalities, water scarcity is almost a year-round problem, particularly for those households whose main water source is rain collector. The
The municipality of Odiongan heeded the call to give priority to the environment by implementing a waste segregation scheme as early as the late 1990s. Biodegradable and non-biodegradable waste were col-lected separately on specifi c sched-ules then brought to a controlled dumpsite. Later, the LGU was able to establish a sanitary land fi ll, an organic fertilizer plant and several materials recovery facilities. To date, Odiongan is the only municipality in the province with a Solid Waste Management Plan.
local governments cannot af ford to embark into massive infrastructure for sustainable water facility and this remains to be the major concerns of the people in this areas. With water problem comes the sanitation concern for toilet facili-ties. In the absence of water, the local government cannot implement an effective campaign for sanitary toilet facilities, as they go hand-in-hand. For municipalities with water problem, these two indicators are the challenges that need to be given solution.
Th e Sangguniang Bayan of Odi-ongan passed several ordinances to wit:
• SB Resolution No. 2009-13 and Ordinance No. 2009-5 – or-dinance prohibiting plastic bags on dry goods and regulating its utilization on wet goods and pro-hibiting the use of styrofoam in the municipality and prescribing penalties thereof.
• SB Resolution No. 2009-24 – ordinance creating the Municipal Waste Management Board
Contributed by: Rosebi Agaloos, MPDC, LGU-Odiongan
Waste Segregation Management

79Status Report on the Millennium Development Goals Using CBMS Data Province of Romblon
79Status Report on the Millennium Development Goals Using CBMS Data Province of Romblon
Goal 8: Develop a Global Partnership for Development
Target 8.a: In cooperation with pharmaceutical companies, provide access to affordable essential drugs in developing countries
A. Status and Trends
Prov id ing access ib i l i t y to a f fo rd-able essent ial drugs in the province is a priority program of the provincial government. The Sangguniang Panlala-
wigan of Romblon passed Resolution No. 02-2009-12 embodying Provincial Ordinance No. 2 series of 2009, institu-t ionaliz ing the “Botika ng Lalawigan ng Romblon” (BLR) to make sure that a f fo rdab le es sen t ia l d rugs can be readily accessed by the poor. In the LGUs, the establishment of the “Botika ng Barangay” (BNB) is gaining ground and is now a very visible presence in remote and far-flung areas.

80Status Report on the Millennium Development Goals Using CBMS DataProvince of Romblon
8000800
„Staying Alive with BNB and Running Over‰
People in the municipality of San Agustin used to depend on the available medicines that could be provided for free by the Ru-ral Health Unit and the adjacent Tablas Island District Hospital. It has always been a big problem,
especially for poor families, where to get pre-scription medicines when it is not available at the health facilities, or whom to approach for fi nancial support.
To solve this dilemma, LGU-San Agustin initiated the establishment of “Botika ng Ba-rangay” (BNB) through the DOH-CHD IV-B in 2005. It was piloted in one of the remote barangays and because of its success it grew to a total of eight BNB outlets at present. Th e presence of these BNB Outlets has ultimately increased the access of the poor people liv-ing in the barrios to commonly bought over-the-counter generic medicine and selected prescription drugs, particularly antibiotics at much aff ordable prices. Th e project also pro-motes community involvement in safekeeping, utilization and fi nancing of medicines, giving them sense of ownership, thus, making them more responsive and responsible individuals accountable to its sustainability and to the health needs of the community. Th e result, is that it eliminates unnecessary morbidities and mortalities resulting from inability to buy or acquire common medicines. Along with inten-sifi ed preventive measures, continued health advocacies, appropriate lifestyle modifi cations, and much stronger support for health initiatives by the LGU as well as cooperation of NGOs and other worthy organizations, the BNBs will surely be instrumental in improving the health-seeking behavior of the poor people and would pave the way for healthier communities.
Contributed by: Dr. Deogracias S. Muleta, MHO, LGU-San Agustin
Target 8.F: In cooperation with the private sector, make available the benefit of new technologies, especially information and communication
Proportion of the Households with Landlines/Telephone lines
With regard to access to the outside world, the province has communication facilities, though only a small percentage of the population actually utilize them. Based on CBMS data, the households with landline/telephone lines in the province is a meager 1,069 households or a propor-tion of only 1.21 percent. Understandably, majority of these households can be found in the urban areas. Odiongan posted the highest proportion of households with landlines/telephone lines (4.47%), followed by Romblon with 2.81 percent. These two LGUs are considered the growth centers for economic development in the province. The municipality that posted the lowest proportion is Ferrol with 0.37 percent. Understandably, urban areas posted a higher proportion of 4.27 percent as against the 1.35 percent proportion for the rural areas.
Proportion of the Households with Cellphones
Data reveals that there are 15,241 households with cellphones or a propor-tion of 26.96 percent. Again, majority of these households are in the urban areas with 39.82 percent compared to the 24.02 percent in the rural areas. Looc registered the highest proportion of households with cell phones at 34.18 percent, followed by Odiongan with 33.49 percent. The low percentage of rural households with cellphones was due to difficulty in
T

81Status Report on the Millennium Development Goals Using CBMS Data Province of Romblon
accessing network signals. Corcuera has the least number of household with cellphones (16.44%).
Proportion of the Households with Computers
There are 2,169 households (3.84%) with computers. Again, majority of these households are in urban areas with a (7.28%) as compared to the 3.05 percent in the rural areas. Likewise, Odiongan registered the highest proportion of households with computer (6.28%), followed by Alcantara with 5.44 percent. San Jose registered the lowest proportion of households with computer at 1.38 percent, then Ferrol with 1.48 percent. San Jose does not enjoy a 24-hour electricity which could account
Figure 30. Proportion of Households with Landlines/Telephone Lines
Source: CBMS Database 2007
Table 33: Magnitude and Proportion of Households with Landlines/Telephone Lines, by Urbanity, by Municipality, 2007

82Status Report on the Millennium Development Goals Using CBMS DataProvince of Romblon
for the low proportion of households with computers.
On this part icular MDG goal, the province, with its numerous limiting factors, cannot meaningfully contribute to the country’s target of developing a global partner for development. Nonetheless, the Local Development Councils (LDC) are doing their best to utilize the meager resources available to pursue develop-ment projects toward poverty alleviation as well as enhance the economic and social condition of the people that could lay the groundwork for a more empowered citizenry.
Figure 31. Proportion of Households with Cellphones
Table 34: Magnitude and Proportion of Households with Cellphones, by Urbanity, by Municipality, 2007

83Status Report on the Millennium Development Goals Using CBMS Data Province of Romblon
B. Current Policies and Programs
The Local Government Code serves as anchor points for the Provincial Govern-ment of Romblon’s development policies and programs toward building self-reliant communities and to further our contribution to the attainment of national goals. Out of the Internal Revenue Allotment (IRA), at least 20 percent is earmarked for development plans, programs and activities. The Local Development Councils (LDCs) prioritized the different development initiatives to be undertaken by the LGUs and most of these are geared towards the improvement of the well being of the Romblomanons. Improve-
Figure 32. Proportion of Households with Computers
Source: CBMS Database 2007
Table 35: Magnitude and Proportion of Households with Computers, by Urbanity, by Municipality, 2007

84Status Report on the Millennium Development Goals Using CBMS DataProvince of Romblon
ment of access to communication facilities and provision of affordable essential drugs are among the programs financed under the Annual Development Plan of the province.
C. Challenges
Romblon province is archipelagic in nature comprising more than 20 major islands and islets scattered at the center of the Philippines. Narrow strips of coastal lowlands, low hills and plains typify the topography of most of the islands. The geographic situation of the province is basically the major challenge in terms of accessibility. Although communication facilities are available, some areas are experiencing internet-access difficulties and low cellphone signals due to dead spots. Even after installation of telecom-
munication relay stations, still, those areas blocked by mountain ranges experience diff iculty in accessing better network signal. The current communication servic-es are not stable and do not allow full accessibility for information exchange with only a few being capable to maximize access to the wide range of information available in the world wide web.
Another major challenge for the province is transportation accessibility. Though it has ports and motorboats, it is very expensive to transport goods from island to island. Bridging the islands together to fully allow maximum movement within the province for easier and cheaper accessibility of products, resources and even job opportu-nities is one of the toughest challenges of the province.

85Status Report on the Millennium Development Goals Using CBMS Data Province of Romblon
Part 3. Meeting the 2015 Challenge
Achieving the MDG challenge is quite a task that necessitates the convergence of national and local agencies, including active participation of the NGOs operating in the area as well as cooperation of the community. The inadequacy of logistics, particularly funding support to spur massive economic growth will hamper some of our efforts; nonetheless, with the concerted efforts of all stakeholders and with proper prioritization of our meager resources, the province hopes to ultimately make an inroad in achieving the MDG targets and alleviating the poverty situation province-wide.
1. Priority Programs and Policy Responses
Given the socioeconomic condition of the province, including its very unique physical characteristics, the first priority of all LCEs is to promote economic development while attempting to expand delivery of basic services. The latter could not be relegated to the background as it is the primary duty of every LGU. The more rampant poverty is, the bigger the need and necessity for the provision of these services, particularly on
health and sanitation, food and nutrition, shelter, education, even financial assistance for those in crises situation in the form of Aid in Crisis Situation (AICS). Provision of basics services drains much of the coffers of any poor LGU and the dilemma of each LCE is how to go about improving the socioeconomic condition of the poverty stricken constituents given the scarce financial resources. The challenge lies in the proper management and utilization of our vast natural resources, particularly our fishing grounds rich in marine products, as well as our marble reserves.
A. Poverty Alleviation and Hunger Mitigation
Economic development is the key in eradicating poverty and mitigating hunger. To provide a better climate for the establish-ment of small scale industries, provision of incentives such as tax breaks for the first year of operation could encourage new players. To feed this new industry, it is imperative to maximize agricultural production by utilizing all spare lands. Taxes on idle lands could be levied so that owners would be encouraged to make it productive. Modern agricultural inputs and innovative technologies suited to

86Status Report on the Millennium Development Goals Using CBMS DataProvince of Romblon
our land should be employed to maximize production. Marginalized farmers and fishermen should be given social prepara-tion to form People’s Organizations (POs) or cooperatives for them to be able to rise from economic bondage. Intensify livestock and poultry production so that the province will no longer import dressed chickens and eggs from our neighboring provinces. The coconut industry must be given attention; improved varieties should be introduced to boost copra production that could be a smallscale industry for oil or soap. Likewise, the marble industry could need assessment for new product development and improved market linkages. Tourism is also a potential industry to look into.
B. Universal Primary and Secondary Education
With the implementation of the Local Government Code, the LGUs were empowered to address issues and concerns regarding education through the Local School Boards (LSB) with finances coming from the Special Education Fund (SEF). The national government likewise provides logistics support for the policy “education for all”. Though elementary and high school education is free, the problem of low participation rate remains. This is the challenge that needs immediate attention. Expanding pre-elementary education services of DepEd would help students in terms of readiness in transition to elemen-tary. Strengthening the ECCD and daycare services and require all 3-5 year old-children to attend will help instill the habit of going to school everyday. This could reduce dropouts in elementary education. For those who really cannot go to school for reasons, the DepEd provision of ALS
should be intensified including provision of additional SPED classes for those children with special needs. Likewise, the “Tuloy Aral Walang Sagabal” (TAWAG) program of the DSWD should be expanded to cover all municipalities. Improvement of school facilities including provision of books and instructional materials will also inspire children to study. Local School Boards should look deeper into the issue of low participation in both elementary and high school, including the case of more boys not going to school. Reasons for dropouts must be evaluated for proper strategies and solutions to be implemented.
C.Gender Equality and Women Empowerment
There is no gender disparity in access to primary and secondary educational system in the province. However, there is a pronounced trend of lower proportion of males going to schools, particularly in secondary and tertiary education. To address this concern, a study must be made as to the real reasons why, so that adequate policies and interventions could be put in place. For women empowerment, provision of livelihood skills training with gender advocacy could increase their self-esteem in order to be productive members of the community. The establish-ment of a One-Stop-Shop for victims of abuse and the Women’s Desk wil l encourage more women to report cases of atrocities. Information and dissemina-tion of the VAWC law will help decrease marital abuses including maltreatment of children. To encourage more women to seek elected position and serve their communities, women success stories in the area of governance could facilitate realizations that they could also make a

87Status Report on the Millennium Development Goals Using CBMS Data Province of Romblon
difference and contribute to the well-being of the community.
D.Health Reform Program
The implementation of the PIPH under the FOURmula One for Health program has provided a wide array of health-related programs and intervention geared toward the achievement of improving health indices. To effect the immediate realization of the program, there is a need to expedite the implementation of all program components as well as replicate good practices. To sustain the program, there is a need to strengthen the Inter Local Health Zones (ILHZ), particularly the referral system. Involvement and active participation of all stakeholders, particularly the MHOs can make a lot of difference, particularly in service delivery and implementation of innovative program interventions. Most importantly, the LCEs, being the head of the LGU must be in the forefront of this programfor the necessary logistics and leadership to make the health reform program effective and successful. In addition, implementation of the Responsible Parenting Movement (RPM) through parents’ association could generally encourage couples to practice birth spacing using any given method acceptable to them. Likewise, the Adolescent Health and Youth Development programs would also address the issues of teenage pregnancies, drug addiction, alcoholism and other juvenile related problems to make the health reform program into a holistic approach.
E. Environmental Sustainability and Improv-ing the Lives of Slum Dwellers
The problem of dwindling natural resources in most cases is irreversible, particularly
coastal and marine ecosystem. Strict implementation of environmental laws must be adhered to stop the degradation and start reversing the process. Approval of the Sangguniang Panlalawigan on the proposed Environmental Code of the province is a priority to guide us in our quest of revers-ing the loss of environmental resources. Expansion and establishment of fi sh sanctuar-ies, rehabilitation of mangroves and regular coastal cleanup can improve our marine resources. Reforestation of all forest lands, including Mt. Guiting-guiting Natural Park and support the ISF and CBFM programs to hasten the recovery of our forest cover. Immediate attention must be made to rehabil-itate our watershed areas to improve current water sources. Strengthen the implementa-tion of the ICMRM to cover all areas so that all economic activities could be monitored. Proper mobilization of “Bantay Dagat” agents is needed to apprehend encroaching fi shing vessels in municipal waters. The strict implementation of laws especially obligations to comply to fi nes will discourage violators. For the informal/illegal settlers, establishment of housing projects for their relocation includ-ing provision of livelihood opportunities will dramatically improve their socioeconomic condition. For waterless families, improve-ment of water system facility and provision of toilet bowls for those without sanitary latrines would ensure their health.
F. Development for Global Partnership
With the upgrading of the Romblon State College into a university, the challenge to provide a globally competitive education is within our reach. Provision of career options particularly for our younger generation could bring in development because of a highly educated labor force. Priority is

88Status Report on the Millennium Development Goals Using CBMS DataProvince of Romblon
the establishment of a Research Facility that could do research studies in any field, in particular, on the endemic species and bio-diversity found in Sibuyan Island, and high value agricultural products suited to the Romblon’s unique land characteristics. Likewise, improvement of internet access including relay stations for cell signal to increase intercommunication within and even outside the country is a must. Encour-age all High School Principals province-wide to include computer literacy in their academic curriculum for the students to be
ready for college life and for their chosen field in the future. All these would lead into a development that is globally competitive.
2. Financing the MDGs
To achieve the MDG targets, a myriad of interventions has to be institutionalized and implemented to engender the desired results. Below are the proposed programs/projects/activities geared toward achieving the MDG targets as well as improving the socioeco-nomic conditions of the Romblomanons.

89Status Report on the Millennium Development Goals Using CBMS Data Province of Romblon
(Continued)

90Status Report on the Millennium Development Goals Using CBMS DataProvince of Romblon
3. Monitoring the MDGs
The implementation of the CBMS in the province of Romblon had been a laudable effort of the provincial government and its 17 municipalities. The availability of grassroot data at each geopolitical level—barangay, municipal and provincial—has greatly enhanced analysis of the current situation, providing insights as to the reasons and underlying causes of the condition. The Memorandum of Agreement (MOA) between the provincial government, PEP-CBMS Network Coordinating Team and the other provinces in the MIMAROPA Region indicated the underlying commit-ment of the signatories for the updating of the CBMS database preferably every three (3) years.
The inclusion of the province in the preparat ion o f the Prov inc ia l MDG Report and with the technical assistance provided including the provision of the
l icense software Stata, the provincial CBMS-MDG Teams has been capacitated to prepare this report and in the future can generate similar documents. The province will update the CBMS database this year (2010) and hope to complete the CBMS cycle in the 2nd quarter of 2011. After the second round of the CBMS implementa-tion, the province wil l spearhead the preparation of the provincial MDG Report in 2011 and finally in 2015 to determine the impact of the programs/projects/activities implemented in response to the MDG challenge.
For the yearly monitoring of the MDGs, the province wil l have to rely on the administrative data generated by the differ-ent provincial offices and other agencies to gauge the progress of the indicators being monitored. This data will provide us with information on a yearly basis the status and trends, particularly the education and health component of the MDGs.
(Continued)

91Status Report on the Millennium Development Goals Using CBMS Data Province of Romblon
91Status Report on the Millennium Development Goals Using CBMS Data PProvviincee of Romblloonn
A. Preparation of Provincial Millennium Development Goals (MDGs) Report Using CBMS Data
1. Background and Justification
The availability of good statistics and the capacity of governments, donors and
international organizations to systematically measure, monitor and report on
progress in all social and economic spheres are at the heart of development
policy and the achievement of the MDGs.
The Millennium Development Goals Report 2007
While progress toward the attainment of the Millennium Development Goals (MDGs) is systematically being measured, monitored and reported at the national level, clearly, there must be a parallel effort at the local level to bring the MDGs into the mainstream of the local development agenda.
This is especial ly cal led for under decentralized regimes where local govern-ment units (LGUs) are at the forefront of policy or program execution. Unfortunately, however, national statistical systems have yet to respond adequately to the demand for micro-level statist ics that can aid
EXPLANATORY TEXT
LGUs in their poverty alleviation efforts, as noted in a joint World Bank and Asian Development Bank report, to wit: “the most comprehensive and consistent comparative subnational data (are) is at the regional level although this is simply an administra-tive level of government that has no respon-sibilities for delivery of social services. More data (are) is gradually becoming available at the provincial level, but not at lower levels which are at the frontline of efforts to reduce poverty1.”
In response, the Philippine Government has embarked on an initiative to localize the MDGs using the Community-Based Monitoring System (CBMS). In 2005, the National Statistical Coordination Board (NSCB) issued Resolution No. 6 “recogniz-ing and enjoining support to the CBMS as a tool for strengthening the statistical system at the local level that will generate statistics for monitoring and evaluation of development plans, including the progress of the local governments in attaining the Millennium Development Goals.”
Meanwhile, several approaches are being carried out by the Department of
1 Decentralization in the Philippines: Strengthening Local Government Financing and Resource Management in the Short-Term, 2005 (A Joint Document of the World Bank and
the Asian Development Bank)

92Status Report on the Millennium Development Goals Using CBMS DataProvince of Romblon
the Interior and Local Government (DILG) in capacitating LGUs to contribute to the attainment of the MDGs and uplifting the quality of life of their constituents. These interventions are particularly stated in DILG Memorandum Circular (MC) No. 2004-152 “Guide to Local Government Units in the Localization of the MDGs” dated November 2004, which provides for the: (a) menu of Programs, Projects and Activities (PPAs) per MDG goal and target to guide LGUs in responding to the MDGs; (b) diagnosis of the local situation using existing local indicators and monitoring system; and (c) call for documentation and replication of good practices.
The CBMS that is being implemented in the Philippines is indeed well-positioned to track progress toward the attain-ment of the MDGs at the local level. For one, a number of indicators being monitored in the CBMS are included in the ind icators for moni tor ing the p rogress i n ach iev ing the MDGs. Moreover , CBMS is in tended to be d o n e o n a r e g u l a r b a s i s a n d c a n therefore be used for updating MDG indicators and facil i tating preparation of regular MDG reports . The CBMS can also be used as basis by national and local governments for costing and ident i fy ing appropriate intervent ions needed to achieve the MDGs as well as for resource allocation. Finally, given the large spatial disparit ies, the CBMS can help identify where focus has to be given to achieve the targets.
The CBMS’ role in localizing the MDGs was recognized during an Experts Group Meeting on Localizing the MDGs held on November 28, 2006 at the United Nations Economic and Social Commission for Asia and the Pacific (UN ESCAP) in Bangkok, Thai land. The Committee on Poverty Reduction composed of 24 nation-states agreed that the CBMS could complement the official data collection activities of national statistical offices and improve the availability of the MDG and other indica-tors at the local level. It also agreed that localizing the MDGs through CBMS would help integrate the goals into the national development strategies. It therefore urged other developing countries to initiate and implement similar innovative systems that would help localize the MDGs.
As of May 12, 2010, CBMS is being implemented in 59 provinces (32 of which are province-wide), 687 municipalities and 43 cities in the Philippines, covering 17,848 barangays all over the country (see Figure 33). A good number of these LGUs have already consolidated their CBMS databas-es and are well-positioned to generate their own local MDG Reports. For one thing, CBMS collects information that reflects the multi-faceted nature of poverty. In addition, data generated by the CBMS can be broken down by municipal, barangay, purok and even down to the household level, thereby presenting meaningful informa-tion and enabling deeper analysis of the poverty situation. Moreover, the CBMS can generate color-coded maps showing the poverty status at each geopolitical level.

93Status Report on the Millennium Development Goals Using CBMS Data Province of Romblon
Figure 33. CBMS Coverage in the Philippines (as of May 12, 2010)
2. Objectives
This technical collaboration aims to capaci-tate nine provincial governments to systemati-cally measure, monitor and report their status with respect to the MDGs. The operative word here is status since the provinces used their fi rst round of CBMS data in formulating this report. These provinces include Agusan del Norte, Agusan del Sur, Biliran, Camarines Norte, Eastern Samar, Marinduque, Romblon, Saran-gani and Siquijor. The abovementioned prov-inces were selected since they were among the fi rst LGUs that were able to consolidate their CBMS databases at the provincial level. The CBMS Census was conducted in these prov-
inces between 2005 and 2007 (for detailed information on census years, see Table 38).
In particular, the technical collaboration was carried out to meet the following objectives:
(i) to track the status on the attainment of the MDGs in the identifi ed provinces; (ii) to assist these provinces in preparing their Pro-vincial MDG Reports; and (iii) to increase local awareness on how these reports can bridge local and national development strategies.
3. Expected Outputs
The technical collaboration is expected to produce the following outputs: (i) mentored
94Status Report on the Millennium Development Goals Using CBMS DataProvince of Romblon
technical staff of the nine CBMS-partner provinces on how to prepare Provincial MDG Reports, and (ii) Provincial MDG Reports of the nine provinces.
4. Capacity-Building
The capacity-building of the Provincial MDG Teams consists of three workshops and one-on-one mentoring process.
Workshop on Processing of CBMS Data to Generate MDG Indicators. This 2-day activity was designed to provide participants with: (i) a deeper appreciation of the importance of the CBMS in benchmarking/tracking local progress toward the attainment of the MDGs; (ii) a satisfactory level of knowledge in pro-cessing CBMS data to facilitate analyses of accomplishments versus targets; (iii) some basic skills on how to incorporate MDG tar-gets in local development plans and facilitate corresponding increase in budget allocation for MDG-responsive PPAs; and (iv) tools and methodologies in formulating MDG reports.
Preparation of Provincial MDG Reports Using CBMS Data. This 2-day activity was designed to build on the gains of the fi rst workshop by providing technical assistance to the Project Teams in (i) processing CBMS data to generate the additional MDG indicators and consolidating their data at the provincial level, (ii) benchmarking/tracking their prog-ress toward the attainment of the MDGs , (iii) reviewing partial provincial reports based on the indicators generated using the fi rst work-shop , and (iv) fi nalizing list of indicators to be included in the report.
Presentation and Critiquing of Provin-cial MDG Reports. This 3-day activity was designed to fi nalize the Provincial MDG Reports and at the same time provide an opportunity for an exchange of views and possible harmonization of approaches as well as for the provision of consistent guid-ance to all the Provincial MDG Teams. The expected output from this workshop was the complete manuscript of the MDG Report which already incorporates the comments/inputs of the assigned mentor and resource persons who were invited to share their ex-pertise during the workshop.
Mentor/Mentee Relationship. In order to ensure a sustained and focused mentoring program, a mentor from the Research Team of the CBMS Network was matched to one Provincial MDG Team.
The assigned mentor was expected to set a specifi c time each week to interact with his/her Provincial MDG Team and discuss the following: (1) review progress in drafting the Provincial MDG Report, (2) set/identify targets for the coming weeks, and (3) draw up an ac-tion plan to achieve those targets. In addition, the mentor was expected to assist his/her as-signed MDG Team in identifying and solving problem areas.
Meanwhile, Dr. Celia M. Reyes, Anne Ber-nadette E. Mandap and Marsmath A. Baris, Jr. reviewed all partial and fi nal reports. The technical staff of the NEDA Social Develop-ment Staff headed by Director Erlinda Ca-pones also reviewed and provided valuable comments on the reports.

95Status Report on the Millennium Development Goals Using CBMS Data Province of Romblon
B. CBMS-MDG Indicators
Unless otherwise indicated, all the statisti-cal tables, graphs, charts and poverty maps presented in this report were generated using the CBMS methodology.
The CBMS is an organized way of col-lecting data at the local level to be used by local governments, national government agencies, nongovernment organizations (NGOs) and civil society for planning, budgeting, and implementing local devel-opment programs as well as for monitor-ing and evaluating their performance. It is a tool for improved local governance and democratic decision-making that promotes greater transparency and accountability in resource allocation.
It involves the following steps:Step 1 – Advocacy/organizationStep 2 – Data collection and fi eld editingStep 3 – Data encoding and map digitizationStep 4 – Data consolidation, database-building
& poverty mappingStep 5 – Data validation and community con-
sultationStep 6 – Knowledge (database) managementStep 7 – Plan formulationStep 8 – Dissemination, implementation, and
monitoring
The MDG Indicators, which were estimated using CBMS data, are presented in Table 37.
Box 1. Community-Based Monitoring System

96Status Report on the Millennium Development Goals Using CBMS DataProvince of Romblon

97Status Report on the Millennium Development Goals Using CBMS Data Province of Romblon

98Status Report on the Millennium Development Goals Using CBMS DataProvince of Romblon

99Status Report on the Millennium Development Goals Using CBMS Data Province of Romblon
C. Poverty and Food Thresholds
Official poverty thresholds computed by the NSCB were used and, in some cases, updated to the reference period for the CBMS data by inflating these thresholds using the appropriate Consumer Price Index (CPI). The poverty and food thresholds used for each province are presented in Table 38.
D. Authority for the CBMS Census
The NSCB has issued Resolution No. 6 (2005) which recognizes and enjoins suppor t to the CBMS as a too l fo r strengthening the statistical system at the local level. It also directs the NSCB Technical Staff to initiate and coordinate an advocacy program for the adoption of the CBMS by the LGUs, through the Regional Statistical Coordination Commit-tees (RSCCs), the technical arm of the NSCB Executive Board in the regions.
The NSCB has also approved the CBMS Survey Instruments through NSCB Approval No. DILG-0903-01.
E. Survey Operations
All survey operations were undertaken under the supervision of the CBMS Technical Working Groups (TWGs) at the Provincial and Municipal Levels. They identified the local personnel who were trained as enumerators and field supervi-sors. Technical assistance was provided by the PEP-CBMS Network Coordinating Team, the Bureau of Local Government Development (BLGD) and Regional Office IV-B of the Depart-ment of the Interior and Local Government (DILG), National Anti-Poverty Commission (NAPC), National Economic and Development Authority (NEDA) Regional Office IV-B and the Institute for Democratic Participation in Governance (IDPG).
Training was mainly conducted at two levels. The first level training (Training of Trainors) is conducted for members of the TWGs. This is usually conducted by members of the research staff of the CBMS Network and CBMS accred-ited trainors from the DILG, NAPC and NEDA. Meanwhile, a second level training (Training of Enumerators) is conducted for enumerators who are usually composed of barangay health

100Status Report on the Millennium Development Goals Using CBMS DataProvince of Romblon
workers and students. The members of the TWG acted as trainors in this training.
F. Data Processing System
The data processing software used under this project includes the CBMS Data Encoding Sys tem, the CBMS-Natura l Resources Database and Stata.
The CBMS encoding system uses CSPro (Census and Survey Processing), a software developed by the United States Bureau of Census for entering, editing, tabulating, and disseminating data from censuses and surveys. The CSPro-based (Census and Survey Processing) Encoding System converts survey data into electronic data. It produces text files (ASCII) described by data dictionaries, which adds flexibility to the output data. This feature facilitates the interface between the CBMS data and other database systems and statistical softwares.
The CBMS Mapping system employs the Natural Resources Database (NRDB) for CBMS-based poverty mapping and for storing and displaying household- and individual- level information, The CBMS-NRDB is capable of creating and storing spatial (shapefiles) and non-spatial (texts and numbers) data as well as generating maps, reports and graphs ideal for presentation and analysis of poverty attributes in the community. This has signifi-cantly addressed the need for a simple yet powerful and free geographically-oriented database.
Meanwhile, the CBMS data presented in this report through tables, graphs, charts and poverty maps were processed using Stata, a general-purpose statistical software package created in 1985 by StataCorp.
These softwares were provided for free to the nine provinces which formulated their reports under this project.
G. CBMS Poverty Maps
The poverty map for each indicator shows the provincial map disaggregated by municipality.
A simple color scheme is used (green, light green, pink and red) to represent the four ranges of data for each indicator. Each indicator, however, used a different range relative to the provincial data.
H. Limitations of the Data
While observations are taken from the entire population, the user of the data presented in this report should bear in mind that the municipalities in two provinces (Eastern Samar and Biliran) were not able to collect their data over the same period. For instance, CBMS was piloted in a number of municipalities in Eastern Samar and Biliran in 2005 and was implemented provincewide in 2006. Moreover, due to some diffi culties, the CBMS census could not be carried out in 1 barangay in Romblon, and 2 barangays each in Camarines Norte and Eastern Samar. Moreover, data from a number of barangays in Sarangani are still not available.
Estimates on poverty and subsistence incidence may also be affected by under- and/or over-report ing of income or reluctance on the part of the respondents to reveal their true levels of income. As in other surveys, the CBMS enumerators may also have encountered interview non-response and item non-response.

101Status Report on the Millennium Development Goals Using CBMS Data Province of Romblon

Available in this series:
NATIONAL REPORT
• Philippines Progress Report on the Millennium Development Goals 2010
PROVINCIAL REPORTS
•Status Report on the Millennium Development Goals Using CBMS Data Province of Agusan del Norte
•Status Report on the Millennium Development Goals Using CBMS Data Province of Agusan del Sur
•Status Report on the Millennium Development Goals Using CBMS Data Province of Biliran
•Status Report on the Millennium Development Goals Using CBMS Data Province of Camarines Norte
•Status Report on the Millennium Development Goals Using CBMS Data Province of Eastern Samar
•Status Report on the Millennium Development Goals Using CBMS Data Province of Marinduque
• Status Report on the Millennium Development Goals Using CBMS Data Province of Romblon
• Status Report on the Millennium Development Goals Using CBMS Data Province of Sarangani
•Status Report on the Millennium Development Goals Using CBMS Data Province of Siquijor