
MCR_2012_web
228
-
Upload
iulia-vedislav -
Category
Documents
-
view
301 -
download
2
Transcript of MCR_2012_web


2012
MAJORCOMPANIESIN ROMANIA


MCR CONTENTS
7 FROM THE EDITOR8 FOREWORD - Tracing the excellence pattern in Romanian industries - Bogdan Ion, Country Managing Partner, Ernst&Young Romania9 MCR RANKING METHODOLOGY11 TOP 300 MAJOR COMPANIES IN ROMANIA23 BANKING & FINANCE Banking in 2012 towards a more regulated market – Gabriela Bratu, Senior, Assurance& Advisory Business Services, Ernst&Young Doing Business In Romania – Steven van Groningen, President Raiffeisen Bank Romania, President Foreign Investors Council TOP Banking 2012 on the Merger and Acquisition market in the insurance sector – The re-launching year? – Cristina Cerbu, Manager, Transaction Advisory Services, Ernst&Young 2012, a year of challenges in insurance market – Violeta Ciurel, President & CEO, AXA Life Insurance TOP Insurance Financial leasing companies target – survival – Cristina Cerbu, Manager, Transaction Advisory Services, Ernst&Young TOP Financial Leasing Solid reasons to grow – Shane Dowling, General Manager, ALD Automotive TOP Operational Leasing TOP Pension Funding and TOP Capital Market Intermediation TOP Fund Management43 ENERGY Shining future for solar power – Andreea Stanciu, Senior Manager, Transaction Advisory Services, Ernst & Young, Mihaela Cuturescu, Senior Consultant, Transaction Advisory Services, Ernst & Young The right way? The Green way – Adrian Borotea, Member of the Board, CEZ Romania TOP Electric power generation and distribution TOP Oil & gas extraction and distribution TOP Whole sale of electricity and fuels TOP Retail trade of gas - gas stations53 CHEMICALS On way from politics to ECOnomics – Iulian Ernst, Freelance Analyst TOP Manufacture of basic chemicals TOP Wholesale of chemical products TOP Manufacture of rubber and plastic products - except tires TOP Manufacture of paints, varnishes and similar coatings, printing inks and mastics TOP Waste Management61 PHARMACEUTICALS Pharmaceutical Market – Reaping the fruits of past - Bogdan Tenu, Senior Manager, Transaction Advisory Services, Ernst & Young Invest in Romania - Dragos Damian, CEO Terapia Ranbaxy TOP Manufacture of basic pharmaceuticals TOP Retail trade of pharmaceuticals TOP Wholesale of pharmaceuticals69 GLASS & CERAMICS An industry war – Magda Munteanu, Freelance Journalist TOP Manufacture of glass and glass products TOP Manufacture of ceramic products
73 METAL Metal Industry faces bleak perspectives – Magda Munteanu, Freelance Journalist TOP Primary metal manufacturing TOP Manufacture of metal products TOP Wholesale of metals and metal ores81 MACHINERY Better than expected – Magda Munteanu, Freelance Journalist Let’s invest in skilled workforce – Alexandru Blemovici, General Manager, Schaeffler Romania TOP Manufacture of machinery, industrial equipment, ships and aircraft TOP Wholesale of machinery, industrial equipment, ships and aircraft89 ELECTRIC & ELECTRONIC EQUIPMENT Moderate raise keeps market afloat – Corina Mica, Freelance Journalist TOP Manufacture of electrical and electronic equipment TOP Trade of electrical and electronic equipment Manufacture of domestic appliances95 IT&C The mobile maze: when communication goes digital – Mirela Calota, Manager, Transaction Advisory Services, Ernst & Young In pursuit of a robust IT market – Carmen Dobre, Senior Manager, Transaction Advisory Services, Ernst & Young Growth comes from innovations – Jean - François Fallacher, CEO Orange Romania TOP Telecommunications TOP Communication equipment TOP Computer programming, consultancy and related activities TOP Manufacture and sale of computers and peripheral equipment105 INDUSTRIAL ENGINEERING Project Rush – Magda Purice, Journalist TOP Industrial engineering109 CONSTRUCTIONS Building industry’s performance returns on upward path, after two years of double-digit decline – Diana Macovei, Freelance Analist How to predict the unpredictable – Daniel Bach, CEO, Holcim Romania TOP Construction of residential & industrial buildings TOP Building materials TOP Construction of roads, railways, bridges and tunnels TOP Construction of electric sites TOP Construction of utility projects for fluids and related services TOP Hydro-technical constructions TOP Electrical, plumbing and other construction installation activities TOP Manufacture of equipment for construction industry119 REAL ESTATE The real state of real estate in Romania – Andreas Hadjidamianou, Partner, Assurance & Advisory Business Services, Ernst & Young Low appetite in real estate sight – Adrian Crivii FRICS, MAA, CEO, Darian DRS SA TOP Real estate evaluation companies TOP Real estate agencies TOP Real estate project developers TOP Property & facility management TOP Real estate asset managers
3Major Companies in Romania 2012 EDITION Major Companies in Romania

129 WOOD, PAPER & FURNITURE New investments need Government support – Corina Mica, Freelance Journalist A louder voice for Romanian design brands – Camelia Sucu, President, Class Leaving TOP Manufacture of wood and wooden products TOP Manufacture of furniture TOP Retail trade of furniture, carpets and lighting equipment TOP Manufacture of paper and paper products137 TEXTILE & LEATHER Production of textiles recovers slowly after the 2009 plunge – Diana Macovei, Freelance Analyst TOP Manufacture of wearing apparel TOP Preparation of textile fibers and textiles manufacture TOP Retail trade of clothing in specialised stores TOP Manufacture of footwear and leather goods TOP Retail trade of footwear and leather goods145 AGRICULTURE Romania’s eternal and fascinating promise – Iulian Ernst, Freelance Analyst Traders face unpredictable weathers – Angelo Nicolae, General Manager AgriBusiness at BriseGroup Constanta TOP Growing and trading agricultural raw materials TOP Growing and trading fruit and vegetables TOP Farming and meat processing153 FMCG How fast are consumer goods moving? – Corina Mica, Freelance Journalist X-Raying the Romanian coffee market – Marius Melesteu, General Manager Strauss Romania TOP Processing of tea and coffee TOP Manufacture of condiments and seasonings TOP Manufacture of tobacco products TOP Manufacture of cocoa, chocolate and confectionery TOP Manufacture of dairy products TOP Manufacture of sugar TOP Manufacture of grain mill products and starches TOP Manufacture of vegetable and animal oils and fats TOP Manufacture of wine from grape TOP Manufacture of beer TOP Manufacture of soft drinks; production of mineral waters and other bottled waters TOP Distilling, rectifying and blending of spirits TOP Home and personal care165 TRADE With a slow economic recovery ahead, retailers cannot afford to think short term – Marius Boatca, Manager, Transaction Advisory Services, Ernst & Young TOP Cash & Carry TOP Hypermarkets TOP Supermarkets TOP Do-it-yourself TOP Discount TOP Malls & Shopping centers
171 TRANSPORT & CARGO Long Road to effectiveness – Magda Purice, Journalist Getting into gear – Sergiu Iordache, Managing Director, DSV Solutions TOP Road transport TOP Maritime & river transport TOP Air transport TOP Rail transport TOP Freight transport TOP Postal and courier activities179 AUTOMOTIVE The Romanian automotive industry: changing gear or changing lanes? – Ariadna Oslobeanu, Senior Manager, Assurance & Advisory Business Services, Ernst & Young TOP Automotive producers & importers Back in 2000? – Dana Cortina, General Manager, Porsche Inter Auto Romania TOP Car dealers TOP Automotive parts producers TOP Automotive parts distributors 191 PROFESSIONAL SERVICES Circle of trust: relying on the right partner – Corina Mica, Freelance Journalist TOP Legal TOP Accounting, audit, FAS & tax TOP Business Process Outsourcing TOP Management consulting companies TOP Executive search, recruitment and HR management TOP Training companies TOP Market research companies203 BUSINESS SERVICES Tourism, not a walk in the park – Magda Purice, Journalist TOP Travel agencies TOP Security companies TOP Hotels and similar accommodation TOP Printing services209 MEDIA & ADVERTISING How to survive on a shrinking market – Corina Mica, Freelance Journalist TOP Advertising agencies TOP Media agencies TOP PR agencies215 HEALTH CARE The two-headed healthcare system – the dinosaur and the phoenix – Mihai A. Pop, MBA, Manager, Transaction Advisory Services, Ernst & Young The urge of threating with good will – Mihai Marcu, President, Medlife TOP Medical centers TOP Dental centers
MCR CONTENTS

MAJORCOMPANIESIN ROMANIA
doingbusiness.ro
Dumitru Ion
Roxana Neacsu
Madalina AthanasiuMirela BobeNicolae IonMagda Purice
Iulian ErnstDiana Macovei Corina MicaMagda MunteanuBogdan Preda
Raluca Butnariu
Marian CaramihaiIlie Toader
Carmen Popescu
Teodora DanciuCatalin LucaRamona RaicuElena VijoliCatalin Zaf iu
Edited by:
General Manager:
Project Manager:
Project team:
Contributors:
IT & Web Development:
DTP & Grafic design:
Production:
Sales:
Copyright © 2012doingbusiness.ro
Strada Prof. Ion Bogdannr. 4-6, etaj 4,
sector 1, BucureştiPhone: +40 21 528 0408
Fax: +40 21 528 0409E-mail: [email protected]
www.doingbusiness.ro
The Publisher cannot, under any circumstances, assume responsibility for any kind of damages supposing to be resulted from the use of the information provided by this publication. The information included into printed edition of Major Companies of Romania, was provided by sources we considered to be reliable: Trade Register, National Bank of Romania, Bucharest Stock Exchange, The Insurance Supervisory Commission, The Romanian Pension Funds' Association, Romanian Association of Fund Managers, Ministry of Finance, companies themselves. However the Publisher cannot take responsibility for the information accuracy.
* the companies from TOPs, marked this way, were, based on our information, on the moment of our analysis under the incidence of the law 85/2006 – insolvency.
No part of this publication may be reproduced, copied or distributed in any form or by any means, electronic or printed, without mentioning the source, respectively the publisher or the contributor.
Distribution: Major Companies in Romania is distributed for free. Copy available only free of charge, not for sale.
Printed byTipografia Everest 2001

7
Major Companies in Romania
This note is not about detailed techniques or complicated numbers. It’s about what prompted us (again) to prepare the new edition of Major Companies in Romania.
In good times and bad times alike we feel we need to know who has remained strong, who is struggling to become stronger and who is fighting to avert weaknesses. That’s because we want to share these findings with you. We want to be the most qualified tellers of corporate performance criteria because this will also make you the happy users of the data, and equally more qualified critics and observers of the business environment.
Knowing all these is not as simple as drawing tables or punching in numbers such as turnovers, revenues or net incomes into a computer. We believe that wouldn’t be enough and, above all, wouldn’t be relevant. At least not as far as we’re concerned. That’s because this is ultimately about helping you not only with knowing business but also with doing business in Romania. And that’s also why we called in our partners in this project, the experts at Ernst & Young Romania to help us again produce this edition by making a real difference with their unparalleled knowledge.
We genuinely believe that the product we developed together with Ernst & Young has become one of a kind in Romania as far as the truly relevant enterprise rankings and scoring algorithms are concerned. Firstly, that’s because we believe no one else uses so many quantitative and qualitative indicators as we do. Then again, and equally important, because we bring in experts and observers to tell the story behind each and every industry that we assess in our Major Companies in Romania. Additionally, we’ve also added some of the most qualified opinions for more than half of the industries and sectors that we’re presenting in this issue. Last but not least, we believe that making all this data available online will turn our work into a truly helpful database that all of you can access from everywhere, at anytime without having to carry the print version with you at all times.
MCR From the editor
Major Companies in Romania - Turning into a MAJOR habit
2012 EDITION Major Companies in Romania
The Editorial Team
We happen to know and to understand that the harsher the economic times are or shall be, the more important it is that our readers get the right picture about what is, was, or is about to happen. We’ve already predicted in our latest separate publication (the Romanian Business Digest) that Romania is now heading for The Real Crossroad, a junction point that’s going to determine the way business will be carried forward for the next few years to come. Therefore, we feel our current X-ray of the Major Companies in Romania needs to be as accurate and as real as it can get.
As such, we’ve first selected 5,000 companies from among which we analyzed, scored and ranked more than 2,400 from 23 different industries and sectors in Romania, with the primary data obtained from the Trade Registry and the Finance Ministry. In the case of financial entities and banks, we used the primary data from the National Bank of Romania and the Romanian Insurance Supervisory Commission.
We’re happy to also offer you the rankings of the top 300 companies in Romania (bar the banking and financial institutions that are treated separately due to their specifics) and 23 chapters that altogether reveal another 100 rankings.
It has been a real effort on our side, and yet we hope a useful one for you.
We therefore hope you’ll enjoy reading and using this product. As of now, it belongs to you.

Creating value. Achieving potential.
It is four years since many countries around the world have been struggling with what we used to call the economic crisis. We are seeing paradox evolutions of many economies in Europe, with various industries acting differently from one region to another and from one moment to another.
In Romania, 2012 has been a challenging year for all players in the market. They faced the contagious impact of evolutions in Europe, while the local political uncertainty hampered the competitiveness of our economy.
Drawing closer to the end of the year, it is crucial to identify and acknowledge the reference players and the industry landmarks that are driving value creation in today’s market. By looking at the performance footprint of industry leaders, we can map the industry hot spots and the attractiveness drivers of the local economy.
It is why the Ernst & Young Transaction Advisory team has contributed to this year’s edition of Major Companies in Romania. As a global company, tapping into 140 diverse economies all over the world, at Ernst & Young, we support a wide range of companies, enabling us to draw specific insights from every market where we are present. This year, we mark a great milestone, by celebrating 20 years of continuous achievements in Romania. In this context, we have committed to developing and sharing a comprehensive insight into the Romanian economic environment.
Together with the doingbusiness.ro team, we have designed a multifaceted methodology capturing all the qualitative and quantitative aspects that make the profile of the strongest, most competitive major companies on the market. We pursued this unique project with the goal to build a reference instrument that can assist potential foreign investors, local firms as well as entrepreneurs, when looking at the business landscape in Romania.
Through Major Companies in Romania, we bring forward a general ranking of the most performing 100 companies in the country, highlighting how positive results are distributed in the economy today. But even more importantly, through our methodology, we have put together specific analysis of 24 Romanian industry sectors, bringing a unique outline of market trends and predictions.
MCR Foreward
Tracing the excellence pattern in Romanian industries
BOGDAN ION,Country Managing Partner,Ernst & Young Romania
This overview book that concludes our research for 2012 is more than a collection of rankings and industry outlooks. It is in a sense a White Paper of the Romanian economy that can assist top executives in planning their strategy for 2013. Emerging countries, such as Romania, are not only economically significant at the moment, but will be the growth engine for the global economy going forward. Business leaders across Central and Eastern Europe are still cautious about their investments in the region, but many see reasonable business potential in Romania, expecting it to act as a regional power-house.
Romania has a long way to go in building a strong competitive market. The foundation is however here, boasting promising perspectives for the post-recession years. It is clear that nobody will step up and put the pieces together if the business community doesn’t take the lead. We need to drive the Romanian market into the regional and global competition, if we want to turn its promising opportunities into reality.

92012 EDITION Major Companies in Romania
doingbusiness.ro and Ernst & Young developed the present study by analyzing a composite mix of indicators based on the results reported by companies registered in Romania for 2011. Ernst & Young, together with doingbusiness.ro, have put together an in-depth assessment algorithm, which balances the most relevant business performance indicators, factoring in the particular conditions of today’s economic context. The ranking methodology includes a scoring system by which each company is assessed, based on turnover, financial and non-financial aspects, all considered by separate weights which reflect our insights regarding the specifics of doing business in the local market.
The most important criteria taken into consideration by our methodology was the turnover reported by the companies in 2011. This was further weighted alongside other financial and non-financial performance aspects. The indicators included in this methodology are computed based on public information disclosed either by authorized bodies and institutions or by the companies themselves.
The analysis of non-financial indicators was applied to aspects such as average number of employees, type of company (listed, unlisted), corporate social responsibility and environmental initiatives developed in Romania as well as the contribution to developing a local brand.
The financial indicators were computed based on information extracted from annual financial statements as at 31 December 2011. A number of financial indicators were
selected, such as Earnings before Interest, Taxes, Amortization and Depreciation (EBITDA) growth, Current Ratio, Return on Equity Ratio, Debt to Equity Ratio and Interest Coverage Ratio.
Each indicator has been assessed based on a scoring grid from 1 to 5 allotted for specific value intervals, 1 being the value assigned for the lowest performance and 5 being assigned for the highest performance.
This year, we have also developed a separate methodology for the banking sector. Apart from Total Assets, which represent the major size measure, we have considered other indicators such as the Net Banking Income growth, Return on Equity and Loans/Deposits Ratio.
With this revised approach, Major Companies in Romania looks at the performance of companies registered in Romania that have filed the financial statements for the year ended 31 December 2011 with the Trade Register. Companies that have not submitted their financial statements for 2011 were not included in this analysis. Ernst & Young was pleased to bring its contribution to Major Companies in Romania drawing upon its significant experience in serving leading companies and investors across various industry sectors. Our 20 years of experience on the local market allowed us to thoroughly customize the research algorithm in order to reflect the particular aspects of doing business in Romania.
MCR MCR Methodology
Ranking methodology for Major Companies in Romania Developed by Ernst & Young Romania and doingbusiness.ro


Top 300 Major Companies in RomaniaACTIVE AND PROFITABLE IN 2011
626,604 REGISTERED ACTIVE COMPANIES 360,333 COMPANIES POSTED PROFITS (58 PERCENT) 266,274 COMPANIES POSTED LOSSES (42 PERCENT) 623,231 PRIVATE-HELD COMPANIES 772 STATE-OWNED COMPANIES
112012 EDITION Major Companies in Romania
6thRomania’s ranking as the most attractive European country for investments over the next 3 years


TOP 300 MAJOR COMPANIES IN ROMANIARANK COMPANY NAME MCR SCORING ANNUAL TURNOVER
2011TURNOVER
RANKING PROFIT/LOSS 2011 NO OF EMPLOYEES CONTACT
1 OMV PETROM SA 4.950 16,565,465,973 1 3,685,607,226 22,052 Bucuresti, Sector 1
2 AUTOMOBILE DACIA SA 4.500 13,177,841,584 3 275,111,397 13,652 Mioveni, ARGES
3 BRITISH AMERICAN TOBACCO (ROMANIA) TRADING SRL
4.475 6,051,829,824 7 317,054,628 299 Bucuresti, Sector 1
4 SOCIETATEA NATIONALA DE GAZE NATURALE ROMGAZ SA
4.400 4,211,149,514 13 1,031,748,972 5,779 Medias, SIBIU
5 OMV PETROM MARKETING SRL 4.375 13,684,564,230 2 125,396,136 356 Bucuresti, Sector 1
6 KAUFLAND ROMANIA SCS 4.350 5,586,202,967 8 167,624,061 10,493 Bucuresti, Sector 2
7 METRO CASH & CARRY ROMANIA SRL 4.300 4,963,012,603 10 95,208,230 6,003 Bucuresti, Sector 3
8 CARREFOUR ROMANIA SA 4.300 4,031,266,685 16 133,799,794 6,951 Bucuresti, Sector 6
9 AZOMURES SA 4.263 1,625,577,204 55 365,196,441 2,688 Tg. Mures, MURES
10 ROMPETROL RAFINARE SA 4.213 10,174,808,952 4 -735,847,584 1,103 Navodari,
CONSTANTA
11 COMPANIA NATIONALA DE TRANSPORT AL ENERGIEI ELECTRICE - TRANSELECTRICA SA
4.163 3,113,142,778 22 90,913,316 2,197 Bucuresti, Sector 1
12 ALRO SA 4.163 2,241,390,928 33 228,309,982 2,513 Slatina, OLT
13 DEDEMAN SRL 4.063 2,016,376,729 39 205,670,978 4,646 Bacau, BACAU
14 PIRELLI TYRES ROMANIA SRL 4.013 1,501,679,442 63 94,411,056 1,890 Slatina, OLT
15 GDF SUEZ ENERGY ROMANIA SA 3.975 4,090,867,846 15 209,555,220 740 Bucuresti, Sector 4
16 ROMPETROL DOWNSTREAM SRL 3.963 7,645,953,049 5 -108,229,346 2,499 Bucuresti, Sector 1
17 NOKIA ROMANIA SRL 3.963 4,103,613,593 14 -8,770,342 1,866 Cluj-Napoca, CLUJ
18 HOLZINDUSTRIE SCHWEIGHOFER SRL 3.913 1,589,521,923 56 312,866,728 1,267 Sebes, ALBA
19 TAKATA ROMANIA SRL 3.913 1,522,320,748 62 46,228,727 4,230 Arad, ARAD
20 MEGA IMAGE SRL 3.913 1,221,043,229 78 13,097,320 4,277 Bucuresti, Sector 1
21 ARCELORMITTAL GALATI SA 3.900 4,663,330,401 11 -620,130,335 8,755 Galati, GALATI
22 INTERAGRO SA 3.875 2,741,108,028 27 162,792,694 257 Bucuresti, Sector 2
23 FARMEXPERT DCI SA 3.875 1,821,368,650 46 86,369,568 623 Bucuresti, Sector 6
24 COFICAB EASTERN EUROPE SRL 3.875 1,133,672,090 84 63,538,680 378 Arad, ARAD
25 LUKOIL ROMANIA SRL 3.863 5,458,206,353 9 -115,201,885 3,460 Bucuresti, Sector 1
26 ELECTRICA FURNIZARE SA 3.863 1,751,474,401 48 84,527,445 1,156 Bucuresti, Sector 2
27 SILCOTUB SA 3.863 1,442,409,942 65 107,588,856 1,348 Zalau, SALAJ
28 POLISANO SRL 3.825 1,245,539,397 76 42,157,465 639 Sibiu, SIBIU
29 CELESTICA ( ROMANIA ) SRL 3.813 2,357,993,685 31 12,519,199 1,163 Bors, BIHOR
30 AUTOLIV ROMANIA SRL 3.813 1,911,619,925 42 160,959,700 3,101 Brasov, BRASOV
31 COCA-COLA HBC ROMANIA SRL 3.813 1,738,623,539 50 137,399,050 1,744 Voluntari, ILFOV
32 SOCIETATEA COMERCIALA COMPLEXUL ENERGETIC TURCENI SA
3.813 1,529,901,979 61 55,567,882 4,496 Turceni, GORJ
33 SOCIETATEA NATIONALA DE TRANSPORT GAZE NATURALE TRANSGAZ SA
3.813 1,343,321,806 71 379,571,465 4,951 Medias, SIBIU
34 BILLA ROMANIA SRL 3.813 1,127,473,002 85 5,222,261 2,734 Bucuresti, Sector 2
35 HEINEKEN ROMANIA SA 3.813 1,042,285,902 97 182,888,969 1,198 Bucuresti, Sector 1
36 OMV PETROM GAS SRL 3.800 3,110,115,994 23 137,804,129 45 Bucuresti, Sector 2
37 SAMSUNG ELECTRONICS ROMANIA SRL 3.788 1,530,472,159 60 31,852,822 90 Voluntari, ILFOV
38 PETROTEL - LUKOIL SA 3.775 6,625,679,238 6 -391,609,120 556 Ploiesti, PRAHOVA
39 EON ENERGIE ROMANIA SA 3.775 4,261,045,806 12 -191,719,192 559 Targu Mures, MURES
40 MEDIPLUS EXIM SRL 3.775 2,700,529,658 28 56,231,206 900 Mogosoaia, ILFOV
41 ORANGE ROMANIA SA 3.763 3,981,959,733 17 805,637,899 2,707 Bucuresti, Sector 1
42 VODAFONE ROMANIA SA 3.763 3,399,602,653 20 425,484,737 2,951 Bucuresti, Sector 1
43 ARABESQUE SRL 3.763 1,715,508,601 52 34,635,851 2,530 Galati, GALATI
44 ROMANIA HYPERMARCHE SA 3.763 1,378,385,595 69 39,962,988 3,665 Bucuresti, Sector 3
45 DISTRIGAZ SUD RETELE SRL 3.763 1,099,691,738 92 135,369,392 3,112 Bucuresti, Sector 4
132012 EDITION Major Companies in Romania
MCR TOP 300

TOP 300 MAJOR COMPANIES IN ROMANIARANK COMPANY NAME MCR SCORING ANNUAL TURNOVER
2011TURNOVER
RANKING PROFIT/LOSS 2011 NO OF EMPLOYEES CONTACT
46 HIDROCONSTRUCTIA SA 3.750 1,002,178,651 101 50,428,795 6,528 Bucuresti, Sector 1
47 SELGROS CASH & CARRY SRL 3.713 3,408,091,410 19 86,702,217 4,248 Brasov, BRASOV
48 COMPLEXUL ENERGETIC CRAIOVA SA 3.713 1,228,075,942 77 795,421 2,175 Craiova, DOLJ
49 MECHEL TARGOVISTE SA 3.713 1,099,750,708 91 -133,495,504 2,250 Targoviste,
DAMBOVITA
50 SOCIETATEA COMERCIALA COMPLEXUL ENERGETIC ROVINARI SA
3.713 1,017,710,306 99 33,385,699 4,380 Rovinari, GORJ
51 REGIA NATIONALA A PADURILOR ROMSILVA RA
3.700 1,204,391,260 80 20,787,107 18,601 Bucuresti, Sector
52 JT INTERNATIONAL (ROMANIA) SRL 3.675 2,375,824,912 29 6,030,690 577 Bucuresti, Sector 2
53 EUROPHARM HOLDING SA 3.675 1,024,526,005 98 11,236,244 344 Brasov, BRASOV
54 CONTINENTAL AUTOMOTIVE PRODUCTS SRL 3.650 2,224,673,603 34 202,239,107 - Timisoara, TIMIS
55 DELPHI PACKARD ROMANIA SRL 3.650 1,700,702,239 53 34,612,356 9,812 Sannicolau Mare,
TIMIS
56 COMPANIA NATIONALA DE AUTOSTRAZI SI DRUMURI NATIONALE DIN ROMANIA SA
3.650 1,008,605,903 100 246,292,679 5,867 Bucuresti, Sector 1
57 PHILIP MORRIS TRADING SRL 3.625 2,362,448,641 30 14,966,343 270 Otopeni, ILFOV
58 DAEWOO-MANGALIA HEAVY INDUSTRIES SA 3.613 1,725,406,261 51 -72,788,618 3,065 Mangalia,
CONSTANTA
59 OLTCHIM SA 3.613 1,533,016,194 59 -278,342,623 3,447 Ramnicu Valcea,
VALCEA
60 ARCTIC SA 3.613 1,073,231,988 95 42,149,099 2,532 Gaesti, DAMBOVITA
61 TMK-ARTROM SA 3.613 856,313,578 116 67,503,261 1,141 Slatina, OLT
62 WIEE ROMANIA SRL 3.600 1,104,270,989 90 -21,896,147 7 Bucuresti, Sector 1
63 PROCTER & GAMBLE DISTRIBUTION SRL 3.600 1,253,875,543 75 22,697,889 45 Bucuresti, Sector 2
64 OSCAR DOWNSTREAM SRL 3.588 2,250,309,163 32 26,778,021 240 Bucuresti, Sector 6
65 TINMAR - IND SA 3.588 1,402,890,170 67 21,539,140 52 Bucuresti, Sector 1
66 AGRO-CHIRNOGI SA 3.575 1,124,597,971 86 20,812,621 574 Chirnogi, CALARASI
67 ELECTROCENTRALE BUCURESTI SA 3.563 2,180,397,722 36 106,854,822 3,100 Bucuresti, Sector 6
68 MICHELIN ROMANIA SA 3.563 2,146,783,116 37 44,927,593 2,657 Bucuresti, Sector 1
69 RCS & RDS SA 3.550 2,028,873,472 38 -12,542,312 6,910 Bucuresti, Sector 5
70 PORSCHE ROMANIA SRL 3.538 1,798,618,534 47 114,723,266 150 Voluntari, ILFOV
71 AGRANA ROMANIA SA 3.525 932,083,781 109 85,241,359 630 Bucuresti, Sector 1
72 REWE (ROMANIA) SRL 3.513 1,750,171,052 49 5,145,553 2,493Stefanestii de Jos,
ILFOV
73 SCHAEFFLER ROMANIA SRL 3.513 1,481,631,232 64 7,417,486 3,267 Comuna Cristian,
BRASOV
74 ENEL ENERGIE MUNTENIA SA 3.475 1,842,264,078 45 -1,297,079 257 Bucuresti, Sector 1
75 SOCIETATEA NATIONALA NUCLEARELECTRICA SA
3.463 1,588,353,753 57 95,036,272 2,167 Bucuresti, Sector 1
76 DELPHI DIESEL SYSTEMS ROMANIA SRL 3.463 1,317,523,227 72 47,686,003 2,070 Bratuleni, IASI
77 PROFI ROM FOOD SRL 3.463 934,039,541 107 13,222,420 2,476 Timisoara, TIMIS
78SOCIETATEA COMERCIALA DE PRODUCERE A ENERGIEI ELECTRICE IN HIDROCENTRALE &HIDROELECTRICA&SA
3.450 3,020,591,574 24 6,444,266 5,243 Bucuresti, Sector 2
79 COMPANIA NATIONALA POSTA ROMANA SA 3.450 1,264,810,799 73 -182,932,177 32,124 Bucuresti, Sector 2
80 SOCIETATEA NATIONALA DE TRANSPORT FEROVIAR DE MARFA - CFR MARFA - SA
3.450 1,107,684,939 89 -93,452,745 9,145 Bucuresti, Sector 1
81 EXPUR SA 3.425 781,211,255 130 106,983,324 473 Urziceni, IALOMITA
82 COMPANIA NATIONALA “LOTERIA ROMANA” SA
3.413 1,160,084,883 81 81,659,837 2,709 Bucuresti, Sector 4
83 SOCIETATEA NATIONALA DE TRANSPORT FEROVIAR DE CALATORI CFR CALATORI SA
3.400 2,189,750,845 35 1,522,533 13,924 Bucuresti, Sector 1
84 BUNGE ROMANIA SRL 3.388 1,377,067,121 70 -232,841 237 Buzau, BUZAU
MCR TOP 300

TOP 300 MAJOR COMPANIES IN ROMANIARANK COMPANY NAME MCR SCORING ANNUAL TURNOVER
2011TURNOVER
RANKING PROFIT/LOSS 2011 NO OF EMPLOYEES CONTACT
85 REMAT SA 3.388 749,609,421 137 10,710,524 133 Calarasi, CALARASI
86 COSMOTE ROMANIAN MOBILE TELECOMMUNICATIONS SA
3.363 1,944,725,623 41 -30,803,300 1,234 Bucuresti, Sector 6
87 LIDL DISCOUNT SRL 3.363 1,678,989,043 54 -283,414,839 2,325 Nedelea, PRAHOVA
88 JOHNSON CONTROLS ROMANIA SRL 3.363 1,119,868,177 87 -10,661,767 3,350 Mioveni, ARGES
89 URSUS BREWERIES SA 3.363 1,108,012,643 88 -57,660,007 1,440 Bucuresti, Sector 1
90 DUCTIL STEEL SA 3.363 1,047,689,527 96 -141,648,777 1,507 Buzau, BUZAU
91 COMPANIA NATIONALA DE CAI FERATE CFR SA
3.350 1,149,704,461 82 -708,455,012 23,839 Bucuresti, Sector 1
92 CARGILL AGRICULTURA SRL 3.338 2,897,665,343 26 31,583,472 249 Bucuresti, Sector 1
93 SANOFI-AVENTIS ROMANIA SRL 3.338 848,148,293 118 19,095,940 187 Bucuresti, Sector 5
94 AUCHAN ROMANIA SA 3.313 1,578,059,613 58 -7,152,681 3,289 Bucuresti, Sector 1
95 ALTEX ROMANIA SRL 3.313 882,765,222 113 29,575,030 1,435 Piatra Neamt,
NEAMT
96 TRW AUTOMOTIVE SAFETY SYSTEMS SRL 3.313 878,392,258 114 23,484,769 2,788 Timisoara, TIMIS
97 REGIA AUTONOMA PENTRU ACTIVITATI NUCLEARE RA
3.313 715,991,743 144 37,774,933 3,659 Drobeta Turnu
Severin, MEHEDINTI
98 PROSPECTIUNI SA 3.313 315,293,527 345 30,981,821 1,604 Bucuresti, Sector 1
99 real,- HYPERMARKET ROMANIA SRL 3.300 3,008,864,542 25 -120,760,658 5,771 Bucuresti, Sector 3
100 MOL ROMANIA PETROLEUM PRODUCTS SRL 3.288 3,137,003,249 21 -13,397,874 176 Bucuresti, Sector 1
101 ROCHE ROMANIA SRL 3.288 1,090,313,389 93 149,697 225 Bucuresti, Sector 2
102 MERCEDES-BENZ ROMANIA SRL 3.288 764,704,445 132 26,137,904 136 Bucuresti, Sector 1
103 ENEL ENERGIE SA 3.275 1,897,153,560 43 -43,137,204 412 Bucuresti, Sector 1
104 ROMPETROL PETROCHEMICALS SRL 3.275 1,077,761,809 94 -151,271,747 471 Navodari,
CONSTANTA
105 GLAXOSMITHKLINE (GSK) SRL 3.275 723,741,502 142 21,173,671 300 Bucuresti, Sector 1
106 CONTINENTAL AUTOMOTIVE SYSTEMS SRL 3.263 1,264,430,015 74 -104,789,414 1,577 Sibiu, SIBIU
107 REGIA AUTONOMA DE DISTRIBUTIE A ENERGIEI TERMICE BUCURESTI RADET RA
3.263 1,208,837,877 79 -904,421,089 4,281 Bucuresti, Sector 3
108 CONTINENTAL AUTOMOTIVE ROMANIA SRL 3.263 1,139,142,245 83 -150,597,676 3,461 Timisoara, TIMIS
109 EON GAZ DISTRIBUTIE SA 3.263 800,458,510 124 230,492,490 3,747 Targu Mures, MURES
110 GRUP FEROVIAR ROMAN SA 3.263 761,053,345 134 28,920,981 2,386 Bucuresti, Sector 1
111SOCIETATEA COMERCIALA DE DISTRIBUTIE SI FURNIZARE A ENERGIEI ELECTRICE - ELECTRICA SA
3.238 1,438,037,720 66 7,148,124 247 Bucuresti, Sector 1
112 LAFARGE CIMENT (ROMANIA) SA 3.225 764,608,960 133 180,109,955 502 Bucuresti, Sector 1
113 FARMACEUTICA REMEDIA SA 3.225 203,467,822 527 4,077,449 395 Deva, HUNEDOARA
114 EATON ELECTRO PRODUCTIE SRL 3.213 814,087,797 120 35,083,922 1,829 Sarbi, MARAMURES
115 CEZ DISTRIBUTIE SA 3.213 809,391,603 122 130,458,811 1,345 Craiova, DOLJ
116 ARCELORMITTAL TUBULAR PRODUCTS ROMAN SA
3.213 748,109,975 138 -26,449,686 1,149 Roman, NEAMT
117 CEZ VANZARE SA 3.200 1,395,974,833 68 -31,316,430 48 Craiova, DOLJ
118 SEWS ROMANIA SRL 3.200 905,507,808 111 5,699,559 6974 Deva, Hunedoara
119 ALFRED C TOEPFER INTERNATIONAL (ROMANIA) SRL
3.188 1,848,711,705 44 -17,460,690 138 Bucuresti, Sector 2
120 LLK LUBRICANTS ROMANIA SRL 3.188 870,188,203 115 12,085,649 98 Ploiesti, PRAHOVA
121 JT INTERNATIONAL MANUFACTURING SA 3.175 1,979,436,255 40 -12,647,951 318 Bucuresti, Sector 2
122 MECHEL SERVICE ROMANIA SRL 3.175 816,528,524 119 14,770,336 365 Bucuresti, Sector 3
123 ADM FARM SRL 3.175 781,828,812 129 8,883,553 556 Pantelimon, ILFOV
124 SIEPCOFAR SA 3.163 755,620,215 136 6,830,066 1,300 Popesti-Leordeni,
ILFOV
125 RENAULT INDUSTRIE ROUMANIE SRL 3.150 3,944,561,044 18 1,048,546 1 Mioveni, ARGES
126 PLANOIL SRL 3.150 721,535,851 143 3,716,261 20 Bucuresti, Sector 1
152012 EDITION Major Companies in Romania
TOP 300 MAJOR COMPANIES IN ROMANIARANK COMPANY NAME MCR SCORING ANNUAL TURNOVER
2011TURNOVER
RANKING PROFIT/LOSS 2011 NO OF EMPLOYEES CONTACT
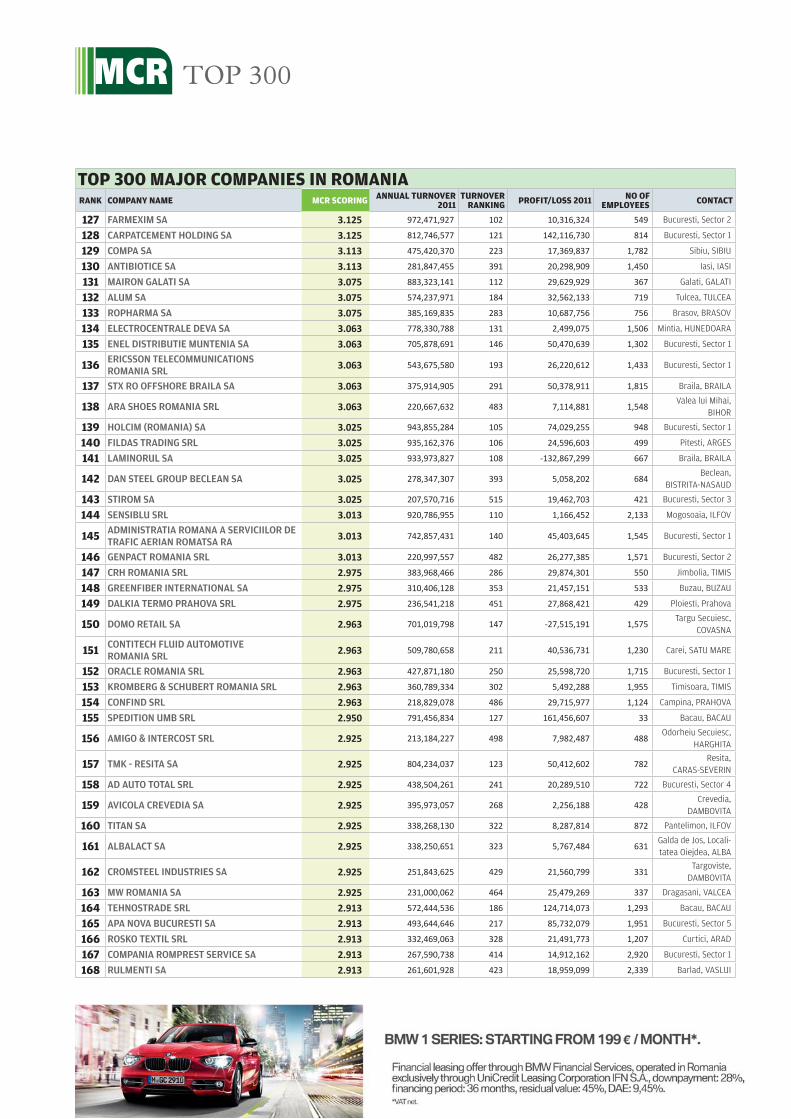
127 FARMEXIM SA 3.125 972,471,927 102 10,316,324 549 Bucuresti, Sector 2
128 CARPATCEMENT HOLDING SA 3.125 812,746,577 121 142,116,730 814 Bucuresti, Sector 1
129 COMPA SA 3.113 475,420,370 223 17,369,837 1,782 Sibiu, SIBIU
130 ANTIBIOTICE SA 3.113 281,847,455 391 20,298,909 1,450 Iasi, IASI
131 MAIRON GALATI SA 3.075 883,323,141 112 29,629,929 367 Galati, GALATI
132 ALUM SA 3.075 574,237,971 184 32,562,133 719 Tulcea, TULCEA
133 ROPHARMA SA 3.075 385,169,835 283 10,687,756 756 Brasov, BRASOV
134 ELECTROCENTRALE DEVA SA 3.063 778,330,788 131 2,499,075 1,506 Mintia, HUNEDOARA
135 ENEL DISTRIBUTIE MUNTENIA SA 3.063 705,878,691 146 50,470,639 1,302 Bucuresti, Sector 1
136 ERICSSON TELECOMMUNICATIONS ROMANIA SRL
3.063 543,675,580 193 26,220,612 1,433 Bucuresti, Sector 1
137 STX RO OFFSHORE BRAILA SA 3.063 375,914,905 291 50,378,911 1,815 Braila, BRAILA
138 ARA SHOES ROMANIA SRL 3.063 220,667,632 483 7,114,881 1,548 Valea lui Mihai,
BIHOR
139 HOLCIM (ROMANIA) SA 3.025 943,855,284 105 74,029,255 948 Bucuresti, Sector 1
140 FILDAS TRADING SRL 3.025 935,162,376 106 24,596,603 499 Pitesti, ARGES
141 LAMINORUL SA 3.025 933,973,827 108 -132,867,299 667 Braila, BRAILA
142 DAN STEEL GROUP BECLEAN SA 3.025 278,347,307 393 5,058,202 684 Beclean,
BISTRITA-NASAUD
143 STIROM SA 3.025 207,570,716 515 19,462,703 421 Bucuresti, Sector 3
144 SENSIBLU SRL 3.013 920,786,955 110 1,166,452 2,133 Mogosoaia, ILFOV
145 ADMINISTRATIA ROMANA A SERVICIILOR DE TRAFIC AERIAN ROMATSA RA
3.013 742,857,431 140 45,403,645 1,545 Bucuresti, Sector 1
146 GENPACT ROMANIA SRL 3.013 220,997,557 482 26,277,385 1,571 Bucuresti, Sector 2
147 CRH ROMANIA SRL 2.975 383,968,466 286 29,874,301 550 Jimbolia, TIMIS
148 GREENFIBER INTERNATIONAL SA 2.975 310,406,128 353 21,457,151 533 Buzau, BUZAU
149 DALKIA TERMO PRAHOVA SRL 2.975 236,541,218 451 27,868,421 429 Ploiesti, Prahova
150 DOMO RETAIL SA 2.963 701,019,798 147 -27,515,191 1,575 Targu Secuiesc,
COVASNA
151 CONTITECH FLUID AUTOMOTIVE ROMANIA SRL
2.963 509,780,658 211 40,536,731 1,230 Carei, SATU MARE
152 ORACLE ROMANIA SRL 2.963 427,871,180 250 25,598,720 1,715 Bucuresti, Sector 1
153 KROMBERG & SCHUBERT ROMANIA SRL 2.963 360,789,334 302 5,492,288 1,955 Timisoara, TIMIS
154 CONFIND SRL 2.963 218,829,078 486 29,715,977 1,124 Campina, PRAHOVA
155 SPEDITION UMB SRL 2.950 791,456,834 127 161,456,607 33 Bacau, BACAU
156 AMIGO & INTERCOST SRL 2.925 213,184,227 498 7,982,487 488Odorheiu Secuiesc,
HARGHITA
157 TMK - RESITA SA 2.925 804,234,037 123 50,412,602 782 Resita,
CARAS-SEVERIN
158 AD AUTO TOTAL SRL 2.925 438,504,261 241 20,289,510 722 Bucuresti, Sector 4
159 AVICOLA CREVEDIA SA 2.925 395,973,057 268 2,256,188 428 Crevedia,
DAMBOVITA
160 TITAN SA 2.925 338,268,130 322 8,287,814 872 Pantelimon, ILFOV
161 ALBALACT SA 2.925 338,250,651 323 5,767,484 631 Galda de Jos, Locali-tatea Oiejdea, ALBA
162 CROMSTEEL INDUSTRIES SA 2.925 251,843,625 429 21,560,799 331 Targoviste,
DAMBOVITA
163 MW ROMANIA SA 2.925 231,000,062 464 25,479,269 337 Dragasani, VALCEA
164 TEHNOSTRADE SRL 2.913 572,444,536 186 124,714,073 1,293 Bacau, BACAU
165 APA NOVA BUCURESTI SA 2.913 493,644,646 217 85,732,079 1,951 Bucuresti, Sector 5
166 ROSKO TEXTIL SRL 2.913 332,469,063 328 21,491,773 1,207 Curtici, ARAD
167 COMPANIA ROMPREST SERVICE SA 2.913 267,590,738 414 14,912,162 2,920 Bucuresti, Sector 1
168 RULMENTI SA 2.913 261,601,928 423 18,959,099 2,339 Barlad, VASLUI
MCR TOP 300

TOP 300 MAJOR COMPANIES IN ROMANIARANK COMPANY NAME MCR SCORING ANNUAL TURNOVER
2011TURNOVER
RANKING PROFIT/LOSS 2011 NO OF EMPLOYEES CONTACT
169 ALPIQ ROMENERGIE SRL 2.900 715,416,545 145 26,422,338 12 Bucuresti, Sector 1
170 UNILEVER SOUTH CENTRAL EUROPE SA 2.875 727,113,466 141 -66,077 279 Bucuresti, Sector 1
171 PORSCHE INTER AUTO ROMANIA SRL 2.875 636,456,271 161 5,915,195 521 Tunari, ILFOV
172 ELECTROMAGNETICA SA 2.875 495,195,622 216 15,075,281 535 Bucuresti, Sector 5
173 CORD ROMANIA SRL 2.875 383,708,042 287 18,823,477 458 Slatina, OLT
174 TIMKEN ROMANIA SA 2.875 351,791,919 309 86,447,728 852 Ploiesti, PRAHOVA
175 AEDIFICIA CARPATI SA 2.875 310,916,205 351 24,486,956 729 Bucuresti, Sector 5
176 ARGUS SA 2.875 231,042,645 463 7,930,422 291 Constanta,
CONSTANTA
177 REGIOTRANS SRL 2.875 225,505,914 472 8,669,801 760 Brasov, BRASOV
178 PREH ROMANIA SRL 2.875 216,340,379 493 9,736,777 324 Ghimbav, BRASOV
179 CHIPITA ROMANIA SRL 2.875 212,667,390 500 15,464,874 555 Clinceni, ILFOV
180 SIVECO ROMANIA SA 2.875 204,985,381 525 14,971,311 964 Bucuresti, Sector 1
181 COMPANIA NATIONALA DE TRANSPORTURI AERIENE ROMANE TAROM SA
2.863 946,315,772 104 -262,224,490 2,286 Otopeni, ILFOV
182 LEONI WIRING SYSTEMS RO SRL 2.863 664,314,181 154 16,838,477 3,413 Bistrita,
BISTRITA-NASAUD
183 CONTITECH ROMANIA SRL 2.863 646,344,364 158 106,239,205 1,554 Timisoara, TIMIS
184 YAZAKI ROMANIA SRL 2.863 612,330,127 169 15,317,650 3,489 Ploiesti, PRAHOVA
185 LEONI WIRING SYSTEMS ARAD SRL 2.863 510,879,742 210 14,249,600 2,999 Arad, ARAD
186 STRACO GRUP SRL 2.863 372,590,194 294 4,240,589 1,029 Bucuresti, Sector 5
187 ASESOFT DISTRIBUTION SRL 2.838 853,231,813 117 2,942,581 146 Bucuresti, Sector 2
188 BRISEGROUP SRL 2.838 544,497,306 192 12,813,660 128 Constanta,
CONSTANTA
189 AMEROPA GRAINS SA 2.838 483,949,128 220 11,351,261 200 Constanta,
CONSTANTA
190 CORTUBI SRL 2.838 431,773,722 248 5,322,664 122 Mioveni, ARGES
191 TRUST MOTORS SRL 2.838 248,839,423 436 10,898,148 75 Bucuresti, Sector 6
192 EURO AUTO PLASTIC SYSTEMS SRL 2.825 436,829,312 244 35,942,357 667 Mioveni, ARGES
193 TRANS BITUM SRL 2.825 314,694,139 346 7,039,912 280 Bucuresti, Sector 1
194 IBM ROMANIA SRL 2.825 311,815,348 350 55,891,208 806 Bucuresti, Sector 1
195 ZES ZOLLNER ELECTRONIC SRL 2.825 231,786,310 460 13,346,129 832 Satu Mare,
SATU MARE
196FILIALA DE DISTRIBUTIE A ENERGIEI ELEC-TRICE - ELECTRICA DISTRIBUTIE MUNTENIA NORD SA
2.813 685,740,287 151 67,414,812 2,078 Ploiesti, PRAHOVA
197SOCIETATEA COMERCIALA FILIALA DE DIS-TRIBUTIE A ENERGIEI ELECTRICE - ELEC-TRICA DISTRIBUTIE TRANSILVANIA NORD SA
2.813 535,412,637 199 29,100,621 2,016 Oradea, BIHOR
198 RENAULT TECHNOLOGIE ROUMANIE SRL 2.813 534,872,284 200 18,550,524 1,988 Voluntari, ILFOV
199 COMPANIA NATIONALA AEROPORTURI BUCURESTI SA
2.813 474,335,158 225 52,608,755 1,099 Otopeni, ILFOV
200 KOYO ROMANIA SA 2.813 231,283,959 461 4,551,725 1,345 Alexandria,
TELEORMAN
201 KROMBERG & SCHUBERT ROMANIA ME SRL 2.813 224,843,874 473 4,571,667 1,824 Medias, SIBIU
202 FAN COURIER EXPRESS SRL 2.813 222,633,218 477 43,993,292 1,137 Bucuresti, Sector 2
203 METALROM SRL 2.800 242,779,829 445 2,253,653 25 Bucuresti, Sector 1
204 BRIDGESTONE ROMANIA SRL 2.800 201,801,702 531 7,527,102 12 Bucuresti, Sector 2
205 AROMET SA 2.788 397,865,426 267 2,310,909 187 Buzau, BUZAU
206 COMFERT SRL 2.788 388,851,148 275 9,151,592 190 Bacau, BACAU
207 ENERGOBIT SRL 2.788 386,956,309 281 42,078,764 184 Cluj-Napoca, CLUJ
208 MHS TRUCK & BUS SRL 2.788 376,513,172 290 14,112,199 135 Bucuresti, Sector 6
209 DONALAM SRL 2.788 284,986,507 383 55,464,566 174 Calarasi, CALARASI
172012 EDITION Major Companies in Romania

TOP 300 MAJOR COMPANIES IN ROMANIARANK COMPANY NAME MCR SCORING ANNUAL TURNOVER
2011TURNOVER
RANKING PROFIT/LOSS 2011 NO OF EMPLOYEES CONTACT
210 JOHNSON CONTROLS FABRICS ROMANIA SRL 2.788 252,556,381 428 16,277,185 123 Timisoara, TIMIS
211 AGRICOVER SRL 2.788 236,750,800 450 6,605,172 116 Voluntari, ILFOV
212 GRUP ROMET SA 2.788 624,090,512 164 3,843,537 79 Buzau, BUZAU
213 LS TRAVEL RETAIL ROMANIA SRL 2.788 264,051,362 419 5,268,709 139 Bucuresti, sector 1
214 KRONOSPAN SEBES SA 2.775 972,230,274 103 -31,620,157 442 Sebes, ALBA
215 HELLA ROMANIA SRL 2.775 592,357,122 174 31,240,868 928 Sannicolau Mare,
TIMIS
216 LINDE GAZ ROMANIA SRL 2.775 437,597,916 243 64,734,733 437 Timisoara, TIMIS
217 EUROPHARM SA 2.775 407,769,055 258 25,704,364 258 Brasov, BRASOV
218 TCE 3 BRAZI SRL 2.775 402,400,692 262 49,741,849 912 Piatra Neamt,
NEAMT
219 WHITELAND IMPORT EXPORT SRL 2.775 390,726,409 273 5,777,668 420 Bucuresti, Sector 4
220 HELP NET FARMA SA 2.775 350,442,551 313 12,580,059 993 Bucuresti, Sector 2
221 KATHREIN ROMANIA SRL 2.775 288,759,340 379 20,997,753 860 Timisoara, TIMIS
222 BOROMIR IND SRL 2.775 264,813,069 418 4,972,163 827 Ramnicu Valcea,
VALCEA
223 ARDEALUL SA 2.775 222,340,428 480 29,744,158 282 Carei, SATU MARE
224 EMERSON SRL 2.775 205,770,924 521 28,392,323 698 Cluj-Napoca, CLUJ
225 UNICARM SRL 2.763 635,301,465 163 13,781,420 2,688 Vetis, SATU MARE
226 MARQUARDT SCHALTSYSTEME SCS 2.763 518,218,340 207 32,441,032 1,048 Sibiu, SIBIU
227 DELTA ANTREPRIZA DE CONSTRUCTII SI MONTAJ 93 SRL
2.763 407,736,320 259 49,802,964 1,214 Bucuresti, Sector 3
228 VEGA 93 SRL 2.763 361,214,554 300 28,790,208 2,087 Galati, GALATI
229 ALCATEL - LUCENT ROMANIA SA 2.763 328,377,251 333 27,522,541 1,486 Timisoara, TIMIS
230 GLOBAL E-BUSINESS OPERATIONS CENTRE SRL
2.763 274,220,700 399 27,755,616 2,594 Bucuresti, Sector 2
231 AEM SA 2.763 258,532,296 426 22,915,111 1,370 Timisoara, TIMIS
232 GRANI COMERT SRL 2.750 374,804,985 292 7,656,500 49 Constanta,
CONSTANTA
233 ENERGY HOLDING SRL 2.738 747,454,302 139 -34,583,954 53 Bucuresti, Sector 1
234 CARMISTIN SRL 2.738 384,794,152 284 3,214,146 525 Voluntari, ILFOV
235 FLANCO RETAIL SA 2.725 482,000,196 221 95,848,848 667 Cluj-Napoca, CLUJ
236 TERAPIA SA 2.725 421,239,266 253 95,848,848 667 Cluj-Napoca, CLUJ
237 ARCELORMITTAL HUNEDOARA SA 2.725 388,082,736 277 -19,811,164 683 Hunedoara,
HUNEDOARA
238 ZAHARUL ORADEA SA 2.725 387,859,569 279 5,623,257 268 Oradea, BIHOR
239 ELGEKA - FERFELIS ROMANIA SA 2.725 282,092,710 389 1,887,738 400 Bucuresti, Sector 3
240 CUMMINS GENERATOR TECHNOLOGIES ROMANIA SA
2.725 265,401,137 416 3,012,892 707 Craiova, DOLJ
241 ZARA BUCURESTI SRL 2.725 262,871,579 421 44,040,102 491 Bucuresti, Sector 3
242 VALROM INDUSTRIE SRL 2.725 246,466,069 441 14,140,879 340 Bucuresti, Sector 6
243 ZENTIVA SA 2.725 235,648,166 453 33,857,309 555 Bucuresti, Sector 3
244 INTRAROM SA 2.725 221,672,458 481 1,440,302 412 Bucuresti, Sector 2
245 ARCELORMITTAL TUBULAR PRODUCTS IASI SA
2.725 218,094,258 490 -35,611,590 547 Iasi, IASI
246 TERAPLAST SA 2.725 209,359,979 509 -14,642,198 449 Bistrita,
BISTRITA-NASAUD
247 DELACO DISTRIBUTION SA 2.725 201,896,515 530 2,436,482 400 Codlea, BRASOV
248 RAJA SA 2.713 206,825,742 520 12,112,477 2553Constanta, CON-
STANTA
249 FORD ROMANIA SA 2.713 797,674,088 125 -471,350,988 3,501 Craiova, DOLJ
250 LISA DRAXLMAIER AUTOPART ROMANIA SRL 2.713 295,424,439 368 8,831,594 3,515 Pitesti, ARGES
251 LEMARCO SA 2.700 342,755,084 317 19,994,605 - Bucuresti, Sector 1
MCR TOP 300

TOP 300 MAJOR COMPANIES IN ROMANIARANK COMPANY NAME MCR SCORING ANNUAL TURNOVER
2011TURNOVER
RANKING PROFIT/LOSS 2011 NO OF EMPLOYEES CONTACT
252 MARIA CEREALE SRL 2.700 316,630,800 343 5,619,256 14 Constanta,
CONSTANTA
253 AIR BP SALES ROMANIA SRL 2.700 288,719,992 380 6,230,480 1 Otopeni, ILFOV
254 AUTOCORA SRL 2.700 276,022,388 397 9,484,310 42 Alexandria,
TELEORMAN
255 ROREX TRADER SRL 2.700 205,400,638 523 832,152 10 Constanta,
CONSTANTA
256 ROMPETROL GAS SRL 2.688 784,405,200 128 -2,760,637 171 Bucuresti, Sector 1
257 UNICOM HOLDING SA 2.688 758,778,507 135 -19,280,605 141 Voluntari, ILFOV
258 GENERAL ELECTRIC INTERNATIONAL INC - WILMINGTON SUCURSALA ROMANIA
2.688 694,710,373 148 11,638,925 98 Bucuresti, Sector 1
259 IPSO SRL 2.688 369,638,427 296 21,063,687 238 Mogosoaia, ILFOV
260 3M ROMANIA SRL 2.688 267,863,415 412 43,900,023 70 Bucuresti, Sector 1
261 PUNCTUAL COMIMPEX SRL 2.688 249,260,965 435 1,520,548 62 Cluj-napoca, CLUJ
262 WRIGLEY ROMANIA SRL 2.688 213,525,542 497 30,201,909 196 Bucuresti, Sector 1
263 GRUP SERVICII PETROLIERE SA 2.675 796,938,787 126 -307,319,833 434 Constanta,
CONSTANTA
264 CAMERON ROMANIA SRL 2.675 677,011,157 152 51,853,430 845 Campina, PRAHOVA
265 KRAFT FOODS ROMANIA SA 2.675 563,555,504 189 26,064,691 262 Ghimbav, BRASOV
266 DANONE - PRODUCTIE SI DISTRIBUTIE DE PRODUSE ALIMENTARE SRL
2.675 502,998,666 214 16,396,155 608 Bucuresti, Sector 2
267 SIEMENS SRL 2.675 475,386,469 224 19,781,890 469 Bucuresti, Sector 6
268 AVON COSMETICS (ROMANIA) SRL 2.675 444,432,678 239 56,435,043 315 Oiejdea, ALBA
269 TRANSAVIA SA 2.675 357,681,199 305 26,299,438 913 Oiejdea, ALBA
270 EURO CONSTRUCT TRADING 98 SRL 2.675 354,497,745 308 37,930,724 780 Bucuresti, Sector 6
271 COMPANIA NATIONALA IMPRIMERIA NATIONALA SA
2.675 342,553,292 319 32,645,355 474 Bucuresti, Sector 1
272 CARGILL OILS SA 2.675 313,656,544 347 -2,839,381 277 Bucuresti, Sector 1
273 BOS AUTOMOTIVE PRODUCTS ROMANIA SCS 2.675 304,484,903 358 16,333,470 855 Arad, ARAD
274 AGRISOL INTERNATIONAL RO SRL 2.675 231,060,622 462 8,441,745 953 Boldesti-Scaeni,
PRAHOVA
275 ANTENA TV GROUP SA 2.675 222,617,199 478 6,248,649 520 Bucuresti, Sector 1
276SOCIETATEA COMERCIALA FILIALA DE DIS-TRIBUTIE A ENERGIEI ELECTRICE - ELEC-TRICA DISTRIBUTIE TRANSILVANIA SUD SA
2.663 598,510,775 173 19,569,602 1,813 Brasov, BRASOV
277 ROMSTRADE SRL 2.663 539,727,094 197 10,881,044 1,623 Adunatii Copaceni,
GIURGIU
278 TMUCB 2.663 284,624,365 384 5,230,113 1,599 Bucuresti, Sector 1
279 SUCCES NIC COM SRL 2.663 273,925,545 400 2,470,789 1,431 Targu Jiu, GORJ
280 SANTIERUL NAVAL DAMEN GALATI SA 2.663 273,123,588 402 13,581,756 1,573 Galati, GALATI
281 COMPANIA LOCALA DE TERMOFICARE COLTERM SA
2.663 208,532,946 512 6,844,761 1,051 Braila, BRAILA
282 BRAICONF SA 2.663 33,123,548 1,835 1,959,082 1,046 Braila, BRAILA
283 TRANSENERGO COM SA 2.650 551,836,290 190 4,721,041 24 Bucuresti, Sector 5
284 ARELCO DISTRIBUTIE SRL 2.650 450,128,844 237 1,970,347 12 Bucuresti, Sector 1
285 GOODYEAR DUNLOP TIRES ROMANIA SRL 2.650 391,829,339 272 5,459,887 38 Bucuresti, Sector 1
286 ROMSPEED SRL 2.650 276,478,458 395 668,976 8 Constanta,
CONSTANTA
287 REMATHOLDING CO SRL 2.638 578,389,137 180 11,303,473 198 Braila, BRAILA
288 COMISION TRADE SRL 2.638 432,010,493 247 4,337,501 136 Braila, BRAILA
289 BULROM GAS IMPEX SRL 2.638 321,546,949 341 3,125,023 122 Bucuresti, Sector 1
290 CAN-PACK ROMANIA SRL 2.638 289,642,596 377 19,151,136 157 Bucuresti, Sector 4
291 COLGATE-PALMOLIVE (ROMANIA) SRL 2.638 248,723,770 437 5,933,337 100 Bucuresti, Sector 2
192012 EDITION Major Companies in Romania

TOP 300 MAJOR COMPANIES IN ROMANIARANK COMPANY NAME MCR SCORING ANNUAL TURNOVER
2011TURNOVER
RANKING PROFIT/LOSS 2011 NO OF EMPLOYEES CONTACT
292 VIVANI SALUBRITATE SA 2.638 205,510,109 522 10,448,441 191 Slobozia, Ialomita
293 BV MCCANN ERICKSON SRL 2.638 201,713,544 533 7,577,453 92 Bucuresti, Sector 1
294 ICME ECAB SA 2.625 652,464,236 157 13,084,487 563 Bucuresti, Sector 3
295 DANTE INTERNATIONAL SA 2.625 621,423,342 166 5,104,301 338 Voluntari, ILFOV
296 STRABAG SRL 2.625 585,828,064 176 6,436,998 448 Bucuresti, Sector 5
297 HENKEL ROMANIA SRL 2.625 542,369,628 194 30,414,936 459 Bucuresti, Sector 2
298 PETROM LPG SA 2.625 513,028,100 209 11,501,793 274 Otopeni, ILFOV
299 PRUTUL SA 2.625 489,975,996 219 2,362,422 416 Galati, GALATI
300 ENEL DISTRIBUTIE DOBROGEA SA 2.625 458,996,729 234 108,851,221 995 Constanta,
CONSTANTA
MCR TOP 300


232012 EDITION Major Companies in Romania
21CEE lending institutions active in Romania, the largest presence of region's major banks
Total assets of Romanian banking system is worth RON 353,91 billion in 2011
Banking & Finance BANKING INSURANCE FINANCIAL LEASING OPERATIONAL LEASING PENSION FUNDS ADMINISTRATORS FUND MANAGEMENT CAPITAL MARKET INTERMEDIARIES

Two of the most significant events in the banking sector in 2012 were the introduction of the International Financial Reporting Standards (IFRS) starting with 1 January 2012 and the legislative framework of the bridge-bank concept. These measures converge to the common purpose of the national and European authorities to have a unified view over the globalised banking sector as well as to re-enforce their role in financial stability. These changes were due to the commitment of the Romanian Authorities to a new preventive finance arrangement with the European Union, IMF and World Bank. Also, in 2012, the enforcement of the cooperation and harmonization framework in a new collaboration step under the Viena European Initiative for Banking Coordination 2.0 was set as a primary goal for national regulators. This initiative sets up a better cooperation between the regulators in the origin European countries and those in host-countries for the purpose of preventing erratic financial dealing.
The IFRS transition was guided by the National Bank of Romania (NBR) in such a way as to prevent any irregularities in computing prudential indicators. The International Standards assume that the allowances for loans are to be recorded as a consequence of a default event, while the former national regulations imposed that allowances were recorded based on expected losses. This used to lead to the ex ante recognition of losses in the financial statements, i.e: a decrease in annual profits. The concern was that, with the transition to IFRS, banks would increase their profits and thus improve their own funds position in the calculation of capital adequacy ratios. This was prevented by the NBR through the Order 26 issued in December 2011, which sets the framework for reporting of prudential filters, starting with January 2012. Based on the analysis performed on financial reporting as at 31 December 2011 and 31 March 2012, NBR decided to maintain prudential filters after 1 January 2013 as well.
Additional measures taken by NBR were targeted to the monitoring of correct capitalization of risks in the Romanian banking sector. Capitalization was, in 2012 like in previous periods, assured by the shareholders. Other capitalization movements referred to the take-over of Emporiki Bank Romania by the French group Credit Agricole and the recent takeover by Piraeus Bank of the good assets of ATE Bank (including the Romanian branch). These restructurings did not affect the capitalization ratios and did not assume state intervention. The net increases in the social capital of banks
reached EUR 550 million in the first semester of 2012. The solvency ratio reached a level of 14.7 in June 2012 (EU minimum level required: 8%).
The banks’ biggest problem was in 2012 the same as in the previous 2 years: the quality of the loan portfolio. The level of non-performing loans (NPLs) continued to grow in 2012 rising from a level of 14.3% in December 2011 to 16.8% in June 2012. The growth is due, in part, to the introduction of IFRS, whereby banks are obliged to recognize losses from loans previously recognized off-balance sheets. Also, in 2012, banks re-valued the performance of customers whose loans they had re-structured in previous years.
The transition to IFRS has been followed-up by the National Bank through the requirement of prudential filters, whereby banks are required to compute solvency ratios based on recognition criteria that are stricter than the ones required by IFRS. The latest stress-testing results show, that on a two years horizon, the Romanian banking entities have the capacity to overcome strong macro-economic shocks. These tests show that in the adverse scenario case where Romania re-enters the recession and the national currency incur heavy devaluation against foreign currencies, the solvency ratio would drop to 12.3%, maintaining an acceptable level.
In 2012, banks continued to record a majority of mortgage loans in their balance sheet. The mortgage loans granted to individuals in 2012 grew by RON 13 billion between January 2011 and June 2012. This was mainly due to the “First House” program. During this period, the program contributed with 53% to the total mortgage loans, in approximately 30,500 guarantees. These loans are, though, responsible for a significant increase in the NPL ratios, as the non-performing mortgage loans granted to individuals raised by 60% in the period to June 2012. Out of these loans, the most risky ones are the so-called “American Mortgages”: loans for personal needs, with real estate collaterals, as opposed to Housing Loans - loans used for the construction/acquisition of a real estate property. A similar situation occurs for mortgage loans granted to companies. The non performing loans have increased by 66.1% by June 2012. These movements in non-performing loans cannot be entirely imposed to the bank’s decision to invest, but more to the market trends between June 2011 and June 2012. The National Statistics Institute reported a drop of 15% in prices of real estate properties for the above mentioned period.
MCR BANKING & FINANCE
Banking in 2012:towards a more regulated market
Gabriela Bratu, Senior, Assurance & Advisory Business Services, Ernst & Young

Thus, the loan-to-value indicator (“LTV”) deteriorated in this period, by increasing from 71% to 78% for retail loans and from 70% to 75% for corporate loans.
This drop in real estate prices also worsened the banks’ exposure towards real estate companies. The NPL ratio for these loans rose from 18% in December 2010 to 28.4% in July 2012. Banks continue to support this sector by re-scheduling and restructuring the loans granted to developers. This year, 12% of total restructured loans were represented by loans
granted to the real estate sector. Banks continue also to grant new finance to this sector, as they believe that the market was not fully matured at the inception of the economic crisis, and it could re-start from where it has left, back in 2009-2010. Their beliefs is consolidated by the numbers in the construction and real-estate industry where there has been a raise in volume of work as well as an increase in number of employees and investment projects. Other analysts state, however, that this sector is still to fall, as construction authorizations have decreased in the previous 18 months.
The other major event in 2012 was the set-up of the legislative framework of the bridge bank. This is an instrument used by NBR to intervene promptly when one of the banks faces problems that might spread to the entire banking system. If such an event occurs, the NBR will immediately suspend the mandates of the problem-bank management and transfer all assets and liabilities to a newly formed entity – the bridge bank. This entity will have a two-tier administration board, the members of the Board being elected by NBR. The unique shareholder of this new entity will be the Banks Deposits Guarantee Fund who will also finance this new bank from its own private resources. Public funding could also be provided in the form of loans granted by the Ministry of Finance to the Fund. The new entity will function for a period of two years when the NBR should be able to find a new investor willing to take-over the assets and liabilities. This period could be prolonged if no such investor is found by the end of the two-year period. The troubled bank from which the assets and liabilities are taken over will be liquidated, as NBR will annul its authorization.
The legal framework that describes the functionality of the bridge-bank also brings forward new roles of NBR. The Romanian Banking regulator will be able from 2012, to suspend the banks’ shareholders’ right to vote , if it considers that their decision can endanger the prudential administration of the respective financial entity. Also, NBR is free to intervene whenever it observes a current or possible future “significant deterioration” of prudential indicators and conclude that the shareholders are not taking appropriate measures to improve these indicators.
With regards to the solvency ratios, NBR is also taking a more pro-active role, as it will be obliged to constitute special administration for banks whose capital adequacy ratios will fall lower than 75% of the minimum required level.
These set of measures are meant to strengthen the regulators’ role, as well as to improve the confidence level of foreign investors in the Romanian financial system. Once the world economy will start to recover from the outcome of the financial crisis, the investors will begin to look for new investment opportunities, but with a keener eye to regulated markets. Also, by functioning in this new regulatory framework, the banks themselves will re-educate their investment choices and will perhaps learn to identify and finance those healthy sectors of the real economy.
252012 EDITION Major Companies in Romania
Main prudential indicators Dec-10 Jun-11 Dec-11 Mar-12 Jun-12 Capital adequacy ratio 15.02% 14.19% 14.87% 14.63% 14.66% Leverage ratio 8.11% 7.79% 8.07% 8.60% 8.42% Loans to clients (% of total assets) 58.64% 59.86% 59.24% 61.42% 60.93% NPL ratio 11.85% 13.35% 14.33% 15.88% 16.76% Total number of overdue clients 218,370 240,097 224,599 239,571 244,820
Source: NBR

The moderate recovery in Emerging Europe is still threatened by continued uncertainty and recession in the Eurozone. Romania still has difficulties in boosting growth due to the overall uncertain international economic situation, along with the internal uncertainties. The political turmoil has diminished Romania’s credibility on the financial markets and in the eyes of potential investors. Because the private sector is directly confronted with the effects of the political turmoil and the deterioration of the economic environment, our voice will be stronger in expressing our worry with regard to the future of the business we make in Romania.
In this context, the business community in Romania announced the creation of a coalition for the economic growth and stability that gathers AmCham, The Council for Foreign Investors or the business bilateral chambers of commerce (Dutch, British, Canadian, Irish, Finnish, Danish) and has the support of the diplomatic missions to Romania of some EU member states as well as of US and Canada. We call for a strategic dialogue with the Government to improve the business environment, to raise the competitiveness of Romania on a international plan and to rebuild the trust in the Romanian economy.
We are a strong voice that can no longer be avoided because we represent the majority of the foreign investors in Romania created and continue to create thousands of work places for the citizens
of Romania and contribute significantly to the state budget. Despite the political landscape, Romania is still a good business opportunity. According to the European Attractiveness Survey 2012 report (Ernst & Young’s survey over 840 business leaders) Romania will be the sixth most attractive European country for investment over the next three years1. This is encouraging news for the foreign investors and it is a call for action for the political class, which should have no other concern than end the political turmoil and stop doing more damage to the economy and the country’s credibility.
Considering the fact that the FDIs dropped last year to the lowest value since 2003, we realize it is crucial to push through further structural reforms if it is to boost competitiveness and enable economic sustainable growth. Here are some priorities for action which relates one to the other:
legislative and regulatory processes is vital for the investors. Without a stable, clear and predictable regulatory framework, investors' interest to invest in a market is limited;
challenges related to labor legislation if it wants to improve productivity. Romania has productivity by 57% lower than the EU average. Delaying long-awaited reforms will diminish the competitive advantage of the labor market
Doing business in Romania
STEVEN VAN GRONINGEN,President Raiffeisen Bank Romania,President of Foreign Investors Council (FIC) in Romania
payments (113 payments are required during the course of a year which takes 222 hours (9 days) to make) - most of them relates to labor taxes and the fact that currently Romania has no functional electronic payment system available for companies. Therefore, rationalizing and simplifying the tax system should be a priority;
revitalize economy’s financing through capital markets; Romania still need to work hard to improve its capital markets, which remain less developed than those in other accession countries.
Romania has been ranked 77 out of 142 countries in the 2011-2012 Global Competitiveness Index Report issued by the World Economic Forum (WEF) - Romania lost 10 positions from the previous report. According to WEF, the most problematic factors for doing business in Romania: access to financing, tax rates, policy instability, tax regulations, inefficient government 38 bureaucracy, inadequate supply of infrastructure, corruption (based on average ranking in the last three Global Competitiveness Reports, 2009-2011). From now on, the Romanian government should give special attention to those measures that help rebuild the country’s credibility and contribute to sustainable economic growth.
1 The top five countries in the ranking are Germany, Poland, the United Kingdom, Russia and France. The study is based on methodology that includes an analysis of the number of foreign investment projects in 2011 and a soft analysis of the perception of the attractiveness of European countries for foreign investment. The country outperforms the Czech Republic, Turkey, Switzerland, the Netherlands, Italy, Spain and Sweden.
MCRMCR Opinion

BANKINGRANK COMPANY NAME MCR SCORING AT 2011 MARKET SHARE PROFIT/LOSS
RON 2011
PEERS MORE THAN 5% MARKET SHARE
1 RAIFFEISEN BANK SA 4.250 23,690,300,000 7% 320,068,972
2 BANCA TRANSILVANIA S.A. 4.000 25,745,200,000 7% 131,870,976
3 VOLKSBANK ROMANIA SA 3.750 17,728,100,000 5% -698,881,415
4 BRD - GROUPE SOCIETE GENERALE S.A. 3.500 48,027,700,000 14% 465,265,368
5 CEC BANK SA 3.500 24,815,600,000 7% 67,445,929
6 UNICREDIT TIRIAC BANK SA 3.500 22,346,500,000 6% 103,062,227
7 ALPHA BANK ROMANIA S.A. 3.500 16,544,100,000 5% -117,707,116
8 BANCA COMERCIALA ROMANA SA 3.250 71,054,800,000 20% -510,818,823
PEERS 1% - 4% MARKET SHARE
9 ING BANK N.V. AMSTERDAM SUCURSALA BUCURESTI 4.500 14,509,900,000 4% 129,611,734
10 RBS BANK (ROMANIA) SA 3.500 5,793,300,000 2% 100,068,925
11 BANCPOST S.A. 3.250 12,274,100,000 3% -11,016,904
12 GARANTI BANK SA 3.250 6,189,500,000 2% -79,438,040
13 CITIBANK EUROPE PLC, DUBLIN - SUCURSALA ROMANIA
3.250 5,752,400,000 2% 117,119,398
14 BANCA ITALO ROMENA SPA ITALIA VOLPAGO DEL MONTELLO SUCURSALA BUCURESTI
3.250 4,220,100,000 1% 30,683,869
15 PIRAEUS BANK ROMANIA S.A. 3.125 8,166,600,000 2% 42,057,757
16 BANK OF CYPRUS PUBLIC COMPANY LIMITED NICOSIA SUCURSALA ROMANIA
3.000 2,297,500,000 1% 24,929,252
17 BANCA DE EXPORT IMPORT A ROMANIEI (EXIMBANK) S.A.
2.500 4,174,500,000 1% 59,431,557
18 BANCA ROMANEASCA SA MEMBRA A GRUPULUI NATIONAL BANK OF GREECE
2.750 7,418,200,000 2% -122,611,967
19 CREDIT EUROPE BANK (ROMANIA) S.A. 2.750 4,751,600,000 1% -62,961,948
20 OTP BANK ROMANIA S.A. 2.750 3,745,900,000 1% -21,063,973
21 MARFIN BANK (ROMANIA) S.A 2.750 2,635,000,000 1% -15,162,761
22 BANCA COMERCIALA INTESA SANPAOLO ROMANIA S.A.
2.625 3,964,700,000 1% -254,956,765
23 BANCA COMERCIALA CARPATICA S.A. 2.250 3,787,100,000 1% -31,989,275
24 BANCA MILLENNIUM S.A. 2.250 2,087,800,000 1% -104,040,129
PEERS LESS THAN 1%
25 PROCREDIT BANK S.A. 2.750 1,126,600,000 0% 18,149,547
26 BCR BANCA PENTRU LOCUINTE S.A. 2.750 950,600,000 0% 11,983,539
27 CAIXABANK SA (BARCELONA) - SUCURSALA ROMANIA 2.500 564,500,000 0% 2,074,100
28 CREDIT AGRICOLE BANK ROMANIA S.A 2.250 1,104,800,000 0% -37,679,814
29 BANCA C.R. FIRENZE ROMANIA S.A 2.250 706,800,000 0% 1,039,889
30 BLOM BANK FRANCE SA PARIS SUCURSALA ROMANIA 2.250 626,800,000 0% 3,420,610
31 LIBRA INTERNET BANK S.A. 2.250 595,400,000 0% 10,180,829
32 ATE BANK ROMANIA SA 1.750 1,599,400,000 0% -204,792,307
33 BANK LEUMI ROMANIA S.A 1.750 1,128,100,000 0% -24,051,333
34 NEXTEBANK SA 1.750 1,122,700,000 0% -101,940,963
35 FORTIS BANK SA/NV BRUXELLES SUCURSALA BUCUR-ESTI
1.750 406,200,000 0% -147,758
36 PORSCHE BANK ROMANIA S.A. 1.750 384,800,000 0% 5,813,123
37 ROMANIAN INTERNATIONAL BANK S.A. 1.250 515,900,000 0% -13,498,368
38 RAIFFEISEN BANCA PENTRU LOCUINTE S.A. 1.250 323,700,000 0% 22,219
39 BANCA COMERCIALA FEROVIARA S.A 1.250 176,400,000 0% -17,096,788
SOURCE: NATIONAL BANK OF ROMANIA, TRADE REGISTER, MINISTRY OF FINANCE
272012 EDITION Major Companies in Romania

According to the results notified by the ISC President, Mr. Constantin Buzoiuanu within FIAR, the first quarter of 2012 brought a slight increase (0.55%) on the Romanian insurance market, for the first time since 2009. Is this the sign of a re-launching of the insurance industry? In spite of the uncertainties and the volatility which are the current features of the economic environment in the European Union and not only?
A study concerning the perspectives of the European insurance market published this January by Ernst & Young indicates 2012 to be the year of strategic decisions in an economic environment dominated by stagnation and even recession.
What have these three years of decline meant to the insurance industry? First of all, losses, especially for the companies providing general insurance, but also a trend of market consolidation, materialized in the three mergers that have rearranged the classifications in the Romanian specialized market.
The first important merger during this period took place in 2009 between Asiban and BT Asigurari – recently purchased by the French from Groupama. The French company has chosen to renounce to the two well-known local brands and to promote its own brand, unknown on the Romanian market until that time. The purchase of Asiban was a top transaction in 2008, having a value of above Euro 350 million. Even though, at that time, the effects of the crisis were not yet felt, we can say that Groupama had a vision and they moved fast towards integration and, by doing so, towards making potential synergies, especially in the cost area, but not only there. The French strategy seems to have worked, Groupama Asigurari ranking fourth in the general classification of insurance companies according to the gross premiums subscribed in 2011.
2010 was quiet from the merger and acquisition perspective, the only remarkable event being the entry of another French company on the Romanian market – AXA – by purchasing Omniasig Life, a small-sized insurer exclusively on the life insurance market. The transaction value was much lower this time - approx. Euro 5 million.
However, 2011 was fruitful from the perspective of the mergers between insurance companies belonging to the same
international group and being present on the Romanian market, with two announced mergers - one between Ardaf and Generali, both belonging to the Italian group Generali, which was closed in October 2011 and one between the two general insurance companies held by the Austrian group Vienna Insurance Group - BCR Asigurari and Omniasig, concluded at the end of April 2012.
What is the catalyst causing these international groups to regroup on the local markets and rethink and rationalize the "corporate” structure? The reasons must be searched, first of all, in the current economic situation. We refer here to the extended recession, combined with the worsening of the capitalization requirements (and not only), caused by the implementation of the Solvency II regulations.
The international groups which, until recently, were present on the local market with three or four companies having more or less similar strategies and objectives, have reanalyzed their position and strategic choices and reached the conclusion that cost cuttings, as well as the capitalization requirements that could result from merging the activity into a single legal entity, are not at all negligible.
Strictly from the legal perspective such a merger is neutral and its impact on the market is not considered to be an economic concentration, but merely group reorganization. However, from a competitive point of view, the resulting company is usually better placed on the market than the ones it derives from, and this not only as a result of elementary arithmetic 1+1=2, but also from making the synergies between the merged companies happen.
From the perspective of mergers and acquisitions in the insurance sector, 2012 started with the announcement of the MetLife takeover of the operations of Aviva Romania, Czech Republic and Hungary (the total value of the amount USD 75.3 million or about Euro 57 million at the exchange rate valid on the date of transaction announcement), which was the first transaction of this kind between life insurance companies on the Romanian market. The transaction was closed at the end of August and the next logical expected move is the group structure rationalization and the merger between the two entities. Another but less important transaction on the market of general insurance was announced in March – the takeover of the
MCR BANKING & FINANCE
2012 On the Merger and Acquisition market in the insurance sector – The re-launching year?
Cristina Cerbu, Manager, Transaction Advisory Services, Ernst & Young

majority stock (98.57%) of ABC Asigurari by the businessman Nelu Iordache for Euro 6.7 million.
The Germans from Gothaer also entered the Romanian market by purchasing the majority stock (67%) in another small-sized general insurance company – Platinum Asigurari – Reasigurari (one of the main charter members of the Insurance Pool Against Natural Disasters [PAID] with a 15% shareholding - the maximum legal threshold). The transaction was also finalized in March 2012. These transactions prove there is an appetite for acquisitions on the Romanian market and also available funding, but we consider it to be rather premature to speak about a trend in this regard.
At least two of the insurance companies on the Romanian market – Alico (MeLife) and AXA – have publicly stated their interest for growth by way of acquisitions, to the extent the market provides interesting opportunities. According to a past statement, Allianz does not exclude acquisitions as an instrument for portfolio extension on the Romanian market, either.
However, the fact that the performance of other transactions in the period to come depends greatly also on the existence of quality assets/target companies on the market must be mentioned.
Such a target company is ING Asigurari de Viata – the company ranking first in the classification of Romanian life insurers – given the Dutch financial group has recently confirmed they intended to sell the insurance divisions in Europe, North America and Asia, as a part of the restructuring process agreed with the Dutch State.
The insurance companies with Greek majority shareholding are also potential targets for mergers and acquisitions on the background of the problems currently faced by the Greek State, which are obviously impacting on the financial institutions in this area and not only on them. If there are interested investors, the shareholders of these companies could become very motivated in selling their interests in the companies held in Romania in order to generate cash.
These recent developments aim at confirming the conclusions of another Ernst & Young study Global Capital Confidence Barometer - 5th edition. They foresee a paradigm change, namely, the mergers and acquisitions coexisting with volatility in the economic and financial environment, because the large players have learned to run their businesses under volatility conditions and have developed their ability and ambition to perform strategic transactions in the current circumstances.
292012 EDITION Major Companies in Romania

Although compared to Western Europe, the Romanian insurance market is still underdeveloped, there is no doubt that it has a significant growth potential on medium and long term, if we consider the low level of insurance penetration and the higher competition in the last few years. Yet, in the current crisis context, there are factors that are slowing its growth.
Overall, insurers have been less directly exposed to the international financial crisis, due to conservative investment policies, provisions and restrictions imposed by the Romanian legislation on the investment of assets, portfolio diversification, the interdiction or limitation of alternative investment instruments. The profitability of insurance business decreased due to the crisis, mainly in life insurance sector, by a poor performance of the investments due to falling of the stock market indices and financial market volatility.
The reasons are largely related to the lack or the inadequacy of fiscal incentives, lack of financial resources, bad understanding of the need for insurance policies, lack of tradition in life insurance system plus motivations related to the economic crisis and the worsening economic activities, to the high debt accumulated by the population along the pre-crisis years, the negative growth of the credit institution, low income levels and uncertainty about financial security and even a decreasing level of trust in the insurance concept.
The downfall of the Romanian insurance market was also triggered by the decrease of the corporate sector spending. The straight focused effects of the crisis on companies have also been influenced by the financial statement of the clients. The decreasing of incomes, thus of disposable reserves dedicated to achieving insurance products and the changes in financial priorities contributed to a significant negative growth of sales. Besides the facts listed above, the uncertain political environment, as well as the situation in the Euro Zone, also contributed to a reluctance of companies and individuals towards acquiring a life insurance. However, there were also short- term positive effects of the crisis on the insurance business as the companies learned to survive and continue their business. The offer of insurance products has kept on growing; the insurers have launched new products meant to exploit their opportunities for expansion, offsetting the poor demand for traditional insurance products with a fast development of more flexible and less costly products for their clients. The
Opinion
2012, a year of challenges in insurance marketVIOLETA CIUREL,
President and CEO,AXA Life Insurance
diversification of the distribution channels, more focused on on-line sales, communication and higher quality services for clients with lower costs and increased flexibility are therefore positive effects of the crisis.
Acquisitions and mergers have started, and it is possible to continue in the coming years, leading to a higher consolidation of the market. As I mentioned before, there is a high potential for the growth of the life insurance industry on the Romanian market. The level of insurance penetration for Romania is under 2% compared with an 8% average at European level. Last year, the entire Romanian insurance market was about 1.7 mld EUR with less than 20% life insurance. I anticipate a stagnation on the overall market for the next year mainly because of the global economic environment, Euro crisis, lower investment level and, because of the low level of the direct foreign investments. These influencing factors, as well as the very low degree of absorption of European funds add up to those already mentioned earlier.
MCR
“IN THE NEXT YEARS, THE ROMANIAN INSURANCE MARKET TARGETS THE INCREASE OF EFFICIENCY AND PERFORMANCE, THE REVIEW OF DISTRIBUTION CHANNELS AND THE MORE FREQUENT USE OF BANCASSURANCE, AS AN INSURANCE DISTRIBUTION CHANNEL.”

INSURANCERANK COMPANY NAME GWP 2011 GWP 2010 GWP GROWTH % PROFIT/LOSS 2011 CONTACT
1 OMNIASIG VIENNA INSURANCE GROUP SA 1,202,571,506 * 916,123,674 - -181,296,117 Sector 1, BUCURESTI
2 SOCIETATEA COMERCIALA DE ASIGURARE-REASIGURARE ASTRA SA
1,008,544,317 1,083,209,476 -6.9% 81,013,945 Sector 3, BUCURESTI
3 ALLIANZ - TIRIAC ASIGURARI S.A. 898,416,364 1,020,399,089 -12.0% 24,513,434 Sector 1, BUCURESTI
4 GROUPAMA ASIGURARI S.A. 708,275,597 779,579,143 -9.1% -102,210,913 Sector 1, BUCURESTI
5 ASIGURAREA ROMANEASCA - ASIROM VIENNA INSURANCE GROUP SA
627,995,991 530,864,076 18.3% 7,220,520 Sector 2, BUCURESTI
6 ING ASIGURARI DE VIATA S.A. 554,442,021 543,411,301 2.0% 14,709,378 Sector 5, BUCURESTI
7 GENERALI ROMANIA ASIGURARE REASIGURARE S.A.
511,437,851** 439,906,318 - -83,168,067 Sector 1, BUCURESTI
8 UNIQA ASIGURARI SA 383,348,634 432,393,663 -11.3% -73,071,009 Sector 1, BUCURESTI
9 BCR ASIGURARI DE VIATA VIENNA INSURANCE GROUP S.A.
344,646,130 307,345,995 12.1% 19,621,166 Sector 1, BUCURESTI
10 EUROINS ROMANIA ASIGURARE-REASIGURARE S.A.
292,275,460 301,017,000 -2.9% -36,639,682 Voluntari, ILFOV
11 ALICO ASIGURARI ROMANIA S.A 206,948,419 205,028,899 0.9% 74,029,543 Sector 1, BUCURESTI
12 CARPATICA ASIG S.A. 199,855,904 291,981,491 -31.6% -4,553,952 Sibiu, SIBIU
13 SOCIETATEA DE ASIGURARE-REASIGURARE CITY INSURANCE SA
199,824,532 63,106,891 216.6% 17,190,521 Sector 1, BUCURESTI
14 GARANTA ASIGURARI S.A. 81,329,269 96,960,026 -16.1% 992,099 Sector 1, BUCURESTI
15 AVIVA ASIGURARI DE VIATA SA 73,296,035 88,893,859 -17.5% -6,623,031 Sector 1, BUCURESTI
16 ASITO KAPITAL S.A. 57,221,337 41,045,467 39.4% 1,161,978 Sector 1, BUCURESTI
17 GRAWE ROMANIA ASIGURARE S.A 55,081,650 60,691,937 -9.2% 3,093,690 Sector 3, BUCURESTI
18 CHARTIS ROMANIA SA 48,111,070 72,801,905 -33.9% 4,458,172 Sector 1, BUCURESTI
19 BRD ASIGURARI DE VIATA S.A. 44,287,809 18,388,684 140.8% -789,510 Sector 5, BUCURESTI
20 EUREKO ASIGURARI S.A. 42,039,722 41,356,216 1.7% -5,660,466 Sector 3, BUCURESTI
21 POOL - UL DE ASIGURARE IMPOTRIVA DEZASTRELOR NATURALE S.A.
35,310,758 29,556,829 19.5% 970,922 Bucureti, Sector 1
22 CREDIT EUROPE ASIGURARI-REASIGURARI SA 34,324,574 38,235,995 -10.2% 1,467,681 Sector 6, BUCURESTI
23 CERTASIG - SOCIETATE DE ASIGURARE SI REASIGURARE S.A.
29,875,275 20,715,448 44.2% 1,710,902 Sector 1, BUCURESTI
24 ERGO ASIGURARI DE VIATA S.A. 27,140,761 17,012,617 59.5% -6,053,918 Sector 1, BUCURESTI
25 AXA LIFE INSURANCE S.A. 24,813,663 20,299,470 22.2% -39,472,779 Sector 1, BUCURESTI
26 FATA ASIGURARI S.A. 20,724,549 19,295,510 7.4% -3,556,350 Sector 2, BUCURESTI
27 PLATINUM ASIGURARI REASIGURARI S.A. 18,083,610 17,202,117 5.1% 295,851 Sector 4, BUCURESTI
28 ABC ASIGURARI - REASIGURARI SA 16,338,039 18,153,797 -10.0% -395,512 Sector 1, BUCURESTI
29 SOCIETATEA DE ASIGURARE-REASIGURARE LIG INSURANCE S.A.
14,106,039 356,635 3855.3% 887,718 Sector 1, BUCURESTI
30 EFG EUROLIFE ASIGURARI DE VIATA S.A. 10,183,405 11,932,438 -14.7% 635,477 Sector 2, BUCURESTI
31 CARDIF ASIGURARI S.A. 9,690,609 16,665,742 -41.9% -583,271 Sector 1, BUCURESTI
32 AEGON ASIGURARI DE VIATA S.A. 9,616,464 4,697,540 104.7% -8,115,789 Cluj-Napoca, CLUJ
33 COMPANIA DE ASIGURARI-REASIGURARI EXIM ROMANIA (CARE-ROMANIA) S.A.
8,484,688 429,605 1875.0% -8,165,234 Sector 1, BUCURESTI
34 SIGNAL IDUNA ASIGURARI DE VIATA S.A. 8,035,695 2,023,495 297.1% -11,067,854 Sector 1, BUCURESTI
35 EFG EUROLIFE ASIGURARI GENERALE S.A 5,262,725 5,501,833 -4.3% 1,409,776 Sector 2, BUCURESTI
36 FORTE ASIGURARI - REASIGURARI SA 4,601,296 3,413,923 34.8% -2,349,329 Bucureti, Sector 1
37 ATE INSURANCE ROMANIA S.A. 1,933,692 2,518,237 -23.2% -292,522 Sector 1, BUCURESTI
38 GERMAN ROMANIAN ASSURANCE S.A. 1,560,863 1,195,704 30.5% 73,499 Bucureti, Sector 3
39 ASIGURARE REASIGURARE ASIMED S.A. 1,230,668 1,307,891 -5.9% 215,443 Sector 1, BUCURESTI
40 UNIQA ASIGURARI DE VIATA S.A. 1,042,961 10,629 9712.4% -4,895,176 Sector 2, BUCURESTI
41 ONIX ASIGURARI S.A. - 1,221,409 -3,960,579 Pitesti, ARGES
* GWP together with BCR ASIGURARI VIENNA INSURANCE GROUP SA ** together with GENERALI ASIGURARI SA (fosta ARDAF)Source: Insurance Supervisory Commission - Annual Reports
312012 EDITION Major Companies in Romania

What are the news from 2011 financial leasing market? The good news is that it found its way in the current economic situation, although its weight in GDP continued to decrease to 2.9% as at the end of 2011 from 3.7% at the end of 2010.
In 2011, the leasing companies wrote new business worth EUR 1.35 billion- a slight increase compared to 2010 (EUR 1.12 billion), but also a decrease in volume of contracts in default.
Market structure by leased asset type continues to be dominated by vehicles – 68% (from 63% in 2010), followed by equipment – 25% (from 21% in 2010) and real estate - 7% (16% in 2010). However, inside these broad categories, some positive evolutions can be noted.
The weight of heavy commercial vehicles grew from 23% to 29% of new business written in 2011 on vehicles, while new business on passenger cars decreased from 61% to 57%.
Under the equipment category there are three sectors that captured the leasing companies’ attention: agriculture jumps on the first place with 24% of the financing granted in 2011 (from 8% in 20120), while constructions stepped down to second place, with 19%, although in 2010 this sector positioned first with only 13% of granted financing. Electrical devices attracted 10%, climbing from 4% in 2010, due to the boom in the renewable energy in Romania.
Under real estate, the financing of industrial buildings has jumped from 17% in 2010 to 36% in 2011, driven by the need of
the companies to access new financing sources, namely sale and leaseback, as well as the enhanced prudential regulations of the National Bank of Romania (NBR).
These evolutions indicate that leasing companies have oriented their policies to grant financing for the production sector rather than for the consumption one.
In terms of ownership structure, banks’ subsidiaries continue to lead the market with 67% of the new business written in 2011, followed by captive leasing companies (19%) and independent companies (14%).
Top 5 has not changed in 2011 as compared to 2010. As shown in the table, Unicredit Leasing continues to be the leader of the financial leasing market, although its turnover has gone down by 4%, compared to last year. The downwards trend is present for the other leasing companies in the top as well, even steeper than for the leader (i.e. two digits decrease).
However, smaller leasing companies, like BNP Paribas and ING Lease, achieved a two digits turnover growth in 2011, of 43% and 38% respectively.
We can finally conclude that the financial leasing market did not bring any surprises or spectacular evolutions in 2011 and we expect it to perform similarly in 2012.
Data source: Asociatia Societatilor Financiare – ALB Romania website www.alb-leasing.ro, NBR’s Report on financial stability
MCR BANKING & FINANCE
Financial leasing companies target – survival
Cristina Cerbu, Manager, Transaction Advisory Services, Ernst & Young

FINANCIAL LEASINGRANK COMPANY NAME ANNUAL TURNOVER
2011 ANNUAL TURNOVER
2010 ANNUAL TURNOVER
GROWTH %PROFIT/LOSS
2011 CONTACT
1 UNICREDIT LEASING CORPORATION IFN SA 222,674,079 232,619,963 -4.3% 1,372,223 Bucuresti, Sector 1
2 IVECO CAPITAL LEASING IFN SA 130,960,351 164,284,777 -20.3% -516,927,222 Bucuresti, Sector 1
3 BCR LEASING IFN SA 106,813,007 159,324,170 -33.0% -42,893,109 Bucuresti, Sector 3
4 PORSCHE LEASING ROMANIA IFN SA 96,743,187 122,295,260 -20.9% 9,609,440 Voluntari, ILFOV
5 NBG LEASING IFN SA 81,645,644 102,772,500 -20.6% -95,712,694 Bucuresti, Sector 1
6 BRD SOGELEASE IFN SA 75,295,923 96,561,731 -22.0% 19,143,656 Bucuresti, Sector 1
7 PIRAEUS LEASING ROMANIA IFN SA 64,283,619 91,391,431 -29.7% -8,922,936 Bucuresti, Sector 1
8 VB LEASING ROMANIA IFN SA 64,275,708 74,209,031 -13.4% 41,095,214 Bucuresti, Sector 1
9 RCI LEASING ROMANIA IFN SA 61,851,437 91,398,817 -32.3% 30,623,087 Bucuresti, Sector 1
10 RAIFFEISEN LEASING IFN SA 49,855,809 41,827,581 19.2% 2,679,011 Bucuresti, Sector 2
11 IMPULS - LEASING ROMANIA IFN SA 47,568,889 46,405,634 2.5% 18,970,883 Bucuresti, Sector 2
12 MOTORACTIVE IFN SA 42,092,263 55,094,108 -23.6% 15,781,097 Bucuresti, Sector 2
13 TIRIAC LEASING IFN SA 38,302,314 63,543,082 -39.7% 5,642,124 Bucuresti, Sector 6
14 EFG LEASING IFN SA 36,567,646 40,127,615 -8.9% -18,889,811 Bucuresti, Sector 2
15 VFS INT ROMANIA IFN SA 35,877,188 63,786,650 -43.8% 72,149,502 Bucuresti, Sector 6
16 DEUTSCHE LEASING ROMANIA IFN SA 30,909,348 24,504,491 26.1% -3,123,554 Bucuresti, Sector 2
17 BT LEASING TRANSILVANIA IFN SA 29,874,855 32,769,017 -8.8% 10,704,507 Cluj-Napoca, CLUJ
18 ING LEASE ROMANIA IFN SA 27,807,096 20,150,811 38.0% 13,723,108 Bucuresti, Sector 1
19 AGER LEASING IFN SA 25,481,091 31,528,493 -19.2% 3,703,082 Bucuresti, Sector 1
20 BNP PARIBAS LEASE GROUP IFN SA 23,914,979 16,671,444 43.4% 11,616,317 Bucuresti, Sector 1
21 CREDIT EUROPE LEASING IFN SA 21,051,788 48,794,736 -56.9% 2,235,294 Bucuresti, Sector 6
22 RSL LEASING IFN SA 20,285,791 42,756,548 -52.6% 23,515,097 Bucuresti, Sector 1
23 TBI LEASING IFN SA 17,446,569 29,072,283 -40.0% 9,648,682 Bucuresti, Sector 1
24 OTP LEASING ROMANIA IFN SA 17,157,620 29,472,173 -41.8% -527,340 Bucuresti, Sector 1
25 ERSTE GROUP IMMORENT ROMANIA IFN SA 16,511,037 15,312,769 7.8% 3,447,329 Bucuresti, Sector 2
26 FORTIS LEASE ROMANIA IFN SA 14,535,053 20,749,326 -29.9% -11,313,391 Bucuresti, Sector 1
27 MKB ROMEXTERRA LEASING IFN SA 13,033,502 25,122,394 -48.1% -14,735,406 Bucuresti, Sector 5
28 ALPHA LEASING ROMANIA IFN SA 12,730,111 18,724,080 -32.0% -12,545,423 Bucuresti, Sector 1
29 TEZAUR IMOBILIARE IFN SA 10,612,255 - 4,965,331 Bucuresti, Sector 1
332012 EDITION Major Companies in Romania

The operational leasing market in Romania, including also the fleet management services has room for improvement and growth. I estimate that this segment will surely continue to expand, as there is a large growth potential in Romania for operational leasing and fleet management services.
LOCAL MENTALITY CHANGE, IN PROGRESSAfter S1, there were 41,000 vehicles managed by the operational leasing companies, based on the ASLO (The Association of the Operational Leasing Companies (ASLO) statistics and if we consider the growth rhythms of the last couple of years, we would estimate a market increase in Romania of around 15 percent for the next year.
There is still a slight reluctance from the local companies to switch to operational leasing, which is technically a long term rental of a vehicle, for a certain duration and mileage with associated vehicle services and where title of ownership does not pass to the client. This mentality change is in progress and we expect more and more fleet managers to become aware of the benefits provided by this form of vehicle financing.
Other aspects, which may characterize the local market landscape, refer to the legal environment concerning operational leasing, which requires modifications that can highlight the particularities of operational leasing compared to financial leasing. The market is still in progress of
consolidation and we often notice the insufficient adaptation of the vehicle services suppliers to this type of product, where they should better adjust their working procedures and provide the quality service level that the clients expect. Nevertheless, as more and more companies and especially multinational ones demand the product, the market is steadily progressing and adapting to their needs.
EYES AT TCOConsidering the evolution so far, the focus for next year will be to build the further advance on the market with high quality operational leasing and customer care services, innovative solutions for vehicle mobility and driver’s communication, while ensuring our customers a satisfactory TCO (Total Cost of Ownership) for their car fleet. The defensive driving program, launched last year in partnership with Titi Aur, is a solution for optimizing TCO by improving the drivers’ behavior, while increasing their road safety.
Although the car market in Romania has seen a significant decline in new car registrations year on year since 2008, this has mainly been due to retail sales and consumer loans. The corporate sector itself has seen the opposite effect, where company cars are still required but the method of funding has seen a radical change.
Furthermore, the client portfolio is developing in a similar rhythm as last
MCR Opinion
Solid reasons to grow SHANE DOWLING,
General Manager, ALD Automotive
year while the renewal rate, which is a reference indicator in operational leasing that determines the ratio of renewed vehicle contracts from the amount of terminated contracts, has considerably increased. This year we’ve noticed so far an 86 percent renewal rate, which is 13 points higher than the one at end of 2011.
Last year in particular has seen a substantial rise in operational leasing as a form of funding. This is due to various reasons, primarily liquidity shortage and fleet cost optimization. For this year, these will remain the main triggers of market growth. Furthermore, local companies seem to be becoming more aware of the benefits of the operational leasing products, and international companies, accustomed to this type of vehicle financing, are mandating this solution more on the Romanian market. In 2012, we have noticed a positive evolution in the used car sale activity, even though the Romanian second hand car market volume has increased this year mainly due to imported vehicles. After Q3, there were roughly 1,200 ALD used vehicles sold online, via the ALD carmarket bidding website, which is comparable to the total amount sold online in 2011.
“LAST YEAR IN PARTICULAR HAS SEEN A SUBSTANTIAL RISE IN OPERATIONAL LEASING AS A FORM OF FUNDING. THIS IS DUE TO VARIOUS REASONS, PRIMARILY LIQUIDITY SHORTAGE AND FLEET COST OPTIMIZATION.”

ALD Automotive and Wheels Inc., its North American partner,
have formed a strategic alliance with FleetPartners,
a market leader of the fleet management industry in Australia and New Zealand.
The partnership provides ALD Automotive with crucial local support
for international customers with operations in the emerging Asia-Pacific region.
Today, we offer you the broadest worldwide coverage, with integrated fleet
and account management of over 1.3 million vehicles in 43 countries,
including the fast-growing markets of Brazil, Russia, India and China.
www.aldautomotive.com
Water covers 70% of the earth
To navigate the rest, count on us

OPERATIONAL LEASINGRANK COMPANY NAME ANNUAL TURNOVER
2011 ANNUAL TURNOVER
2010 ANNUAL TURNOVER
GROWTH %PROFIT/LOSS
2011 CONTACT
1 ALD AUTOMOTIVE SRL 146,534,829 137,615,126 6.5% 22,817,126 Bucuresti, Sector 3
2 LEASEPLAN ROMANIA SRL 131,300,336 94,225,449 39.3% 9,023,388 Bucuresti, Sector 2
3 ARVAL SERVICE LEASE ROMANIA SRL 100,379,695 91,683,422 9.5% 3,591,462 Bucuresti, Sector 1
4 FELBERMAYR ROMANIA SRL 77,610,479 76,443,892 1.5% -11,885,832Dragomiresti-Deal,
ILFOV
5 ECS INTERNATIONAL ROMANIA SA 68,743,269 43,094,851 59.5% 640,940 Bucuresti, Sector 1
6 PORSCHE MOBILITY SRL 66,572,992 57,557,875 15.7% 18,384,516 Voluntari, ILFOV
7 NEW KOPEL ROMANIA SRL 59,860,233 55,467,013 7.9% 5,307,528 Otopeni, ILFOV
8 ROLLING STOCK COMPANY SA 51,834,741 27,363,952 89.4% -6,765,288 Bucuresti, Sector 1
9 DOSCO PETROSERVICES ROMANIA SRL 46,491,862 41,857,447 11.1% 3,293,346 Bucuresti, Sector 1
10 AUTOTECHNICA FLEET SERVICES SRL 37,846,814 30,981,246 22.2% 3,455,673 Otopeni, ILFOV
11 IOT - DOSCO SRL 37,716,546 29,630,990 27.3% 4,271,478 Bucuresti, Sector 1
12 AGER BUSINESS TECH SA 35,840,045 54,952,369 -34.8% 1,626,707 Bucuresti, Sector 4
13 RCI FINANTARE ROMANIA SRL 34,584,167 22,872,234 51.2% 21,481,539 Bucuresti, Sector 1
14 BRD SOGELEASE ASSET RENTAL SRL 33,778,170 27,576,988 22.5% 2,255,520 Bucuresti, Sector 1
15 INDUSTRIAL ACCESS SA 32,744,234 19,538,065 67.6% 4,199,557 Bucuresti, Sector 2
16 MY CAR TRADING SRL 28,866,715 19,479,346 48.2% 1,925,443 Pitesti, Arges
17 PREMIUM LEASING SRL 27,899,779 19,224,071 45.1% 1,438,489 Bucuresti, Sector 1
18 UNICREDIT LEASING FLEET MANAGEMENT SRL 27,806,706 27,060,225 2.8% 5,035,638 Bucuresti, Sector 1
19 AUTONOM SERVICES SRL 23,788,362 12,263,755 94.0% 401,092 Piatra Neamt, Neamt
20 PERI ROMANIA SRL 19,614,883 13,352,496 46.9% 2,988,488 Balotesti, ILFOV
21 DOKA ROMANIA TEHNICA COFRAJELOR SRL 18,878,825 13,454,257 40.3% 280,382 Tunari, ILFOV
22 AVIROMS RENT-A-CAR SRL 18,704,936 16,312,383 14.7% -2,196,833 Bucuresti, Sector 3
23 OPERATIONAL AUTOLEASING SRL 18,519,000 13,147,946 40.9% 2,790,281 Scheia, SUCEAVA
24 GE EQUIPMENT SERVICES RO SRL 18,457,569 15,371,483 20.1% 1,897,091 Bucuresti, Sector 1
25 FEROCARGO EUROTRANS SRL 17,864,193 10,727,802 66.5% 2,484,804 Ploiesti, PRAHOVA
26 CARPAT BETON SERVICII POMPE SRL 17,220,630 4,899,936 251.4% 120,286 Mogosoaia, ILFOV
27 GRENKELEASING SRL 15,995,280 9,984,569 60.2% 329,184 Bucuresti, Sector 3
28 RAD-TRANS SRL 15,966,917 17,862,903 -10.6% 577,734 Bacau, BACAU
29 ALGECO SRL 14,287,487 10,712,717 33.4% -1,487,599 Sibiu, Sibiu
30 DANUBE CRUISES ROMANIA SRL 13,997,905 10,462,242 33.8% 84,521 Bucuresti, Sector 3
31 MANULOC ROMANIA SRL 13,365,192 9,977,568 34.0% 218,834 Bucuresti, Sector 2
32 BT FINOP LEASING SA 12,664,666 11,028,750 14.8% 772,020 Bucuresti, Sector 1
33 FLEET MANAGEMENT SERVICES SRL 11,210,552 8,218,271 36.4% 755,600 Bucuresti, Sector 5
34 DIRENT GROUP SA 11,015,342 13,772,672 -20.0% 615,765 Bucuresti, Sector 3
35 MEDICAL DEVELOPMENT SISTEM SRL 10,874,169 1,230,552 783.7% 37,197 Bucuresti, Sector 5
36 KASIM EMAKA SRL 10,853,984 1,838,736 490.3% 841,345 Brasov, BRASOV
37 OXIGEN PLUS SRL 10,327,271 8,795,530 17.4% 2,237,973 Bucuresti, Sector 5
38 CIM SERVICE SPED SRL 10,002,271 7,171,480 39.5% 4,246 Cluj Napoca, Cluj
39 360 REVOLUTION SRL 9,748,518 5,314,710 83.4% 180,154 Ploiesti, PRAHOVA
40 LEA INTERNATIONAL LEASING SA 9,506,145 8,918,511 6.6% 133,708 Bucuresti, Sector 2
MCR BANKING & FINANCE

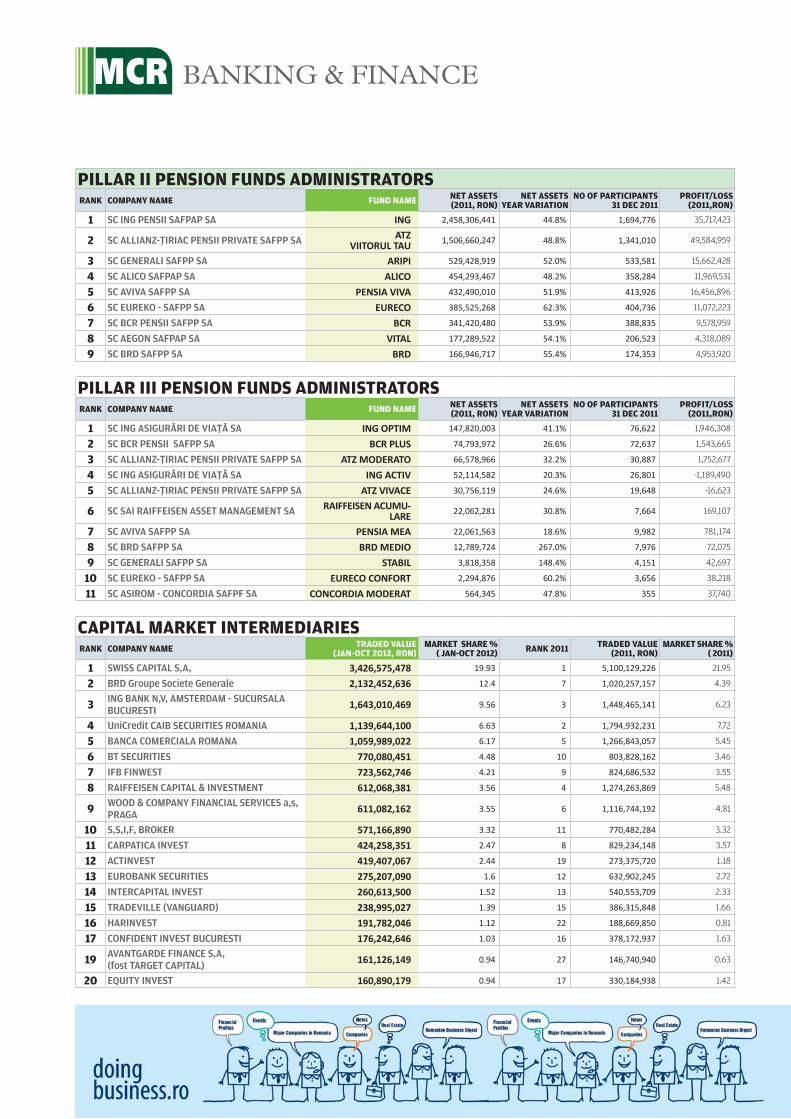
MCR BANKING & FINANCE
PILLAR II PENSION FUNDS ADMINISTRATORSRANK COMPANY NAME FUND NAME NET ASSETS
(2011, RON)NET ASSETS
YEAR VARIATIONNO OF PARTICIPANTS
31 DEC 2011PROFIT/LOSS
(2011,RON)
1 SC ING PENSII SAFPAP SA ING 2,458,306,441 44.8% 1,694,776 35,717,423
2 SC ALLIANZ-}IRIAC PENSII PRIVATE SAFPP SAATZ
VIITORUL TAU 1,506,660,247 48.8% 1,341,010 49,584,959
3 SC GENERALI SAFPP SA ARIPI 529,428,919 52.0% 533,581 15,662,428
4 SC ALICO SAFPAP SA ALICO 454,293,467 48.2% 358,284 11,969,531
5 SC AVIVA SAFPP SA PENSIA VIVA 432,490,010 51.9% 413,926 16,456,896
6 SC EUREKO - SAFPP SA EURECO 385,525,268 62.3% 404,736 11,072,223
7 SC BCR PENSII SAFPP SA BCR 341,420,480 53.9% 388,835 9,578,959
8 SC AEGON SAFPAP SA VITAL 177,289,522 54.1% 206,523 4,318,089
9 SC BRD SAFPP SA BRD 166,946,717 55.4% 174,353 4,953,920
PILLAR III PENSION FUNDS ADMINISTRATORSRANK COMPANY NAME FUND NAME NET ASSETS
(2011, RON)NET ASSETS
YEAR VARIATIONNO OF PARTICIPANTS
31 DEC 2011PROFIT/LOSS
(2011,RON)
1 SC ING ASIGUR~RI DE VIA}~ SA ING OPTIM 147,820,003 41.1% 76,622 1,946,308
2 SC BCR PENSII SAFPP SA BCR PLUS 74,793,972 26.6% 72,637 1,543,665
3 SC ALLIANZ-}IRIAC PENSII PRIVATE SAFPP SA ATZ MODERATO 66,578,966 32.2% 30,887 1,752,677
4 SC ING ASIGUR~RI DE VIA}~ SA ING ACTIV 52,114,582 20.3% 26,801 -1,189,490
5 SC ALLIANZ-}IRIAC PENSII PRIVATE SAFPP SA ATZ VIVACE 30,756,119 24.6% 19,648 -16,623
6 SC SAI RAIFFEISEN ASSET MANAGEMENT SA RAIFFEISEN ACUMU-
LARE 22,062,281 30.8% 7,664 169,107
7 SC AVIVA SAFPP SA PENSIA MEA 22,061,563 18.6% 9,982 781,174
8 SC BRD SAFPP SA BRD MEDIO 12,789,724 267.0% 7,976 72,075
9 SC GENERALI SAFPP SA STABIL 3,818,358 148.4% 4,151 42,697
10 SC EUREKO - SAFPP SA EURECO CONFORT 2,294,876 60.2% 3,656 38,218
11 SC ASIROM - CONCORDIA SAFPF SA CONCORDIA MODERAT 564,345 47.8% 355 37,740
CAPITAL MARKET INTERMEDIARIESRANK COMPANY NAME TRADED VALUE
(JAN-OCT 2012, RON) MARKET SHARE %
( JAN-OCT 2012) RANK 2011 TRADED VALUE (2011, RON)
MARKET SHARE % ( 2011)
1 SWISS CAPITAL S,A, 3,426,575,478 19.93 1 5,100,129,226 21.95
2 BRD Groupe Societe Generale 2,132,452,636 12.4 7 1,020,257,157 4.39
3 ING BANK N,V, AMSTERDAM - SUCURSALA BUCURESTI
1,643,010,469 9.56 3 1,448,465,141 6.23
4 UniCredit CAIB SECURITIES ROMANIA 1,139,644,100 6.63 2 1,794,932,231 7.72
5 BANCA COMERCIALA ROMANA 1,059,989,022 6.17 5 1,266,843,057 5.45
6 BT SECURITIES 770,080,451 4.48 10 803,828,162 3.46
7 IFB FINWEST 723,562,746 4.21 9 824,686,532 3.55
8 RAIFFEISEN CAPITAL & INVESTMENT 612,068,381 3.56 4 1,274,263,869 5.48
9 WOOD & COMPANY FINANCIAL SERVICES a,s, PRAGA
611,082,162 3.55 6 1,116,744,192 4.81
10 S,S,I,F, BROKER 571,166,890 3.32 11 770,482,284 3.32
11 CARPATICA INVEST 424,258,351 2.47 8 829,234,148 3.57
12 ACTINVEST 419,407,067 2.44 19 273,375,720 1.18
13 EUROBANK SECURITIES 275,207,090 1.6 12 632,902,245 2.72
14 INTERCAPITAL INVEST 260,613,500 1.52 13 540,553,709 2.33
15 TRADEVILLE (VANGUARD) 238,995,027 1.39 15 386,315,848 1.66
16 HARINVEST 191,782,046 1.12 22 188,669,850 0.81
17 CONFIDENT INVEST BUCURESTI 176,242,646 1.03 16 378,172,937 1.63
19 AVANTGARDE FINANCE S,A, (fost TARGET CAPITAL)
161,126,149 0.94 27 146,740,940 0.63
20 EQUITY INVEST 160,890,179 0.94 17 330,184,938 1.42

FUND MANAGEMENT
ASSET MANAGEMENT COMPANIES
UCITS NON UCITS
ASSETS UNDER MANAGEMENT
MARKET SHARE F.I.C. CLOSED
END FUNDS
DISCRETIONARY PORTFOLIO
MANAGEMENT
TOTALASSETS
MARKET SHARE
1 Raiffeisen Asset Management 2658,1 33,71 112,9 37,4 2808,4 19,24
2 ERSTE Asset Management 2782,4 35,29 x 2,4 2784,8 19,08
3 Societatea de Investitii Financiare Oltenia 1444,2* X 1444,2 9,89
4 Societatea de Investitii Financiare Banat - Crisana
1307,0* 1307,0 8,95
5 Societatea de Investitii Financiare Transilvania 1276,5* 1276,5 8,74
6 Muntenia Invest (SIF Muntenia) 1270,6* 1270,6 8,70
7 ING Asset Management suc. Bucuresti 1104,6** 14,01 X x x 1104,6* 7,57
8 Societatea de Investitii Financiare Moldova x x 1072,0* x X 1072,0 7,34
9 BRD Asset Management 619,2 7,85 x X 619,2 4,24
10 BT Asset management 275,2 3,49 19,3 1,2 295,7 2,03
11 OTP Asset management 193,3 2,45 17,9 0,5 211,7 1,45
12 Certinvest 39,7 0,50 55,0 41,4 136,1 0,93
13 Globinvest 26,5 0,34 21,1 x 47,6 0,33
14 Carpatica Asset Management 42,1 0,53 x x 42,1 0,29
15 Atlas Asset Management 32,4 0,41 9,5 x 41,9 0,29
16 Pioneer Asset Management 35,9 0,46 x x 35,9 0,25
17 KD Investments Romania 29,4 0,37 x x 29,4 0,20
18 Zepter Asset Management 16,6 0,21 x x 16,6 0,11
19 SAFI Invest x x 13,6 x 13,6 0,09
20 Intercapital Investment Management 1,1 0,01 9,7 x 10,8 0,07
21 Swiss Capital Asset Management 8,5 0,11 x x 8,5 0,06
22 STAR Asset Management 7,9 0,10 x x 7,9 0,05
23 Target Asset Management 6,9 0,09 x x 6,9 0,05
24 SIRA 3,4 0,04 x x 3,4 0,02
25 Vanguard Asset Management 2,3 0,03 x x 2,3 0,02
TOTAL MN. RON 7885,5 100,0 6370,3 259,0 82,9 14497,7 100%
* figures for 30.11.2011 ** foreign funds admin. locally
MCR BANKING & FINANCE


432012 EDITION Major Companies in Romania
1.4 GWwind energy operating currently in Romania, equaling EUR 2.1 billion investment (for EUR 1.5 million per MW)
Energy OIL & GAS EXTRACTION AND DISTRIBUITION ELECTRIC POWER GENERATION AND DISTRIBUTION WHOLE SALE OF ELECTRICITY AND FUELS RETAIL TRADE OF GAS - GAS STATIONS

Discussions around global warming, together with reduction in natural resources traditionally used to generate electricity (coal, gas) have set the grounds for development of new sources of energy that would provide an alternative in the long term.
Renewable energy appeared to be an interesting idea in this context, but was considered expensive, unreliable and immature. Nevertheless, it is one of the sectors that recorded the highest global growth and spread during the last years, despite economic recession. According to Bloomberg New Energy Finance, US$ 240 billion were invested last year in renewable energy (excluding large hydro plants), of which wind and photovoltaic sources represent US$ 220 billion.
In Romania, there is 1.4GW of wind energy operating as at September 2012, representing a total investment of approximately EUR 2.1 billion (considering a price for MW of EUR 1.5 million).
EUROPE AND THE SUNIn order to be promoted and made accessible, expensive technologies were supported by incentive schemes, German and Spanish governmental programs for photovoltaic energy in the mid 2000s boosting the development of solar parks. German market recorded 7.5GW installed capacity within one year. For a number of reasons, of which it is worth mentioning the debate around removing large areas of agricultural land from use for photovoltaic parks or grid stability, this expansion wave proved unsustainable.
As a result, starting 2009, Spain and Germany severely cut the incentive scheme and the drop in demand for photovoltaic technology could not be immediately and entirely offset by pick-ups in other countries. At the same time, numerous manufacturers of polysilicon raw materials, cells, inverters or modules, especially from Asian countries, entered the market, significantly increasing supply options.
SUN IS POWERING ROMANIAPhotovoltaic industry recorded impressive worldwide growth in the last 3 years, from 7.7MW installed capacities in 2009 to 29GW in 2011. While solar parks were not the focus point for
developers in Romania, with only 5MW being operational to date, the spotlight is shifting, being propelled by the positive incentive scheme currently valid in Romania (6GCs/MWh, compared to 2GCs/MWh for wind technology), one of the most important in Europe for solar parks.
The price per module stabilized starting end of 2011, after decreasing by as high as 50% during this year only. Multicrystalline silicon modules have reached a factory gate price of approximately 1$/watt (there are also quotes as low as $0.7/watt). General opinion is that this level of costs is unsustainable for the majority of manufacturers, which also materialized in large number of mergers and bankruptcies, especially for the manufacturers located in Asia.
Towards the end of 2008, when the current incentive scheme was approved in Romania, spot prices of solar-grade silicon were higher than 100$/kg, reaching 30$/kg by the end of 2011. Support scheme of 6 GCs/MW was approved by European Commission, considered being adequate in that context. Moving forward to 2011 - 2012 period, characterized by extreme price competition for cells, modules and inverters, the incentive scheme looks very attractive.
Estimations of ANRE (National Agency for Regulations in Electricity) from June 2010 indicated that expected installed capacities by end of 2012 will reach 43MW and 78MW by end of 2013. The most recent data from Transelectrica, the grid operator indicated that 1.7GW of solar parks have connection
MCR ENERGY
Andreea Stanciu, Senior Manager, Transaction Advisory Services, Ernst & YoungMihaela Cuturescu, Senior Consultant, Transaction Advisory Services, Ernst & Young
Shining future for solar power

permits as at September 2012 and 0.5GW have grid connection agreements. Establishment authorizations were granted for 90MW.
These figures reflect a rapid surge compared to practically non-existent activity around photovoltaic parks last year. Except for the positive incentive scheme of the Romanian government, the local market records a shift from wind energy, the highlight of the previous years, for a series of reasons of which most important are: ► solar irradiance estimation is more reliable and easier to predict compared to wind ► installations of photovoltaic modules take significantly less time to perform compared to wind turbines ► development process is less cumbersome
Guaranteed IRR for solar energy is 11.6%, as per current legislation, being the highest threshold for consideration of overcompensation in the series of renewable energy sources.
ROMANIAN RENEWABLE ENERGY ENVIRONMENT, STILL CLOUDYImportant legislative changes applicable to renewable sector in Romania have deterred significant foreign investments to take place, situation being highly noticeable especially following July 2012. Furthermore, authorities have identified that considering recent global developments in this sector, the incentive scheme developed in 2008 may lead to over-support and have reserved the right to change the number of GCs/MW starting 1 January 2014 for solar parks.
Grid upgrade is a matter to consider closely, as the national strategy for energy does not directly specify clear terms or actions for envisaged upgrade of grid with a 400kv line. Adding to this, grid stability affects renewable energy producers as connections should be balanced by continuous energy supply. The most important project in this area, Tarnita-Lapusesti hydro plant with 1,000MW installed capacity is very expensive and project development is still very incipient. Thus, cutting off green energy producers may be an easy solution in this respect.
Despite decreases in prices, photovoltaic energy production is still very expensive and the costs are transferred to end users. Economic downturn would probably be a natural obstacle for high increase in price per MW and local regulator has the right to intervene to regulate prices.
There are several scenarios developed by different market players (utilities, regulators, financiers) that model the period when demand of GCs (quota) will be fulfilled, which would have direct implications on trading prices of GCs that have been kept close to the legislative cap. Amongst them, the pessimistic scenarios envisage the quota being reach as soon as 2014, with GCs trading close to minimum level starting end of 2015.
IF YOU BET ON DEBTGlobal economic recession has put a burden on financing investments, which had a significant impact on development of renewable energy facilities in Romania. Debt financing became scarce, with conditions for corporate finance becoming difficult to fulfill. Good projects are defined through: ► full and correct permitting status ► strong sponsor ► good technical characteristics (high level of irradiation) ► secured sale of brown power and green certificates through off-take agreements ► minimum level of equity: 30% ► adequate technology
Project finance (non-recourse finance) was not a practice in Romania. Additionally, raising debt finance has become increasingly difficult starting July, when the newly approved law on electricity and gas (Law 123/2012) closed the possibility of concluding long term power purchase agreements (“PPA”) between private parties, thus removing one of the most important pre-conditions of the financing institutions. Current expectancies in the market, after strong support from all players involved in the local renewable sector is for the change of this aspect to occur so as to unblock financing.
Under these market conditions, potential investors with available funds for investments in renewable energy have a wide range of projects to select from. Additionally, major utilities developing their own renewable energy facilities would be privileged from the perspective of being able to circumvent the PPA.
For the remaining market players, debt raising is an area where innovation could be the only agent for moving forward. Having as example Poland, where significant investments in a variety of sectors was financed using pension funds and life insurance capital, local players could try entering capital markets as a resort for exiting the financing “trap”.
SOLAR POWER, IN THE SPOTLIGHT FOR INVESTORSPrices of modules will continue to decrease, based on continuous fierce price competition between manufacturers, despite the already unsustainable cost levels recorded by Asian manufacturers, mainly .
Local support scheme is very attractive for photovoltaic investments, with a large number of foreign investors speeding their entry into the market. Time is of essence, as potential downward change in number of GCs granted for solar energy may be approved after 1 January 2014 and solid development is the key for smooth project implementation.
Photovoltaic energy will access more widely the small businesses and household sector, becoming competitive with electricity price and facilitating savings, even without subsidies.
452012 EDITION Major Companies in Romania

Energy as strategic sector needs more than ever, a predictable business environment. During years, national strategy in energy has changed too many times. Of course, adjustments should be done to cope with reality, but too often changes are scaring away the investors.
THE STRATEGIC CALL FOR INVESTORS Romania needs a well prepared national strategy, to involve both state and investors, and to remain unchanged for few good years. This would prove not only realistic and successful, but it would have big chances to be followed by real investments. After setting its priorities, state should not interfere too much, but only follow its interest and of course, support investors’ efforts via proper, specific legislation. Renewables are the only investments that happen lately in the electricity sector.
For any new investment, in addition to a proper legislative environment, you need also to have room within end-user electricity prices. Still, regulated tariffs are low and do not allow new investments in production; the reality is proving that. Not even with bonus for efficient cogeneration, such projects for power plants are not on the table.
What it is imperatively needed in 2013 is an increase of distribution caps, with two advantages – sources to finance investments into grid and increase of investors’ trust. Grid regulations to welcome renewables and efficient cogeneration should be improved, also
prioritization in dispatching. Market regulations should be revised following new Electricity and gas law.
THE PRICE MATTERSWhat is the cheapest option for consumers? The latest development of renewable resources is a good answer. Reaching EU quotas is binding for any member state. If we talk about green electricity, cheapest option for consumers is the wind one, which receives the smallest supporting scheme. In terms of electricity itself, renewables are competing for the market price with all other classic technologies, difference in investment being covered by green certificates. On markets, the electricity price is set by marginal producer, the most expensive to cover the electricity demand. If we have a look on centralized markets, we notice that thermal power producers are the marginal ones. So, we need either to replace them with cheaper electricity production, new and more efficient, including renewables and efficient cogeneration or to refurbish them, at high costs, emissions problems and questionable results.
Romania, among other countries, faces the need to reduce the exposure to volatile energy prices. However, the renewable energy projects are estimated to transfer a higher final power price to end-consumers, since the energy suppliers transfer the costs of subsidies received by producers in the final price invoiced to end-user. How can price volatility be tackled under such
MCR ENERGY
The right way? The Green way
ADRIAN BOROTEA,Member of the Board, CEZ Romania
circumstances? According to law 134/2012, contribution to renewable energy is taken out from electricity tariffs and shown separately on invoices for each and every consumer. The number of green certificates per MWh is set and published by ANRE, price of green certificates is published by OPCOM, so the entire process is transparent.
The competitive markets mechanisms for electricity prices didn’t change; it is the equilibrium point where demand equals offer. Commodity price volatility came for the last two years especially due to hydro dry period, requiring replacement with more expensive thermal production. Partially, this price increase was offset by renewables, which strangely have decreased electricity prices, forcing thermal units to bid lower.
“FOR ANY NEW INVESTMENT, IN ADDITION TO A PROPER LEGISLATIVE ENVIRONMENT, YOU NEED ALSO TO HAVE ROOM WITHIN END-USER ELECTRICITY PRICES.”

ELECTRIC POWER GENERATION AND DISTRIBUTIONRANK COMPANY NAME MCR
SCORING ANNUAL TURNOVER
( 2011 RON)TURNOVER
RANKINGPROFIT/LOSS
(2011 RON)NO OF
EMPLOYEES CONTACT
1 COMPANIA NATIONALA DE TRANSPORT AL ENERGIEI ELEC-TRICE TRANSELECTRICA SA
4.163 3,113,142,778 1 90,913,316 2,197 Bucuresti, Sector 1
2 SOCIETATEA COMERCIALA COMPLEXUL ENERGETIC TURCENI SA
3.813 1,529,901,979 5 55,567,882 4,496 Turceni, GORJ
3 COMPLEXUL ENERGETIC CRAIOVA SA 3.713 1,228,075,942 6 795,421 2,175 Craiova, DOLJ
4 SOCIETATEA COMERCIALA COMPLEXUL ENERGETIC ROVI-NARI SA
3.713 1,017,710,306 7 33,385,699 4,380 Rovinari, GORJ
5 ELECTROCENTRALE BUCURESTI SA 3.563 2,180,397,722 3 106,854,822 3,100 Bucuresti, Sector 6
6 SOCIETATEA NATIONALA NUCLEARELECTRICA SA 3.463 1,588,353,753 4 95,036,272 2,167 Bucuresti, Sector 1
7 SOCIETATEA COMERCIALA DE PRODUCERE A ENERGIEI ELECTRICE IN HIDROCENTRALE HIDROELECTRICA SA
3.450 3,020,591,574 2 6,444,266 5,243 Bucuresti, Sector 2
8 CEZ DISTRIBUTIE SA 3.213 809,391,603 8 130,458,811 1,345 Craiova, DOLJ
9 ELECTROCENTRALE DEVA SA 3.063 778,330,788 9 2,499,075 1,506 Mintia, HUNEDOARA
10 ENEL DISTRIBUTIE MUNTENIA SA 3.063 705,878,691 10 50,470,639 1,302 Bucuresti, Sector 1
11 FILIALA DE DISTRIBUTIE A ENERGIEI ELECTRICE ELECTRICA DISTRIBUTIE MUNTENIA NORD SA
2.813 685,740,287 11 67,414,812 2,078 Ploiesti, PRAHOVA
12SOCIETATEA COMERCIALA FILIALA DE DISTRIBUTIE A ENERGIEI ELECTRICE ELECTRICA DISTRIBUTIE TRANSIL-VANIA NORD SA
2.813 535,412,637 16 29,100,621 2,016 Oradea, BIHOR
13SOCIETATEA COMERCIALA FILIALA DE DISTRIBUTIE A ENERGIEI ELECTRICE ELECTRICA DISTRIBUTIE TRANSIL-VANIA SUD SA
2.663 598,510,775 13 19,569,602 1,813 Brasov, BRASOV
14 ENEL DISTRIBUTIE DOBROGEA SA 2.625 458,996,729 18 108,851,221 995 Constanta,
CONSTANTA
15 SOCIETATEA COMERCIALA ENEL DISTRIBUTIE BANAT SA 2.613 585,775,612 14 220,456,680 1,230 Timisoara, TIMIS
16 SOCIETATEA COMERCIALA DE PRODUCERE A ENERGIEI ELECTRICE SI TERMICE TERMOELECTRICA - SA
2.563 462,105,645 17 1,597,218,309 1,664 Bucuresti, Sector 2
17 EON MOLDOVA DISTRIBUTIE SA 2.513 636,095,272 12 7,206,519 1,582 Bacau, BACAU
18 ELECTROCENTRALE GALATI SA 2.375 304,421,096 19 -92,957,245 545 Galati, GALATI
19 RUDNAP SRL 2.100 571,132,058 15 250,453 3 Bucuresti, Sector 1
20 CENTRALA ELECTRICA DE TERMOFICARE ARAD SA ( CETARAD)
1.925 114,525,810 21 15,428,773 425 Arad, ARAD
21SOCIETATEA COMERCIALA DE PRODUCERE A ENERGIEI IN HIDROCENTRALE HIDROELECTRICA BUCURESTI SA FILIALA PENTRU REPARATII SI SERVICII HIDROSERV PORTILE DE FIER SA
1.875 95,200,241 22 321,766 582 Drobeta Turnu-
Severin, MEHEDINTI
22 FILIALA PENTRU REPARATII SI SERVICII HIDROSERV CURTEA DE ARGES SA
1.825 68,187,398 27 191,147 278 Curtea de Arges,
ARGES
23 BIO ELECTRICA TRANSILVANIA SRL 1.800 24,804,324 35 12,946,574 11 Radauti, SUCEAVA
24 CENTRALA ELECTRICA DE TERMOFICARE HIDROCARBURI (CET HIDROCARBURI) SA
1.725 87,679,820 25 625,289 393 Arad, ARAD
25 ELECTRIFICARE CFR SA 1.713 90,876,610 23 10,090,604 2,797 Bucuresti, Sector 1
26 SOCIETATEA COMERCIALA FILIALA PENTRU REPARATII SI SERVICII HIDROSERV SEBES SA
1.688 31,102,659 32 945,898 190 Sebes, ALBA
27 HIDROELECTRICA SA BUCURESTI-FILIALA PENTRU REPA-RATII SI SERVICII HIDROSERV SLATINA SA
1.588 77,566,638 26 145,912 244 Slatina, OLT
28 ECOGEN ENERGY SA 1.550 40,728,883 31 960,025 11 Buzau, BUZAU
29 INVEST DINAMIC PROJECT SRL 1.500 48,573,898 30 3,173,401 8 Bucuresti, Sector 2
30 GRINSEG CONSTRUCT SRL 1.450 29,168,590 33 657,656 7 Campina , PRAHOVA
31 UZINA TERMOELECTRICA GIURGIU SA 1.375 26,997,747 34 -29,915,374 269 Giurgiu, GIURGIU
32 MW TEAM INVEST SRL 1.350 53,846,180 28 3,246,795 1 Bucuresti, Sector 1
33 BEPCO SRL 1.300 89,017,172 24 2,570,315 42 Ghimbav, BRASOV
34 CONTOURGLOBAL SOLUTIONS (PLOIESTI) SRL 1.300 24,794,752 36 -5,168,463 10 Ploiesti, PRAHOVA
35 TOMIS TEAM SRL 1.200 133,274,907 20 -50,480,893 7 Bucuresti, Sector 1
36 ENEL GREEN POWER ROMANIA SRL 1.200 48,935,620 29 -15,155,405 31 Rusu de Sus,
BISTRITA-NASAUD
472012 EDITION Major Companies in Romania

OIL & GAS EXTRACTION AND DISTRIBUTIONRANK COMPANY NAME MCR SCORING ANNUAL TURNOVER
( 2011 RON)TURNOVER
RANKINGPROFIT/LOSS
(2011 RON)NO OF
EMPLOYEES CONTACT
1 OMV PETROM SA 4.950 16,565,465,973 1 3,685,607,226 22,052 Bucuresti, Sector 1
2 SOCIETATEA NATIONALA DE GAZE NATURALE - ROMGAZ SA
4.400 4,211,149,514 5 1,031,748,972 5,779 Medias, SIBIU
3 ROMPETROL RAFINARE SA 4.213 10,174,808,952 2 -735,847,584 1,103Navodari,
CONSTANTA
4 GDF SUEZ ENERGY ROMANIA SA 3.975 4,090,867,846 6 209,555,220 740 Bucuresti, Sector 4
5 PETROTEL - LUKOIL SA 3.775 6,625,679,238 3 -391,609,120 556 Ploiesti, PRAHOVA
6 EON ENERGIE ROMANIA SA 3.775 4,261,045,806 4 -191,719,192 559 Targu Mures, MURES
7 DISTRIGAZ SUD RETELE SRL 3.763 1,099,691,738 7 135,369,392 3,112 Bucuresti, Sector 4
8 EON GAZ DISTRIBUTIE SA 3.263 800,458,510 8 230,492,490 3,747 Targu Mures, MURES
9 LINDE GAZ ROMANIA SRL 2.775 437,597,916 11 64,734,733 437 Timisoara, TIMIS
10 GRUP SERVICII PETROLIERE SA 2.675 796,938,787 9 -307,319,833 434Constanta,
CONSTANTA
11 ARELCO DISTRIBUTIE SRL 2.650 450,128,844 10 1,970,347 12 Bucuresti, Sector 1
12 BULROM GAS IMPEX SRL 2.638 321,546,949 13 3,125,023 122 Bucuresti, Sector 1
13 WEATHERFORD INTERNATIONAL EASTERN EUROPE SRL
2.588 230,684,620 16 11,113,022 218 Bucuresti, Sector 2
14 TEN GAZ SRL 2.250 247,556,809 15 5,105,355 20 Cluj Napoca, CLUJ
15 FORAJ SONDE SA 2.225 106,650,103 21 10,781,486 519 Craiova, DOLJ
16 CONEF GAZ SRL 2.200 387,698,880 12 -3,075,300 6 Bucuresti, Sector 4
17 BUTAN GAS ROMANIA SA 2.175 307,067,902 14 -23,417,660 270 Contesti, DAMBOVITA
18 RAFO SA 2.025 81,949,051 26 -3,105,204 928 Onesti, BACAU
19 GAZ SUD FURNIZARE SRL 2.000 105,536,961 22 119,392 4Bucuresti,
BUCURESTI
20 DAFORA SA 1.975 161,599,658 17 2,008,175 579 Medias, SIBIU
21 FORAJ SONDE SA 1.975 95,272,091 24 2,398,164 554 Ernei, MURES
22 PETROSANTANDER ROMANIA SRL 1.875 101,315,303 23 15,631,907 493 Arad, ARAD
23 AVA EASTERN EUROPE DF&S SRL 1.738 89,370,991 25 17,827,097 68 Bucuresti, Sector 1
24 WIROM GAS SA 1.738 47,795,098 31 3,537,465 89 Bucuresti, Sector 1
25 CONGAZ SA 1.725 151,103,165 19 13,548,999 253Constanta,
CONSTANTA
26 TOTAL LUBRICANTS ROMANIA SA 1.688 121,732,402 20 -21,729,994 88 Cristian, BRASOV
27 OIL PROD SRL 1.600 66,933,540 27 284,363 33Constanta,
CONSTANTA
28 AIR LIQUIDE ROMANIA SRL 1.588 51,296,896 30 -2,291,637 58 Bucuresti, Sector 1
29 TACROM DRILLING SRL 1.588 45,704,480 33 2,537,122 85 Ploiesti, PRAHOVA
30 NABORS DRILLING INTERNATIONAL PLOIESTI SRL 1.588 40,639,795 35 1,571,077 103Boldesti-Scaeni,
PRAHOVA
31 MOL ENERGY TRADE ROMANIA SRL 1.550 46,246,221 32 -658,821 4 Bucuresti, Sector 1
32 PETROM DISTRIBUTIE GAZE SRL 1.388 52,299,132 29 -15,491,656 245 Bucuresti, Sector 1
33 ECODIESEL SRL 1.388 40,867,993 34 -41,265,467 164 Balc, BIHOR
34 AMROMCO ENERGY SRL 1.288 57,499,718 28 -35,257,328 132 Ploiesti, PRAHOVA
35 EXCELLA REAL GRUP SRL 1.250 160,383,387 18 132,979 8Nicolae Balcescu,
CONSTANTA
MCR ENERGY

WHOLE TRADE OF ELECTRICITY AND FUELSRANK COMPANY NAME MCR SCORING ANNUAL TURNOVER
( 2011 RON)TURNOVER
RANKINGPROFIT/LOSS
(2011 RON)NO OF
EMPLOYEES CONTACT
1 OMV PETROM GAS SRL 3.800 3,110,115,994 1 137,804,129 45 Bucuresti, Sector 2
2 WIEE ROMANIA SRL 3.600 1,104,270,989 8 -21,896,147 7 Bucuresti, Sector 1
3 OSCAR DOWNSTREAM SRL 3.588 2,250,309,163 2 26,778,021 240 Bucuresti, Sector 6
4 TINMAR - IND SA 3.588 1,402,890,170 6 21,539,140 52 Bucuresti, Sector 1
5 ENEL ENERGIE MUNTENIA SA 3.475 1,842,264,078 4 -1,297,079 257 Bucuresti, Sector 1
6 ENEL ENERGIE SA 3.275 1,897,153,560 3 -43,137,204 412 Bucuresti, Sector 1
7SOCIETATEA COMERCIALA DE DISTRIBUTIE SI FURNIZARE A ENERGIEI ELECTRICE - ELEC-TRICA SA
3.238 1,438,037,720 5 7,148,124 247 Bucuresti, Sector 1
8 CEZ VANZARE SA 3.200 1,395,974,833 7 -31,316,430 48 Craiova, DOLJ
9 LLK LUBRICANTS ROMANIA SRL 3.188 870,188,203 9 12,085,649 98 Ploiesti, PRAHOVA
10 PLANOIL SRL 3.150 721,535,851 13 3,716,261 20 Bucuresti, Sector 1
11 ALPIQ ROMENERGIE SRL 2.900 715,416,545 14 26,422,338 12 Bucuresti, Sector 1
12 ENERGY HOLDING SRL 2.738 747,454,302 12 -34,583,954 53 Bucuresti, Sector 1
13 AIR BP SALES ROMANIA SRL 2.700 288,719,992 30 6,230,480 1 Otopeni, ILFOV
14 ROMPETROL GAS SRL 2.688 784,405,200 10 -2,760,637 171 Bucuresti, Sector 1
15 UNICOM HOLDING SA 2.688 758,778,507 11 -19,280,605 141 Voluntari, ILFOV
16 TRANSENERGO COM SA 2.650 551,836,290 16 4,721,041 24 Bucuresti, Sector 5
17 COMISION TRADE SRL 2.638 432,010,493 21 4,337,501 136 Braila, BRAILA
18 PETROM LPG SA 2.625 513,028,100 20 11,501,793 274 Otopeni, ILFOV
19 PETROLEXPORTIMPORT SA 2.600 521,232,193 19 235,341 19 Bucuresti, Sector 1
20 MASTER CHEM OIL SRL 2.550 532,191,283 18 752,797 24 Bucuresti, Sector 1
21 ENERGY FINANCING TEAM ROMANIA SRL 2.550 367,704,728 25 4,462,619 4 Bucuresti, Sector 3
22 TAN STEEL HOLDING SRL 2.500 223,536,342 32 735,955 8Techirghiol, CONSTANTA
23 GEN - I BUCHAREST - ELECTRICITY TRADING AND SALES SRL
2.400 350,975,346 26 6,050,023 1 Bucuresti, Sector 3
24 ALPIQ ROMINDUSTRIES SRL 2.300 539,201,651 17 4,951,666 17 Bucuresti, Sector 1
25 PLANOIL INDUSTRIES SRL 2.300 384,169,265 24 74,429 1 Bucuresti, Sector 1
26 EZPADA SRL 2.300 183,596,325 33 6,163,977 1 Bucuresti, Sector 1
27 LIEB-BENZ-OIL COMPANY LTD SRL 2.300 180,902,385 34 3,047,482 11 Timisoara, TIMIS
28 AXPO ENERGY ROMANIA SA 2.200 322,573,781 27 -12,079,422 16 Bucuresti, Sector 1
29 FIDELIS ENERGY SRL 2.200 137,670,772 42 1,323,293 8 Valea Lupului, IASI
30 ENEL TRADE ROMANIA SRL 2.100 660,923,321 15 -2,993,187 1 Bucuresti, Sector 1
31 REPOWER FURNIZARE ROMANIA SRL 2.100 394,087,027 23 -37,939,523 23 Bucuresti, Sector 1
32 KDF ENERGY SRL 2.100 293,626,202 29 9,398,548 8 Bucuresti, Sector 5
33 GDF SUEZ ENERGY TRADING ROMANIA SRL 2.100 269,992,141 31 -1,033,636 0 Bucuresti, Sector 4
34 ROTTCO CONSULT SRL 2.000 425,993,969 22 257,733 12 Voluntari, ILFOV
35 PETPROD SRL 2.000 306,969,393 28 -3,733,283 3 Bucuresti, Sector 1
36 RONEFER SRL 1.900 178,037,935 35 2,647,408 6 Voluntari, ILFOV
37 PEDATROL ROM SRL 1.900 147,681,095 40 1,324,744 0 Ploiesti, PRAHOVA
38 EURO-PEC SA 1.788 148,377,325 39 2,186,433 81 Galati, GALATI
39 RENOVATIO TRADING SRL 1.700 155,766,631 37 2,082,865 11 Bucuresti, Sector 1
40 CASTROL LUBRICANTS RO SRL 1.700 131,394,842 43 12,351,450 39 Bucuresti, Sector 5
41 AIR TOTAL ROMANIA SA 1.600 177,791,622 36 -2,689,209 30 Bucuresti, Sector 1
42 INKASSO JOBS SRL 1.500 153,577,115 38 201,576 1Mihail Kogalniceanu,
CONSTANTA
43 CEZ TRADE ROMANIA SRL 1.400 138,873,857 41 33,504 4 Bucuresti, Sector 1
492012 EDITION Major Companies in Romania

RETAIL TRADE OF GAS - GAS STATIONSRANK COMPANY NAME MCR SCORING ANNUAL TURNOVER
( 2011 RON)TURNOVER
RANKINGPROFIT/LOSS
(2011 RON)NO OF
EMPLOYEES CONTACT
1 OMV PETROM MARKETING SRL 4.375 13,684,564,230 1 125,396,136 356 Bucuresti, Sector 1
2 ROMPETROL DOWNSTREAM SRL 3.963 7,645,953,049 2 -108,229,346 2,499 Bucuresti, Sector 1
3 LUKOIL ROMANIA SRL 3.863 5,458,206,353 3 -115,201,885 3,460 Bucuresti, Sector 1
4 MOL ROMANIA PETROLEUM PRODUCTS SRL 3.288 3,137,003,249 4 -13,397,874 176 Bucuresti, Sector 1
5 ARAL SRL 2.288 283,807,441 6 816,666 224 Saliste, SIBIU
6 ENI ROMANIA SRL 2.188 526,674,323 5 -24,617,675 214 Bucuresti, Sector 1
7 BIOROMOIL AUTOMATIC STATIONS SRL 2.100 271,645,187 7 -2,977,655 19 Bucuresti, Sector 1
8 EUROGENETIC SRL 1.938 69,420,191 17 2,536,165 69 Craiova, DOLJ
9 BENZ OIL SRL 1.850 190,344,403 8 182,639 46 Medias, SIBIU
10 VILKY SERV SRL 1.800 46,642,707 20 367,115 15 Nojorid, BIHOR
11 ROMBEER CRINGASU SRL 1.788 66,947,804 18 1,818,771 76 I. L. Caragiale,
DAMBOVITA
12 ANA OIL SRL 1.650 162,446,559 9 1,967,932 50 Sibiu, SIBIU
13 DESIRA IMPEX SRL 1.650 91,320,177 13 963,167 48 Beius, BIHOR
14 TURIST SERVICE SRL 1.600 89,836,799 14 412,605 41Adunatii-Copaceni,
GIURGIU
15 ROMAR OIL SRL 1.600 74,504,570 16 28,542 24Constanta, CON-
STANTA
16 TRANS IVINIS &CO SRL 1.588 80,508,852 15 604,480 92 Sebes, ALBA
17 OZANA SRL 1.438 57,138,099 19 27,119 72Bistrita, BISTRITA-
NASAUD
18 SMART DIESEL SRL 1.400 98,419,279 12 -1,374,326 24 Chisineu-Cris, ARAD
19 EUROIL SRL 1.338 112,733,589 11 -2,159,634 184 Saliste, SIBIU
20 AS24 TANKSERVICE SRL 1.300 123,970,824 10 67,261 8 Bucuresti, Sector 1
MCR ENERGY


532012 EDITION Major Companies in Romania
16%is the average increase of revenues for manufacturing companies while the companies trading chemicals registered 25 percent average increase of revenues in 2011
Chemicals MANUFACTURE OF BASIC CHEMICALS WHOLESALE OF CHEMICAL PRODUCTS MANUFACTURE OF PAINTS, VARNISHES AND SIMILAR COATINGS,
PRINTING INKS AND MASTICS MANUFACTURE OF RUBBER AND PLASTIC PRODUCTS - EXCEPT TYRES WASTE MANAGEMENT

High investments to meet environmental regulations, besides upgrading technology are tough challenges to Romania’s chemical industry. Upgrading technology and passively adhering to existing business models might not be enough in a world of scarce resources – innovative business models are needed and research is a must. The [petro] chemical industry inherited from the communist regime in 1990, driven geo-politics, was hardly compatible with such requirements. The basic manufacturing, mostly based on relatively important hydrocarbon resources [compared to Europe], provided in 2011 a temporary impetus to the overall chemical industry but it adds dubious gains in terms of value added. Sector’s competitiveness remains low overall and is mainly driven by cheap natural gas and labour cost – thus remaining unsustainable. Basic chemical manufacturing, but also more value added segments like paints and plastic products manufacturing were in the red in 2011, while the sectors making profits were fertilizers, rubber [tyre mostly] production and wholesale trade with chemicals [mostly importers].
Romania’s chemical companies face the rising challenges of environmental requirements while operating in highly competitive European and global markets. Furthermore, even the companies in developed economies, more market-driven and having already adhered to high environmental standards, must develop innovative strategies since basic manufacturing [which is what most of Romanian companies do] can no longer thrive in a world of scarce resources. Speaking to a plastics conference, but relevant for whole chemical industries, European Commissioner for Environment Janez
Potočnik stressed that the European chemical industry will not only need technological development and innovation but also new business models that increase value added.
Romanian companies thus have to cope with multiple challenges and this is particularly problematic for incumbent enterprises inherited from the communist regime. Few of them survived the past two decades. Chemical plant Oltchim, running losses for years on a combination of corrupt management and inefficient business model, best illustrates the sector’s problems. It survived mostly due to its size, but can hardly further operate after the country’s integrated chemical complex was dismantled.
Consequently, Romania’s foreign trade in the sectors covered in the report [chemicals less pharmaceuticals and cosmetics] remains in the deficit area – with two notable exceptions: fertilizers, where the competitiveness is provided by the regulated low price of natural gas [besides strong demand driven by high food prices] and tyre manufacturing where three major global groups [Michelin, Pirelli and Continental] have established production units.
It is thus not by surprise that the local manufacturing companies in a representative sample of companies that we have used below increased their revenues in 2011 at a slower rate than the companies trading chemicals: by 16% y/y against 25% y/y. The net profit to total revenues ratio was also slower in manufacturing, 2.4% versus 3.7% in wholesale trade – yet up
MCR CHEMICALS
Iulian Ernst, Freelance Analyst
0%
25%
50%
75%
100%
15%
4%8%
29%
24%
21%
Basic chemicals
Chemicals wholesale
Rubber
Plastics
Fertilizers, agri-chemicals
Paints, coatings, adhesive
-10% 0% 10% 20% 30% 40%-10%
-5%
0%
5%
10%
15%
20%
basic chemicals
paints
wholesale
rubber
agri-chemicals
plastics
Profit / Total Revenues (2011)
Tota
l Rev
enue
s y/
y (2
01
1)
On way from politics to ECOnomics

55
Major Companies in Romania 2012 EDITION Major Companies in Romania
from 1.9% in 2010. The significant rise in revenues and the rising profitability were driven by progress in the sectors of fertilizers and tyre making.
SHORT-TERM DEVELOPMENTSTotal turnover of Romanian representative chemical companies, included in our sample, increased by 18% in 2010 -- or by 17% y/y in euros, to RON 30.8bn (EUR 7.26bn). The rise in manufacturing was however softer and it was particularly due to the 31% expansion in the fertilizers production segment and 28% rise in rubber manufacturing. Notably, the profitability of the two industry segments is also the highest. The net profit to total revenues ratio increased from 8.1% in 2010 to 13.1% in 2011. This is consistent with the interest of global commodities trader Ameropa for the largest local fertilizers Azomures. Ameropa completed the takeover deal discussed in late 2011 with Azomures’ Turkish owners. The sector’s profitability is notably provided by the cheap local natural gas and will predictably diminish as the country is liberalising the natural gas market. Nonetheless, the need for high vegetal yields [visible in high grain prices] will keep strengthening the demand. Separately, the profitability in rubber manufacturing is mostly due to the foreign ownership and management of the three large tyre makers.
The toughest problems at the level of industry segments are in the basic chemicals manufacturing. The paints segment also features low profitability and this may explain the pressure for mergers and acquisitions. Fabryo and Atlas’ paints division are merging this year to create the largest player in terms of sales. The profitability in plastics manufacturing is also negative, but the market size is expanding much steeper than the segments of paints or basic chemicals.
On broader level, the output in the chemical industries followed in this report has gradually increased in 2009-2011 after a sizeable contraction in 2009. Nonetheless, the output projected for 2012 based on 1H12 data show that both
segments lost ground as the economic growth in Europe weakened. The gloomy outlook for 2H12 support the projections based on Jan-June data. Notably the output even decreased below the 2008 level in both industries. Oltchim’s problems must have contributed to the problems in the chemicals industry and will likely make a negative impact. The rubber and plastics industry also lost ground this year. CORPORATE ROUND-UP Oltchim. The company, controlled by the government, ceased operations in August. The government failed to sell its 55% stake in September and, according to the calendar drafted under the stand-by agreement with the IMF, it should liquidate the 3,300-employees plant. Nonetheless, PM Ponta announced plans for another privatisation attempt in 2013 - after the company resumes operations.
Fabryo, Atlas. The owners of two of Romania's largest construction material producers - Fabryo Corporation and Atlas Corporation, have reached an agreement to merge their home paints and finishing divisions. The merger would create the largest home paints company on the domestic market with sales worth some EUR 42mn, higher that the EUR 39mn sales of current market leader Kober.
Azomures. Swiss grain trader Ameropa wrapped up the takeover of Romanian fertilizers producer Azomures after Romania's antitrust body has cleared the deal. Ameropa acquired 75.8% of Azomures and acquired further 20.6% for RON 240.8mn (EUR 54mn) via a buyout bid.
Michelin. French Michelin tyre maker, which owns two production facilities in the western Romanian town of Zalau, Salaj County, might go forward with a new investment there, former economy minister Lucian Bode announced earlier this year. He mentioned that the Michelin's decision on a location for the new investment will be made in 2012, but he could not provide any further details.projected for 2012 based on 1H12 data show that both prov
0
50
100
150
200
2005 2006 2007 2008 2009 2010 2011 1H12
chemicals rubber&plastic manufacturing
0.0
20.0
40.0
60.0
80.0
100.0
120.0
140.0
1989
1991
1993
1995
1997
1999
2001
2003
2005
2007
chemicals plastics&rubber
Spectrum auction – total license taxes Spectrum auction – total license taxes

MANUFACTURE OF BASIC CHEMICALS RANK COMPANY NAME MCR
SCORING ANNUAL TURNOVER
( 2011 RON)TURNOVER
RANKINGPROFIT/LOSS
(2011 RON)NO OF
EMPLOYEES CONTACT
1 AZOMURES SA 4.263 1,625,577,204 1 365,196,441 2,688 Tg. Mures, MURES
2 OLTCHIM SA 3.613 1,533,016,194 2 -278,342,623 3,447 Ramnicu Valcea,
VALCEA
3 REGIA AUTONOMA PENTRU ACTIVITATI NUCLEARE RA
3.313 715,991,743 3 37,774,933 3,659 Drobeta Turnu Severin,
MEHEDINTI
4 UZINELE SODICE GOVORA - CIECH CHEMICAL GROUP SA
2.625 293,116,641 4 -35,286,969 887 Ramnicu Valcea,
VALCEA
5 CHIMCOMPLEX SA BORZESTI 2.325 176,292,965 6 4,979,821 656 Onesti, BACAU
6 BIOROMOIL SRL 2.300 273,777,020 5 186,290 22 Bucuresti, Sector 2
7 ALCHIMEX SA 2.288 40,163,005 19 4,416,813 51 Bucuresti, Sector 1
8 TRUST LF TRADE SRL 1.938 64,282,120 16 673,487 179 Focsani, VRANCEA
9 REDOXIM SRL 1.888 144,918,651 8 15,921,831 156 Diroda, TIMIS
10 D PLAST-EFTEC RO SRL 1.850 51,053,932 17 9,942,860 34 Budeasa Mare, ARGES
11 BIO FUEL ENERGY SRL 1.675 174,497,945 7 2,160,117 381 Zimnicea, TELEORMAN
12 AMURCO SRL 1.675 81,127,830 14 -355,470 692 Bacau, BACAU
13 DONAU CHEM SRL 1.663 80,357,858 15 1,092,493 1,021 Turnu Magurele,
TELEORMAN
14 COMBINATUL DE INGRASAMINTE CHIMICE SA 1.588 88,851,410 12 63,470 89 Navodari, CONSTANTA
15 VIROMET SA 1.575 117,404,005 10 -2,222,484 558 Victoria, BRASOV
16 CHEMGAS HOLDING CORPORATION SRL 1.575 81,898,662 13 -9,378,192 744 Slobozia, IALOMITA
17 QUALICAPS ROMANIA SRL 1.438 48,155,401 18 1,120,583 87 Bucuresti, Sector 1
18 ENERGY BIO CHEMICALS SA 1.275 118,281,866 9 -26,024,157 404 Bucuresti, Sector 2
19 PRIO BIOCOMBUSTIBIL SRL 1.200 89,400,854 11 -19,806,660 45 Bucuresti, Sector 3
WHOLESALE OF CHEMICAL PRODUCTSRANK COMPANY NAME MCR
SCORING ANNUAL TURNOVER
( 2011 RON)TURNOVER
RANKINGPROFIT/LOSS
(2011 RON)NO OF
EMPLOYEES CONTACT
1 COMFERT SRL 2.788 388,851,148 1 9,151,592 190 Bacau, BACAU
2 AGRICOVER SRL 2.788 236,750,800 4 6,605,172 116 Voluntari, ILFOV
3 AGROPORT SA 2.400 339,979,022 2 2,855,661 27 Galati, GALATI
4 BAYER SRL 2.338 297,992,728 3 3,761,266 207 Bucuresti, Sector 2
5 TIMAC AGRO ROMANIA SRL 2.188 128,062,742 12 11,351,973 60 Bucuresti, Sector 1
6 ATAMETALY SRL 2.100 82,964,017 20 961,856 6 Targu Mures, MURES
7 BRENNTAG SRL 2.088 167,392,309 7 5,086,891 91 Chiajna, ILFOV
8 BASF COATINGS SERVICES SRL 2.050 63,663,078 24 3,096,240 18 Bucuresti, Sector 1
9 B A S F SRL 2.038 141,384,290 11 13,290,911 76 Bucuresti, Sector 1
10 GLISSANDO SRL 2.038 110,216,729 17 5,842,760 95 Timisoara, TIMIS
11 SIKA ROMANIA SRL 2.038 77,883,190 21 1,337,269 51 Brasov, BRASOV
12 DAFCOCHIM SRL 2.000 117,966,015 14 6,402,634 37 Targu Mures, MURES
13 ORBIT POLYMERS SRL 2.000 92,957,883 19 1,245,011 11 Bucuresti, Sector 2
14 SYNGENTA AGRO SRL 1.938 172,116,048 6 5,310,991 68 Bucuresti, Sector 1
15 AZOCHIM SRL 1.938 162,973,825 8 8,545,594 126 Calugareni, GIURGIU
16 LINZER AGRO TRADE ROMANIA SRL 1.900 145,880,784 10 4,148,485 29 Bucuresti, Sector 2
17 SOLEXIM POLYMERS SRL 1.900 127,306,250 13 1,925,693 16 Bucuresti, Sector 1
18 MAKHTESHIM AGAN MAROM SRL 1.900 103,301,994 18 1,071,917 20 Voluntari, ILFOV
19 AGROTEX SRL 1.850 157,558,031 9 14,440,750 49 Carei, SATU MARE
20 MARIA INVEST HOLDING SRL 1.850 114,945,809 15 12,581,746 27 Chirnogi, CALARASI
21 CHIMAGRI SRL 1.850 112,038,211 16 7,341,011 36 Chiscani, BRAILA
22 GENERAL AGRO INTERNATIONAL SRL 1.800 66,213,049 22 1,548,980 14 Sector 6, BUCURESTI
23 ADIDANA SRL 1.800 64,696,308 23 811,923 16 Pitesti, ARGES
24 DEN BRAVEN ROMANIA COMEX SRL 1.788 186,397,053 5 -985,634 246 Buftea, ILFOV
MCR CHEMICALS
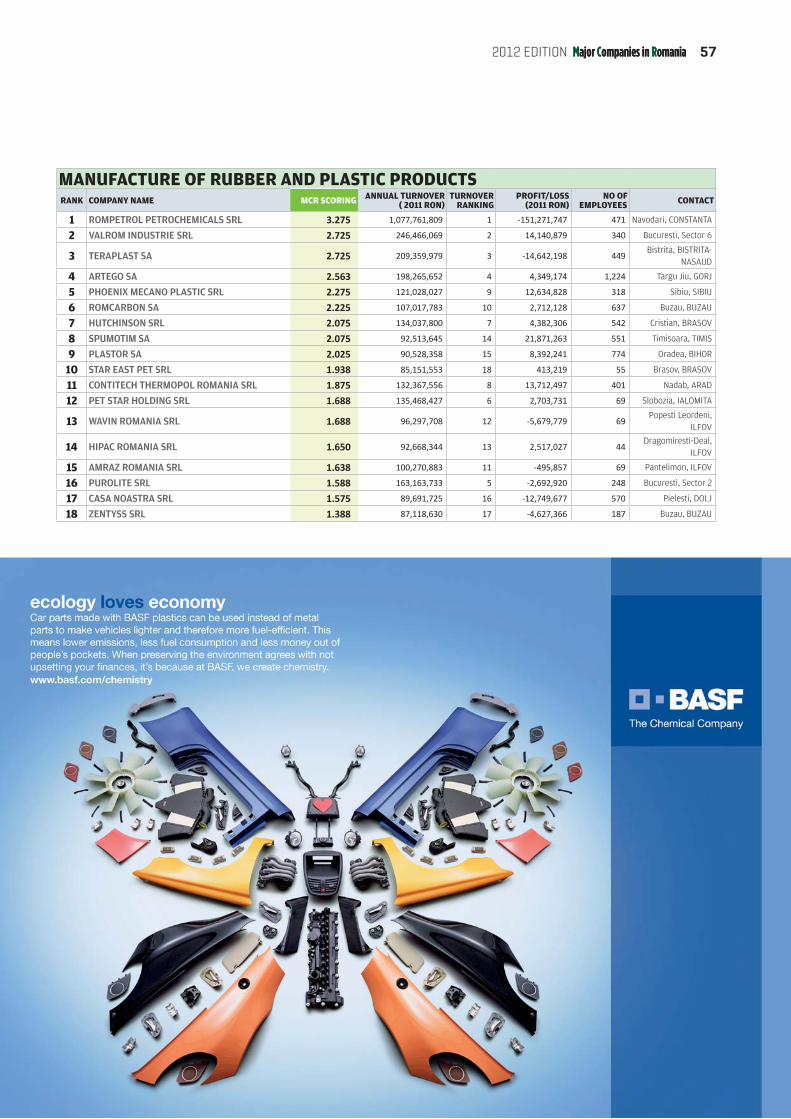
MANUFACTURE OF RUBBER AND PLASTIC PRODUCTSRANK COMPANY NAME MCR SCORING ANNUAL TURNOVER
( 2011 RON) TURNOVER
RANKINGPROFIT/LOSS
(2011 RON) NO OF
EMPLOYEES CONTACT
1 ROMPETROL PETROCHEMICALS SRL 3.275 1,077,761,809 1 -151,271,747 471 Navodari, CONSTANTA
2 VALROM INDUSTRIE SRL 2.725 246,466,069 2 14,140,879 340 Bucuresti, Sector 6
3 TERAPLAST SA 2.725 209,359,979 3 -14,642,198 449 Bistrita, BISTRITA-
NASAUD
4 ARTEGO SA 2.563 198,265,652 4 4,349,174 1,224 Targu Jiu, GORJ
5 PHOENIX MECANO PLASTIC SRL 2.275 121,028,027 9 12,634,828 318 Sibiu, SIBIU
6 ROMCARBON SA 2.225 107,017,783 10 2,712,128 637 Buzau, BUZAU
7 HUTCHINSON SRL 2.075 134,037,800 7 4,382,306 542 Cristian, BRASOV
8 SPUMOTIM SA 2.075 92,513,645 14 21,871,263 551 Timisoara, TIMIS
9 PLASTOR SA 2.025 90,528,358 15 8,392,241 774 Oradea, BIHOR
10 STAR EAST PET SRL 1.938 85,151,553 18 413,219 55 Brasov, BRASOV
11 CONTITECH THERMOPOL ROMANIA SRL 1.875 132,367,556 8 13,712,497 401 Nadab, ARAD
12 PET STAR HOLDING SRL 1.688 135,468,427 6 2,703,731 69 Slobozia, IALOMITA
13 WAVIN ROMANIA SRL 1.688 96,297,708 12 -5,679,779 69 Popesti Leordeni,
ILFOV
14 HIPAC ROMANIA SRL 1.650 92,668,344 13 2,517,027 44 Dragomiresti-Deal,
ILFOV
15 AMRAZ ROMANIA SRL 1.638 100,270,883 11 -495,857 69 Pantelimon, ILFOV
16 PUROLITE SRL 1.588 163,163,733 5 -2,692,920 248 Bucuresti, Sector 2
17 CASA NOASTRA SRL 1.575 89,691,725 16 -12,749,677 570 Pielesti, DOLJ
18 ZENTYSS SRL 1.388 87,118,630 17 -4,627,366 187 Buzau, BUZAU
57Major Companies in Romania 2012 EDITION Major Companies in Romania

MANUFACTURE OF PAINTS, VARNISHES AND SIMILAR COATINGS, PRINTING INKS AND MASTICSRANK COMPANY NAME MCR SCORING ANNUAL TURNOVER
( 2011 RON) TURNOVER
RANKINGPROFIT/LOSS
(2011 RON)NO OF
EMPLOYEES CONTACT
1 AZUR SA 2.325 96,775,367 5 123,576 265 Timisoara, TIMIS
2 EUROINK ROMANIA SRL 2.150 19,490,914 12 722,059 16 Bucuresti, Sector 4
3 AXM PROD 93 SRL 2.038 24,336,244 11 710,593 128 Bucuresti, Sector 4
4 METALBAC & FARBE SA 2.038 15,431,090 14 3,868,132 54 Magura, BACAU
5 KOBER SRL 1.825 165,807,840 1 9,336,732 426 Dumbrava Rosie, NEAMT
6 VADOVA SRL 1.800 8,384,061 19 49,456 38 Comuna Budesti, VALCEA
8 DAW BENTA ROMANIA SRL 1.688 73,010,702 6 172,292 248Sancraiul de Mures,
MURES
7 CHIMTITAN SRL 1.688 13,367,926 15 677,961 68 Bucuresti, Sector 3
9 FABRYO CORPORATION SRL 1.675 126,470,657 2 583,486 252 Popesti Leordeni, ILFOV
10 DILOIL CHIM SRL 1.650 10,650,858 17 733,554 4 Slatioara, OLT
11 HELIOS TRADING CO SRL 1.600 7,908,381 20 706,825 40 Popesti-Leordeni, Ilfov
14 POLICOLOR SA 1.588 124,256,008 3 -3,052,200 190 Bucuresti, Sector 3
12 SENTOSA IMPEX SRL 1.588 33,450,262 9 7,565,236 95 Cluj-Napoca, CLUJ
13 SARCOM SRL 1.588 27,737,033 10 114,897 99Mihaesti, Sat Buleta,
VALCEA
15 SWARCO VICAS SA 1.550 18,831,345 13 -369,554 43 Targoviste, DAMBOVITA
16 CHEMPRO CHEMICALS SRL 1.550 8,781,426 18 47,660 44 Ramnicu Valcea, VALCEA
17 NATIONAL PAINTS FACTORIES COMPANY SA 1.488 11,158,101 16 -1,234,899 80 Miroslava, IASI
18 IZOCOLOR 92 PROD SRL 1.400 7,059,151 21 596,152 26 Bucuresti, Sector 3
19 DRUCKFARBEN ROMANIA SRL 1.388 59,548,980 7 -3,635,419 105 Magurele, ILFOV
20 DEUTEK SA 1.375 114,497,428 4 -20,175,800 379 Bucuresti, Sector 3
21 NUBIOLA ROMANIA SRL 1.338 51,771,734 8 -632,492 151 Doicesti, DAMBOVITA
MCR CHEMICALS

WASTE MANAGEMENTRANK COMPANY NAME MCR SCORING ANNUAL TURNOVER
( 2011 RON) TURNOVER
RANKINGPROFIT/LOSS
(2011 RON) NO OF
EMPLOYEES CONTACT
1 REMAT SA 3.388 749,609,421 1 10,710,524 133 Calarasi, CALARASI
2 COMPANIA ROMPREST SERVICE SA 2.913 267,590,738 13 14,912,162 2,920 Bucuresti,
BUCURESTI
3 REMATHOLDING CO SRL 2.638 578,389,137 2 11,303,473 198 Bucuresti,
BUCURESTI
4 VIVANI SALUBRITATE SA 2.638 205,510,109 18 10,448,441 191 Slobozia, IALOMITA
5 REMAT SCHOLZ SA 2.600 519,985,014 3 6,195,910 9 Bucuresti,
BUCURESTI
6 LEKKERLAND CONVENIENCE DISTRIBUTIE SRL 2.588 210,035,820 17 420,742 115 Chiajna, ILFOV
7 REMAT MG SA 2.588 395,385,211 6 2,558,375 158 Arad, ARAD
8 REMAT BRASOV SA 2.588 274,781,362 10 4,370,861 220 Brasov, BRASOV
9 METALIMPEX ROMANIA SRL 2.588 248,119,367 14 9,841,195 100 Argeselu, ARGES
10 REMAT SA 2.538 212,346,121 16 5,043,198 239 Iasi, IASI
11 ENERGROM SA 2.500 413,549,306 4 9,087,332 36 Bucuresti,
BUCURESTI
12 NEW COMPANY RECYCLING SRL 2.488 267,797,770 12 2,219,028 98 Drobeta-Turnu
Severin, MEHEDINTI
13 REMATINVEST SRL 2.475 349,365,153 7 4,185,409 257 Cluj-Napoca, CLUJ
14 IONESCOM COLECT SRL 2.450 348,166,277 8 818,916 14 Constanta,
CONSTANTA
15 ANGHEL NG SRL 2.438 286,873,869 9 102,173 76 Galati, GALATI
16 KIRAZOGLU CORPORATION SRL 2.388 402,460,561 5 1,385,051 55 Agigea, CONSTANTA
17 METAL HOUSE CO SRL 2.300 270,249,430 11 -5,140,563 32 Constanta,
CONSTANTA
18 SIDEROM STEEL SRL 2.200 223,458,436 15 735,955 27 Bucuresti,
BUCURESTI
59
Major Companies in Romania 2012 EDITION Major Companies in Romania


612012 EDITION Major Companies in Romania
13.6billion RON is the value of pharmaceutical market expected to be reached in 2012, representing a 6.7 percent increase over 2011. In 2016, BMI estimated the market to reach RON 18.89 billion
Pharmaceuticals MANUFACTURE OF BASIC PHARMACEUTICALS WHOLESALE OF PHARMACEUTICALS RETAIL TRADE OF PHARMACEUTICALS

After, 2009 and 2010, years with double-digit growth, the chronic underfunding and the application of the claw-back tax have tempered the market in 2011 and 2012. Despite a seemingly tough year and difficult context, the pharmaceutical sector has managed to pull off some growth in 2012 and continue the upward trend. In 2012, according to BMI, the pharmaceutical market is expected to reach RON 13.6 billion, a 6.7% increase over 2011. According to the same source, in 2016 the market will reach a value of RON 18.89 billion and a compounded annual growth rate (CAGR), over the period 2013-1016, of 8.6%.
Despite the quite recent change in the reimbursement mechanism which favors generic drugs and despite the fact that the low GDP per capita means that patients are unlikely to be able to afford the most expensive drugs, generic penetration is not expected to increase significantly.
Despite the rosy surface image, the sector does not seem able to evolve away from recurrent themes which impact it mostly in a negative way: deep underfunding, long payment terms, claw-back tax, and reimbursement lists.
THE CLAW-BACK TAXThe claw-back was introduced in 2009 through an Emergency Ordinance, in an attempt to increase revenues for the public health insurance system so the government can pay bills
within legal deadlines. However, this was decided under the assumption that drug suppliers are the main trigger for budget overruns, without any regard to the lack of prescription control mechanisms in place. Since the claw-back mechanism, as it was initially designed, did not produce the desired results, various new versions of the mechanism have been proposed. Since September 2012, we have the claw-back version 4, with the following key amendments:
quarterly consumption reimbursed by the NHIH and the quarterly budget for reimbursed drugs;
RON1.425 billion to RON 1.515 billion;
representatives have to declare and fully pay the claw-back tax within 30 days from the implementation of the Government's Emergency Ordinance to be able to benefit from the cancelation of any potential penalties.
Still, under the latest version of the claw-back tax and after a lot of opposition, pharmaceutical producers are forced to pay the tax, not only on their turnover, but also on the margins of the wholesalers and retailers. Another criticism of the mechanism relates to the negative impact the claw-back has on the cheap generic drugs with tight margins which might become loss making under the current mechanism.
MCR PHARMACEUTICALS
Pharmaceutical Market Bogdan Tenu, Senior Manager, Transaction Advisory Services, Ernst & Young
– Reaping the fruits of past actions
0.0%
5.0%
10.0%
15.0%
20.0%
25.0%
30.0%
35.0%
40.0%
45.0%
50.0%
0
2
4
6
8
10
12
14
16
18
20
2008 2009 2010 2011f 2012f 2013f 2014f 2015f 2016f
% o
f hea
lth e
xpen
ditu
re
RONb
n
Patented drug sales, (RONbn) Generic drug sales, (RONbn)
Over-the-counter medicine (OTC) sales (RONbn) Pharmaceutical sales, % of health expenditure
Source: : BMI, Ernst&Young

63
Major Companies in Romania 2012 EDITION Major Companies in Romania
As per IMF Staff Report, Fifth Review under the Stand-By Arrangement, the recently introduced claw-back tax will be fully used to pay down unregistered bills revealed during the stocktaking exercise and recorded at end-2011. This could be one explanation why the authorities require payment of claw-back tax four times per year, while the drugs continue to be reimbursed after almost one year.
UNDERFUNDING DEEPENSAs a general note, the total level of consolidated state budget income, well below the EU average, prevents the authorities to properly finance the healthcare sector and not only.
In Romania, as in most European countries, the main source of financing the healthcare spending is the public sector,
which relies heavily on the on the social healthcare system. Approximately 80% of the healthcare spending is covered by the public sector, with the rest of the financing coming from the private sector. As to the health insurance contributions, at 10.7%, they are among the lowest in Europe. Romania cut the contributions from 12.5% to 11% in 2008 and again, in 2009, to 10.7%. The decrease in health insurance contribution, the onset of the crisis, combined with the removal of the threshold for reimbursed drugs, deepened the lack of resources and contributed the strong increase in payment of reimbursed drugs. The measures taken by the Government, as a counterbalance such as the claw-back tax, contributions paid by pensioners, have not yielded the expected results.
The Directive 2011/7/EU of the European Parliament and of the Council on combating late payment in commercial transactions forces Romania to become compliant beginning
with 2013 and reduce payment terms to 60 days. Given the current context, the task seems at this point rather impossible.
The increases in payment terms, as well as the lower prices for ethical drugs have determined traders to move towards parallel exports as a means to mitigate local market risks. There is the fear that an increased level of parallel exports might lead to drug shortages for internal use.
REIMBURSEMENT LISTAccording to CEGEDIM, there are approximately 140 new molecules pending reimbursement approval. The last significant update of the reimbursement list has been done in
oncology and orphan drugs. Most of the molecules pending
nervous system and rare diseases.
HEALTHCARE REFORMAs part of its on-going agreement with IMF, Romania’s progress on the way to reform the healthcare sector is a key issue. According to IMF Staff Report, Fifth Review under the Stand-By Arrangement: “The health system constitutes the single largest threat to medium-term fiscal sustainability, as it relies on government budget transfers of nearly ½ percent of GDP (on top of social contributions)”.
The new healthcare law, if approved, is expected to boost the healthcare expenditure. An important aspect of the bill is the introduction of private insurers and consequently the competition between public and private health insurance companies.
0 2,000 4,000 6,000 8,000
10,000 12,000 14,000 16,000 18,000
2008 2009 2010 2011f 2012f 2013f 2014f 2015f 2016f
RO
Nbn
Pharmaceutical exports (US$mn) Pharmaceutical imports (RONmn)
Source: : BMI, Ernst&Young

MCR
I find it rather hard to talk about Romania’s national investment strategy as efficiently as analysts do, even if I manage a half billion USD business that has proved a strategic success.
Yet, I dare to speak about the future of investments in Romania and about the significant chance that stands in our hands to trigger the attention of foreign capital, due to a rather serious fact: Within a summit that I have recently attended, the discussions in the panel referred to Romania as a country that’s not attractive for investments. My patriotic string resonated strong enough to encourage me to say today why I think that an investment in Romania depends on economic reasons, as well as political, geographical and social ones.
There is no doubt that the current economic landscape is not the most welcoming and that an investor would need to be convinced of the good evolution of a certain sector, of a hyper-emergent market, to have a fantastic vision or to prove an almost irrational courage in order to make a strategic investment anywhere now, so much less in Romania. Taken these premises, why would an investor take a step further and bring, let’s say, EUR100 million in Romania?
First of all, because any investment will continue to cost half the price during the next five years. That is because the rest of 50 percent is financed either through the ongoing sectorial operational programs and the European funds, or through the state aid programs run by Ministry of
Public Finance. Of course, it is not easy to access this money. But the process is
investor or project can become eligible if the procedures, the methodology and the project are correctly addressed and in a competitive way. For instance, there are significant fiscal facilities for investors who plan to develop R&D centers.
Secondly, the geographic location of Romania will gain particularly significant importance in the next four years: Romania neighbors countries in East- Europe, as well as from Central Asia, Middle East and Northern Africa. Hence, Romania positions in very convenient and safe infrastructure corridors that can
direct investments in the countries mentioned before involve much higher risks compared to Romania and therefore, why should not a production plant be established in Romania, as it may turn into a hub addressing a potentially regional population of around 500-600 million consumers?
and currency policies and the estimations in this respect, we can anticipate a trend of stability and even an evolution. There is local political will for joining Euro
and the reference interest is bearable. Also, the newly introduced European IFRS norms have created the necessary comparability and the needed
banks should restart the credit engines in the next three years, as they will benefit from these politics.
Opinion
Invest in Romania!
DRAGOS DAMIAN,CEO Terapia Ranbaxy
Last but not least, it is clear that the triad of Romania’s creditors, the designers of macro-economic discipline in the last three years, will be interested to direct investments to Romania. The country has to return significant amounts of money to International Monetary Fund, European Council and World Bank, and they will want to make sure that Romania’s GDP is good enough to pay its debts.
Factors as undergoing development, the local industrial tradition that it is not used at its fair potential, the geo-strategic positioning, the safety and security, the
human capital, qualified and competent (why not to admit, cost-effective), are not political stereotypes. I see them as the strong points that will make Romania the sixth most attractive country for investments in Europe during the next three years, according to Ernst & Young 2012 European Attractiveness Survey.
“THE LOCAL ECONOMIC SETTING HAS SEVERAL STRONG POINTS THAT WILL MAKE IT THE SIXTH MOST ATTRACTIVE COUNTRY FOR INVESTMENTS IN EUROPE IN THE NEXT THREE YEARS.”

MANUFACTURE OF BASIC PHARMACEUTICALSRANK COMPANY NAME MCR SCORING ANNUAL TURNOVER
( 2011 RON) TURNOVER
RANKING PROFIT/LOSS
(2011 RON) NO OF
EMPLOYEES CONTACT
1 ANTIBIOTICE SA 3.113 281,847,455 3 20,298,909 1,450 Iasi, IASI
2 EUROPHARM SA 2.775 407,769,055 2 25,704,364 258 Brasov, BRASOV
3 TERAPIA SA 2.725 421,239,266 1 95,848,848 667 Cluj-Napoca, CLUJ
4 ZENTIVA SA 2.725 235,648,166 5 33,857,309 555 Bucuresti, Sector 3
5 BIOFARM SA 2.425 93,443,090 10 14,220,788 362 Bucuresti, Sector 3
6 ASTRAZENECA PHARMA SRL 2.225 116,178,490 9 6,501,355 297 Bucuresti SECTOR 1
7 FITERMAN PHARMA SRL 2.138 40,486,745 15 8,010,168 120 Iasi, IASI
8 HOFIGAL EXPORT IMPORT SA 2.125 22,925,761 21 2,108,543 318 Bucuresti, Sector 4
9 SANDOZ SRL 2.038 272,698,827 4 -15,669,154 205 Targu Mures, MURES
10 MAGISTRA C&C SRL 2.038 23,312,787 20 3,212,001 121 Constanta,
CONSTANTA
11 INFOMED FLUIDS SRL 1.875 121,732,229 6 14,416,592 391 Bucuresti, Sector 3
12 PFIZER ROMANIA SRL 1.838 117,720,908 8 777,373 195 Bucuresti SECTOR 1
13 BIOTEHNOS SA 1.838 68,178,204 12 35,978,988 144 Otopeni, ILFOV
14 GEDEON RICHTER ROMANIA SA 1.825 119,516,919 7 -119,441,475 552 Targu Mures, MURES
15 ARENA GROUP SA 1.788 30,350,226 18 3,796,276 99 Bucuresti, Sector 2
16 BBRAUN PHARMACEUTICALS SA 1.788 25,161,982 19 1,647,053 110 Timisoara, TIMIS
17 PASTEUR - FILIALA FILIPESTI SRL 1.775 49,994,572 13 6,007,874 320 Filipestii de Padure,
PRAHOVA
18 FERROSAN SRL 1.738 37,826,236 16 -76,941 89 Cluj Napoca, CLUJ
19 ROMPHARM COMPANY SRL 1.588 84,427,664 11 4,280,342 231 Otopeni, ILFOV
20 ROMVAC COMPANY SA 1.575 37,490,359 17 523,971 366 Voluntari, ILFOV
21 SWISSCAPS ROMANIA SRL 1.475 46,064,676 14 -1,222,841 269 Cornu, PRAHOVA
22 SINDAN - PHARMA SRL 1.438 21,125,255 22 3,333,342 182 Bucuresti, Sector 1
RETAIL TRADE OF PHARMACEUTICALS RANK COMPANY NAME MCR SCORING ANNUAL TURNOVER
( 2011 RON)TURNOVER
RANKINGPROFIT/LOSS
(2011 RON)NO OF
EMPLOYEES CONTACT
1 S.I.E.P.C.O.F.A.R. SA 3.163 755,620,215 2 6,830,066 1,300Popesti-Leordeni,
ILFOV
2 ROPHARMA SA 3.075 385,169,835 3 10,687,756 756 Brasov, BRASOV
3 SENSIBLU SRL 3.013 920,786,955 1 1,166,452 2,133 Mogosoaia, ILFOV
4 HELP NET FARMA SA 2.775 350,442,551 4 12,580,059 993 Bucuresti, Sector 2
5 CENTROFARM SA 2.125 159,275,207 8 2,966,174 422 Bucuresti, Sector 2
6 REMEDIUM FARM SRL 2.000 53,376,346 17 5,096,844 49 Cluj-Napoca, CLUJ
7 GENERAL TRADE PHARM SRL 1.988 190,423,351 5 204,676 57 Magurele, ILFOV
8 HERMES PHARMA SA 1.975 174,948,813 6 1,567,006 491 Bucuresti, Sector 1
9 MED-SERV UNITED SRL 1.938 133,442,454 10 1,804,090 122 Bucuresti, Sector 5
10 URGENT FARM SRL 1.900 47,834,811 18 1,603,906 26 Bucuresti, Sector 1
11 VILEUS MED-COM SRL 1.888 69,886,021 14 3,631,791 74 Pitesti, ARGES
12 MC SERV TOUR SRL 1.888 69,597,067 15 2,018,161 125 Bucuresti, Sector 2
13 FARMACEUTICA ARGESFARM SA 1.738 149,132,452 9 2,086,873 240 Pitesti, ARGES
14 GENERAL CONCEPT PHARM SRL 1.688 104,662,108 11 635,260 120 Magurele, ILFOV
15 SIBPHARMAMED SRL 1.688 100,393,142 12 791,012 151 Sibiu, SIBIU
16 CATENA HYGEIA SRL 1.688 63,080,781 16 742,965 213 Pitesti, ARGES
17 MINI-FARM SRL 1.638 42,233,299 20 230,791 111 Babadag, TULCEA
18 PASSIFLORA COM SRL 1.400 70,041,325 13 126,070 15 Bucuresti, Sector 4
19 FARMACIA ACSADEMIA SRL 1.400 47,107,113 19 1,875,043 14 Bucuresti, Sector 4
20 GEDEON RICHTER FARMACIA SA 1.375 169,929,654 7 -4,022,939 457 Corunca, MURES
65
Major Companies in Romania 2012 EDITION Major Companies in Romania

MCR PHARMACEUTICALS
WHOLESALE OF PHARMACEUTICALSRANK COMPANY NAME MCR SCORING ANNUAL TURNOVER
( 2011 RON) TURNOVER
RANKING PROFIT/LOSS
(2011 RON) NO OF
EMPLOYEES CONTACT
1 FARMEXPERT DCI SA 3.875 1,821,368,650 2 86,369,568 623 Bucuresti, Sector 6
2 POLISANO SRL 3.825 1,245,539,397 3 42,157,465 639 Sibiu, SIBIU
3 MEDIPLUS EXIM SRL 3.775 2,700,529,658 1 56,231,206 900 Mogosoaia, ILFOV
4 EUROPHARM HOLDING SA 3.675 1,024,526,005 5 11,236,244 344 Brasov, BRASOV
5 SANOFI-AVENTIS ROMANIA SRL 3.338 848,148,293 8 19,095,940 187 Bucuresti, Sector 5
6 ROCHE ROMANIA SRL 3.288 1,090,313,389 4 149,697 225 Bucuresti, Sector 2
7 GLAXOSMITHKLINE (GSK) SRL 3.275 723,741,502 10 21,173,671 300 Bucuresti, Sector 1
8 FARMACEUTICA REMEDIA SA 3.225 203,467,822 16 4,077,449 395 Deva, HUNEDOARA
9 ADM FARM SRL 3.175 781,828,812 9 8,883,553 556 Pantelimon, ILFOV
10 FARMEXIM SA 3.125 972,471,927 6 10,316,324 549 Bucuresti, Sector 2
11 FILDAS TRADING SRL 3.025 935,162,376 7 24,596,603 499 Pitesti, ARGES
12 SERMEDIC SRL 2.600 471,296,283 11 5,107,052 6 Bucuresti, Sector 1
13 A &G MED TRADING SRL 2.538 361,001,582 12 429,453 236 Bucuresti, Sector 4
14 MEDIMFARM SA 2.538 61,581,767 40 2,095,257 196 Ploiesti, PRAHOVA
15 ROMASTRU TRADING SRL 2.525 358,430,923 13 2,779,524 252 Bucuresti, Sector 1
16 PHARMAFARM SA 2.375 302,650,945 15 -35,790,671 413 Cluj-Napoca, CLUJ
17 BBRAUN MEDICAL SRL 2.288 63,031,123 37 3,126,970 77 Remetea Mare
Nr.636, TIMIS
18 ACTAVIS SRL 2.188 330,279,371 14 -16,131,988 170 Bucuresti, Sector 1
19 SOF MEDICA SRL 2.188 66,888,151 36 9,272,612 57 Bucuresti, Sector 1
20 PHARMA SA 2.088 94,054,504 27 2,047,457 130 Iasi, IASI
21 A &D PHARMA MARKETING &SALES SERVICES SRL 2.000 148,175,571 20 23,639,862 49 Mogosoaia, ILFOV
22 THREE FARM SRL 2.000 62,679,205 38 1,347,026 4 Bucuresti, Sector 2
23 STERIMED COM SRL 2.000 57,865,440 42 1,149,440 16 Bucuresti, Sector 3
24 FARMAVET SA 1.975 111,150,740 25 2,424,587 536 Bucuresti, Sector 6
25 BIO EEL SRL 1.938 112,706,001 24 4,158,819 172 Targu Mures,
MURES
26 PICARA TRADING SRL 1.900 87,709,030 29 3,960,148 10 Bucuresti, Sector 6
27 GEMEDICA SRL 1.850 97,973,084 26 4,588,999 39 Bucuresti, Sector 2
28 SERVIER PHARMA SRL 1.825 80,410,583 30 3,414,623 257 Bucuresti, Sector 1
29 GLAXOSMITHKLINE CONSUMER HEALTHCARE SRL 1.688 145,496,366 21 3,872,178 62 Bucuresti, Sector 5
30 JOHNSON &JOHNSON ROMANIA SRL 1.688 58,367,534 41 -2,140,069 113 Bucuresti, Sector 2
31 FARMASTORE PREST SRL* 1.650 158,322,262 19 8,459,105 24 Bucuresti, Sector 2
32 NYCOMED PHARMA SRL 1.650 67,243,577 35 1,533,170 46 Bucuresti, Sector 1
33 FARMACOM SA 1.638 68,192,385 33 526,522 242 Brasov, BRASOV
34 BOEHRINGER INGELHEIM RCV GMBH &CO KG VIENA SUCURSALA BUCURESTI
1.588 161,209,343 18 3,157,259 81 Bucuresti, Sector 1
35 FRESENIUS MEDICAL CARE ROMANIA SRL 1.588 116,585,286 23 9,759,300 73 Bucuresti, Sector 1
36 ANGELINI PHARMACEUTICALS ROMANIA SRL 1.588 92,235,542 28 1,886,515 80 Bucuresti, Sector 4
37 MEDICAROM GROUP SRL 1.588 71,175,240 31 -4,538,886 80 Bucuresti, Sector 2
38 A &A MEDICAL SRL 1.588 69,249,789 32 -5,804,949 149 Bucuresti, Sector 4
39 TERAPIA DISTRIBUTIE SRL 1.588 57,529,105 43 829,997 128 Cluj-Napoca, CLUJ
40 ALCON ROMANIA SRL 1.550 62,302,728 39 394,549 50 Bucuresti, Sector 2
41 TEVA PHARMACEUTICALS SRL 1.488 170,016,509 17 -9,437,515 112 Bucuresti, Sector 2
42 EGIS ROMPHARMA SRL 1.400 67,728,965 34 -7,037,027 8 Cluj-Napoca, CLUJ
43 ZENTIVA INTERNATIONAL A S HLOHOVEC SUCURSALA BUCURESTI
1.350 124,687,293 22 4,481,438 5 Bucuresti, Sector 3


692012 EDITION Major Companies in Romania
250million EUR local production in 2011
EUR 270 million local production in 201050,000 workers in the sector in 19898,000 workers in the sector in 2011
Glass & Ceramics MANUFACTURE OF GLASS AND GLASS PRODUCTS MANUFACTURE OF CERAMIC PRODUCTS

The glass and ceramics industries have taken completely different routes during the last couple of years. Both of them continue to be affected by the economic recession, but in distinct ways. If in 1989 the sector employed 50,000 people, it currently has around 8,000 employees, while the value of its local production has decreased from EUR 270mn in 2010 to EUR 250mn in 2011, according to Maria Danciulescu, former executive director of glass and ceramics association STICEF.
Glass producers, whose sales depend mostly on the constructions and food & beverages market evolutions, had to face a highly volatile demand. Prices for glass in the constructions industry went down to historical minimums during the last couple of years, mainly because of the economic crunch. However, demand has started to pick up in the second part of 2011 and selling prices have partially been readjusted. “Prices tend to reach the levels before the crisis. I think this trend of price and demand increase will continue this year as well,” said Jerome Lionet, general manager of Saint-Gobain Glass Romania, the largest glass producer in the country.
The company, which controls the regional activities of the French group Saint-Gobain, plans to increase its production capacity at Calarasi by 3%. Its orders for window glasses come from both residential and non-residential sectors, while those
for interior finishing come especially from the office and commercial market segments.
Demand of glass packaging, which depends mostly on local consumption of beverages, such as wine, champagne and beer, and of jar-based products, is slowly picking up. The largest producer in this sector, Stirom Bucharest, owned by the Greek company Yioula Glassworks, increased its turnover by 7% y/y in 2011, up to RON 207mn (EUR 49mn). However, the growth is much lower compared to the 20% recorded the previous year. The company’s H1 financial results for 2012 don’t look encouraging either. Its net turnover has decreased by 5.25% y/y in H1, while net profit saw a sharp correction of almost 59%, down to RON 4.8mn (EUR 1.1mn). According to its manager, the company plans to attract EUR 10mn financing on the stock exchange, to invest in new products, in optimizing energy consumption and in environment protection projects.
Household glassware producers are the most affected by the increasing prices of raw materials such as gas and electricity, which count for up to 50% of their total production costs. “If raw material costs exceed 60% of the total production costs, a factory can no longer survive. There are two-three companies currently in danger, where this percent has exceeded 50%,” said Danciulescu from STICEF.
MCR GLASS & CERAMICS
An industry at warIf glass producers saw an increase in demand starting with the second part of 2011, manufacturers of ceramic products struggle to survive the harsh competition of Chinese imports.
Magda Munteanu, Freelance Journalist
Romanian ceramics industry Cost evolution, ceramics industry (thous euro)
Source: STICEF
0
1,000
2,000
3,000
4,000
5,000
6,000
7,000
8,000
9,000
2007 2008 2009 2010 2011
Raw materials Gas Electricity Labour
0
200
400
600
800
1,000
1,200
1,400
1,600
10,000
11,000
12,000
13,000
14,000
15,000
16,000
17,000
18,000
19,000
2007 2008 2009 2010 2011
Employment
Production (tons)
Sales in the EU(tons)

This is the main reason why some producers shifted their focus towards art glassware, which uses fewer raw materials and has a good export market. Local production in this sector has steadily increased by 10% each year and companies export almost all their products to the EU (90%), Canada, the US and Russia. In Romania, consumption is mainly focused on cheaper products of Turkish origin. In spite of the difficult conditions, the Turkish group Trakya Cam decided to enter the Romanian market by acquiring Glass Corp Buzau earlier this year, in a deal estimated at EUR 3.6mn. The company, which ranks among the top six flat glass companies in the world and top four companies in Europe by its production capacity, plans to invest over EUR 55mn in the Romanian producer. Trakya Cam had $751mn net sales in 2011 and employs more than 2,700 people. In 2009, it decided to develop its flat glass activities together with Saint-Gobain in Egypt and Russia.
CERAMICS FIGHT AGAINST CHEAP IMPORTSThe ceramics sector is under huge pressure. In spite of constant demand, of around 660,000 tons per year at the EU level, producers struggle to survive. Their main concern is the unfair competition of similar products imported from China. Problems began in 2005, when the European countries liberalized the access of such products on their markets. The result was an avalanche of Chinese imports, which currently count for more than 65% of the total products sold in the EU, compared to the 22% in 2004. The average export prices from China are some 70% lower than the average 2011 prices of all other countries exporting to the EU.
Statistics show that Chinese exports of ceramic table and kitchenware to the EU have increased by 260% since 2004, while the union lost 56% of its jobs in the sector within the same timeframe.
In an attempt to limit the negative effects of these imports on the local production, certain countries such as Colombia, Indonesia and Argentina have instituted anti-dumping measures against Chinese imports. The European Commission also initiated, in February 2012, an anti-dumping proceeding concerning imports of ceramic tableware and kitchenware from China.
The EU is currently investigating the extent to which such products are dumped and cause material injury to EU
producers, in order to define the level of duties to impose to them. The process may result in an increase in customs duties for all imported ceramic products from 7% at present to up to 37%. “I expect these duties will slightly increase the prices of our products and will allow us to have a decent profit ratio,” said Radu Pupaza, executive direct at STICEF and representative of household ceramics producer Cesiro Sighisoara.
Until these measures are implemented, local ceramic producers continue to be in a deep crisis. The Romanian market absorbs only 5% of their production and the rest goes to the export, mainly to the EU countries. “The ceramic tiles market shall not recover this year,” estimates Toni Teau, CEO of Lasselsberger Romania, which has the Cesarom brand. However, Lasselsberger, one of the most important players on this market, which also owns Sanex Cluj-Napoca, plans to increase its sales in the short and mid-term runs, as well as its output capacity. The company had RON 83.2mn (EUR 19.4mn) turnover in 2011, while Sanex had RON 94.9mn (EUR 22mn) revenues.
In 2011, Romanians bought on average some 35 sqm of wall and floor tiles, which is 10% less than in 2008. Market analysis shows that customers tend to be less interested in small size ceramic tiles and more in favor of bigger, more elegant models. This is in line with the international trends of home design. Renovations generate the most sales and customers tend to focus more on medium-priced products. Producers in this segment count on increasing their tile sales in the rural areas, where the number of houses connected to the sewage and gas networks has increased.
712012 EDITION Major Companies in Romania
Product type Production (tones) No of Employees Year of closure Iris Cluj porcelain 8,000 2,000 Apr-03 Stipo Dorohoi porcelain 5,000 1,000 2006 Arpo porcelain 5,000 1,200 Jul-08 Faimar Baia Mare earthenware 6,000 800 2008 Vitron Tarnaveni stoneware 4,000 600 Jul-05 Ceramar Baia Mare earthenware 100 100 Apr-12
Company name
THE EUROPEAN COMMISSION INITIATED AN ANTI-DUMPING PROCEEDING CONCERNING IMPORTS OF CERAMIC TABLEWARE AND KITCHENWARE FROM CHINA. THE PROCESS MAY RESULT IN AN INCREASE IN CUSTOMS DUTIES FOR ALL IMPORTED CERAMIC PRODUCTS FROM 7% AT PRESENT TO UP TO 37%.
Closures of Romanian ceramic tableware producers
Source: STICEF

MANUFACTURE OF GLASS AND GLASS PRODUCTS RANK COMPANY NAME MCR SCORING ANNUAL TURNOVER
( 2011 RON)TURNOVER
RANKINGPROFIT/LOSS
(2011 RON)NO OF
EMPLOYEES CONTACT
1 STIROM SA 3.025 207,570,716 2 19,462,703 421 Bucuresti, Sector 3
2 SAINT-GOBAIN GLASS ROMANIA SRL 2.375 282,599,447 1 12,843,212 270 Bucuresti, Sector 1
3 STICLA TURDA SA 2.225 10,968,427 15 390,261 313 Turda, CLUJ
4 SPECTRUM INDUSTRIES SRL 2.088 14,598,289 10 709,444 57 Bucuresti, Sector 4
5 GEROM SA 2.038 34,368,930 5 -2,485,408 227 Buzau, BUZAU
6 PIETTA GLASS WORKING SRL 2.025 41,614,135 4 1,991,401 282Valenii de Munte,
PRAHOVA
7 WEST CO IMPEX SRL 1.950 13,776,375 11 433,960 44 Zalau, SALAJ
8 MILLEFIORI SRL 1.888 10,859,173 17 851,854 162 Arad, ARAD
9 GECSAT SA 1.838 22,033,250 7 172,428 67 Tarnaveni, MURES
10 CRISTAL BRAD SERVICE SRL 1.788 49,770,204 3 819,263 183 Bucuresti, Sector 4
11 DELTA GLASS SRL 1.788 13,025,469 13 717,311 61 Bucuresti, Sector 4
12 LIPOPLAST SRL 1.588 25,663,148 6 340,927 122 Timisoara, TIMIS
13 FABRICA DE STICLA AVRIG SA 1.538 12,221,902 14 1,002,475 83 Avrig, SIBIU
14 GECSATHERM SA 1.500 10,901,629 16 253,949 50 Tarnaveni, MURES
15 VISPESTI PROD SRL 1.488 18,141,478 8 449,074 105 Ploiesti, PRAHOVA
16 LUSTIC INVEST SA 1.488 14,927,879 9 -23,427,894 80 Brasov, BRASOV
17 GLASSCORP SA 1.438 13,211,728 12 68,651 131 Buzau, BUZAU
18 UNION GLASS SRL 1.200 10,161,745 18 -506,332 43 Carei, SATU MARE
MANUFACTURE OF CERAMIC PRODUCTSRANK COMPANY NAME MCR SCORING ANNUAL TURNOVER
( 2011 RON)TURNOVER
RANKINGPROFIT/LOSS
(2011 RON)NO OF
EMPLOYEES CONTACT
1 SAINT-GOBAIN CONSTRUCTION PRODUCTS ROMANIA SRL
2.275 268,050,248 1 -5,251,351 543 Bucuresti, Sector 1
2 CERAMICA SA IASI 2.088 68,841,065 11 4,376,705 229 Iasi, IASI
3 LAZAR SRL 2.088 41,716,288 16 4,409,185 106 Reghin, MURES
4 HELIOS SA 2.088 26,126,709 18 781,727 175 Astileu, BIHOR
5 APULUM SA 2.025 66,464,729 12 1,907,634 858 Alba Iulia, ALBA
6 SICERAM SA 2.025 56,203,451 14 6,732,313 265 Sighisoara, MURES
7 IPEC SA 1.975 62,408,814 13 6,472,707 511 Alba Iulia, ALBA
8 REGATA SRL 1.938 96,991,777 5 10,967,785 169Targoviste,
DAMBOVITA
9 DAFERMANN SRL 1.850 25,564,049 19 3,068,782 20 Bacau, BACAU
10 CERSANIT ROMANIA SA 1.825 81,361,096 9 -1,417,541 533 Roman, NEAMT
11 CESIRO SA 1.813 90,187,932 7 -565,676 1,346 Sighisoara, MURES
12 WIENERBERGER - SISTEME DE CARAMIZI SRL 1.788 118,089,518 3 -4,477,345 203 Bucuresti, Sector 1
13 SANEX SA 1.725 94,854,054 6 -5,562,016 440 Cluj-Napoca, CLUJ
14 SAWA SA 1.700 74,076,933 10 17,399 42 Cluj-Napoca, CLUJ
15 ELECTROCERAMICA SA 1.688 22,469,935 23 -1,225,473 240 Turda, CLUJ
16 MONDIAL SA 1.675 126,599,166 2 -4,185,956 814 Lugoj, TIMIS
17 YALCO ROMANIA SRL 1.650 23,222,418 22 117,308 27 Bucuresti, Sector 1
18 ROCA OBIECTE SANITARE SRL 1.638 21,607,264 24 -6,663,822 139 Bucuresti, Sector 6
19 PREMIER COM SRL 1.588 97,158,125 4 268,245 55 Slobozia, IALOMITA
20 LASSELSBERGER SA 1.588 83,232,361 8 -428,002 54 Bucuresti, Sector 5
21 PIASTRELLE SRL 1.588 35,640,574 17 365,936 103 Timisoara, TIMIS
22 ARCOROM SRL 1.450 23,817,257 21 979,251 15 Otopeni, ILFOV
23 KAI CERAMICS SRL 1.400 42,082,896 15 -1,201,573 17 Bucuresti, Sector 1
24 SANOTECHNIK COM RUMANIEN SRL 1.200 24,277,107 20 -1,605,344 30Tancabesti, Comuna
Snagov, ILFOV
MCR GLASS & CERAMICS
732012 EDITION Major Companies in Romania
3.8million tons local crude steel production in 2011, a 2.9 percent growth compared with 2010
Metal PRIMARY METAL MANUFACTURING MANUFACTURE OF METAL PRODUCTS WHOLESALE OF METALS AND METAL ORES

The optimism generated by the good results obtained in 2010 faded a year later, as local crude steel production was unable to maintain a stable growth rhythm. After the sharp 45% y/y decline in 2009, the industry had a 35% comeback in 2010, based on the gradual recovery of the Euro zone, where Romania exports most of its metal products. However, the growth lost steam in 2011 and slowed down to only 2.9%, up to 3.8mn tons.
The slight increase of Romania’s medium export prices for steel products, up to USD 1,054 per ton in 2011, contributed to the positive evolution of the industry, shows Steel Producers’ Union in Romania (UniRomSider) data. Yet, prices were still below the USD 1,094 per ton recorded in 2008.
The situation worsened in 2012, when prices and demand for steel, which represent a barometer for the economy evolution, reached their minimum levels within the last three years. Spot iron prices went down to USD 87 per ton in September, which was almost 30% below this year’s high of USD 149.4 per ton. Steel was traded at USD 344 per ton on the London Metal Exchange (LME) in October, close to the minimum recorded in 2009, of around USD 300 per ton.
In Romania, crude steel production decreased by 7.51% y/y in the first nine months of 2012, down to 2.62mn tons, according to World Steel Association (WSA) data.
“The metal industry is still deep in crisis and I expect it will not get out of it in 2013 either,” said Mircea Budur, executive director of UniRomSider.
The WSA forecasted in October that the global apparent steel use will increase by 2.1% in 2012, which is considerably lower than the 6.2% growth achieved in 2011 and the 3.6% forecasted in April. The association lowered its growth expectations for 2013 as well, from 5.6% in April to 3.2% in October.The higher growth forecast earlier this year was based on some signs of recovery after the slowdown in the last quarter of 2011.
However, the ongoing uncertainty generated by the debt crisis in the euro zone and a slower growth in China, which is both the world’s largest steel producer and consumer, deteriorated the economic situation in the second quarter of this year. The moderate growth expectations for 2013 can be achieved only if the euro zone controls the crisis, the US manages to deal with its fiscal tightening due next year and if the economic stimuli measures show their effects in China.
“In 2012, the world has realized that China's economy is slowing down well beyond initial expectations. That is a structural event which is going to maintain negative pressures on the metals markets in 2013,” said Mihai Nichisoiu, international market analyst at Tradeville brokerage firm.
Steel demand in China is expected to increase by 2.5% in 2012, up to 639mn tons, down from the 6.2% growth in 2011, according to the WSA. China has been the main engine of global economic growth for the last few years, and a significant part of its economic growth comes from real-estate and infrastructure projects. The government’s stimulus measures are likely to slightly improve the country’s economic situation and apparent steel use could increase by 3.1% in 2013.
“Global demand for industrial metals is poised to calm down further over the longer-term since developed economies like the US and the Eurozone will continue to record sub-par growth rates,” said Nichisoiu.
Statistics show that the European Union countries produced 129.6mn tons of crude steel in the first three quarters of 2012, down by 4.6% compared to the same period of 2011. Overall, the apparent steel use in EU 27 is expected to decline by 5.6% in 2012.
TOUGH DECISIONSSteel demand is tightly connected to the evolution of the real economy, since it is used in capital-intensive industries such as
MCR METAL
Magda Munteanu - Freelance Journalist
Metal industry faces bleak perspectives Negative market evolution forced the largest steel producers in the world to take drastic measures, to cut their losses.

75
shipbuilding, car manufacturing, air industry and constructions. As long as these sectors lag behind new orders, demand for steel is unlikely to increase.
Pundits warn that the stimulus measures on the global market have reached their limits and that the current measures are no longer efficient. As a result, the negative market evolution forced the largest steel producers in the world to take drastic measures to cut their losses.
It is the case of the Russian group Mechel, owned by the Russian billionaire Igon Zyuzin, which announced in September it put up for sale 14 of its worldwide assets for USD 859mn, less than half of their acquisition price. The group had USD 605mn loss in H1 2012, compared to USD 501mn profit in H1 2011, mostly because the steel and mining markets went down and because of the currency rate evolution. The company intends to obtain USD 150mn from selling four of its five production capacities in Romania – Mechel Targoviste (USD 46mn), Mechel Campia Turzii (USD 33mn), Laminorul Braila (USD 32mn) and Ductil Steel (USD 39mn).
The largest steel mill in Romania, ArcelorMittal Galati, faces problems selling its production that is less than half the level of 2008. The plant currently operates with only one furnace, compared to the four that were functional before the crisis, and started a program of voluntary layoffs for 1,300 workers. At an international level, the company, led by Indian billionaire Lakshmi Mittal, decided to permanently close furnaces in France, Belgium and Spain.
The difficult international market conditions reflected also into the financial results of Alro, the largest aluminum producer in Central and Eastern Europe. The company decreased its net profit by 92% y/y in H1 2012, down to USD 4.5mn, while reducing its primary aluminum production by 4.5%, down to 125,000 tons. “Lower demand and price for aluminum in the first half of this year, to which added the energy deficit, affected the company’s results,” said Marian Nastase, vice-president of Alro’s board.
The Romanian aluminum industry reported a recovery in output in 2011, with Alro’s total casted aluminum production of
approximately 261,000 tons, up from 241,000 in 2010. However, the international aluminum market started to deteriorate this year. Aluminum prices decreased by almost 20% between January and September 2012, down to USD 2,030 per ton. World aluminum production is expected to grow faster than consumption, leading to stock increase from an estimated 8.6 weeks at the end of 2011 to 11.7 weeks at the end of 2012. On top of all these problems, the heavy industry in Romania and in Europe will be confronted, starting with 2013, with significant cost increases generated by emission certificates. UniRomSider, the Steel Producers’ Union in Romania, warns that energy-related for steel producers costs will double between 2013 and 2020 because of the new emission trading scheme. The association tries to convince the Economy Ministry to compensate a certain quota of producers’ electricity expenses, to avoid relocation risks created by higher costs.
2012 EDITION Major Companies in Romania
“THE METAL INDUSTRY IS STILL DEEP IN CRISIS AND I EXPECT IT WILL NOT GET OUT OF IT IN 2013 EITHER” - Mircea Budur, Executive Director of UniRomSider
Export/import Tons/price 2007 * 2008 * 2009* 2010 ** 2011 **
Export Thous tons
Mil $/€
Medium price/ton
Import Thous tons
Mil $/€
Medium price/ton
3,863 3,269 2,090 3,023 3,304
3,367 3,576 1,751 1,847 2,514
864 1,094 838 611 760
3,570 3,648 1,846 2,775 3,425
3,455 4,395 2,784 2,056 2,739
968 1,205 938 741 800
*for 2007, 2008, 2009, the v a lue is in $**for 2010, 2011, the v a lue is in euro
0 1,000 2,000 3,000 4,000 5,000 6,000
2007 2008 2009 2010 2011
Steel Cast
0
5,000
10,000
15,000
Crude Steel Production Blast furnace iron production
Source: UniRomSider Source: World Steel Association
Source: UniRomSider
Romanian steel and cast production (thous tons) Steel and iron production in Romania (thous tons)
Romanian steel products evolution
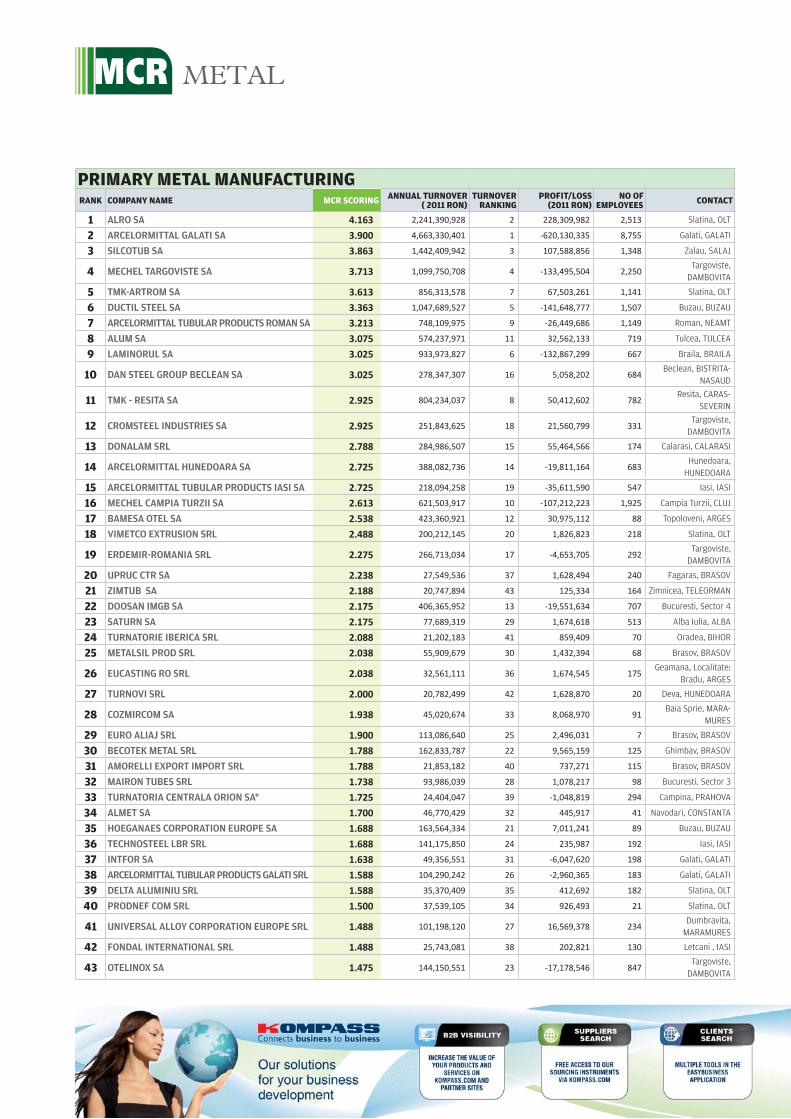
PRIMARY METAL MANUFACTURINGRANK COMPANY NAME MCR SCORING ANNUAL TURNOVER
( 2011 RON)TURNOVER
RANKINGPROFIT/LOSS
(2011 RON)NO OF
EMPLOYEES CONTACT
1 ALRO SA 4.163 2,241,390,928 2 228,309,982 2,513 Slatina, OLT
2 ARCELORMITTAL GALATI SA 3.900 4,663,330,401 1 -620,130,335 8,755 Galati, GALATI
3 SILCOTUB SA 3.863 1,442,409,942 3 107,588,856 1,348 Zalau, SALAJ
4 MECHEL TARGOVISTE SA 3.713 1,099,750,708 4 -133,495,504 2,250Targoviste,
DAMBOVITA
5 TMK-ARTROM SA 3.613 856,313,578 7 67,503,261 1,141 Slatina, OLT
6 DUCTIL STEEL SA 3.363 1,047,689,527 5 -141,648,777 1,507 Buzau, BUZAU
7 ARCELORMITTAL TUBULAR PRODUCTS ROMAN SA 3.213 748,109,975 9 -26,449,686 1,149 Roman, NEAMT
8 ALUM SA 3.075 574,237,971 11 32,562,133 719 Tulcea, TULCEA
9 LAMINORUL SA 3.025 933,973,827 6 -132,867,299 667 Braila, BRAILA
10 DAN STEEL GROUP BECLEAN SA 3.025 278,347,307 16 5,058,202 684Beclean, BISTRITA-
NASAUD
11 TMK - RESITA SA 2.925 804,234,037 8 50,412,602 782Resita, CARAS-
SEVERIN
12 CROMSTEEL INDUSTRIES SA 2.925 251,843,625 18 21,560,799 331Targoviste,
DAMBOVITA
13 DONALAM SRL 2.788 284,986,507 15 55,464,566 174 Calarasi, CALARASI
14 ARCELORMITTAL HUNEDOARA SA 2.725 388,082,736 14 -19,811,164 683Hunedoara,
HUNEDOARA
15 ARCELORMITTAL TUBULAR PRODUCTS IASI SA 2.725 218,094,258 19 -35,611,590 547 Iasi, IASI
16 MECHEL CAMPIA TURZII SA 2.613 621,503,917 10 -107,212,223 1,925 Campia Turzii, CLUJ
17 BAMESA OTEL SA 2.538 423,360,921 12 30,975,112 88 Topoloveni, ARGES
18 VIMETCO EXTRUSION SRL 2.488 200,212,145 20 1,826,823 218 Slatina, OLT
19 ERDEMIR-ROMANIA SRL 2.275 266,713,034 17 -4,653,705 292Targoviste,
DAMBOVITA
20 UPRUC CTR SA 2.238 27,549,536 37 1,628,494 240 Fagaras, BRASOV
21 ZIMTUB SA 2.188 20,747,894 43 125,334 164 Zimnicea, TELEORMAN
22 DOOSAN IMGB SA 2.175 406,365,952 13 -19,551,634 707 Bucuresti, Sector 4
23 SATURN SA 2.175 77,689,319 29 1,674,618 513 Alba Iulia, ALBA
24 TURNATORIE IBERICA SRL 2.088 21,202,183 41 859,409 70 Oradea, BIHOR
25 METALSIL PROD SRL 2.038 55,909,679 30 1,432,394 68 Brasov, BRASOV
26 EUCASTING RO SRL 2.038 32,561,111 36 1,674,545 175Geamana, Localitate:
Bradu, ARGES
27 TURNOVI SRL 2.000 20,782,499 42 1,628,870 20 Deva, HUNEDOARA
28 COZMIRCOM SA 1.938 45,020,674 33 8,068,970 91Baia Sprie, MARA-
MURES
29 EURO ALIAJ SRL 1.900 113,086,640 25 2,496,031 7 Brasov, BRASOV
30 BECOTEK METAL SRL 1.788 162,833,787 22 9,565,159 125 Ghimbav, BRASOV
31 AMORELLI EXPORT IMPORT SRL 1.788 21,853,182 40 737,271 115 Brasov, BRASOV
32 MAIRON TUBES SRL 1.738 93,986,039 28 1,078,217 98 Bucuresti, Sector 3
33 TURNATORIA CENTRALA ORION SA* 1.725 24,404,047 39 -1,048,819 294 Campina, PRAHOVA
34 ALMET SA 1.700 46,770,429 32 445,917 41 Navodari, CONSTANTA
35 HOEGANAES CORPORATION EUROPE SA 1.688 163,564,334 21 7,011,241 89 Buzau, BUZAU
36 TECHNOSTEEL LBR SRL 1.688 141,175,850 24 235,987 192 Iasi, IASI
37 INTFOR SA 1.638 49,356,551 31 -6,047,620 198 Galati, GALATI
38 ARCELORMITTAL TUBULAR PRODUCTS GALATI SRL 1.588 104,290,242 26 -2,960,365 183 Galati, GALATI
39 DELTA ALUMINIU SRL 1.588 35,370,409 35 412,692 182 Slatina, OLT
40 PRODNEF COM SRL 1.500 37,539,105 34 926,493 21 Slatina, OLT
41 UNIVERSAL ALLOY CORPORATION EUROPE SRL 1.488 101,198,120 27 16,569,378 234Dumbravita,
MARAMURES
42 FONDAL INTERNATIONAL SRL 1.488 25,743,081 38 202,821 130 Letcani , IASI
43 OTELINOX SA 1.475 144,150,551 23 -17,178,546 847Targoviste,
DAMBOVITA
MCR METAL


MANUFACTURE OF METAL PRODUCTSRANK COMPANY NAME MCR
SCORING ANNUAL TURNOVER
( 2011 RON)TURNOVER
RANKINGPROFIT/LOSS
(2011 RON)NO OF
EMPLOYEES CONTACT
1 CONFIND SRL 2.963 218,829,078 6 29,715,977 1,124 Campina, PRAHOVA
2 CORD ROMANIA SRL 2.875 383,708,042 2 18,823,477 458 Slatina, OLT
3 AROMET SA 2.788 397,865,426 1 2,310,909 187 Buzau, BUZAU
4 CAN-PACK ROMANIA SRL 2.638 289,642,596 5 19,151,136 157 Bucuresti, Sector 4
5 ELSID SA 2.625 369,766,683 3 74,532,525 255 Titu, DAMBOVITA
6 ROMTEM SA 2.400 295,573,210 4 1,350,989 18 Buzau, BUZAU
7 VILMAR SA 2.225 180,160,932 7 13,008,314 331 Ramnicu-Valcea, VALCEA
8 GIC NOSAG METAL SRL 2.125 128,464,820 9 5,474,244 389 Bradu, ARGES
9 NIMET SRL 2.088 99,917,169 15 7,052,781 182Lazuri, Comisani,
DAMBOVITA
10 INSERV STEEL SRL 2.088 50,447,272 41 1,020,125 68 Baia Mare, MARAMURES
11 ELDON SRL 2.075 105,249,279 13 4,272,169 478 Prejmer, BRASOV
12 DUCTIL SA 2.025 144,001,341 8 7,947,937 262 Buzau, BUZAU
13 EMAILUL SA 2.025 77,718,407 26 1,715,657 914 Medias, SIBIU
14 ESTROM CONSULTING SRL 2.000 62,531,240 30 1,048,593 2 Galati, GALATI
15 ISOPAN EST SRL 1.988 96,994,032 18 7,466,197 60 Popesti Leordeni, ILFOV
16 ARMAX GAZ SA 1.975 81,328,034 24 2,321,621 343 Medias, SIBIU
17 HECKLER ROMANIA SRL 1.900 52,433,230 38 629,376 28 Selimbar, SIBIU
18 METAL WORK INDUSTRY SRL 1.888 54,399,696 36 -1,618,713 84 Popesti-Leordeni, ILFOV
19 IMUC SA 1.825 30,111,110 43 2,550,030 276 Bradu, ARGES
20 LINDAB SRL 1.788 89,906,865 23 -805,446 138 Stefanestii de Jos, ILFOV
21 PROINVEST GROUP SRL 1.788 76,605,829 28 1,651,310 173 Pascani, IASI
22 MEGAPROFIL SRL 1.738 117,635,936 11 1,803,005 115 Buzias, TIMIS
23 PLASTSISTEM SA 1.738 79,252,850 25 408,015 68Crainimat, Comuna
Sieu-Magherus, BISTRITA-NASAUD
24 CSI ROMANIA SRL 1.738 58,829,471 33 2,888,325 184 Cluj-Napoca, CLUJ
25 ALLSTAR PROD SRL 1.738 54,730,338 35 8,251,005 191 Cristesti, MURES
26 CARDO PRODUCTION HUNEDOARA SRL 1.738 51,873,897 39 533,811 170 Hunedoara, HUNEDOARA
27 MIRO SA 1.725 46,326,513 42 561,060 290Bistrita, BISTRITA-
NASAUD
28 VULCAN SA 1.713 93,236,632 21 -30,652,033 1,022 Bucuresti, Sector 4
29 UZINGRUP VEST SRL 1.700 58,360,433 34 118,560 38 Hunedoara, HUNEDOARA
30 FIERCTC SIBEL SRL 1.688 110,408,192 12 3,043,429 131 Galati, GALATI
31 FAIST MEKATRONIC SRL 1.675 96,509,648 19 8,922,896 305 Oradea, BIHOR
32 METABET CF SA 1.675 77,436,260 27 8,216,093 503 Bucuresti, Sector 1
33 TOPANEL PRODUCTION PANELS SA 1.650 59,309,641 31 2,393,487 47 Ramnicu Valcea, VALCEA
34 MARTIFER CONSTRUCTII SRL 1.638 98,636,643 16 1,451,981 183 Bucuresti, Sector 3
35 DOLADELA COMPANY SRL 1.600 69,540,016 29 3,571,422 49 Galati, GALATI
36 AUTOHTON TIM SRL * 1.588 59,162,824 32 -8,671,642 99 Timisoara, TIMIS
37 TUREX SA 1.550 95,448,116 20 79,364 1 Buzau, BUZAU
38 TEHNIC GRUP MC SRL 1.550 51,374,427 40 83,151 1 Buzau, BUZAU
39 PROFILAND STEEL SRL 1.538 118,469,615 10 467,705 86 Galati, GALATI
40 COMPANIA NATIONALA ROMARM SA 1.538 97,860,666 17 23,832 82 Bucuresti, Sector 6
41 BOG ART STEEL SRL 1.488 54,188,230 37 -394,707 57 Bucuresti , Sector 3
42COMPANIA NATIONALA ROMARM SA BUCUR-ESTI FILIALA SOCIETATEA COMERCIALA UZINA MECANICA CUGIR SA
1.463 104,772,094 14 -8,520,645 1,080 Cugir, ALBA
43 METALICPLAS IMPEX SRL 1.388 93,029,267 22 -283,422 228 Dej, CLUJ
* under law 85
MCR METAL

WHOLESALE OF METALS AND METAL ORESRANK COMPANY NAME MCR SCORING ANNUAL TURNOVER
( 2011 RON)TURNOVER
RANKINGPROFIT/LOSS
(2011 RON)NO OF
EMPLOYEES CONTACT
1 MECHEL SERVICE ROMANIA SRL 3.175 816,528,524 2 14,770,336 365 Bucuresti, Sector 3
2 MAIRON GALATI SA 3.075 883,323,141 1 29,629,929 367 Galati, GALATI
3 METALROM SRL 2.800 242,779,829 5 2,253,653 25 Bucuresti, Sector 1
4 DAN STEEL GROUP NEGRESTI OAS SA 2.600 259,028,625 4 6,129,485 26Negresti-Oas,
SATU MARE
5 IZOMETAL - MAGELLAN SRL * 2.438 363,253,552 3 2,265,908 241 Timisoara, TIMIS
6 ALUMIL ROM INDUSTRY SA 2.338 74,007,746 17 3,683,071 171 Bucuresti, Sector 5
7 BAUROM CONSTRUCT SRL 1.938 176,424,237 7 3,792,485 131 Chitila, ILFOV
8 MIRAS INTERNATIONAL SRL 1.938 138,963,541 9 10,360,008 91 Buftea, ILFOV
9 STEELMET ROMANIA SA 1.900 101,938,573 12 1,510,887 29 Bucuresti, Sector 3
10 PROSIDER INTERNATIONAL TRADING SRL 1.850 80,288,612 16 2,065,196 36 Bucuresti, Sector 3
11 CLEMANS SRL 1.788 85,977,641 15 4,369,405 107 Bascov, ARGES
12 TURBO TUB SRL 1.750 64,925,990 19 871,723 40Bucuresti,
BUCURESTI
13 TEHNOINVEST TRADE SRL 1.750 59,385,388 21 94,600 20 Bucuresti, Sector 1
14 MELINDA-IMPEX STEEL SA 1.688 157,017,358 8 5,780,942 131Odorheiu Secuiesc,
HARGHITA
15 ARCELORMITTAL DISTRIBUTION ROMANIA SRL 1.600 176,549,307 6 -6,907,545 26 Bucuresti, Sector 6
16 ITALINOX 1.538 64,718,035 20 1,138,151 51 Bucuresti, Sector 1
17 COMTECH CO SRL 1.500 98,755,432 13 2,664,552 34 Slatina, OLT
18 FRANKSTAHL ROMANIA SRL 1.500 91,477,607 14 897,574 35 Bucuresti, Sector 4
19 ADIMET SA 1.500 54,819,787 22 238,011 25 Iasi, IASI
20 THYSSENKRUPP MATERIALS ROMANIA SRL 1.488 121,386,745 10 -4,882,470 56 Bucuresti, Sector 1
21 METALICPLAS DISTRIBUTION SRL 1.438 69,702,850 18 3,016 127 Dej, CLUJ
22 METALTRADE 1.425 50,705,495 23 -3,879,191 296 Galati, GALATI
23 SIDMA ROMANIA SRL 1.300 109,564,984 11 -4,050,353 39 Caldararu, ILFOV
79
2012 EDITION Major Companies in Romania
DIE CASTING ALUMINIUM
A52 Grivitei Street, 500173, Brasov, Brasov CountyTelefon: +40-268-47.33.01; +40-268-40.60.50 ; +40-268-40.60.70; Fax: +40-268-47.33.02
e-mail: [email protected]; [email protected] WEB site: www.morelli.ro


812012 EDITION Major Companies in Romania
1.25billion EUR is the overall turnover of the 8 Romanian shipyards in 2011, 25 percent increase over 2010
Machinery MANUFACTURE OF MACHINERY, INDUSTRIAL EQUIPMENT,
SHIPS AND AIRCRAFT WHOLESALE OF MACHINERY, INDUSTRIAL EQUIPMENT,
SHIPS AND AIRCRAFT

The Romanian machinery sector, which includes aircraft, railway, military and naval producers, saw its first ray of sunshine in 2012, after the several-year storm that haunted the industry. Producers managed to reduce their losses from 33.2% y/y in 2010 to 5.48% a year later, according to the sector’s production index in terms of volume released by Eurostat. The sun started to beam in 2012, when the index showed a 21.6% y/y growth in the first eight months of the year, compared to the 5.6% growth at the European Union level.
The industries included in this sector had completely different evolutions as reported to the sector’s overall trend.
The Romanian shipyards, which export almost their entire productions, increased their turnover by 25% y/y in 2011, up to EUR 1.25bn, shows the ANCONAV (Romanian Shipbuilders Association) data. However, in spite of the higher turnover, 2011 wasn’t a good year for the industry and continued the descending trend started in 2008. The eight local shipyards received 41 new orders through IHC Fairplay (the company that gives each ship its unique IMO number), of which only 16 were for new ships, compared to the 21 received the previous year. The rest were orders placed for ship bodies, with an outfitting degree of 80% to 90%.
Producers adapted to the market and tried to cut their costs by giving up 1,500 subcontractors. Local shipyards currently employ 8,800 people, less than half compared to 2008.
Things started to improve in 2012, when 16 new ships had already been ordered by October. “The trend is positive this year and I expect 3% to 4% growth of the shipyards’ turnover. I think the number of new orders will increase by additional 50% by the summer of 2013,” said Gelu Stan, general manager of ANCONAV.
The eight shipyards don’t compete among each other for new projects, as they are specialized on different niches. STX OSV Tulcea and STX OSV Braila produce supply vessels/AHTS (anchor handling tug supply) vessels and tugs. Damen Galati builds military ships and tugs/AHTS. Daewoo Mangalia Heavy Industries is specialized on containers of minimum 5,500 TEU and bulk carriers of 80,000 to 180,000 tdw. Constanta Shipyard specializes in 40,000 to 55,000 tdw oil tanks and does construction works. The other three – Severnav Drobtea Turnu Severin, Orsova Shipyard and Shipyard ATG Giurgiu – are located at the Danube and focus especially on fluvial ships and coastal vessels.
“There is a big demand for special and military vessels. Romanian shipyards need to adapt to the demand for green vessels, such as windmill-related offshore ships,” said Stan.
That’s why the Tulcea and Braila shipyards, which produce special ships such as offshore specialized vessels, have the highest workload in Romania, of 110%. Next comes Damen Galati, which is building several special ships like a military vessel for the Dutch navy and a Swedish nuclear waste transport vessel. The workload is nevertheless low compared to the 200% in 2006.
TROUBLE ON WHEELSThe situation looks more dramatic for the rolling stock sector, which has contracted for the fourth year in a row, by 2.4% y/y in the first half of 2012, according to Eurostat data. The Baltic Dry index, a barometer of the world commerce, continues to have very low values compared to the years before the crisis.
Demand for railway equipment has decreased sharply both in Romania and in Europe. Previous investments in this sector have led to a surplus of production capacities that suffer from
MCR MACHINERY
Magda Munteanu - Freelance Journalist
THE AIRCRAFT INDUSTRY HAD THE BEST EVOLUTION WITHIN THE SECTOR, AS ITS PRODUCTION INDEX IN TERMS OF VOLUME INCREASED IN THE EUROPEAN UNION BY 10.9% Y/Y DURING THE FIRST EIGHT MONTHS OF 2012.
Better than expectedNaval shipyards specialized and started to receive new orders, while rolling stock producers fight overcapacities and lack of projects.

lack of new orders. Prices have decreased and competition has fueled, as projects are less available in Europe. Chances that the market will improve in 2013 are small. The Romanian market suffers from lack of financing, in spite of a real need to upgrade its railway infrastructure.
Electroputere Craiova, one of the largest local producers of locomotives, electric engines, power transformers and electrical equipment, has struggled for years to reduce its losses and grow business. The company, which was privatized in 2007 and acquired by Saudi firm Al-Arrab Contracting Company, was forced to close its locomotive business this year because of low demand and outdated technology. The division had focused on locomotive repairing works during the last two years and had worked with the GFR group and a private Slovakian operator.
“By the end of this year we will finalize the restructuring process of the company, which took much longer than expected. We will focus on export of power transformers and electric engines in the MENA region and the Gulf countries,” said Adrian Dumitriu, CEO of Electroputere Craiova.
The company decreased its turnover by 32% y/y in 2011, down to EUR 47mn, while losses soared up to EUR 11.4mn. The same trend continued in H1 2012, with losses increasing by 8.66% y/y, up to EUR 6.6mn.
The industry consolidated in July this year, when the German group Astra Rail Industries acquired Astra Vagoane Arad, Meva Drobeta Turnu Severin and Romvag Caracal for EUR 30mn.
The Germans plan EUR 10mn investments within the first year from the takeover in new equipment and will focus on the European markets, followed by Russia and Middle East.
EASIER LANDING The aircraft industry had the best evolution within the sector, as its production index in terms of volume in the European Union increased by 10.9% y/y during the first eight months of 2012. The Eurostat data indicates the growth was of 6.5% y/y in 2011. “This evolution shows that passenger air traffic continues to increase, in spite of the great recession,” said Andrei Radulescu, senior investment analyst at SSIF Broker.
In comparison, the military vehicles sector decreased by 1.6% y/y in the EU during the first eight months of 2012, following a 20% y/y growth in 2011. The decrease is the result of the budget constraints operated by Western countries.
The evolution of the machinery sector in 2013 will depend directly on how the US economy solves its budgetary and fiscal problems, on how the ongoing European crisis develops and on how China manages to avoid a forced landing. “US sentiment indicators show there are premises for the world economy to reach an inflection point in the last quarter of 2012 or the first quarter or 2012 and to start a gradual growth process in 2013,” said Radulescu. However, the analyst warns the aircraft industry could see a slowdown next year, no matter the world macro-financial climate.
Source: Eurostat, SSIF Broker
832012 EDITION Major Companies in Romania
Manufacture of other transport equipment (%, y/y, MA12)
“US SENTIMENT INDICATORS SHOW THERE ARE PREMISES FOR THE WORLD ECONOMY TO REACH AN INFLECTION POINT IN THE LAST QUARTER OF 2012 OR THE FIRST QUARTER OR 2013 AND TO RESTART A GRADUAL GROWTH PROCESS IN 2013” - Andrei Radulescu, Senior Investment Analyst at SSIF Broker.
-40.0
-30.0
-20.0
-10.0
0.0
10.0
20.0
30.0
-6.0
-4.0
-2.0
0.0
2.0
4.0
6.0
8.0
10.0
Dec
-00
Jul-
01
Feb-
02
Sep-
02
Apr-
03
Nov
-03
Jun-
04
Jan-
05
Aug-
05
Mar
-06
Oct-
06
May
-07
Dec
-07
Jul-
08
Feb-
09
Sep-
09
Apr-
10
Nov
-10
Jun-
11
Jan-
12
Aug-
12
European Union Romania (rhs)

One of the main factors of attraction for major foreign investment, but also for local investors, has always been the level of qualification of the workforce. Unfortunately, for investors this factor also represents one of the main risk factors in terms of growth opportunities. Availability of well-qualified workforce is one of the most often cited factors by investors in recent years regarding the risks of future growth, the emergence of new investments and even the stability of existing local investments. These fears are primarily connected to the quality of the graduates training in both undergraduate education, and higher education, but also to the reduced number of young people who are training in occupations that are in high demand in the industry. In the undergraduate education system, these fears can be removed by setting up vocational schools, teaching searched specializations and raising the level of training in both content and quality of education. In both directions, an important role has to be taken by economic agents. Through the government ordinance in February 2012 on the (re)establishment of vocational education was made a first step by creating a legal framework in which businesses can get involved to raise the level of training.
Companies will need to get involved both in defining school profiles and adapt curricula, as well as in taking responsibility for training students, their management and financial support through scholarships, organizing practice
programs in enterprises. The economic environment has made the first steps and we hope for consistency, collaboration and political continuity to achieve a first major success in the Romanian school education of the last 20 years. In this way we will form true professionals, we will increase the employability of young generations and we will finally enable the economic growth that we need so much.
In such circumstances economic agents must react by adapting costs and consumption to the reduced level of orders. Unfortunately, these measures may not circumvent labor costs and this can ultimately mean, depending on the intensity and duration of the unfavorable conjuncture, staff reductions. Certainly, the business community has never seriously expected a miracle solutions from the state to re-launch the economy, and support the economic agents. We often heard the expression "it would be sufficient if the state would not confuse us more than usual", but it would be a pleasant surprise to see that the Romanian state would be concerned at some point about how they could improve the "rules of the game" towards the mutual interest of all parties involved and ultimately its own citizens. So you might find that the legislation which provides for the possibility of reducing staff costs in times of recession by applying a "technical unemployment", in which the company would have to pay affected employees 75% of their salary, provided that they remain home, is outdated and probably only a company
Opinion
Let’s invest in skilled workforceALEXANDRU BLEMOVICI,
General Manager Schaeffler Romania
with bad management would apply it. Instead, there could be created, for example, a formula where the economic agent could reduce for a determined period working time and labor costs by a certain percentage, the state would support the deficit to complete the income of the affected employees, by the reduction of social contributions of the economic agent in this period and redirecting those funds to these employees. In this way a company could overcome certain circumstances, avoiding negative effects on individual employees through layoffs, while also reducing additional efforts of the state with unemployment benefits in unfavorable economic periods.
“PILOT VOCATIONAL SCHOOLS COULD BE A GOOD START TOWARDS MAINTAINING AND INCREASING THE ATTRACTIVENESS OF ROMANIA AS A SERIOUS INVESTMENT DESTINATION THROUGH A STRONG QUALITY/COST OF LABOR RATIO.”
MCR

MANUFACTURE OF MACHINERY, INDUSTRIAL EQUIPMENT, SHIPS AND AIRCRAFTRANK COMPANY NAME MCR SCORING ANNUAL TURNOVER
( 2011 RON)TURNOVER
RANKINGPROFIT/LOSS
(2011 RON)NO OF
EMPLOYEES CONTACT
1 DAEWOO-MANGALIA HEAVY INDUSTRIES SA 3.613 1,725,406,261 1 -72,788,618 3,065Mangalia,
CONSTANTA
2 SCHAEFFLER ROMANIA SRL 3.513 1,481,631,232 2 7,417,486 3,267Comuna Cristian,
BRASOV
3 STX RO OFFSHORE BRAILA SA 3.063 375,914,905 5 50,378,911 1,815 Braila, BRAILA
4 RULMENTI SA 2.913 261,601,928 9 18,959,099 2,339 Barlad, VASLUI
5 TIMKEN ROMANIA SA 2.875 351,791,919 6 86,447,728 852 Ploiesti, PRAHOVA
6 KOYO ROMANIA SA 2.813 231,283,959 11 4,551,725 1,345Alexandria,
TELEORMAN
7 GRUP ROMET SA 2.788 624,090,512 3,843,537 79 Buzau, BUZAU
8 EMERSON SRL 2.775 205,770,924 12 28,392,323 698 Cluj-Napoca, CLUJ
9 CAMERON ROMANIA SRL 2.675 677,011,157 3 51,853,430 845 Campina, PRAHOVA
10 SANTIERUL NAVAL DAMEN GALATI SA 2.663 273,123,588 8 13,581,756 1,573 Galati, GALATI
11 STX RO OFFSHORE TULCEA SA 2.613 505,287,393 4 9,137,030 2,745 Tulcea, TULCEA
12 ELECTROPRECIZIA SA 2.588 216,284,347 450,614 127 Sacele, BRASOV
13 ROMBAT SA 2.575 319,058,489 7 14,888,862 630Bistrita,
BISTRITA-NASAUD
14 VAE APCAROM SA 2.488 90,153,992 23 7,163,903 205 Buzau, BUZAU
15 ECOFOREST SA 2.450 238,608,873 370,500 12 Buzau, BUZAU
16 BOSCH REXROTH SRL 2.425 243,591,907 10 9,054,261 598 Blaj , ALBA
17 AEROSTAR SA 2.413 158,402,223 13 11,618,296 1,219 Bacau, BACAU
18 UNIO SA 2.363 98,090,445 22 272,924 1,017Satu Mare,
SATU MARE
19 SEVERNAV SA 2.275 118,965,970 19 1,409,754 664Drobeta-Turnu
Severin, MEHEDINTI
20 RIG SERVICE SA 2.275 78,211,202 27 15,069,527 468Constanta,
CONSTANTA
21 UZTEL SA * 2.275 76,985,891 28 5,443,317 596 Ploiesti, PRAHOVA
22 MADIROM PROD SRL 2.200 153,293,655 15 4,965,550 19 Timisoara, TIMIS
23 SMR SA 2.175 72,858,798 31 40,167 974 Bals, OLT
24 ROTEC SA BUZAU 2.125 64,419,150 34 1,250,786 446 Buzau, BUZAU
25 REMARUL 16 FEBRUARIE SA 2.025 119,602,038 18 1,209,916 507 Cluj-Napoca, CLUJ
26 EUROSPORT DHS SA 2.025 105,382,434 21 1,404,255 255 Deva, HUNEDOARA
27 ATELIERELE CFR GRIVITA SA 2.025 85,532,721 24 3,201,018 614 Bucuresti, Sector 1
28 REMAR SA 2.025 79,061,602 26 599,358 570 Pascani, IASI
29 IAR SA 2.025 62,378,408 36 2,897,416 323 Ghimbav, BRASOV
30 UCM RESITA SA * 2.013 123,083,808 17 -328,082,796 2,264Resita,
CARAS-SEVERIN
31 SANTIERUL NAVAL CONSTANTA SA 2.013 67,465,911 33 -10,469,904 1,352Constanta, CON-
STANTA
32 POPECI UTILAJ GREU SA 1.975 81,784,790 25 3,093,758 668 Craiova, DOLJ
33 ASTRA VAGOANE ARAD SA * 1.963 147,006,528 16 37,053,917 1,354 Arad, ARAD
34 EMERSON PROCESS MANAGEMENT ROMANIA SRL
1.950 75,579,567 30 10,849,724 48 Bucuresti, Sector 2
35 DANEX CONSULT SRL 1.938 70,784,378 32 488,046 135 Bucuresti, Sector 2
36 FILIALA PENTRU REPARATII SI SERVIC - HIDRO-SERV RAMNICU VALCEA SA
1.925 57,875,838 37 1,385,411 374Rimnicu Valcea,
VALCEA
37 MASCHIO-GASPARDO ROMANIA SRL 1.888 76,114,857 29 2,473,977 121 Chisineu-Cris, ARAD
38 TOTALGAZ INDUSTRIE SRL 1.875 62,708,554 35 4,090,333 315 Iasi, IASI
39 ROMAERO SA 1.875 57,614,188 38 397,545 964 Bucuresti, Sector 1
40 ASTRA VAGOANE CALATORI SA 1.825 106,362,543 20 7,780,188 876 Arad, ARAD
41 GENERAL TURBO SA 1.775 153,964,812 14 9,072,461 720 Bucuresti, Sector 4
* under law 85/2006
852012 EDITION Major Companies in Romania

WHOLESALE OF MACHINERY, INDUSTRIAL EQUIPMENT, SHIPS AND AIRCRAFTRANK COMPANY NAME MCR SCORING ANNUAL TURNOVER
( 2011 RON)TURNOVER
RANKINGPROFIT/LOSS
(2011 RON)NO OF
EMPLOYEES CONTACT
1 IPSO SRL 2.688 369,638,427 2 21,063,687 238 Mogosoaia, ILFOV
2 SIEMENS SRL 2.675 475,386,469 1 19,781,890 469 Bucuresti, Sector 6
3 ABB S.R.L. 2.488 209,675,907 3 2,288,361 81 Bucuresti, Sector 1
4 NHR AGROPARTNERS S.R.L. 2.338 50,098,140 18 2,436,059 133 Otopeni, ILFOV
5 DUTCH MARINE TRADING DESIGN S.A. 2.288 38,811,697 24 3,297,195 60 Galati, GALATI
6 DAAS IMPEX SRL 2.238 87,640,902 8 2,488,836 149 Bucuresti, Sector 1
7 AGROCOMERT HOLDING S.A. 2.238 73,431,911 12 9,130,774 74 Timisoara, TIMIS
8 MEWI IMPORT EXPORT AGRAR INDUSTRI-ETECHNIK SRL
2.138 113,756,391 4 10,798,800 52 Ortisoara, TIMIS
9 NITECH S.R.L. 2.138 64,449,192 14 6,813,162 67 Bucuresti, Sector 1
10 SANDVIK S.R.L. 2.050 42,397,655 22 344,949 - Bucuresti, Sector 5
11 ANDREAS STIHL MOTOUNELTE SRL 2.000 102,643,534 5 17,270,967 23 Otopeni, ILFOV
12 HAUSER SRL 2.000 62,147,135 15 2,622,098 4 Bucuresti, Sector 1
13 GENERAL LEASING SA 1.988 78,734,866 9 14,051,084 76 Bucuresti, Sector 1
14 SYSCOM - 18 S.R.L. 1.988 46,169,737 20 261,672 132 Bucuresti,
BUCURESTI
15 PROENERG SA 1.938 32,428,390 27 2,147,147 65 Bucuresti, Sector 4
16 HEPA PROIECT SRL 1.900 76,216,643 11 1,094,120 22 Birlad, VASLUI
17 MECRO SYSTEM SRL 1.900 34,956,383 25 2,617,103 49 Bucuresti,
BUCURESTI
18 KAESER KOMPRESSOREN SRL 1.900 30,534,661 28 5,478,130 38 Bucuresti, Sector 1
19 ATLAS COPCO ROMANIA SRL 1.888 52,555,351 16 2,945,188 53 Otopeni, ILFOV
20 WIRTGEN ROMANIA S.R.L. 1.850 89,315,600 7 13,103,406 30 Otopeni, ILFOV
21 ISIS DEVELOPMENT SRL 1.800 34,901,615 26 2,949,015 18 Bucuresti, Sector 1
22 WILO ROMANIA SRL 1.788 47,262,566 19 4,614,262 51 Chiajna, ILFOV
23 MAP - MASINI AGRICOLE PERFORMANTE S.R.L. 1.750 96,617,784 6 1,726,298 38 Cernica, ILFOV
24 FRESCO PROIECT SRL 1.750 40,197,772 23 1,247,868 42 Pantelimon, ILFOV
25 HUSQVARNA PADURE & GRADINA SRL 1.700 78,559,035 10 10,711,665 31 Bucuresti, Sector 1
26 UZINSIDER TECHNO S.A. 1.700 51,264,303 17 1,678,671 19 Bucuresti, Sector 3
27 DOLSCH IMPORT-EXPORT SRL 1.650 30,400,833 29 1,040,788 43 Pitesti, ARGES
28 AGRIROM IMPEX S.R.L. 1.600 64,585,817 13 537,879 1 Galati, GALATI
29 INDUSTRIAL M.D.TRADING SRL 1.500 43,443,470 21 6,598,241 7 Bucuresti, Sector 5
MCR MACHINERY


Electric & ElectronicEquipment MANUFACTURE OF ELECTRICAL AND ELECTRONIC EQUIPMENT TRADE OF ELECTRICAL AND ELECTRONIC EQUIPMENT MANUFACTURE OF DOMESTIC APPLIANCES
892012 EDITION Major Companies in Romania
58million EUR worth sales of electronics as of Q2 of 2012
EUR 43 million, the value of mobile phones and smartphones market as of Q2 of 2012

What has by now become a cliché is the degree to which the economic crisis has impacted on the Romanian purchasing power and, subsequently, on the consumer behaviour throughout a wide range of sectors.
Still, by reshuffling budgets or making an extra effort to secure a desired commodity, Romanians seem to have pushed the electronics market forward, according to a Gfk survey on the segment.
The market research company released figures for the second quarter of 2012, analyzing the moves on the market which is very volatile and is subject to overnight changes driven by a sensitive pricing factor.
ELECTRONICS: TV SETS SEEM MEANT TO ‘SAVE’ THE MARKETSales for electronic equipments went up three per cent in the second quarter of 2012, reaching 58 million Euro, according to the Gfk survey. Significant increases were registered mainly in the total sales of flat-screen TVs, the two-digit increase rates on this market being supported by promotions, linked mainly to special events, such as the European Championships.
The TV market has also managed to generate added value by switching from LCD to LED devices. More than half of the sales were generated by the sale of LED models. Worth mentioning is the fact that sales for other electronic devices were either stable or negative in the second quarter of the year.
TELECOM: SMARTPHONES CONTINUE TO BOOST THE SECTORThe total value of the mobile phones and smartphones market in the second quarter of the year saw a slight increase, of just 0.7 per cent, over the corresponding period in 2011, to a total of 43 million Euro. Smartphones continue to grow in sales and managed to steer the Telecom segment on an uptrend.
As a particularity, Romanians prefer Android-endowed smartphones, which come with a 5.5 MP camera and a touch screen. Despite losing ground to smartphones, mobile phones are still dominating the telecom market, according to Gfk.
IT: TABLETS STILL REIGN AT THE BORDER BETWEEN IT AND TELECOMThis year’s second quarter seemed relatively stable for the IT market. The sector dropped two per cent over the year-ago period, reaching 84 million Euro. Computer screens and desk computers also registered decreases of two per cent, while laptop sales were close to the value registered in the second quarter of 2011. What was revealed as a pleasant surprise in Q2 2012, was the slight increase in sales for peripherals (mice, keyboards, and webcams)
However, the ‘star’ at the frontier between IT and Telecom – the tablets – has this quarter as well managed to level the market, owing to the advantages it offers to the consumer: mobility, flexibility and a friendly interface.
PRINTERS: LASER MULTIFUNCTIONALS ENSURE STABILITYThe market for printers and multifunctionals remains stable, at around seven million Euro in the second quarter of 2012, with a slight decrease of 2.9 per cent over the previous year. This was largely due to an increase in sales for multifunctional devices mainly bought by home users. The inkjet market seems to lose ground to devices that come with laser technology, but they still rank high in the overall office equipment market.
The study says consumption stimulation instruments are needed to surpass the seven million Euro mark, both in the home segment and in the business-to-business one.
SMALL HOME APPLIANCES: SEGMENT SEES CHALLENGESThe instable political environment, as well as the recession in many Euro zone countries, has led to a slow down of the Romanian economy growth, which was considerably felt on the segment of small home appliances. With a decrease of nine per cent in Euro, the value of the small home appliances market stood at 22 million Euro in the second quarter of the year, compared to 24 million Euro in Q2 2011.
Main product categories that have contributed to the decline were among the largest small home appliances segments, such as appliances to prepare food, vacuum cleaners and appliances that remove body and facial hair (for both male and female).
MCR ELECTRIC & ELECTRONIC EQUIPMENT
Moderate raise keeps market af loat
Corina Mica - Freelance Journalist

91
Only one category managed to ‘shine’ in this quarter again: beverage-making appliances. The remarkable increase in this quarter was pushed forward by sales of high-pressure equipment (full-automated espresso machines, capsule-based espresso machines and traditional espresso makers), as well as a good performance in sales by low-pressure, capsule-based coffee makers.
Despite descending tendencies in the category of small home appliances, there were also segments which registered a good evolution: vacuum cleaners without dust collectors – an increase of three per cent; ironing systems saw a two per cent increase, while fruit and vegetable squeezers also saw a slight increase of two per cent in sales.
LARGE HOME APPLIANCES: TWO-DIGIT DECREASE RATE IN Q2With over ten million Euro more in sales in the first quarter, but still ten per cent less than in Q2 2011, the segment of large home appliances ranks second in the long-term use consumer goods category. As a particularity, the interest rate had an impact on this market - while if evaluated in Euro, the segment decreased by ten per cent, in the national currency, the decrease stood at only three percent. When compared to the national currency, some categories, such as ovens, washing machines, freezers and cookers have witnessed increase rates.
Evolutions within the sector were diverse; whether the largest segments of large home appliances dropped two-digits in percentages, developing segments, such as ovens, cookers, dishwashers and dryers have decreased just slightly compared to the equivalent period of last year, in Euro. Despite these small segments registering good results from a quarter to another and promising good future results, they stand for only 12 per cent of the entire large home appliances market.
Despite retailers’ and producers’ expectations, aggressive promotions on the refrigerators and freezers markets did not manage to push forward sales above the 2011 value.
Moreover, the microwave market sells 20 per cent less units than last year.
The washing machines market continues the decrease it began in Q1 2012, some types even by two digits. Consumers lose their trust and mood to buy, with a tendency to become reluctant in purchasing large home appliances this time of the year.
2012 EDITION Major Companies in Romania

MANUFACTURE OF ELECTRICAL AND ELECTRONIC EQUIPMENTRANK COMPANY NAME MCR SCORING ANNUAL TURNOVER
( 2011 RON)TURNOVER
RANKINGPROFIT/LOSS
(2011 RON)NO OF
EMPLOYEES CONTACT
1 COFICAB EASTERN EUROPE SRL 3.875 1,133,672,090 1 63,538,680 378 Arad, ARAD
2 EATON ELECTRO PRODUCTIE SRL 3.213 814,087,797 2 35,083,922 1,829 Sarbi, MARAMURES
3 ELECTROMAGNETICA SA 2.875 495,195,622 6 15,075,281 535 Bucuresti, Sector 5
4 LEONI WIRING SYSTEMS ARAD SRL 2.863 510,879,742 5 14,249,600 2,999 Arad, ARAD
5 ZES ZOLLNER ELECTRONIC SRL 2.825 231,786,310 13 13,346,129 832Satu Mare,
SATU MARE
6 ENERGOBIT SRL 2.788 386,956,309 9 42,078,764 184 Cluj-Napoca, CLUJ
7 MARQUARDT SCHALTSYSTEME SCS 2.763 518,218,340 4 32,441,032 1,048 Sibiu, SIBIU
8 AEM SA 2.763 258,532,296 12 22,915,111 1,370 Timisoara, TIMIS
9 CUMMINS GENERATOR TECHNOLOGIES ROMANIA SA
2.725 265,401,137 11 3,012,892 707 Craiova, DOLJ
10 ICME ECAB SA 2.625 652,464,236 3 13,084,487 563 Bucuresti, Sector 3
11 FLEXTRONICS ROMANIA SRL 2.613 207,076,079 14 7,117,714 2,090 Timisoara, TIMIS
12 STEINEL ELECTRONIC 2.525 323,142,325 10 6,579,817 531Curtea de Arges,
ARGES
13 FRIGOGLASS ROMANIA SRL 2.463 408,958,638 8 -3,093,989 1019 Parta, TIMIS
14 PRYSMIAN CABLURI SI SISTEME SA 2.375 466,725,014 7 -32,241,259 255 Slatina, OLT
15 IPROEB SA 2.275 110,591,040 25 5,090,943 419Bistrita,
BISTRITA-NASAUD
16 ELECTRO SISTEM SRL 2.238 64,696,370 36 3,775,057 244Baia Mare,
MARAMURES
17 ENERGOBIT PROD SRL 2.188 86,663,140 30 11,079,839 155 Jibou, SALAJ
18 RETEC SA 2.188 80,058,909 32 4,363,330 222 Galati, GALATI
19 ASKOLL ROMANIA SRL 2.175 160,441,683 17 5,611,213 483 Stefanesti, ARGES
20 KUHNKE PRODUCTION ROMANIA SRL 2.175 137,213,319 20 2,411,769 494 Sibiu, SIBIU
21 HARTING ROMANIA MANUFACTURING SOCIE-TATE IN COMANDITA
2.175 124,188,493 22 5,415,022 474 Sibiu, SIBIU
22 ELECTRO-ALFA INTERNATIONAL SRL 2.138 144,591,479 19 10,680,134 248 Botosani, BOTOSANI
23 ELSACO ELECTRONIC SRL 2.125 127,443,961 21 8,519,613 378 Botosani, BOTOSANI
24 SYSTRONICS SRL 2.125 115,157,289 24 1,591,295 340 Arad, ARAD
25 ELECTROPUTERE SA 2.113 199,082,319 15 -48,063,969 1,557 Craiova, DOLJ
26 ZOPPAS INDUSTRIES ROMANIA SRL 2.113 156,078,164 18 18,111,893 2,461Sannicolau Mare,
TIMIS
27 PSICONTROL MECHATRONICS SRL 2.088 53,714,303 39 4,677,526 96 Rasnov, BRASOV
28 ELECTROPLAST SA 2.038 104,491,311 27 1,717,020 174Bistrita,
BISTRITA-NASAUD
29 DIETAL ROUMANIE SRL 2.038 61,341,804 37 1,279,210 204 Codlea, BRASOV
30 EKR-ELEKTROKONTAKT ROMANIA SRL 2.013 79,971,117 33 2,147,750 2,009 Santana, ARAD
31 MIELE TEHNICA SRL 1.988 88,405,313 29 2,201,886 92 Feldioara, BRASOV
32 RCB ELECTRO 97 SA 1.988 78,127,725 34 1,136,704 84Bistrita,
BISTRITA-NASAUD
33 DUCATI ENERGIA ROMANIA SA 1.975 109,035,533 26 4,141,655 359 Busteni, PRAHOVA
34 GEA GRASSO SRL 1.950 30,976,842 41 1,480,151 29 Cluj-Napoca, CLUJ
35 EXIMPROD GRUP SRL 1.938 55,316,277 38 7,498,224 196 Buzau, BUZAU
36 HONEYWELL LIFE SAFETY ROMANIA SRL 1.925 193,368,216 16 2,506,296 639 Lugoj, TIMIS
37 SIBER ROMANIA SRL 1.925 80,530,055 31 1,279,925 314 Lipova, ARAD
38 WEIDMULLER INTERFACE ROMANIA SRL 1.925 75,119,652 35 2,116,069 360Tautii Magherus,
MARAMURES
39 EXIMPROD POWER SYSTEMS SRL 1.900 50,261,286 40 10,898,894 49 Buzau, BUZAU
40 CABLETEAM SRL 1.875 123,667,612 23 235,825 318 Sighisoara, MURES
41 ELECTROPRECIZIA ELECTRICAL MOTORS SRL 1.825 95,684,040 28 3,315,061 542 Sacele, BRASOV
MCR ELECTRIC & ELECTRONIC EQUIPMENT

TRADE OF ELECTRICAL AND ELECTRONIC EQUIPMENTRANK COMPANY NAME MCR SCORING ANNUAL TURNOVER
( 2011 RON)TURNOVER
RANKINGPROFIT/LOSS
(2011 RON)NO OF
EMPLOYEES CONTACT
1 SAMSUNG ELECTRONICS ROMANIA SRL 3.788 1,530,472,159 1 31,852,822 90 Voluntari, ILFOV
2 ALTEX ROMANIA SRL 3.313 882,765,222 2 29,575,030 1,435Piatra Neamt,
NEAMT
3 ERICSSON TELECOMMUNICATIONS ROMANIA SRL 3.063 543,675,580 4 26,220,612 1,433 Bucuresti, Sector 1
4 DOMO RETAIL SA 2.963 701,019,798 3 -27,515,191 1,575Targu Secuiesc,
COVASNA
5 HUAWEI TECHNOLOGIES SRL 2.575 355,269,374 6 -4,686,479 400 Bucuresti, Sector 6
6 GERSIM IMPEX SRL 2.500 249,941,334 7 9,978,978 13 Bucuresti, Sector 2
7 LG ELECTRONICS ROMANIA SRL 2.388 387,977,842 5 1,014,569 73 Bucureti, Sector 1
8 PHILIPS ROMANIA SRL 2.388 240,308,308 8 -9,643,483 85 Bucuresti, Sector 2
9 SCHNEIDER ELECTRIC ROMANIA SRL 2.388 180,153,041 10 5,852,663 168 Bucuresti, Sector 2
10 MOBILE DISTRIBUTION SRL 2.288 206,918,547 9 1,801,571 129 Cluj-Napoca, CLUJ
11 ELBI ELECTRIC & LIGHTING SRL 2.088 89,698,557 16 7,467,266 121 Bragadiru, ILFOV
12 EL&CAB BIZZ SRL 1.950 43,204,053 25 909,937 23 Bucuresti , Sector 1
13 MARELVI IMPEX SRL 1.938 162,461,444 11 3,704,998 96 Radauti, SUCEAVA
14 TOTAL ENERGY BUSINESS SA 1.900 62,403,904 19 7,321,090 33 Bucuresti, Sector 1
15 BSH ELECTROCASNICE SRL 1.900 61,847,437 20 3,219,573 25 Bucuresti, Sector 1
16 B&K ELECTRO SYSTEM SRL 1.900 31,118,213 29 1,084,327 13Baia Mare,
MARAMURES
17 ECAS ELECTRO SRL 1.900 30,402,756 30 2,627,496 31 Bucuresti, Sector 4
18 TOP TECH SRL 1.850 40,193,244 27 1,711,765 20 Carcea, DOLJ
19 ENERGOTECH SA 1.850 31,252,566 28 10,529,015 28 Bucuresti, Sector 6
20 SECPRAL COM SRL 1.838 51,895,356 23 6,564,092 61 Cluj-Napoca, CLUJ
21 WHIRLPOOL ROMANIA SRL 1.800 161,041,071 12 398,447 21 Bucuresti, Sector 1
22 BANESTO SRL 1.800 53,100,277 22 135,381 21Piatra Neamt,
NEAMT
23 GENTRADE COM SRL 1.650 80,481,990 17 121,517 4 Bucuresti, Sector 1
24 OBERTHUR TECHNOLOGIES ROMANIA SRL 1.650 50,242,059 24 4,367,431 27 Bucuresti, Sector 2
25 HAT GROUP CO ROMANIA SA * 1.600 42,958,516 26 -2,958,951 9 Bucuresti, Sector 1
26 GOMAR LUX SA 1.538 92,195,932 15 323,996 65Viisoara, BISTRITA-
NASAUD
27 PAYPOINT SERVICES SRL 1.488 117,037,090 13 -120,788 109 Bucuresti, Sector 1
28 CHORUS MARKETING AND DISTRIBUTION SRL 1.488 57,713,351 21 -1,446,108 147 Bucuresti, Sector 1
29 ELTRIX SRL 1.488 26,626,479 31 71,963 180 Bucuresti, Sector 1
30 GENCO TRADE SRL 1.475 93,980,460 14 -12,522,158 342 Bucuresti, Sector 1
31 AVITECH CO SRL 1.438 70,729,067 18 150,270 155 Voluntari, ILFOV
32 NEXTELEKOM SRL 1.250 22,225,839 32 -584,352 1 Timisoara, TIMIS
MANUFACTURE OF DOMESTIC APPLIANCESRANK COMPANY NAME MCR SCORING ANNUAL TURNOVER
( 2011 RON)TURNOVER
RANKINGPROFIT/LOSS
(2011 RON)NO OF
EMPLOYEES CONTACT
1 ARCTIC S.A. 3.613 1,073,231,988 1 42,149,099 2,532 Gaesti, DAMBOVITA
2 SOGECO ROMANIA S.R.L. 2.575 283,666,391 3 8,372,275 479 Orastie, HUNEDOARA
3 ELECTROARGES S.A. 2.525 125,615,939 4 7,310,566 558Curtea de Arges,
ARGES
4 ELECTROLUX ROMANIA S.A. 2.363 453,284,799 2 -3,500,017 1,002 Bucuresti, Sector 1
5 GRUPUL DE FIRME OMEGA - TEHNOTON 2.188 20,872,173 8 1,007,027 143 Iasi, IASI
6 METALICA S.A. 1.838 23,438,072 7 27,043 185 Oradea, BIHOR
7 HT EST DIVISION SRL 1.488 30,936,320 5 2,676,915 156 Pecica, ARAD
8 TECNOWIND EAST EUROPE S.R.L. 1.488 29,262,854 6 -1,286,034 71 Arad, ARAD
93
2012 EDITION Major Companies in Romania


952012 EDITION Major Companies in Romania
3.5billion EUR, the value of telecom market in 2011, a 3 percent decrease compared with 2010
IT & C TELECOMMUNICATIONS COMMUNICATION EQUIPMENT COMPUTER PROGRAMMING, CONSULTANCY AND
RELATED ACTIVITIES MANUFACTURE AND SALE OF COMPUTERS AND
PERIPHERAL EQUIPMENT

In an environment influenced by the eurozone’s macroeconomic conditions, Romania’s telecom market continued its decreasing trend and reached EUR 3.5 bln in 2011, representing a 3% decrease compared to previous year, as mentioned in the Romania Telecom Sector Report issued in June 2012 (Intellinews).
One of the most important events on the telecom market this year was the recent auction of new spectrum, which will introduce the next phase of development of the wireless data market. We have seen ANCOM's biggest process of frequency allocation, with bandwidths for wireless services granted for the period 2013-2029, including spectrum in the 800MHz, 900MHz, 1,800MHz and 2,600MHz bands. The auction was successfully completed, reporting an increase by 77% in the spectrum available for mobile communications and raising EUR 682.1 million in license taxes. Amongst the five operators that participated in the auction, Vodafone and Orange won most of the public blocks, for which they paid license fees totaling EUR 228.5 million and EUR 227.1 million respectively. The other three players, i.e. Cosmote, RCS&RDS and 2K Telecom, obtained the rest of the frequencies for a total amount of EUR 226.5 million. This confirms once again the mobile operators’ commitment to the Romanian market in introducing the 4G technology. The use of 4G spectrum will allow for the provision of high-speed internet services in areas of low population density where fixed networks would be prohibitively expensive.
Over the past few years, we have witnessed a continuous atmosphere of increased competition between the three major operators Cosmote, Orange and Vodafone, basing their strategies primarily on price wars, which led to a significant number of subscriptions and penetration rates of up to 130%. Between July 2011 and June 2012, Cosmote, Orange and Vodafone reported subscription losses, mainly due to inactive subscription discounting, which reached a level of 1.19 million.
Given the market saturation, the operators have shifted their focus on wireless data. In 2012, Orange and Vodafone announced upgrades to wireless data infrastructure. Vodafone already upgraded mobile internet speeds for its highest tariffs to 43.2/5.76Mbps in Bucharest, Constanta and Mamaia. Furthermore, Vodafone expanded its HSPA+ coverage to 30 cities, with speeds of up to 21.6Mbps. At the same time, in 2011 Orange increased its 3G coverage from 55% to 98%. Although there has been a steady decline in the fixed line market over the past years, some signs of market stabilization have been present, driven by moderate subscription increases in the first half of 2011,
as fixed-voice services are bundled with broadband and TV services.
As for internet users, ANCOM recent data revealed a slowdown in the growth of dedicated mobile broadband subscriptions compared to 2010 and 2011 respectively. The latest report revealed 0.93 million dedicated mobile broadband subscriptions in 2010, rising to only 1.05 million in 2011. This deceleration in growth could reflect a slow-down in the market. Mobile broadband will become an increasingly important rival to fixed broadband services, since mobile operators offer competitive packages, covering large geographical areas, which could be extended to more rural areas of Romania. However, fixed operators can compete on the speeds they can offer, as well as through bundled triple pay services. Despite the lack of data on the number of internet users in Romania, it is estimated that the country had approximately 9.5 million regular users at the end of 2011, as per the report issued by BMI for Q4 2012.
Growth in the overall telecom market is expected to be modest in the near future. Moreover, the telecom market future evolution heavily depends on the economic environment, purchase power of consumers and regulatory changes as well. However, the increased sophistication in smartphone users corroborated with Romanians’ great appetite for latest technology developments and increased trend in social media instruments adoption might trigger increased 3G subscribers. Facebook’s April purchase of mobile photo network Instagram demonstrates just how important new products and expertise are to web giants seeking to exploit the convergence of mobile and the internet. Furthermore, future 4G technology developments to be implemented on the local telecom market are also an important driver for growth.
MCR IT & C
The mobile maze:when communication goes digital
Mirela Calota, Manager, Transaction Advisory Services, Ernst & Young
29,724 29,760 27,782 27,461 27,515 27,582 27,666 27,767
4,580 6,021
7,609 8,302 8,981 9,421 9,895 10,404
0
5,000
10,000
15,000
20,000
25,000
30,000
35,000
2009 2010 2011 2012E 2013F 2014F 2015F 2016F
No of mobile phone subscribers (000) No of 3G phone subscribers (000)
Source: ANCOM
Spectrum auction – total license taxes

97
Major Companies in Romania 2012 EDITION Major Companies in Romania
The Romanian IT market grew steadily in 2011 and the upswing continued at a lower pace in 2012, considering the economic headwinds and fiscal austerity created an atmosphere of caution. The Government is using EU structural funds to draw investors and to encourage the ongoing development in the information technology sector. In 2011 alone, Romania was provided with EUR 252 million in EU funds for IT&C projects. In July 2012, the government made public its intention to support the IT companies, both multinationals and local ones, to create new jobs in the sector through a state aid scheme of EUR 100 million.
Growth should emerge from several areas of opportunity since there is an ongoing transformation of political and economic structures. We expect to encounter such opportunities in nearly all economic sectors, government bodies and state-owned enterprises, along with telecom companies and banks, while the utilities sector is a spending leader. The public sector generates about half of local sales of software, service and equipment in the IT market.
Credit unavailability made the private businesses reluctant to commit to new projects that require large investment of time and money leading to a slowdown of the market. The mix between tighter credit conditions, rising unemployment and deteriorating economic outlook limited the consumers’ demand in the household segment. The decline of the local currency impacted prices which further increased the pressure on consumers.
The projections shows that the Romanian hardware market will worth EUR 618 million in 2012, with almost 5% more as compared to prior year. According to vendors, SMEs account for an estimated of 35% of the Romanian PC market, while corporations account for about 15%. The retail PC segment still holds a promising footprint supplying almost half of the existing demand. With a nationwide figure for computer penetration of less than 25%, retailers could find in this an opportunity for hardware sales. This could be further exploited with better results if the government would spend more on IT education, since 70% of Romanians lack basic computing skills. Similarly with other countries in the region, a government scheme was implemented for granting young people from poor families aid of up to EUR 200 to buy a PC. However, the results are still expected to come, as this scheme did not meet vendors’ expectations.
In pursuit of a robust IT market
Carmen Dobre, Senior Manager, Assurance and Advisory Services, Ernst & Young
The software market is estimated to be flat, at EUR177 million, after a promising year such as 2011. The current demand is driven by applications that incorporate high flexibility of response to customer needs, efficient solutions and process optimization at reduced costs, thus creating a business environment for native solutions. The ERP market is still in its early phase where larger companies and organizations provide most of the demand, mainly due to high prices. Growth of packaged software sales will depend much on the actions taken by the Romanian government for limiting software piracy incidents, as a BMI report reveals that 70% of sales for Windows products are subject to piracy compared to 20% in Germany.
The expansion of e-cash environment, through increased utilization of bank cards by 38% and the growing volume of online purchases by 24%, fuel the demand of Romanian companies for back-office platforms.
The cloud computing system which proved to be an efficient solution in the West-European countries is starting to be appealing for Romanian companies as well. However, for the moment, cloud computing is limited to applications such as mail, phone systems and document management.
Despite the fiscal constraints, one of the main drivers in the software segment consists of e-government and e-public services projects. A mid-term project is represented by e-Romania agenda aimed to decentralize public services, increase efficiency in interactions between citizens and state institutions, simplify access to public services and lower the costs in the system.
The IT services segment is perceived by the Romanian government as an opportunity to develop the domestic economy through general economic reform, consolidation of the public system and privatization.
The negative financial outlook for the last years, combined with an increased level of piracy and low PC penetration, positioned Romania’s IT market as one of the smallest and most immature in the Eastern Europe area. However, in the medium term, on the basis of financial recovery, economic reform, coherent policy for the public sector combined with a good absorption rate of EU funds, Romania is potentially the country that will attract the highest interest for providing informatics services and solutions, as well as investments in technology in all segments.

With the launch of new technologies, the Romanian market is expected to become a better integrated market in terms of communication services. We estimate progressive growth in mobile data services adoption, which will be available on smarter and more affordable devices. Romanian customers will be using faster widespread data communication networks, a wider range of smartphones and tablets and will search for richer content on their mobile, as it happens now on their PCs. The worldwide trend in this industry is to have all telemedia services available on all screens.
BUNDLES ADJUSTED TO CONSUMER NEEDS At Orange we have identified common needs and interests among our customers and grouped them into our segmented offer portfolio. Therefore we tried to fit each segment with the best matching offers, both in terms of services & devices. Starting with tariff plans calibrated to different consumption patterns, going further to service packages dedicated to seniors, youngsters, kids, football supporters up to fully integrated communication solutions for companies, our strategy is to approach our customers with offers that are tailored depending on their specific needs and interests.
We gladly observe that mobile data are showing immense growth potential among both residential and business customers. More and more customers start using mobile data each day, trend supported by smartphones and tablets
evolution. Further on, 4G technology will offer enhanced user experience to enthusiast mobile data customers. Of course mobile voice continues to be the core of our business and we see strong performance in this area as well.
MAKE WAY FOR 4GWe are confident that an important share of our customers will embrace the benefits of the new generation technologies and, on the medium term, as the device portfolio will evolve, 4G service will penetrate the market at an even faster pace than previous generation technologies. Given our customers’ appetite for mobile broadband services, we estimate that a significant share of our customer base will be using 4G services in next 3 to 4 years.
Romanian operators are in the first line of embracing new technologies and introducing new services to their customers. Innovation is highly valued on this market. Our challenge is to make the right decisions and become a friendly digital coach to our customers, introducing not technology, but promoting the benefits that innovation brings to people.
ADDRESSING A VERY COMPETITIVE MARKET The residential market is a very competitive one, it is characterized by very good offers both in prepay and contracts. If the drivers in prepay market are the flexible affordable offers, the drivers in contracts market are the handsets together with good deals for
Growth comes from innovationJEAN-FRANÇOIS FALLACHER,
CEO Orange Romania
tariff plans. In September we launched a new simplified proposition for our contract customers, with better integrated data bundles and matching handsets. Therefore we are now able to propose them better customized offers, both in terms of services and devices.
As for the business market, after the integration of Orange Business Services, we can offer to our clients the benefits of double convergence: IP convergence (fixed voice, data, fixed and mobile), fundamental to increase company productivity and improve their customer relationship and IT-telecom convergence that ensures end-to-end at highest standards of quality and data security for communications and a fine alignment of telecom network strategy to our customers business objectives.
“WITH THE 4G TECHNOLOGY, NEW OPPORTUNITIES WILL OPEN AS WE WILL BE ABLE TO DELIGHT OUR CUSTOMERS WITH A WIDER RANGE OF APPLICATIONS AND ENHANCED CONTENT SERVICES.”
MCR Opinion

TELECOMMUNICATIONSRANK COMPANY NAME MCR SCORING ANNUAL TURNOVER
( 2011 RON)TURNOVER
RANKINGPROFIT/LOSS
(2011 RON)NO OF
EMPLOYEES CONTACT
1 ORANGE ROMANIA SA 3.763 3,981,959,733 1 805,637,899 2,707 Bucuresti, Sector 1
2 VODAFONE ROMANIA SA 3.763 3,399,602,653 2 425,484,737 2,951 Bucuresti, Sector 1
3 RCS & RDS SA 3.550 2,028,873,472 3 (12,542,312) 6,910 Bucuresti, Sector 5
4 COSMOTE ROMANIAN MOBILE TELECOMMUNICA-TIONS SA
3.363 1,944,725,623 4 (30,803,300) 1,234 Bucuresti, Sector 6
5 SOCIETATEA NATIONALA DE RADIOCOMUNICATII SA
2.363 331,603,407 6 (44,152,492) 1,759 Bucuresti, Sector 4
6 DIAL TELECOM SRL 2.300 39,598,241 17 1,833,925 38 Bucuresti, Sector 2
7 UPC ROMANIA SRL 2.263 438,288,517 5 (311,569,415) 1,605 Bucuresti, Sector 1
8 D & D COMPANY SRL 2.000 31,007,479 22 370,931 3 Bucuresti, Sector 3
9 MEDIA SAT SA 1.938 31,177,488 21 844,132 83 Bucuresti, Sector 2
10 COMBRIDGE SRL 1.900 60,636,372 12 6,033,656 30 Bucuresti, Sector 1
11 NET TEAM SRL 1.900 20,689,110 28 1,735,991 27 Bucuresti, Sector 1
12 NOBEL ROMANIA SRL 1.888 23,871,406 25 909,450 221 Bucuresti, Sector 2
13 GMB COMPUTERS SRL 1.888 17,308,331 29 2,250,823 106 Constanta,
CONSTANTA
14SOCIETATEA COMERCIALA PENTRU SERVICII DE TELECOMUNICATII SI TEHNOLOGIA INFORMATIEI IN RETELE ELECTRICE DE TRANSPORT TELETRANS SA
1.838 52,365,849 15 5,022,587 243 Bucuresti, Sector 3
15 DIGITAL CABLE SYSTEMS SA 1.825 105,074,226 7 2,344,996 965 Bucuresti, Sector 2
16 IDILIS SRL 1.800 5,983,718 34 1,029,157 1 Bucuresti, Sector 1
17 RADCOM SRL 1.788 56,283,665 13 4,479,901 159 Bucuresti, Sector 2
18 NET-CONNECT INTERNET SRL 1.750 63,061,705 10 2,409,786 19 Bucuresti, Sector 6
19 BT GLOBAL SERVICES LIMITED LONDRA SUCURSALA BUCURESTI
1.700 24,755,715 23 145,179 - Bucuresti, Sector 4
20 DIRECT ONE SA 1.650 35,735,725 18 2,926,980 37 Bucuresti, Sector 1
21 INES GROUP SRL 1.650 21,444,987 26 2,375,297 48 Bucuresti, Sector 1
22 EQUANT ROMANIA SA 1.600 62,631,883 11 (6,026,161) 41 Bucuresti, Sector 2
23 TELECOMUNICATII CFR SA 1.563 53,337,350 14 (34,677,406) 1,052 Bucuresti, Sector 1
24 MEDIATEL DATA SRL 1.550 6,031,927 33 943,808 22 Bucuresti, Sector 1
25 EAD TELECOM SRL 1.500 24,338,778 24 1,433,192 14 Brasov, BRASOV
26 ACCESSNET INTERNATIONAL SRL 1.500 11,873,893 30 271,449 2 Bucuresti, Sector 1
27 EUROWEB ROMANIA SA 1.488 34,811,585 19 (5,060,780) 83 Bucuresti, Sector 3
28 PRIME TELECOM SRL 1.488 33,511,715 20 572,581 127 Bucuresti, Sector 2
29 MARCTEL - SIT SRL 1.488 10,630,141 31 153,105 86 Bucuresti, Sector 5
30 GTS TELECOM SRL 1.438 87,013,852 8 (6,234,835) 132 Bucuresti, Sector 2
31 NOKIA SIEMENS NETWORKS ROMANIA SRL 1.400 21,012,974 27 (1,018,078) 41 Bucuresti, Sector 1
32 CCC BLUE TELECOM SA* 1.375 7,533,312 32 (166,563) 291 Galati, GALATI
33 VOXLINE COMMUNICATION SRL 1.300 4,165,456 35 15,059 15 Bucuresti, Sector 1
34 INTEX PRIM UNIVERSAL SRL 1.300 145,271 37 (12,954) 5 Targu Jiu, GORJ
35 TELEMOBIL SA 1.288 69,346,671 9 (103,302,159) 80 Bucuresti, Sector 6
36 FOCUS SAT ROMANIA SRL 1.288 48,517,611 16 (22,742,198) 58 Bucuresti, Sector 4
37 NEW COM TELECOMUNICATII SA 1.200 743,414 36 (144,926) 4 Cluj-Napoca, CLUJ
99
Major Companies in Romania 2012 EDITION Major Companies in Romania

COMMUNICATION EQUIPMENTRANK COMPANY NAME MCR SCORING ANNUAL TURNOVER
( 2011 RON)TURNOVER
RANKINGPROFIT/LOSS
(2011 RON)NO OF
EMPLOYEES CONTACT
2 NOKIA ROMANIA SRL 3.963 4,103,613,593 1 -8,770,342 1,866 Cluj-Napoca, CLUJ
3 KATHREIN ROMANIA SRL 2.775 288,759,340 4 20,997,753 860 Timisoara, TIMIS
4 ALCATEL - LUCENT ROMANIA SA 2.763 328,377,251 3 27,522,541 1,486 Timisoara, TIMIS
5 INTRAROM SA 2.725 221,672,458 5 1,440,302 412 Bucuresti, Sector 2
6 GERMANOS TELECOM ROMANIA SA 2.463 390,223,671 2 -47,732,168 1,110 Bucuresti, Sector 1
7 LESSOR SRL 2.200 39,362,828 17 492,896 20Piatra-Neamt,
NEAMT
8 ILEX COM SRL 1.988 34,332,554 21 621,826 161 Craiova, CRAIOVA
9 CELLULAR ONE SRL 1.988 23,796,946 29 823,616 92 Braila, BRAILA
10 ASGO TELECOM SA 1.975 34,790,015 20 3,747,176 253 Bucuresti, Sector 2
11 ROMKATEL SRL 1.938 44,129,048 15 3,051,228 54 Bucuresti, Sector 3
12 COSMOS MOBILE SRL 1.900 42,182,400 16 2,055,244 30 Bucuresti, Sector 1
13 ROHDE & SCHWARZ TOPEX SA 1.900 37,000,562 19 3,540,867 0 Bucuresti, Sector 1
14 VERTA TEL SRL 1.875 58,643,236 12 1,279,656 316 Bucuresti, Sector 4
15 DELTATEL SRL 1.875 50,465,270 14 19,418 424 Timisoara, TIMIS
16 ECCO GROUP DEVELOPMENT SRL 1.850 57,300,871 13 571,490 15 Bucuresti, Sector 2
17 ARSIS TRADING SRL 1.775 128,503,620 6 465,865 541 Bucuresti, Sector 6
18 BRITCOM DIRECT SRL 1.738 22,594,615 30 12,437 154 Bucuresti, Sector 3
19 TELELINK SERVICES ROMANIA SRL 1.738 20,861,082 33 1,528,850 65 Bucuresti, Sector 1
20 CENTRUL PENTRU SERVICII DE RADIOCOMUNICATII SRL
1.688 62,514,001 11 3,921,486 88 Bucuresti, Sector 1
21 FELIX TELECOM SRL 1.688 22,152,269 32 1,178,390 73 Bucuresti, Sector 2
22 MONDO PLAST SRL 1.638 34,018,945 22 358,186 70Bocsa,
CARAS-SEVERIN
23 ROBEST COM SRL 1.638 25,838,978 27 261,140 136 Carcea, DOLJ
24 GDS MANUFACTURING SERVICES SA 1.625 98,785,167 7 153,090 421 Arad, ARAD
25 AVENIR TELECOM SA 1.575 66,858,341 10 -6,059,941 339 Bucuresti, Sector 1
26 MOBILIS SRL 1.550 27,793,955 26 41,553 28 Iasi, IASI
27 UNIVERSAL CARD SYSTEMS SA 1.550 22,157,006 31 82,855 49 Bucuresti, Sector 6
28 ADVANCED TECHNOLOGIES SRL 1.500 30,818,264 25 198,526 17Bucuresti,
BUCURESTI
29 CISCO SYSTEMS ROMANIA SRL 1.500 24,739,429 28 1,851,759 47 Bucuresti, Sector 1
30 STAR PRINT TRADE CO SRL 1.488 31,232,144 24 -2,950,944 76 Bucuresti, Sector 1
31 DATANET SYSTEMS SRL 1.450 72,833,869 9 5,613,065 37 Bucuresti, Sector 5
32 FRONTAL COMMUNICATION SRL 1.350 33,051,464 23 422,475 11 Otopeni, ILFOV
33 ACCORD 93 SRL 1.300 82,730,592 8 -1,316,250 15 Bucuresti, Sector 1
34 MCS COMMUNICATIONS SRL 1.288 39,301,000 18 -5,177,600 228 Bucuresti, Sector 1
MCR IT & C

COMPUTER PROGRAMMING, CONSULTANCY AND RELATED ACTIVITIESRANK COMPANY NAME MCR SCORING ANNUAL TURNOVER
( 2011 RON)TURNOVER
RANKINGPROFIT/LOSS
(2011 RON)NO OF
EMPLOYEES CONTACT
1 ORACLE ROMANIA SRL 2.963 427,871,180 1 25,598,720 1,715 Bucuresti, Sector 1
2 SIVECO ROMANIA SA 2.875 204,985,381 5 14,971,311 964 Bucuresti, Sector 1
3 IBM ROMANIA SRL 2.825 311,815,348 2 55,891,208 806 Bucuresti, Sector 1
4 ROMSYS SRL 2.588 268,795,207 4 8,960,904 198 Bucuresti, Sector 1
5 UTI SYSTEMS SA 2.288 183,454,683 6 11,459,212 150 Bucuresti, Sector 4
6 ENDAVA ROMANIA SRL 2.275 38,609,068 36 315,447 314 Cluj-Napoca, CLUJ
7 IQUEST TECHNOLOGIES SRL 2.225 50,922,905 29 11,058,848 265 Cluj-Napoca, CLUJ
8 MICROSOFT ROMANIA SRL 2.188 134,792,343 10 12,669,362 243 Bucuresti, Sector 1
9 TEAMNET INTERNATIONAL SA 2.175 148,630,435 8 10,084,136 285 Bucuresti, Sector 6
10 BITDEFENDER SRL 2.175 135,614,898 9 4,583,174 370 Bucuresti, Sector 6
11 XOR-IT SYSTEMS SRL 2.088 58,521,015 25 567,578 105 Bucuresti, Sector 6
12 NET BRINEL SA 2.088 55,816,806 26 6,383,473 69 Cluj-Napoca, CLUJ
13 FREESCALE SEMICONDUCTOR ROMANIA SRL 2.088 43,858,334 30 1,928,994 231 Bucuresti, Sector 5
14 CRESCENDO INTERNATIONAL SRL 2.038 69,248,903 17 6,148,482 95 Bucuresti, Sector 2
15 IXIA SRL 2.025 53,643,070 27 1,389,801 259 Bucuresti, Sector 1
16 PENTALOG ROMANIA SRL 2.025 40,180,630 34 2,228,202 256 Bucuresti, Sector 1
17 STAR SOFT INTERNATIONAL SRL 2.000 283,473,881 3 350,055 1 Bucuresti, Sector 3
18 SYSCO SRL 2.000 79,284,182 15 5,471,539 11 Bucuresti, Sector 3
19 SOFTWIN SRL 1.975 66,221,297 19 14,856,742 356 Bucuresti, Sector 2
20 METRO SYSTEMS ROMANIA SRL 1.975 65,963,292 21 2,909,047 392 Voluntari, ILFOV
21 STAR STORAGE SRL 1.975 63,675,725 23 1,642,384 427 Bucuresti, Sector 2
22 GAMELOFT ROMANIA SRL 1.975 43,687,869 31 432,757 498 Bucuresti, Sector 1
23 MISYS INTERNATIONAL FINANCIAL SYSTEMS SRL
1.925 43,527,452 32 8,463,166 270 Bucuresti, Sector 6
24 BULL ROMANIA SRL 1.850 39,051,239 35 36,045 38 Bucuresti, Sector 2
25 SAP ROMANIA SRL 1.838 66,803,240 18 7,509,193 91 Bucuresti, Sector 1
26 EON IT ROMANIA SRL 1.838 66,138,521 20 2,440,088 81 Iasi, IASI
27 AXWAY ROMANIA SRL 1.788 36,918,956 38 5,690,917 198 Bucuresti, Sector 4
28 UBISOFT SRL 1.775 85,915,604 14 3,390,434 807 Bucuresti, Sector 1
29 S & T ROMANIA SRL 1.738 181,107,458 7 163,762 177 Bucuresti, Sector 1
30 TOTAL NETWORK SOLUTION SRL 1.700 62,422,144 24 129,384 21 Bucuresti, Sector 5
31 NOVENSYS CORPORATION SRL 1.688 119,893,975 11 955,675 206 Bucuresti, Sector 3
32 TSE DEVELOPMENT ROMANIA SRL 1.688 37,293,061 37 3,302,863 140 Cluj-Napoca, CLUJ
33 LUXOFT PROFESSIONAL ROMANIA SRL 1.625 78,571,721 16 20,998,421 590 Bucuresti, Sector 1
34 ASESOFT INTERNATIONAL SA 1.588 110,275,389 12 4,556,414 99 Ploiesti, PRAHOVA
35 ROMSOFT SRL 1.550 65,344,490 22 136,800 43Ramnicu Valcea,
VALCEA
36 TOTAL SOFT SA 1.525 91,782,302 13 215 388 Voluntari, ILFOV
37 BRODOS ROMANIA SRL 1.450 53,257,477 28 1,116,927 6 Bucuresti, Sector 1
38 PROVISION SOFTWARE DIVISION SRL 1.450 42,541,300 33 66,945 47 Voluntari, ILFOV
101
Major Companies in Romania 2012 EDITION Major Companies in Romania

MANUFACTURE AND SALE OF COMPUTERS AND PERIPHERAL EQUIPMENTSRANK COMPANY NAME MCR SCORING ANNUAL TURNOVER
( 2011 RON)TURNOVER
RANKINGPROFIT/LOSS
(2011 RON)NO OF
EMPLOYEES CONTACT
1 CELESTICA ( ROMANIA ) SRL 3.813 2,357,993,685 1 12,519,199 1163 Bors, BIHOR
2 ASESOFT DISTRIBUTION SRL 2.838 853,231,813 2 2,942,581 146 Bucuresti, Sector 2
3 DANTE INTERNATIONAL SA 2.625 621,423,342 3 5,104,301 338 Voluntari, ILFOV
4 HEWLETT - PACKARD ROMANIA SRL 2.625 294,515,580 6 37,722,915 411 Bucuresti, Sector 2
5 RHS COMPANY SA 2.588 342,704,922 4 2,356,299 164 Bucuresti, Sector 2
6 BENCHMARK ELECTRONICS ROMANIA SRL 2.475 218,503,106 8 1,905,010 584 Ghimbav, BRASOV
7 SCOP COMPUTERS SRL 2.388 326,259,145 5 3,581,992 130 Bucuresti, Sector 2
8 MB TELECOM-LTD SRL 2.238 49,052,492 33 21,636,786 81 Otopeni, ILFOV
9 SYSTEM PLUS SRL 2.238 48,790,972 34 2,253,375 52 Bucuresti, Sector 1
10 ETA-2U SRL 2.188 79,959,463 22 4,084,704 203 Timisoara, TIMIS
11 TONERFILL ROMANIA SRL 2.175 87,063,922 21 5,471,908 579 Oltenita, CALARASI
12 OMNILOGIC SRL 2.138 234,353,121 7 890,876 100 Otopeni, ILFOV
13 KONICA MINOLTA BUSINESS SOLUTIONS ROMANIA SRL
2.138 79,471,027 23 643,082 173 Bucuresti, Sector 1
14 PRODUCTON SRL 2.088 63,832,912 27 1,885,448 96 Bucuresti, Sector 5
15 LASTING SYSTEM SRL 2.088 57,119,914 31 3,314,407 76 Timisoara, TIMIS
16 ROYAL COMPUTERS SRL 2.050 44,984,019 35 1,106,229 46 Bucuresti, Sector 6
17 PRINTEC GROUP ROMANIA SRL 2.038 59,270,931 30 7,195,580 142 Bucuresti, Sector 1
18 AGIS COMPUTER SRL 2.000 159,466,270 10 6,117,580 39 Cluj-Napoca, CLUJ
19 DIM SOFT SRL 2.000 111,742,052 13 9,137,361 18 Bucuresti, Sector 1
20 ASBIS ROMANIA SRL 2.000 101,739,302 17 548,857 47 Bucuresti, Sector 6
21 NEODIGITAL SRL 2.000 89,759,296 20 1,017,040 33 Cluj-Napoca, CLUJ
22 MB DISTRIBUTION SRL 1.988 128,961,876 11 5,053,677 66 Bucuresti, Sector 2
23 XEROX ROMANIA ECHIPAMENTE SI SERVICII SA 1.988 109,405,352 14 13,812,866 77 Bucuresti, Sector 1
24 FIT DISTRIBUTION SRL 1.950 103,960,730 16 387,099 42 Bucuresti, Sector 3
25 GEMINI SP SRL 1.900 69,809,424 25 1,525,472 3 Bucuresti, Sector 1
26 MITCRIS SRL 1.850 96,993,234 19 287,222 32 Oradea, BIHOR
27 GRUPUL INDUSTRIAL GIR SA 1.850 30,903,758 36 6,586,119 13 Bucuresti, Sector 5
28 RTC PROFFICE EXPERIENCE SA 1.788 103,983,289 15 -6,857,470 148 Bucuresti, Sector 6
29 ELKOTECH ROMANIA SA 1.750 98,144,075 18 142,076 33 Bucuresti, Sector 1
30 QNET INTERNATIONAL SRL 1.738 60,156,096 28 4,227,745 105 Bucuresti, Sector 2
31 SKIN MEDIA SRL 1.688 116,742,538 12 3,588,319 77 Bucuresti, Sector 1
32 TREND IMPORT EXPORT SRL 1.600 59,716,248 29 372,200 34 Bucuresti, Sector 6
33 DESPEC ROMANIA SRL 1.588 167,253,178 9 1,512,980 77 Bucuresti, Sector 6
34 ATLAS CORPORATION SRL 1.538 71,462,388 24 -8,189,248 200 Bucuresti, Sector 2
35 GAPI SRL 1.400 49,529,779 32 -126,949 2 Timisoara, TIMIS
36 GMN DISTRIBUTIE SRL 1.300 67,248,842 26 -2,910,350 36 Bucuresti, Sector 1
MCR IT & C


Industrial Engineering
1052012 EDITION Major Companies in Romania
2.8billion RON is the aggregate turnover registered in 2011 by top ten companies in the sector

The cumulative turnover of the top ten companies comprised in 2011’s industrial engineering top exceeds 2.8 billion RON. Compared to previous year’s cumulative turnover of the companies comprised in the top at that time, the amount is smaller by approximate EUR 300 million. The most common explanation is that on the overall global markets, the industrial production and demand of projects decreased in the last few years, including the design and engineering services.
Thus, this year started with several investments developed by the companies comprised in the industry ranking and some of them, targeted projects in energy, either it was about green or archetypal, as oil.
A GOLDEN SAFARIOne of the companies operating on the volatile market of industrial engineering and that marked an exotic deal at the end of last year is Prospectiuni, owned by businessman Ovidiu Tender.
If the company recorded a drop of sales of 27 percent in 2010, the recovery came soon in 2011, and Prospectiuni exceeded 315 million RON at the end of the last year. The company climbed the top of industrial engineering up to the fourth ranking in 2012. Tender’s company felt the gold-rush at the end of 2011 and announced it received the exploiting and exploration permits for gold, heavy and rare metals in Senegal to prospect seven areas with mineral resources and also expended through other contracts in countries as Guinea Bisau and Capo Verde.
THE STEEL BAROMETERThe worldwide price of steel is said to be the best barometer in order to indicate the real state of the global economy. As players in the industry state, the price of steel reached a very low level, it touched a new low record, since the debut of crisis. This only stresses again that the overall consumption rates position at a still low level.
For instance, a balanced price for steel would mean a level of 700 to 800 USD per tonne. For a blunt comparison, few years ago, before it all started in 2008, the steel price reached a level 1,000 USD per tonne.
Now, a tonne of steel is valued at less than 400 USD, at 344 USD. According to the manager, the next year is not expected to bring many surprises in this respect. Still, the company signed several significant deals in the last year, marking recently an important transaction worth EUR 2 million by
purchasing a Swiss company specializing in engineering services, MTAG Marti Technologie AG.
Also, Adrem Invest, through its process engineering division – the first division of the Romanian company, established in 1992, it signed this year a contract for the largest facility for degassing of liquid steel in the world and the project is being done for a Chinese company, with deadline in September 2013.
PROJECTS AND INDUSTRIAL WORKINGSAnother major company placing on the second ranking in the top of industrial engineering, following the turnover achieved in 2011 is Renault Technologie Roumanie, with a turnover of near 535 million RON.
In June this year, Renault Technologie Roumanie (RTR) announced the delivery of its newest project, the construction of the pre-treatment plant wastewater at Titu Technical Center. Built on a plot of approximately 2500 sqm, the plant treats water before being sent to the city's wastewater treatment plant.
RTR has invested about EUR 350,000 in this project, from an overall engagement worth EUR 2 million spent between 2008–2012 for water resources preservation in Titu Technical Center area.
Romelectro, ranking third in current industrial engineering top with a turnover of more than 351 million RON, recently announced that the company started to implement the rehabilitation project at station in Galati county, delivering 220/110 kV. The project developed by a joint-venture of Romelectro and Carpathian Electromontaj Sibiu is to modernize the station by complete refurbishment in order to eliminate the risk of events in the area and minimizing annual maintenance and operating costs.
The contract was signed on in October this year, with deadline and it is due for 2014. Transelectrica is financing the project, from its own funds.
Operating industrial engineering services through its division Martifer Energia Ro, Martifer group and Martifer Solar Romania announced in September this year the completion of the company’s first photovoltaic project, a power production park developed in Vrancea area and established following a partnership with Eurowind Energy A/S. According to the company, the photovoltaic park stands on 4 hectares and has an installed capacity of 1.5 MW.
MCR INDUSTRIAL ENGINEERING
Projects rushMagda Purice, Journalist

INDUSTRIAL ENGINEERINGRANK COMPANY NAME MCR SCORING ANNUAL TURNOVER
( 2011 RON)TURNOVER
RANKINGPROFIT/LOSS
(2011 RON)NO OF
EMPLOYEES CONTACT
1 RENAULT TECHNOLOGIE ROUMANIE SRL 2.813 534,872,284 3 18,550,524 1,988 Voluntari, ILFOV
2 GENERAL ELECTRIC INTERNATIONAL INC - WILMINGTON SUCURSALA ROMANIA
2.688 694,710,373 1 11,638,925 98 Bucuresti, Sector 1
3 TMUCB 2.663 284,624,365 5 5,230,113 1,599 Bucuresti, Sector 1
4 IMSAT 2.563 261,414,217 6 11,012,418 1,203 Bucuresti, Sector 6
5 ROMELECTRO SA 2.538 351,350,620 4 46,541,408 96 Bucuresti, Sector 2
6 ROMINSERV 2.513 691,443,065 2 1,869,784 1,061 Bucuresti, Sector 1
7 ADREM INVEST SRL 2.275 125,010,954 8 12,693,704 670 Bucuresti, Sector 1
8 METROUL SA 2.138 57,166,844 17 20,891,805 240 Bucuresti, Sector 5
9 TRACTEBEL ENGINEERING SA 2.138 47,595,850 20 5,667,039 216 Bucuresti, Sector 1
10 CORNEL & CORNEL TOPOEXIM SRL 2.088 39,372,875 25 3,391,197 72 Bucuresti, Sector 6
11 JCR - CHRISTOF CONSULTING SRL 2.025 69,832,192 16 1,563,937 288Brazii de Sus,
PRAHOVA
12 IPIP SA 2.025 44,151,201 22 5,233,763 302 Ploiesti, PRAHOVA
13 INSTITUTUL DE STUDII SI PROIECTARI ENER-GETICE SA
1.975 72,519,913 15 1,510,670 691 Bucuresti, Sector 2
14 IPTANA SA 1.975 35,146,503 28 1,073,731 431 Bucuresti, Sector 1
15 TIAB 1.875 157,727,641 7 1,287,615 695 Bucuresti, Sector 1
16 PROIMSAT * 1.875 81,944,471 12 171,762 423Ramnicu Valcea,
VALCEA
17 HALCROW ROMANIA SRL 1.838 39,344,892 26 320,146 99 Bucuresti, Sector 5
18 UTI TRAFFIC MANAGEMENT SA 1.838 35,411,495 27 626,887 75 Bucuresti, Sector 2
19 INDUSTRIAL ENGINEERING AND CONTRACTING RO SRL
1.800 74,192,155 14 1,208,962 7 Bucuresti, Sector 1
20 KREMSMUELLER ROMANIA SRL 1.775 75,802,752 13 -132,985 272 Ploiesti, PRAHOVA
21 INSTITUTUL DE STUDII SI PROIECTARI HIDROENERGETICE - ISPH SA
1.725 53,142,944 19 6,276,404 343 Bucuresti, Sector 2
22 ROMENERGO SA 1.688 93,351,740 10 5,005,593 131 Bucuresti, Sector 1
23 ISAF-SOCIETATE DE SEMNALIZARI SI AUTOMA-TIZARI FEROVIARE SA
1.675 31,240,849 29 -270,248 335 Bucuresti, Sector 6
24 KH PROCESS ENGINEERING SRL 1.650 103,755,839 9 5,863,344 0 Bucuresti, Sector 6
25 MAX STREICHER ROMANIA SRL 1.650 41,327,119 24 6,476,131 33 Ploiesti, PRAHOVA
26 KRAFTANLAGEN ROMANIA SRL 1.588 43,226,140 23 409,265 148 Ploiesti, PRAHOVA
27 COMAU ROMANIA SRL 1.575 83,670,615 11 -758,474 268 Oradea, BIHOR
28 MARTIFER ENERGIA RO SRL 1.400 55,261,678 18 -9,093,519 6Bucuresti,
BUCURESTI
29 SNAMPROGETTI ROMANIA SRL 1.338 45,235,588 21 -2,865,117 234 Bucuresti, Sector 2
1072012 EDITION Major Companies in Romania


Constructions CONSTRUCTION OF RESIDENTIAL & INDUSTRIAL BUILDINGS BUILDING MATERIALS CONSTRUCTION OF ROADS, RAILWAYS, BRIDGES AND TUNNELS CONSTRUCTION OF UTILITY PROJECTS FOR FLUIDS AND RELATED SERVICES HYDRO-TECHNICAL CONSTRUCTIONS MANUFACTURE OF EQUIPMENT FOR CONSTRUCTION INDUSTRY CONSTRUCTION OF ELECTRIC SITES ELECTRICAL, PLUMBING AND OTHER CONSTRUCTION INSTALLATION ACTIVITIES
1092012 EDITION Major Companies in Romania
2.8%is the yearly increase of construction works volume in 2011, after two years of double-digit plunge. It still remains by 3.9 percent below the 2007 level

The performance of the building industry returned in the positive area in 2011, after two years of double-digit plunge. The construction works volume increased by 2.8% y/y last year, but remained however by 3.9% below the 2007 level, official statistics show. Nonetheless, the advance last year, partially explained by low-base comparison, is moderate and indicates a certain stabilisation of the market rather than resumption of steady, sustainable growth.
The still sluggish demand in 2011 came mostly from the non-residential segment and civil engineering works, as residential constructions remained overall frozen. The shopping centre supply added to the market in 2011 was similar to peak years 2007 and 2009, and considering the announced projects for 2012 it is likely that the non-residential segment will continue to drive the overall construction market upwards this year as well.
ROMANIA’S CONSTRUCTION SECTOR RECOVERS AT FASTER PACE THAN EU AVERAGEThe performance of the construction sector followed the same upward pattern as in the EU27 countries, yet Romania’s
construction output seems to have been recovering at a faster pace than the European average and is outstandingly above the other countries in the region, where the building sector recorded double-digit plunge last year. BUILDING MATERIALS SEGMENT STABILISES IN 2011The building materials output last year was above the 2009-2010 level, thus paralleling the improving performance of the construction sector. The increase in production of construction materials in 2011 was propped by the 5% y/y advance of the cement market, while the brick segment continued on downward path for the third year in a row. The decline of the brick market is expected to ease this year, but prospects are not very optimistic, as residential building constructions show no clear signs of recovery. The number of permits issued for residential buildings dropped by 6.6% y/y in 2011 and further by 3.8% y/y in H1 2012, according to statistical data. The stabilisation of the building materials market in 2011 reflected in improving revenues of local producers, but the profitability of the sector continued to be hampered by hiking energy and raw materials prices. The construction materials retailers also felt the overall market stabilisation. The DIY chains resumed expansion in H1 this year, after having consolidated market positions and redefining strategies in 2011.
INFRASTRUCTURE REMAINS THE SEGMENT WITH THE HIGHEST GROWTH POTENTIALThe infrastructure segment and road construction in particular remains the segment with the highest growth potential, given the current poor state of the road infrastructure. According to official statistics, nearly 42% of
MCR CONSTRUCTIONS
Building industry’sperformance returns on upward path, after two years of double-digit decline
Diana Macovei, Freelance Analyst
S C S S G G S
0
50
100
150
200
250
Jan Feb Mar Apr May Jun Jul Aug Sep Oct Nov Dec
2007 2008 2009 2010 2011 2012
-40.0%
-30.0%
-20.0%
-10.0%
0.0%
10.0%
20.0%
30.0%
40.0%
50.0%
2008 2009 2010 2011 2012f 2013f 2014f
Total Buildings Residential Non-residential Civil engineering
Construction works index by type of construction (%, y/y)
Construction output in 2011
Source: EUROSTAT
Q1 Q2 Q3 Q4 FY
EU27 0.8% -2.0% 1.8% 2.2% 0.7%
Romania -4.9% -4.1% 8.0% 8.3% 1.8%
Bulgaria -15.9% -13.4% -11.4% -10.3% -12.8%
Slovenia -25.3% -31.1% -25.5% -19.4% -25.3%
Manufacturing of other non-metallic mineral products - Monthly output indices 2005=100, unadjusted series
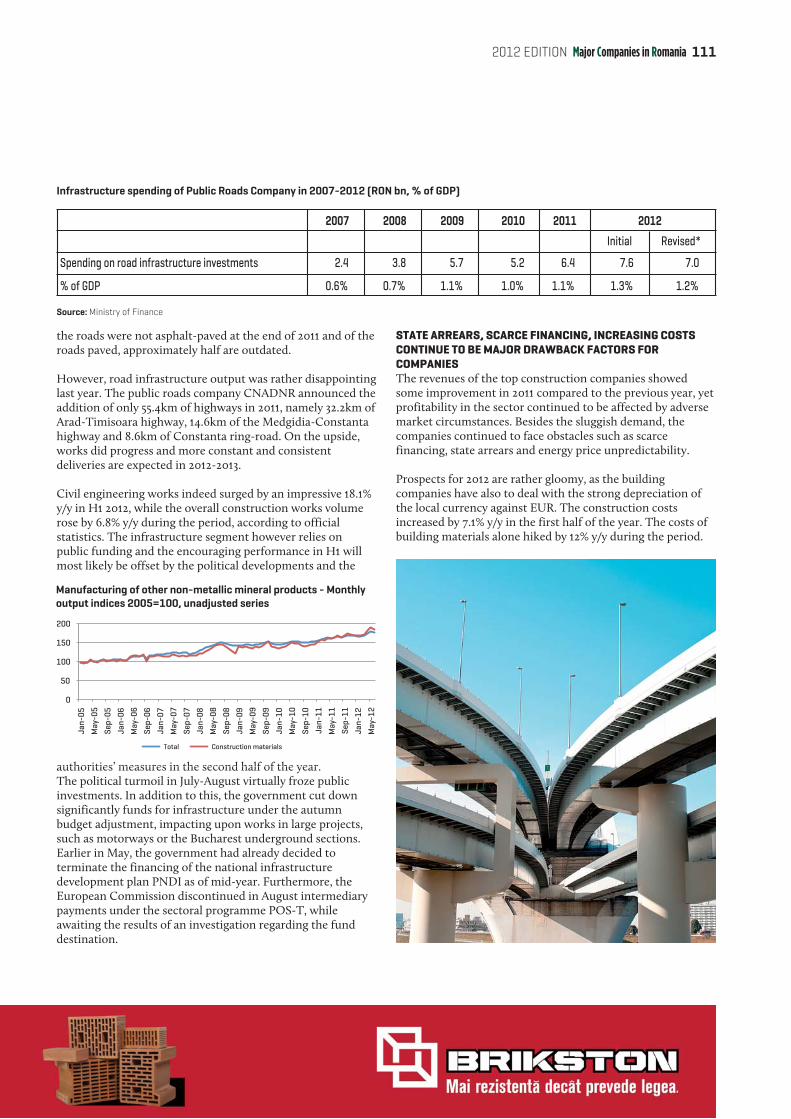
the roads were not asphalt-paved at the end of 2011 and of the roads paved, approximately half are outdated.
However, road infrastructure output was rather disappointing last year. The public roads company CNADNR announced the addition of only 55.4km of highways in 2011, namely 32.2km of Arad-Timisoara highway, 14.6km of the Medgidia-Constanta highway and 8.6km of Constanta ring-road. On the upside, works did progress and more constant and consistent deliveries are expected in 2012-2013.
Civil engineering works indeed surged by an impressive 18.1% y/y in H1 2012, while the overall construction works volume rose by 6.8% y/y during the period, according to official statistics. The infrastructure segment however relies on public funding and the encouraging performance in H1 will most likely be offset by the political developments and the
authorities’ measures in the second half of the year. The political turmoil in July-August virtually froze public investments. In addition to this, the government cut down significantly funds for infrastructure under the autumn budget adjustment, impacting upon works in large projects, such as motorways or the Bucharest underground sections. Earlier in May, the government had already decided to terminate the financing of the national infrastructure development plan PNDI as of mid-year. Furthermore, the European Commission discontinued in August intermediary payments under the sectoral programme POS-T, while awaiting the results of an investigation regarding the fund destination.
STATE ARREARS, SCARCE FINANCING, INCREASING COSTS CONTINUE TO BE MAJOR DRAWBACK FACTORS FOR COMPANIESThe revenues of the top construction companies showed some improvement in 2011 compared to the previous year, yet profitability in the sector continued to be affected by adverse market circumstances. Besides the sluggish demand, the companies continued to face obstacles such as scarce financing, state arrears and energy price unpredictability.
Prospects for 2012 are rather gloomy, as the building companies have also to deal with the strong depreciation of the local currency against EUR. The construction costs increased by 7.1% y/y in the first half of the year. The costs of building materials alone hiked by 12% y/y during the period.
2007 2008 2009 2010 2011
Initial Revised*
Spending on road infrastructure investments 2.4 3.8 5.7 5.2 6.4 7.6 7.0
% of GDP 0.6% 0.7% 1.1% 1.0% 1.1% 1.3% 1.2%
2012
Infrastructure spending of Public Roads Company in 2007-2012 (RON bn, % of GDP)
Source: Ministry of Finance
1112012 EDITION Major Companies in Romania
authorities’ measures in the second half of the year
0
50
100
150
200
Jan-
05
May
-05
Sep-
05
Jan-
06
May
-06
Sep-
06
Jan-
07
May
-07
Sep-
07
Jan-
08
May
-08
Sep-
08
Jan-
09
May
-09
Sep-
09
Jan-
10
May
-10
Sep-
10
Jan-
11
May
-11
Sep-
11
Jan-
12
May
-12
Total Construction materials
Manufacturing of other non-metallic mineral products - Monthly output indices 2005=100, unadjusted series

The construction market, including the cement market, had a good start in 2012, continuing the positive trend that raise the level of the consumption of building material products in 2011. But, in the middle of the year the evolution of the economy changed dramatically and we can only guess when it will return to healthy growth.
The infrastructure projects were the main drivers of the demand in the first half of 2012, but there were also some important non-residential projects under development, like commercial centers, office buildings and industrial spaces that stimulated the cement consumption.
Unfortunately, the development in the economies of the Euro zone and the changes in the budgetary priorities of the new government, made us to change our estimations for the evolution of the cement market in 2012.
If at the beginning of the year we estimated a slight increase of the market, by 2-3 percent, now we will be glad if we finish at the same level as the last year.
One of the biggest challenges now is the delay of payments made by the Government to the construction companies, which has an impact on the whole chain of the construction projects, including construction material producers and suppliers.
MONEY PLAYS HARD TO GET Another challenge is that the investments in the private sector are decreasing,
where the actual development is very weak, and the future doesn’t look any brighter, because the level of building permits is continously decreasing month by month in comparison to last year.
In addition, the level of absorbtion of EU fund is still at a low level and this should be a focal point for the Government in order to boost the infrastructure segment, which can provide significant growth to the GDP and has the potential to attract external financing.
It’s too early to make predictions for 2013, but the next year can be more difficult than this year, because of the crisis situation that continues in Euro zone and the difficult market conditions in the construction sector, which is affected by the diminished level of private and public investments.
SEIZING LOCAL POTENTIAL Despite the actual economic development, Romania has a very important position for Holcim Group in the South-East European region, due to the size of the market and our significant presence in the market, as well as because of our more than 700 million EUR investments made in the last 15 years in Romania.
We believe in the potential of the local market and in the competitive advantages that Romania has for attracting foreign investments.
Our strategy on the Romanian market involves being close to our clients and to
MCR Opinion
How to predict the unpredictibleDANIEL BACH,
CEO Holcim Romania
improve our performance and efficiency in the operational sector.
Despite the economic context within the last years, Holcim Romania has intensified its communication activity regarding the solutions it provides to the specialists and end users in the market.
In Romania, especially in the crisis period, the ratio of individuals that are building their own houses vs. developers has increased. Many of them decide nowadays not to contract a construction firm and to make the project on their own.
“IN ROMANIA, ESPECIALLY IN THE CRISIS PERIOD, THE RATIO OF INDIVIDUALS THAT ARE BUILDING THEIR OWN HOUSES VS. DEVELOPERS HAS INCREASED.”

CONSTRUCTION OF RESIDENTIAL & INDUSTRIAL BUILDINGSRANK COMPANY NAME MCR SCORING ANNUAL TURNOVER
( 2011 RON)TURNOVER
RANKINGPROFIT/LOSS
(2011 RON)NO OF
EMPLOYEES CONTACT
1 AEDIFICIA CARPATI SA 2.875 310,916,205 5 24,486,956 729 Bucuresti, Sector 5
2 VEGA 93 SRL 2.763 361,214,554 2 28,790,208 2,087 Galati, GALATI
3 STRABAG SRL 2.625 585,828,064 1 6,436,998 448 Bucuresti, Sector 5
4 BUILD CORP SRL 2.625 268,733,063 7 4,382,430 420 Iasi, IASI
5 BOG ART SRL 2.475 325,273,623 4 2,931,631 425 Bucuresti, Sector 1
6 APOLODOR COM IMPEX SRL 2.425 208,057,401 11 1,874,569 410 Bucuresti, Sector 3
7 ACI CLUJ SA 2.425 188,662,832 12 8,940,963 496 Cluj-Napoca, CLUJ
8 PORR CONSTRUCT SRL 2.375 233,349,059 8 -46,295,500 258 Bucuresti, Sector 2
9 CONSTRUCTII ERBASU SA 2.375 185,161,688 14 29,022,404 319 Bucuresti, Sector 1
10 ASTALDI SPA ITALIA SUCURSALA ROMANIA BUCURESTI
2.275 330,052,870 3 -739,268 399 Bucuresti, Sector 1
11 CON-A SRL 2.275 232,894,875 9 7,387,054 494 Selimbar, SIBIU
12 STRABAG AG AUSTRIA SUCURSALA BUCURESTI ROMANIA
2.200 272,871,504 6 -8,191,969 0 Bucuresti, Sector 5
13 ACOMIN SA 2.175 188,461,462 13 3,922,883 300 Cluj-Napoca, CLUJ
14 NM CONSTRUCT SRL 2.125 160,868,791 17 8,980,234 419 Timisoara, TIMIS
15 ALPINE SA 2.075 209,637,384 10 -36,619,194 361 Mogosoaia, ILFOV
16 SELINA SRL 2.025 149,637,017 18 20,938,636 551 Oradea, BIHOR
17 HOCHTIEF SOLUTIONS AG ESSEN - SUCURSALA BUCURESTI
1.988 125,791,277 20 23,914,599 78 Bucuresti, Sector 5
18 PAB ROMANIA SRL 1.888 134,186,373 19 10,516,664 165 Arad, ARAD
19 NESS PROIECT EUROPE SRL 1.800 165,842,372 16 6,814,575 6 Ploiesti, PRAHOVA
20 TEHNODOMUS SA 1.788 175,549,055 15 11,132,417 207 Arad, ARAD
BUILDING MATERIALSRANK COMPANY NAME MCR SCORING ANNUAL TURNOVER
( 2011 RON)TURNOVER
RANKINGPROFIT/LOSS
(2011 RON)NO OF
EMPLOYEES CONTACT
1 LAFARGE CIMENT (ROMANIA) SA 3.225 764,608,960 3 180,109,955 502 Bucuresti, Sector 1
2 CARPATCEMENT HOLDING SA 3.125 812,746,577 2 142,116,730 814 Bucuresti, Sector 1
3 HOLCIM (ROMANIA) SA 3.025 943,855,284 1 74,029,255 948 Bucuresti, Sector 1
4 KROMBERG & SCHUBERT ROMANIA ME SRL 2.813 224,843,874 7 4,571,667 1,824 Medias, SIBIU
5 HENKEL ROMANIA SRL 2.625 542,369,628 4 30,414,936 459 Bucuresti, Sector 2
6 MITLIV EXIM SRL 2.488 232,545,816 6 4,625,422 177 Craiova, DOLJ
7 DAMILA SRL 2.438 261,972,839 5 1,296,950 243Ramnicu-Valcea,
VALCEA
8 DURAZIV SRL 2.088 76,083,558 19 1,160,554 127Popesti Leordeni,
ILFOV
9 LAFARGE AGREGATE BETOANE SA 2.025 135,903,340 10 -21,431,595 365 Bucuresti, Sector 1
10 MIKE ALEX SRL 1.950 80,021,012 18 2,940,880 45Darmanesti,
SUCEAVA
11 FIVE-HOLDING SA 1.938 75,144,050 20 1,148,070 182Constanta,
CONSTANTA
12 GEALAN ROMANIA SRL 1.888 119,382,431 12 -1,996,115 112 Bucuresti, Sector 6
13 MENATWORK EST PREFABRICATE SRL 1.838 153,344,954 8 756,441 160Popesti-Leordeni,
ILFOV
14 ADEPLAST SA 1.788 142,478,126 9 6,435,768 155 Oradea, BIHOR
15 RUSTRANS SRL 1.788 121,295,115 11 2,422,320 234 Margineni, BACAU
16 METALE INTERNATIONAL SRL 1.738 109,448,331 13 9,742,677 120 Focsani, VRANCEA
17 INTERTRANSCOM IMPEX SRL 1.738 102,338,901 14 422,969 88 Buhusi, BACAU
18 LAFARGE ARCOM GIPS SA 1.688 95,884,958 15 -3,092,601 189 Bucuresti, Sector 4
19 ECO VEGA CONSTRUCT SRL 1.650 93,518,132 17 455,791 31 Bucuresti, Sector 4
20 GENERAL BETON ROMANIA SRL 1.638 95,633,548 16 558,236 139 Timisoara, TIMIS
1132012 EDITION Major Companies in Romania

CONSTRUCTION OF ROADS, RAILWAYS, BRIDGES AND TUNNELSRANK COMPANY NAME MCR
SCORING ANNUAL TURNOVER
( 2011 RON) TURNOVER
RANKING PROFIT/LOSS
(2011 RON) NO OF
EMPLOYEES CONTACT
1 SPEDITION UMB SRL 2.950 791,456,834 1 161,456,607 33 Bacau, BACAU
2 TEHNOSTRADE SRL 2.913 572,444,536 3 124,714,073 1,293 Bacau, BACAU
3 STRACO GRUP SRL 2.863 372,590,194 7 4,240,589 1,029 Bucuresti, Sector 5
4 DELTA ANTREPRIZA DE CONSTRUCTII SI MONTAJ 93 SRL 2.763 407,736,320 6 49,802,964 1,214 Bucuresti, Sector 3
5 EURO CONSTRUCT TRADING 98 SRL 2.675 354,497,745 8 37,930,724 780 Bucuresti, Sector 6
6 ROMSTRADE SRL 2.663 539,727,094 4 10,881,044 1,623 Adunatii Copaceni,
GIURGIU
7 PA & CO INTERNATIONAL SRL 2.625 258,246,094 11 25,877,958 431 Oituz, BACAU
8 CONFORT SA 2.575 525,731,236 5 11,074,420 956 Timisoara, TIMIS
9 TEHNOLOGICA RADION SRL 2.563 584,307,327 2 23,489,181 2,546 Bucuresti, Sector 6
10 VECTRA SERVICE SRL 2.563 280,969,243 10 6,377,622 1,119 Brasov, BRASOV
11 MAX BOEGL ROMANIA SRL 2.388 207,780,105 12 5,928,033 70 Bucuresti, Sector 5
12 TEL DRUM SA 2.125 193,301,624 13 10,032,706 754 Alexandria, TELEORMAN
13 PORR BAU GMBH VIENA - SUCURSALA BUCURESTI 2.100 299,672,016 9 (29,364,539) 1 Bucuresti, Sector 2
14 SOCIETATEA DE CONSTRUCTII IN TRANSPORTURI BUCURESTI SA
2.075 105,082,473 24 1,477,547 548 Bucuresti, Sector 2
15 TANCRAD SRL 1.988 157,769,876 16 13,108,790 216 Galati, GALATI
16 TECHNOCER SRL 1.988 129,537,856 20 19,071,128 225 Nadrag, TIMIS
17 VIAROM CONSTRUCT SA 1.938 139,925,805 19 1,228,653 192 Bucuresti, Sector 2
18 ROMAIRPORT SRL ROMA SUCURSALA BUCURESTI 1.888 173,530,540 14 36,549,939 181 Bucuresti, Sector 1
19 CAST SRL 1.888 148,165,257 18 11,441,844 192 Banesti, PRAHOVA
20 ASTALDI SPA ITALIA SUCURSALA GHEORGHE PETRASCU BUCURESTI
1.875 161,892,895 15 (39,178,338) 273 Bucuresti, Sector 3
21 SUCT SA 1.838 39,228,422 27 1,562,349 185 Suceava, SUCEAVA
22 REGIA AUTONOMA JUDETEANA DE DRUMURI SI PODURI CONSTANTA RA
1.825 152,753,686 17 2,098,383 312 Constanta, CONSTANTA
23 ANTREPRIZA DE REPARATII SI LUCRARI A R L CLUJ SA 1.825 129,455,525 21 7,308,075 305 Cluj-Napoca, CLUJ
24 ENKA CONSTRUCTION AND DEVELOPMENT BV AMSTERDAM SUCURSALA CLUJ ROMANIA
1.800 104,888,838 25 257,433,177 - Valisoara, CLUJ
25 CONSTRUCTII FEROVIARE IASI - GRUP COLAS SA 1.675 105,760,403 23 100,190 442 Iasi, IASI
26 AXELA CONSTRUCTII SRL 1.638 100,467,169 26 558,183 128 Timisoara, TIMIS
27 BILFINGER BERGER BAUGESELLSCHAFT MBH WIEN - SUCURSALA BUCURESTI
1.588 114,488,846 22 27,686,490 52 Voluntari, ILFOV
CONSTRUCTION OF ELECTRIC SITESRANK COMPANY NAME MCR
SCORING ANNUAL TURNOVER
( 2011 RON)TURNOVER
RANKINGPROFIT/LOSS
(2011 RON)NO OF
EMPLOYEES CONTACT
1 SOCIETATEA COMERCIALA FILIALA DE INTRETINERE SI SERVICII ENERGETICE ELECTRICA SERV SA
2.550 615,540,933 1 -108,331,565 5,836 BucureSti, Sector 1
2 ELECTROMONTAJ SA 2.363 218,674,815 2 15,920,377 1,503 Bucuresti, Sector 4
3 ELCOMEX-IEA SA 2.225 157,037,488 3 5,772,649 517 Cernavoda, CONSTANTA
4 ELECTROGRUP SA 2.225 133,145,637 4 20,861,680 267 Cluj-Napoca, CLUJ
5 ELECTROMONTAJ CARPATI SA 2.088 24,532,871 10 208,333 186 Sibiu, SIBIU
6 CAMUSAT ROM-TELECOMUNICATII SRL 2.038 107,472,723 5 11,442,865 163 Balotesti, ILFOV
7 ELM ELECTROMONTAJ CLUJ SA 1.975 62,112,962 6 1,716,084 331 Cluj Napoca, CLUJ
8 ELECTROECHIPAMENT INDUSTRIAL SRL 1.975 49,890,717 7 3,398,589 252 Resita, CARAS-SEVERIN
9 EGNATIA ROM SRL 1.900 24,568,209 9 7,526,285 41 Bucuresti, BUCURESTI
10 ELECTROCONSTRUCTIA ELCO BUCURESTI SA 1.838 28,742,461 8 563,244 195 Bucuresti, Sector 4
11 OBFIIRCOM WOOFER SRL 1.688 13,587,093 12 7,171,719 97 Dorobantu, CALARASI
12 VINTEERVIEL SRL 1.538 10,822,994 13 7,055,405 147 Schitu, GIURGIU
13 AMPEL DACIA SRL 1.500 21,814,034 11 -178,434 8 Bucuresti, BUCURESTI
14 EMFOR MONTAJ SA 1.438 10,599,571 14 99,429 88 Bucuresti, Sector 4
MCR CONSTRUCTIONS


CONSTRUCTION OF UTILITY PROJECTS FOR FLUIDS AND RELATED SERVICESRANK COMPANY NAME MCR
SCORING ANNUAL TURNOVER
( 2011 RON) TURNOVER
RANKING PROFIT/LOSS
(2011 RON) NO OF
EMPLOYEES CONTACT
1 PROSPECTIUNI SA 3.313 315,293,527 1 30,981,821 1,604 Bucuresti, Sector 1
2 SCHLUMBERGER LOGELCO INC PANAMA CIUDAD DE PANAMA SUCURSALA BUCURESTI
2.388 310,672,870 2 18,448,822 198 Bucuresti, Sector 1
3 CIS GAZ SA 2.250 51,585,372 18 2,014,366 41Santana de Mures,
MURES
4 COMESAD RO SA 2.188 84,657,979 10 15,815,814 145 Pitesti, ARGES
5 CDI OILFIELD SERVICES SRL 2.025 127,285,218 4 15,862,747 302 Ploiesti, PRAHOVA
6 ROMPETROL WELL SERVICES SA 2.025 95,488,935 8 15,813,330 351 Ploiesti, PRAHOVA
7 ANVERGO SRL 1.938 73,074,443 12 18,866,419 90 Targu Mures, MURES
8 M I PETROGAS SERVICES ROMANIA SRL 1.888 100,127,153 7 2,269,156 94 Bucuresti, Sector 1
9 ACVATOT SRL 1.875 82,046,651 11 2,223,171 252 Bucuresti, Sector 2
10 GEPROCON SA 1.838 54,955,627 15 1,869,346 124 Iasi, IASI
11 HOLDING-AKTOR-ATHENA SA-GRECIA-SUCURSALA BUCURESTI
1.838 54,057,459 16 352,939 100 Bucuresti, Sector 3
12 CONDMAG SA 1.825 113,716,459 5 850,645 925 Brasov, BRASOV
13 PETROSTAR SA 1.825 35,522,481 20 6,056,806 267 Ploiesti, PRAHOVA
14 GRUP 4 INSTALATII SA 1.688 103,969,650 6 381,440 242 Cluj-Napoca, CLUJ
15 IRIDEX GROUP CONSTRUCTII SRL 1.688 70,143,058 13 2,079,212 158 Voluntari, ILFOV
16 APROV SA 1.588 38,875,833 19 424,206 75 Medias, SIBIU
17 INSPET SA 1.575 182,405,099 3 14,092,109 867 Ploiesti, PRAHOVA
18 IREM SERVICII SRL 1.575 52,558,450 17 568,754 746 Bucuresti, Sector 3
19 ATLAS-GIP SA 1.475 90,210,777 9 -2,887,820 343 Ploiesti, PRAHOVA
20 PETROCONST SA 1.475 61,487,985 14 2,002,135 516 Constanta, CONSTANTA
HYDRO-TECHNICAL CONSTRUCTIONS RANK COMPANY NAME MCR
SCORING ANNUAL TURNOVER
( 2011 RON) TURNOVER
RANKING PROFIT/LOSS
(2011 RON) NO OF
EMPLOYEES CONTACT
1 HIDROCONSTRUCTIA SA 3.750 1,002,178,651 1 50,428,795 6,528 Bucuresti, Sector 1
2 SOCOT SA 2.375 138,509,790 2 6,085,184 837 Targu Mures, MURES
3 CONSTRUCTII HIDROTEHNICE SA 2.175 99,247,937 4 8,721,317 428 Iasi, IASI
4 DRAGOS CONSTRUCT GRUP SRL 2.088 20,696,244 10 2,594,099 51 Bascov, ARGES
5 BENY ALEX SRL 1.888 21,597,946 9 3,974,958 187Negresti-Oas, SATU
MARE
6 TRANS CARPAT SRL 1.888 16,789,481 14 763,401 51 Onesti, BACAU
7 ARGOS SA 1.875 77,513,770 5 468,528 633 Cernavoda, CONSTANTA
8 REPCON SA 1.838 127,860,296 3 1,480,719 56 Oradea, BIHOR
9 CONTEHNO SRL 1.838 34,075,243 7 552,542 66 Oradea, BIHOR
10 ECOLOGIC CONSTRUCT SRL 1.838 23,673,692 8 591,751 66 Oradea, BIHOR
11 SIBAREX SA 1.788 14,466,421 16 140,155 126 Campineanca, VRANCEA
12 APASCO SA 1.775 67,320,246 6 2,508,312 570 Maneciu, PRAHOVA
13 VIDELI SRL 1.750 9,475,072 20 117,839 44 Satu Mare, SATU MARE
14 HIDROTERRA SA 1.738 12,063,924 17 296,922 67Slobozia Sucevei ,
SUCEAVA
15 BELLA CONSULTING CONSTRUCTION SRL 1.688 17,081,962 12 111,489 52 Satu-Mare, SATU MARE
16 MIF SA 1.688 14,763,098 15 19,733 138Sangeorgiu de Mures,
MURES
17 HIDROTRAN SRL 1.600 20,186,159 11 178,471 47Miercurea Ciuc,
HARGHITA
18 ANDRITZ HYDRO GMBH RAVENSBURG - SUCURSALA PORTILE DE FIER II SRL
1.600 11,077,067 18 2,262,488 11 Gogosu, MEHEDINTI
19 HIDRO ESTE CONSTRUCTII SRL 1.600 9,539,204 19 -48,097 0 Bucuresti, Sector 3
20 GRUP HIDROCON SA 1.588 16,974,888 13 158,246 60 Bucuresti, Sector 6
MCR CONSTRUCTIONS
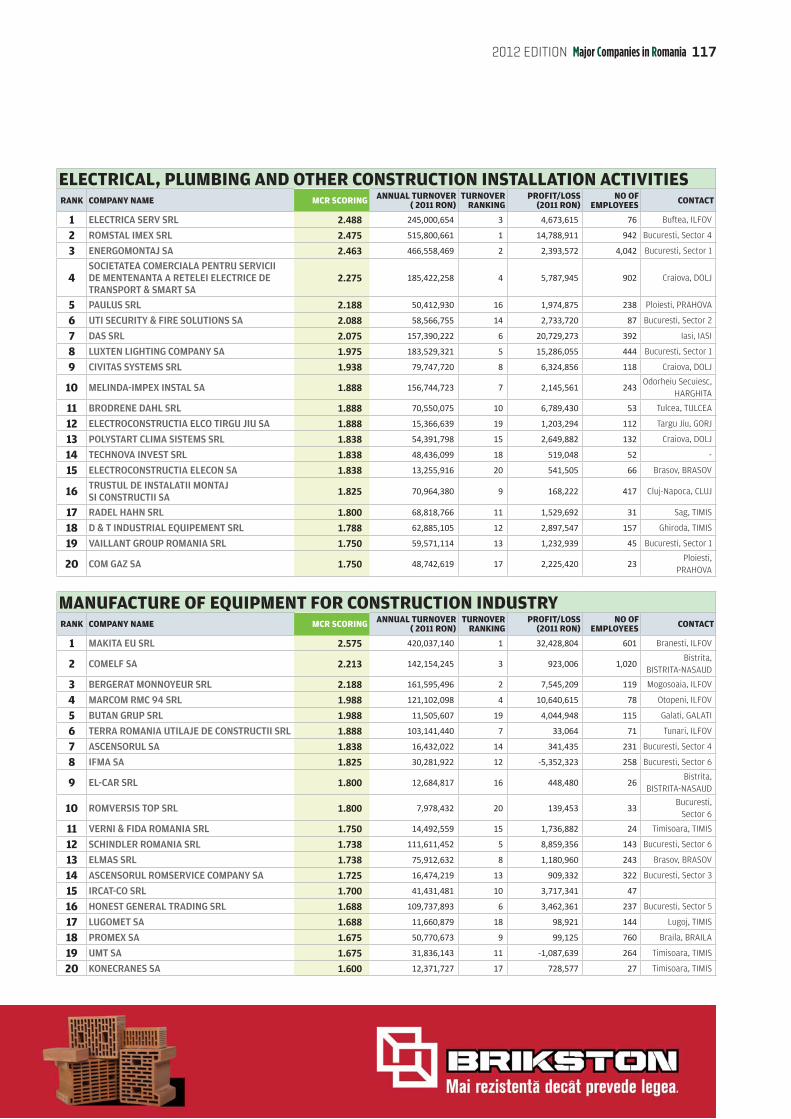
ELECTRICAL, PLUMBING AND OTHER CONSTRUCTION INSTALLATION ACTIVITIES RANK COMPANY NAME MCR SCORING ANNUAL TURNOVER
( 2011 RON)TURNOVER
RANKINGPROFIT/LOSS
(2011 RON)NO OF
EMPLOYEES CONTACT
1 ELECTRICA SERV SRL 2.488 245,000,654 3 4,673,615 76 Buftea, ILFOV
2 ROMSTAL IMEX SRL 2.475 515,800,661 1 14,788,911 942 Bucuresti, Sector 4
3 ENERGOMONTAJ SA 2.463 466,558,469 2 2,393,572 4,042 Bucuresti, Sector 1
4SOCIETATEA COMERCIALA PENTRU SERVICII DE MENTENANTA A RETELEI ELECTRICE DE TRANSPORT & SMART SA
2.275 185,422,258 4 5,787,945 902 Craiova, DOLJ
5 PAULUS SRL 2.188 50,412,930 16 1,974,875 238 Ploiesti, PRAHOVA
6 UTI SECURITY & FIRE SOLUTIONS SA 2.088 58,566,755 14 2,733,720 87 Bucuresti, Sector 2
7 DAS SRL 2.075 157,390,222 6 20,729,273 392 Iasi, IASI
8 LUXTEN LIGHTING COMPANY SA 1.975 183,529,321 5 15,286,055 444 Bucuresti, Sector 1
9 CIVITAS SYSTEMS SRL 1.938 79,747,720 8 6,324,856 118 Craiova, DOLJ
10 MELINDA-IMPEX INSTAL SA 1.888 156,744,723 7 2,145,561 243Odorheiu Secuiesc,
HARGHITA
11 BRODRENE DAHL SRL 1.888 70,550,075 10 6,789,430 53 Tulcea, TULCEA
12 ELECTROCONSTRUCTIA ELCO TIRGU JIU SA 1.888 15,366,639 19 1,203,294 112 Targu Jiu, GORJ
13 POLYSTART CLIMA SISTEMS SRL 1.838 54,391,798 15 2,649,882 132 Craiova, DOLJ
14 TECHNOVA INVEST SRL 1.838 48,436,099 18 519,048 52 -
15 ELECTROCONSTRUCTIA ELECON SA 1.838 13,255,916 20 541,505 66 Brasov, BRASOV
16 TRUSTUL DE INSTALATII MONTAJ SI CONSTRUCTII SA
1.825 70,964,380 9 168,222 417 Cluj-Napoca, CLUJ
17 RADEL HAHN SRL 1.800 68,818,766 11 1,529,692 31 Sag, TIMIS
18 D & T INDUSTRIAL EQUIPEMENT SRL 1.788 62,885,105 12 2,897,547 157 Ghiroda, TIMIS
19 VAILLANT GROUP ROMANIA SRL 1.750 59,571,114 13 1,232,939 45 Bucuresti, Sector 1
20 COM GAZ SA 1.750 48,742,619 17 2,225,420 23Ploiesti,
PRAHOVA
MANUFACTURE OF EQUIPMENT FOR CONSTRUCTION INDUSTRYRANK COMPANY NAME MCR SCORING ANNUAL TURNOVER
( 2011 RON) TURNOVER
RANKING PROFIT/LOSS
(2011 RON) NO OF
EMPLOYEES CONTACT
1 MAKITA EU SRL 2.575 420,037,140 1 32,428,804 601 Branesti, ILFOV
2 COMELF SA 2.213 142,154,245 3 923,006 1,020Bistrita,
BISTRITA-NASAUD
3 BERGERAT MONNOYEUR SRL 2.188 161,595,496 2 7,545,209 119 Mogosoaia, ILFOV
4 MARCOM RMC 94 SRL 1.988 121,102,098 4 10,640,615 78 Otopeni, ILFOV
5 BUTAN GRUP SRL 1.988 11,505,607 19 4,044,948 115 Galati, GALATI
6 TERRA ROMANIA UTILAJE DE CONSTRUCTII SRL 1.888 103,141,440 7 33,064 71 Tunari, ILFOV
7 ASCENSORUL SA 1.838 16,432,022 14 341,435 231 Bucuresti, Sector 4
8 IFMA SA 1.825 30,281,922 12 -5,352,323 258 Bucuresti, Sector 6
9 EL-CAR SRL 1.800 12,684,817 16 448,480 26Bistrita,
BISTRITA-NASAUD
10 ROMVERSIS TOP SRL 1.800 7,978,432 20 139,453 33Bucuresti,
Sector 6
11 VERNI & FIDA ROMANIA SRL 1.750 14,492,559 15 1,736,882 24 Timisoara, TIMIS
12 SCHINDLER ROMANIA SRL 1.738 111,611,452 5 8,859,356 143 Bucuresti, Sector 6
13 ELMAS SRL 1.738 75,912,632 8 1,180,960 243 Brasov, BRASOV
14 ASCENSORUL ROMSERVICE COMPANY SA 1.725 16,474,219 13 909,332 322 Bucuresti, Sector 3
15 IRCAT-CO SRL 1.700 41,431,481 10 3,717,341 47
16 HONEST GENERAL TRADING SRL 1.688 109,737,893 6 3,462,361 237 Bucuresti, Sector 5
17 LUGOMET SA 1.688 11,660,879 18 98,921 144 Lugoj, TIMIS
18 PROMEX SA 1.675 50,770,673 9 99,125 760 Braila, BRAILA
19 UMT SA 1.675 31,836,143 11 -1,087,639 264 Timisoara, TIMIS
20 KONECRANES SA 1.600 12,371,727 17 728,577 27 Timisoara, TIMIS
1172012 EDITION Major Companies in Romania
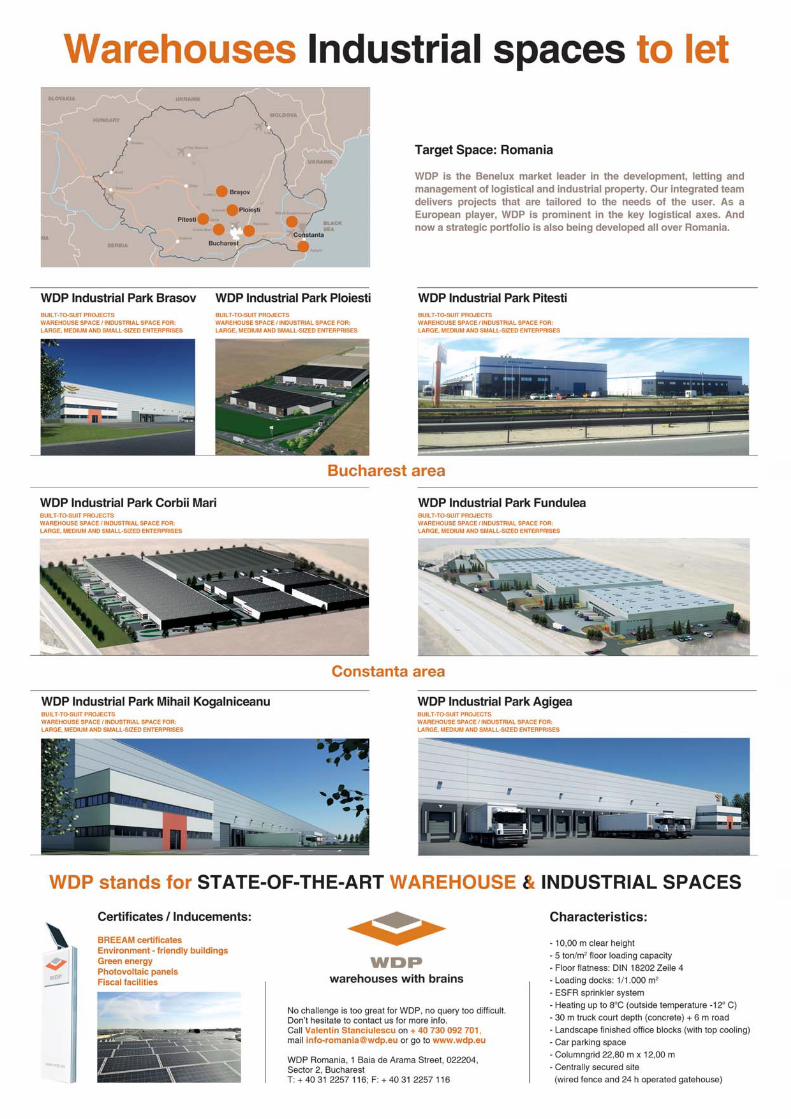

Real Estate REAL ESTATE EVALUATION COMPANIES REAL ESTATE AGENCIES REAL ESTATE PROJECT DEVELOPERS PROPERTY & FACILITY MANAGEMENT REAL ESTATE ASSET MANAGERS
1192012 EDITION Major Companies in Romania
8%yield for office buildings
8.75% yield for commercial centers10.25% yield for storehouses

There are some good news and some bad news regarding the Real Estate industry in Romania over the last couple of years. The bad news is that the long awaited recovery has not arrived yet, or at least is not visible to most people. The good news is that there are some positive signs that market contraction is reaching the end and opportunities that will lead to recovery under specific conditions are here.
WHERE ARE WE STANDING?Four years after the global credit crisis, the Romanian market in general struggles to stabilize before starting to grow dynamically in all sectors again.
While Romania still remains an attractive market in terms of real estate transactions, the severe restrictions put in bank financing, as well as the Euro crisis have raised the investment risk and quelled investment appetite.
The continuous crisis in the Eurozone, which accounts for the vast majority of investments in the Romanian economy, is clearly an obstacle in attracting further investments from countries in this region (but not only). FDI is down by 30% in the current year. Unless the environment regarding the survival of the Euro does not become clear, this instability will continue to affect the Romanian economy and consequently the Real Estate market.
Banking finance is still deteriorating and the costs and terms imposed are not affordable for many players. Finance is very limited, very expensive and directed to very few heavily scrutinized investors. Furthermore, the political environment in Romania is another factor which could withhold the prospects of the country.
Under these circumstances, not surprisingly, funds invested in the European Real Estate are directed to the markets with national economic performance and stability. Around 75% of total transaction volume was completed in prime property in just five countries.
LOOKING TWO YEARS BACK Taking for granted the specific global, European and local political and economical environment, 2011 and first half of 2012 overall could not have been great years for the Real Estate market. Yields in Romania are stabilized to 8% for offices, 8.75% for commercial centres and 10.25% for storehouses.
Despite this however, there were a number of facts and transactions indicating that some of the most solid and dynamic players in the market position themselves in Real Estate investments. This suggests they believe that the worse is gone or at least is approaching to its end and now it is the right time to invest.
One of the most dynamic investors, AIM and Johannesburg listed property investor New Europe Property Investments (NEPI) concluded in 2011 and 2012 a number of big deals:In early 2011, they acquired the office project Floreasca Business Park, in a deal of over EUR 100 million (remaining the biggest deal in Romanian Real Estate after crisis).
Following this, by December 2011, NEPI completed its capital increase through rights issue of approximately 14.3 million new shares to raise about EUR 40 million in fresh equity. It is said, the issue was oversubscribed by 48%.
In January 2012, NEPI acquired the City Business Centre project in Timisoara, from businessman Ovidiu Sandor and partners. Beyond this, in December 2011, NEPI started works on its 50,000 sqm shopping centre in Ploiesti. On another project, NEPI bought and undertook the renovation of a 4,500 sqm historical building at a 12,000 sqm class business centre in the Romanian capital.
Another company, Portuguese shopping centre specialist Sonae Sierra, started in July 2011 the construction of its EUR 110 million Adora mall in Craiova. The mall will have 190 shops on a leasable area of 59,000 sq m and has signed contracts for 40% of this surface. Starting work on Adora, confirms Sonae Sierra’s commitment to Romania, said the local Managing Director, Ingo Nissen. The largest Chinatown complex in South Eastern Europe opened in summer 2011, 16 km from Bucharest, following an investment by 19 Chinese businessmen of around EUR 150 million. The China Town complex covers 40 hectares and hosts 3,275 commercial areas, 1,380 logistic warehouses, cafes, restaurants, casinos, banks and kindergartens.
Property investor and developer Iannis Papalekas has completed a couple of remarkable transactions in 2011 and 2012. In November 2011, he got what was characterized by the market “the golden deal” from the most famous bankruptcy of a Romanian mall. Papalekas sold the City Mall for EUR 103 million in 2005 and bought it back in 2011 for just EUR 17 million.
MCR REAL ESTATE
The real state of real estate in Romania
Andreas Hadjidamianou, Partner, Assurance, Ernst & Young

121
Major Companies in Romania 2012 EDITION Major Companies in Romania
In addition, in 2012, Iannis Papalekas and Dragos Bilteanu acquired Tower Center International – the developer of Victoria Square office tower, in a transaction whose value amounts to approximately EUR 50 million. The company in (one of Bucharest landmark buildings) had failed to rent it because of a litigation process, which is now settled.
The housing market in Romania is also seeing important developments. Austria’s listed property group Immofinanz completed at the end of 2011 the acquisition of the additional 69.2% stake in South-Eastern Europe residential developer Adama Holding. It sees Adama as the ideal platform for expansion in the region, especially in Romania. Adama completed 1,500 apartments since its founding in 2005, with 10 projects under way. It has a development portfolio of 1.36 million sqm in 40 further projects. Immofinanz Romanian portfolio includes undeveloped sites in Bucharest And the mid-term objective is to create entire city quarters.
LOOKING AHEAD Everybody agrees that the prospects for the Real Estate market in Romania, as well as for the overall Romanian economy are very promising; it is just a matter of when this will happen.
Current affairs regarding Eurozone crisis, instability in the Arab world and uncertainty about Iran, as well as local political environment are obviously factors that could negatively affect growth potentials.
Despite this, in the past couple of years we have seen some good signs indicating that slowly, but steadily, trust in the market is regained, following two years (2009, 2010) with virtually zero activity, which deteriorated investments and returns. The positive indications are expected to continue:
London’s AIM-listed East Balkan Properties (EBP), active in Romania, Bulgaria and Serbia, started plans to divest its stake in the so-called Glorient portfolio of retail, logistics and office properties, plus land holdings, worth approximately EUR 108 million in order to raise cash. EBP has appointed Raiffeisen Investments to market the portfolio. This carries mortgage debt of EUR 20 million, which is rapidly amortizing and could be repaid from cash-flows by late 2013, it said. EBP’s portfolio at end-June included a 40% stake in Glorient, consisting of 13 land and 35 retail assets valued at EUR 35 million in Romania.
In cooperation with Knight Frank affiliate and Prime Property Advisors, EBP is also selling its logistics warehouses, a prime asset with stable occupancy. Six land assets and two small shops valued at EUR 8 million are also up for sale in Romania, Serbia and Slovakia. EBP swung into a first-half net profit of EUR 3.5 million from a EUR 3 million loss in 2010.
Real4You, an Austrian developer and investor operating in Central Europe, announced in January 2012 that it is resuming its Mega Mall shopping centre projects in Bulgaria and Romania,
which were delayed by the financial crisis. The firm has opened 10 retail centres in the Czech Republic, Slovakia, Hungary and Romania in the past three years. Financing remains difficult, but good projects in good locations are feasible, based on company executives. In the fourth quarter of 2012, Real4You will start building its 70,000 sqm Mega Mall centre in Bucharest, scheduled to open in 3Q14. Real4You also plans to develop smaller malls in other Romanian cities, anchored by a hypermarket or supermarket.
The market research company, PMR Publications, expects Romania to become the second largest shopping mall market in Central and Eastern Europe - behind Poland but ahead of Hungary and the Czech Republic. It is said that some 6sqm of new Gross Leasable Area is planned for completion by end 2013, and existing investment plans could absorb over EUR 12 billion in 2013.
Romania’s share of shopping malls in the big six countries of the East European region - Poland, Czech Republic, Hungary, Slovakia, Bulgaria and Romania - grew to 16% in 2010 from 9% in 2007, and is predicted to reach 18% by 2013. The total market grew by 50% to 12 million sqm between 2007 and 2010. Investors in Romania plan to launch new mall spaces of 1.3 million sqm by 2013 and the country is soon due to overtake the Czech Republic in terms of total shopping centre space.
Moreover, following the creation of numerous distressed assets in the Global Real Estate business, there will be a tendency for consolidation over the next years. This will be driven mainly by American hedge funds, some of which have already proceeded fund raising to this respect.
US-based private equity group, Blackstone, has raised over USD 6 billion of equity capital for a new real estate fund to acquire mainly distressed-property assets, and is aiming for final closing at committed capital of USD 10 billion. The funds will be targeted globally.
Blackstone’s fund is only one of many other funds of similar nature recently created. It is understood that should a fair part of these funds be attracted to Romanian projects, a boost in the Real Estate market will emerge.
IN CONCLUSION...The real estate market of the SEE region is still in its beginnings, compared with Western markets. Although the region enjoyed few years of pre-crisis boom, it did not get the chance to grow and stabilize before crushing down. But with the market contraction reaching the end, opportunities start rising once again.
With a positive resolution in the exogenous threats, the good years are ahead, probably not generating the pro-crisis returns but definitely standing on a much more sound and sustainable basis.

The chronic global economic-financial crisis and particularly the uncertain situation generated by the sovereign debt crisis in Europe, decreased the private or institutional investors' appetite for Romania. The direct effect of this situation has led to a negative evolution of the local real estate market in 2012, although the declines were less pronounced than the first years of crisis. They generally occurred in the bubble's area and the development lands' area, the latter having the strongest speculative character. TRENDS REVERSED If in the boom period between 2004 and the first half of 2008 the real estate trading prices have risen spectacularly due to the flow of foreign capital and the prospect of Romania's accession to the EU, in the next period the trend reversed and the number of transactions reduced dramatically, and
after a severe correction in 2009 the values began to steadily decline.
Some examples of real estate market analysis conducted by Darian DRS are significant to observe the influence of financing restraint on the branch. The fact that the value of commercial, industrial or office properties fell during June 2008 and June 2012 by 15% - 20%, is one example. In addition to, during the same period, the residential properties fell by 40% - 60%, and development lands by 60% - 65%, noting that this analysis refers to average trading values and represents properties of 27 major cities.
FINDING ROOTS IN AGRICULTURE LANDS The evolution of the real estate market is closely correlated with the economic status, the income of the population and the financing costs, and because
these parameters haven't registered positive developments, the outlook does not seem to contain a significant recovery. I estimate that in the near future we will face decreases in property values for all real estate segments.
Even if we cannot speak of price increases in the real estate industry sector mentioned, I do believe that the value of
MCR Opinion
Low appetite in real estate sight ADRIAN CRIVII,
FRICS, MAA,CEO Darian DRS SA
agricultural lands will have an increasing evolution in the next period, considering the quality and the potential of these lands in Romania, but also the global situation regarding agriculture and food.
Analyzing the perspective, in the long run, starting from the infrastructure situation, the quality of buildings and real estates in Romania, there is a large investment coverage as well as a growing real estate industry, but this can only be achieved on the basis of efficiency and sustainability.
“THE GENERAL GLOBAL CONTEXT MAKES THE VALUE OF AGRICULTURAL LANDS TO FIND AN INCREASING EVOLUTION IN THE NEXT PERIOD IN ROMANIA AND ELSEWHERE.”

REAL ESTATE EVALUATION COMPANIESRANK COMPANY NAME ANNUAL TURNOVER
( 2011 RON)ANNUAL TURNOVER
(2010 RON)ANNUAL TURNOVER
GROWTH %PROFIT/LOSS
(2011 RON) CONTACT
1 DARIAN DRS 12,842,747 11,115,009 15.5% 2,767,980 Cluj Napoca
2 ROMCONTROL 11,586,374 12,352,861 -6.2% 385,910 Bucuresti
3 R.E.A.G. REAL ESTATE ADVISORY GROUP SRL 4,944,195 3,774,175 31.0% 736.137 Bucuresti
4 PRIME PROPERTY ADVISERS - KNIGHT FRANK 3,886,875 5,012,717 -22.5% 498,705 Bucuresti
5 FAIRVALUE CONSULTING 3,444,162 3,163,049 8.9% 800,472 Bucuresti
6 TERRAVAL VALUATION AND PROPERTY MANAGEMENT SRL
2,032,816 1,784,541 13.9% 209,567 Bucuresti
7 PARKER LEWIS & ASSOCIATES 1,709,599 1,610,968 6.1% 4,867 Bucuresti
8 GBF VALUATION & RESEARCH 1,046,397 844,045 24.0% 269,953 Bucuresti
9 CBAR RESEARCH & VALUATION ADVISORS (COLDWELL BANKER AFFILIATES)
1,031,553 1,315,475 -21.6% -50,705 Bucuresti
10 COHISPANIA CONSULTING 777,098 1,030,496 -24.6% 8,168 Bucuresti
11 EVAL CORP 575,205 108,990 427.8% -135,392 Bucuresti
123
Major Companies in Romania 2012 EDITION Major Companies in Romania

REAL ESTATE AGENCIESRANK COMPANY NAME MCR SCORING ANNUAL TURNOVER
( 2011 RON)TURNOVER
RANKINGPROFIT/LOSS
(2011 RON)NO OF
EMPLOYEES CONTACT
1 DTZ ECHINOX CONSULTING SRL 2.188 11,943,575 2 1,226,582 57 Bucuresti, Sector 1
2 EHL REAL ESTATE ROMANIA SRL 1.788 7,210,245 4 1,468,609 75 Bucuresti, Sector 2
3 ESOP CONSULTING SRL 1.750 1,574,295 13 436,020 12 Bucuresti, Sector 5
4 WINTERHILL (ROMANIA) SRL 1.700 2,329,275 9 322,054 8 Bucuresti, Sector 3
5 CONADI IMOB CONSTRUCT SRL 1.650 2,505,726 8 681,083 3 Bucuresti, Sector 5
6 EUROEST INVEST SRL 1.550 622,363 19 76,185 7 Bucuresti, Sector 1
7 CBAR MANAGEMENT SRL 1.500 2,194,086 10 7,109,459 1 Bucuresti, Sector 2
8 PRIME PROPERTY ADVISERS SRL 1.450 3,886,875 7 498,705 9 Bucuresti, Sector 1
9 COLLIERS INTERNATIONAL SRL 1.400 18,125,713 1 245,488 37 Bucuresti, Sector 1
10 CUSHMAN & WAKEFIELD ROMANIA SRL 1.400 6,920,053 5 -1,865,871 47 Bucuresti, Sector 5
11 LONGBRIDGE CONSULTING SRL 1.400 1,317,867 15 -296,342 4 Bucuresti, Sector 2
12 MEDIA CITY SRL 1.350 1,346,630 14 22,534 5 Bucuresti, Sector 4
13 REGATTA SRL 1.350 1,247,406 16 -395,918 4 Bucuresti, Sector 1
14 CBRE REAL ESTATE CONSULTANCY SRL 1.300 9,699,059 3 -1,088,794 27 Bucuresti, Sector 1
15 BNP PARIBAS REAL ESTATE ADVISORY SA 1.300 4,440,084 6 18,047 17 Bucuresti, Sector 1
16 BLACKSHIRE CONSULTING SRL 1.300 1,652,937 12 -5,620 10 Bucuresti, Sector 1
17 EVEREST MANAGEMENT GROUP SRL 1.300 1,087,429 17 -137,729 2 Bucuresti, Sector 2
18 IMOINVEST CO SRL 1.250 1,658,091 11 -1,077,369 1 Arad, ARAD
19 GRUP DE LUX SRL 1.250 832,072 18 -271,350 5 Cluj-Napoca, CLUJ
20 CITA CONSULTANTA IMOBILIARA SRL 1.200 588,842 20 -156,220 1 Bucuresti, Sector 6
REAL ESTATE PROJECT DEVELOPERSRANK COMPANY NAME MCR SCORING ANNUAL TURNOVER
( 2011 RON)TURNOVER
RANKINGPROFIT/LOSS
(2011 RON)NO OF
EMPLOYEES CONTACT
1 IULIUS MANAGEMENT CENTER SRL 2.275 44,951,361 12 1,900,689 593 Iasi, IASI
2 ANCHOR GRUP SA 1.788 56,873,508 9 8,866,702 94 Bucuresti, Sector 6
3 NIRO INVESTMENT SA 1.775 146,912,403 2 -23,098,693 456 Dobroiesti, ILFOV
4 IMPACT DEVELOPER & CONTRACTOR SA 1.700 13,540,400 19 -22,261,046 27 Voluntari, ILFOV
5 RE PROJECT DEVELOPMENT SRL 1.650 105,806,424 3 781,211 16 Bucuresti, Sector 1
6 CONARG SA 1.650 50,586,684 10 8,842,444 24 Pitesti, ARGES
7 OPUS LAND DEVELOPMENT SA 1.500 65,703,631 5 -43,437,533 21Stefanesti de Jos,
ILFOV
8 ALPHA PROPERTY DEVELOPMENT SRL 1.450 66,911,023 4 1,124,904 2 Bucuresti, Sector 1
9 REWE PROJEKTENTWICKLUNG ROMANIA SRL 1.450 49,082,579 11 6,540,526 0 Bucuresti, Sector 2
10 UPGROUND ESTATES SRL 1.400 161,461,695 1 -50,147,779 13 Bucuresti, Sector 1
11 BANEASA INVESTMENTS SA 1.388 14,583,443 18 -6,578,392 72 Bucuresti, Sector 1
12 CONARG REAL ESTATE SRL 1.350 20,031,378 15 -1,827,632 12 Bucuresti, Sector 1
13 ANCHOR REAL ESTATE DEVELOPMENT SRL 1.300 19,215,457 16 -36,019,925 1 Bucuresti, Sector 6
14 PROPRIETATI IMOBILIARE LAR SRL 1.300 11,114,417 20 -741,677 0Bucuresti,
BUCURESTI
15 PORTLAND ROMANIA INDUSTRIAL ONE SRL 1.250 29,592,337 14 -4,620,982 1 Bucuresti, Sector 1
16 SOCIETATE DEZVOLTARE COMERCIAL SUDULUI (SDCS) SRL
1.200 59,944,526 7 -30,622,411 0 Bucuresti, Sector 2
17 PLUS DEVELOPMENT SRL 1.200 58,324,855 8 -17,053,295 6 Voluntari, ILFOV
18 GREENLAKE DEVELOPMENT SRL 1.200 18,087,295 17 -2,659,493 5 Bucuresti, Sector 1
19 ITALIAN-ROMANIAN INDUSTRIAL DEVELOP-MENT ENTERPRISE - IRIDE SA
1.150 61,428,073 6 -18,297,180 0 Bucuresti, Sector 2
20 HERCESA IMOBILIARA SRL 1.150 31,286,421 13 -12,977,914 12 Bucuresti, Sector 2
MCR REAL ESTATE

PROPERTY & FACILITY MANAGEMENTRANK COMPANY NAME MCR SCORING ANNUAL TURNOVER
( 2011 RON)TURNOVER
RANKINGPROFIT/LOSS
(2011 RON)NO OF
EMPLOYEES CONTACT
1 UTI CONSTRUCTION & FACILITY MANAGEMENT SA
2.075 148,803,805 1 4,277,845 935 Bucuresti, Sector 2
4 ISS FACILITY SERVICES 1.863 62,353,239 2 6,265,667 1,775 Bucuresti, Sector 1
2 BUILDING SUPPORT SERVICES SRL 2.075 39,011,585 3 2,708,349 537 Bucuresti, Sector 1
3 MT & T PROPERTY MANAGEMENT SRL 1.938 28,954,240 4 2,963,155 209 Bucuresti, Sector 1
5 CORAL CONSTRUCT 1.688 10,440,881 5 1,430,058 136 Bucuresti, Sector 1
6 P DUSSMANN SERV ROMANIA SRL 1.475 7,101,821 6 -1,617,979 257 Bucuresti, Sector 1
7 ATALIAN ROMANIA 1.388 6,540,444 7 -601,093 62 Bucuresti, Sector 1
8 SOLEIL’S GROUP MANAGEMENT SRL 1.300 4,726 8 -49,632 1 Bucuresti, Sector 4
125
Major Companies in Romania 2012 EDITION Major Companies in Romania

REAL ESTATE ASSET MANAGERSRANK COMPANY NAME MCR SCORING ANNUAL TURNOVER
( 2011 RON)TURNOVER
RANKINGPROFIT/LOSS
(2011 RON)NO OF
EMPLOYEES CONTACT
1 PRACTIC SA 2.138 31,940,194 12 16,061,785 62 Bucuresti, Sector 1
2 EQUEST INVESTMENTS SRL 1.750 3,558,698 26 556,753 34 Bucuresti, Sector 5
3 BILLA INVEST CONSTRUCT SRL 1.700 32,907,838 10 12,629,449 0 Bucuresti, Sector 2
4 COCOR SA 1.650 21,629,373 8 -34,845,683 41 Bucuresti,
5 WEST GATE SRL 1.650 35,697,080 19 10,669,923 2 Bucuresti, Sector 6
6 METROPOLIS INVESTITII IMOBILIARE SRL 1.600 26,619,053 15 7,948,488 0Bucuresti,
BUCURESTI
7 OASIS SRL 1.600 10,526,371 21 4,782,860 11 Sibiu, SIBIU
8 CA IMMO REAL ESTATE MANAGEMENT ROMANIA SRL
1.550 5,896,171 3 354,862 15 Bucuresti, Sector 1
9 MERCUREAL SRL 1.550 33,161,298 9 21,463,909 1 Timisoara, TIMIS
10 BUCURESTI MALL DEVELOPMENT AND MANAGEMENT SRL
1.550 69,446,545 17 19,426,873 1 Bucuresti, Sector 3
11 PORSCHE IMMOBILIEN SRL 1.550 24,118,764 23 385,672 23 Voluntari, ILFOV
12 OPERA CENTER ONE SRL 1.550 7,928,022 24 958,082 0 Bucuresti, Sector 5
13 FLOREASCA BUSINESS PARK SRL 1.500 44,780,304 5 1,593,643 1 Bucuresti, Sector 1
14 METROPOLIS GRUP SRL 1.488 39,962,296 6 86,421 150Bistrita,
BISTRITA-NASAUD
15 METEX BIG SA 1.450 36,478,572 7 24,204,523 39 Bucuresti, Sector 1
16 ALIA INMOBILIARIA SRL 1.400 22,886,121 18 -12,190,407 1 Bucuresti, Sector 1
17 BANEASA BUSINESS & TECHNOLOGY PARK SA 1.350 28,362,452 14 -72,324 20 Bucuresti, Sector 1
18 PLAZA MALL DEVELOPMENT AND MANAGEMENT SRL
1.300 52,605,344 4 -17,786,550 1 Bucuresti, Sector 6
19 IULIUS GROUP SRL 1.300 24,250,831 16 -4,237,324 1 Iasi, IASI
20 NEPI INVESTMENT MANAGEMENT SA 1.250 4,784,316 20 825,763 32 Bucuresti, Sector 1
21 TRI INVESTMENTS ERPF SRL 1.250 15,178,997 25 -6,253,068 0 Bucuresti, Sector 1
22 VICTORIA HOLDING SA 1.200 8,553,491 13 -38,131,981 4 Bucuresti, Sector 4
23 RETAIL GROUP SRL 1.200 30,363,431 22 10,173 5 Bucuresti, Sector 1
24 PVN ROMANIA SRL 1.150 93,144,665 2 4,621,582 11 Bucuresti, Sector 2
25 EUROPOLIS PARK BUCHAREST ALPHA SRL 1.100 32,408,421 11 -6,536,385 0 Bucuresti, Sector 1
26 BCR REAL ESTATE MANAGEMENT SRL 1.088 118,866,909 1 -1,456,192 96 Bucuresti, Sector 3
MCR REAL ESTATE

WDP ROMANIACompany name: WDP DEVELOPMENT RO S.R.L.
1 Baia de Arama Street, 022204, sector 2, Bucharest Phone: +40-31-225.71.16 +40-730-09.27.01 Fax: +40-31-225.71.16E-mail: [email protected]: www.wdp.eu
Contact: Company profile:
JEROEN BIERMANS - Managing PartnerVALENTIN ST~NCIULESCU - Business Development Manager
Top management:
Warehouses De Pauw Comm.Va, Belgium: 51%JB Top Pro Invest SRL, Romania: 49%
Shareholders:
Certificates / Inducements:
Private-owned: 100%Romanian: 49%Foreign: 51%
Ownership:
WDP, Warehouses with brains
Brands:
TONY DE PAUW - CEOJOOST UWENTS - CEOJEROEN BIERMANS - Managing Partner
Members of the board:
Financial information: Registered capital
34,411,260 RON (2009)
WDP (Warehouses De Pauw) is the market leader in Benelux and a major global player through its efficient customized services of development, letting and management of logistical and industrial properties, with a portfolio of approx. 2 million square meters of warehouses, distribution centers and industrial spaces in Europe.
In Romania, on an overall area of approx 200 hectares, WDP is developing a strategic portfolio of 10 logistic and industrial parks (that grant land and building tax payment exemptions for tenants), with direct access or close to the highways and main roads. The company secured also a financing line for future developments in Romania from the European Investment Bank and, depending on the size of the project, can follow the client in areas in which it is not yet active.
WDP is present near Bucharest (Corbii Mari – with access to Bucharest - Pite[ti highway, Fundulea and S`rule[ti – with access to Bucharest – Constan]a highway), near Pite[ti (Oarja – with access to A1 highway), in Bra[ov (Codlea), near Ploie[ti (Arice[tii Rahtivani – with access to DN72 and P`ule[ti, both of them with easy access to DN1 and the future Bucharest - Bra[ov highway). Nearby Constan]a, two industrial parks will also be developed: Mihail Kog`lniceanu (access to International Airport and E60) and Agigea (access to the container loading terminal and Danube - Black Sea canal).
WDP timely delivered in 2011 two production facilities of approx 14,000 sqm for Roechling Automotive and HP Pelzer Pimsa, within the Industrial Park in Oarja, Arge[, on Pan European Corridor IV, close to automotive manufacturers (and their suppliers) Dacia Renault and Ford. These buildings are compliant with all specifications agreed with the client and the quality and conditions of a state-of-the-art warehouse and production space, according to WDP’s approach regarding its developments worldwide.
WDP is a flexible company with top quality logistic & production spaces
The company proves its flexibility through its willingness to adjust A Class facilities to the expectations of its potential customers (built to suit projects) who seek to efficiently use their space, may it be ambient or refrigerated, with special contamination regime, for ADR goods or specific warehouse or production halls.
WDP is a transparent stock exchange company with great financial clout. Joining forces with WDP means choosing a long term relationship. Companies can keep on focusing on their core business, WDP takes care of their real estate.
In short, everything about WDP is added value.
Time after time, the result is warehouses with brains.
BREEAM certificates Environment - friendliness buildings Green energy Photovoltaic panels Fiscal facilities


Wood, Paper & Furniture MANUFACTURE OF FURNITURE RETAIL TRADE OF FURNITURE, CARPETS AND LIGHTING EQUIPMENT MANUFACTURE OF WOOD AND WOODEN PRODUCTS MANUFACTURE OF PAPER AND PAPER PRODUCTS
1292012 EDITION Major Companies in Romania
18%increase of exports for furniture products in 2011
20% decrease for the Romanian furniture consumption in 2011

Romania is ranked as one of the cheapest producers of raw wood in the region, but still battles ailing problems that include poor logistics, dirty wood and rock damage. And if we count that the past five years have witnessed almost half a billion Euro invested in the wood sector by European frontrunners, one might wonder why no EU money was used to subsidize the building of forest roads, for starters.
So, we’ve got the wood, what to do with it?
Romanian tastes in furniture changed in recent times, with consumers increasingly seeking modern and practical furniture, which encourages companies such as Ikea to reconsider their development and possibly to open new outlets. Kika is another multinational player which offers self-assembly furniture. Locally, strong players such as Mobexpert and Elvila are also taking a closer look at ways to attract more customers.
HAIL TO THE NEW KING!On the wood processing side, the market has a new leader, as Austrian-based Holzindustrie Schweighofer has overtaken Kronospan and Egger, also Austria-based companies, but also national wood company Romsilva, which manages state-owned forests and held the local supremacy until 2010. Holzindustrie Schweighofer operates in four locations in Romania, in Sebes, Alba County, Radauti and Siret, in Suceava and Comanesti, in Bacau County.
In turn, Kronospan, which has to date invested 500 million Euro in three locations in Romania (two factories and a logistics center), expects its turnover to increase by 15 per cent this year, despite rough beginnings of the year. Egger Group focuses on developing an integrated production site in Radauti, which includes creating almost 1,000 new jobs.
Investments announced by companies active in wood processing are likely to move forward a market which already overpasses one billion Euro per year, considering the cumulated turnovers of the largest five market players, as shown by Trade Registry data. At the same time, state-owned Romsilva manages 3.4 million hectares of forests owed by the state and 1.1 million hectares of private forests, held by both local authorities and individuals. The company could be
considered one of the most valuable firms in Romania, but has failed to produce spectacular results in recent years.
RETAILERS REMAIN CAUTIOUSLY OPTIMISTICAt the beginning of the year most of the furniture industry leaders were optimistic with regards to 2012 being a growth year, considering exports, expansions or new collections that could pour life in an industry which has been quite hit by the economic crisis. At the same time, the need for cash flow has driven companies to turn to foreign markets, where the money is.
Furniture and interior decorations retailer Ikea has overpassed the 90 million Euro mark in the September 2011 – August 2012 timeframe, up 10.8 per cent over the previous fiscal year. With these results, Ikea increases competition at the top, in an industry where the 100 million Euro mark has so far only been surpassed by Mobexpert, Elvila and Aramis Invest.
With the year now coming to an end, the local furniture market enjoys good retail sales as well as increased export moves, according to data by the Romanian Furniture Producers Association (AMPR).
Whether they are local or multinational, retailers count on sales boosts related to the winter holidays, which could lead to an overall market increase of five per cent. Furniture retailers the likes of Kika and Ikea count on such seasonal promotions to add to an already hefty business balance sheet.
Local frontrunner Mobexpert is also seeing good sales nationwide in the first three quarters of 2012, but its owner, Dan Sucu, remains cautious about further increase of his business throughout the whole year.
Nevertheless, overall consumption seems to have picked up the pace and this adds to the general optimism, as well as signs of recovery in the governmental sector, with the increase in wages for state employees. Market players hope part of the money the government gives back to its employees will eventually end up in the furniture industry.
Development was divided in several categories in the last year. Small players bet on expansion, like in the case of
MCR WOOD, PAPER & FURNITURE
New investments need Government support
Corina Mica - Freelance Journalist

131
Campina-based Lemet. In the last few years, the firm has accessed six million Euro of European funds to expand its production facilities and for investments in a new production line. Lemet produces 1.2 million sqm of wooden boards (PAL) and 360,000 items of furniture yearly. The production plans involve over 30,000 sqm. Items under the brand “Lem’s” are sold through a current countrywide network of 102 franchised stores.
Elsewhere, niche products were the winning card for heavyweights, the likes of Mobexpert, while companies such as Elvila found solid ground for development on foreign markets.
Still, another problem facing local producers is the increasing cost of raw materials worldwide, such as PAL, accessories, iron materials and adhesives. To compensate for the need to raise product prices, producers have started to renegotiate contracts with suppliers, increase production, implement cost-cutting strategies and reduce profit margins.
FURNITURE PRODUCERS ON A HIRING SPREEIkea said it wants to increase its local acquisitions pool, which translates into national producers investing into expanding production lines and hiring new staff to service them. Such a case is Sighetu Marmatiei-based Plimob, which is one of Ikea’s local suppliers, for which it delivers about 92 per cent of its chairs production. The firm recently hired 100 new people to face up the increased demand. Another such supplier is Sortilemn, which delivers to companies such as Stokke and Elano in Norway and Holsag in Canada. The company started to feel the increased demand towards the end of last year, when the foreign market has started to show an increased interest for products made in eastern Europe. Sortilemn also employed 80 new people last year to face the demand.
Consumption crisis or not, it seems that both producers and retailers need to fight to get more accessible products, which will, in turn, increase foot traffic in stores nationwide, on a market which has been estimated at around one billion Euro.
2012 EDITION Major Companies in Romania

The Romanian furniture consumption decreased by 20 percent in 2011, y-o-y evolution yet, in this context, the local businesses increased due to the exports and the larger foreign demand registered on the European markets and not only. These are the facts.
WELCOMING EXPORTSIndeed, if we are to underline an evolution root, it may be built around the exports. In 2011, Romania exported 18 percent more furniture products all around the world, not only in the European Union countries. For the end of this year there are no statistics yet but, I do not have any reason to believe that the exports will see a decline. This proves that, both qualitatively and technically, the furniture and probably also the raw wood materials, are appreciated abroad. What we lack are Romanian brands and a better communication of the brands on external markets.
The challenge in the local furniture industry is to find the end-user / consumer. But the quest for consumers is not specific to furniture industry as it is being felt all around the economy, in each industry, being determined by the downsized demand. What we should do is to adjust, to build new strategies in order to meet the consumer’s needs with the right products.
Regarding the furniture production, I think Romania is doing well and most of the factories work for the export. As we know, “nobody is a prophet in his land" - and it is probably better for us to be
appreciated abroad, it's good that Romanian products are requested on European markets.
CONSUMERS ADJUST, NO MATTER WHATThe furniture producers and importers in Romania are feeling the effects of the overall economic turmoil and the results can be easily perceived in the market. Hence, the furniture consumption declined, since the consumers lowered their spending budget for interior design works. Also, the buyers slowed down the pace of acquiring large furniture products such as beds, coaches and closets and now they are targeting accessories. In this way, they manage to revamp the interiors with lower costs.
Even if the spending declined and the industry is noticing a slower acquisition pace, this doesn’t mean that the consumption has nearly ceased. The regular customers who buy premium brands adjust easily to changes and the ones who can afford it, will even adjust to trends.
LUXURY COSTS MONEYIt is said that the luxury consumption doesn’t tend to decline in the same rhythm as the mainstream level and I must admit that this proves to be quite true, if we analyze our experience in the last years. It is also true that redecorations are no longer such a frequent habit as it used to be in times of economic well- being. Several years ago, there were clients who could afford new decorations every six months or yearly. However, the luxury segment is keen on
MCR Opinion
A louder voice for Romanian design brandsCAMELIA SUCU,
President Class Living
maintaining its gained status even now, during crisis, and plans to keep it like this in spite of a larger financial effort. This segment usually pays attention to trends and looks for best quality materials.
BELIEVING IN ROMANIAN BRANDSI am a really tireless ambassador of Romanian brands and Romanian investments but I don’t always find an echo to my beliefs. Romanian designers are very talented and they convey a strong creative force, that is why I encourage and support them. In a concept store opened in Aleea Alexandru - Iconic - I often exhibit their creations. Yet, unfortunately, the Romanian design is not aspirational for the luxury segment, which looks for high-awareness brands and international logos. Although Romanian furniture design probably is as qualitative and creative as the luxury brands, it does not have the same reputation or tradition, it is rather experimental.
“IN 2011, ROMANIA EXPORTED 18 PERCENT MORE FURNITURE ALL AROUND THE WORLD, NOT ONLY IN THE EUROPEAN UNION COUNTRIES.”

1332012 EDITION Major Companies in Romania
MANUFACTURE OF WOOD AND WOODEN PRODUCTSRANK COMPANY NAME MCR SCORING ANNUAL TURNOVER
( 2011 RON)TURNOVER
RANKINGPROFIT/LOSS
(2011 RON)NO OF
EMPLOYEES CONTACT
1 HOLZINDUSTRIE SCHWEIGHOFER SRL 3.913 1,589,521,923 1 312,866,728 1,267 Sebes, ALBA
2 KRONOSPAN SEBES SA 2.775 972,230,274 2 -31,620,157 442 Sebes, ALBA
3 EGGER ROMANIA SRL 2.575 591,358,419 3 9,019,206 421 Radauti, SUCEAVA
4 HOLZINDUSTRIE SCHWEIGHOFER BACO SRL 2.425 148,857,030 6 9,088,642 587 Comanesti, BACAU
5 CARPAT STICKS SRL 2.288 28,545,402 21 2,131,414 137 Timisoara, TIMIS
6 SIGSTRAT SA 2.125 29,512,260 20 1,029,947 473Sighetu Marma]iei,
MARAMURES
7 KRONOSPAN ROMANIA SRL 1.988 333,002,622 4 -41,395,337 230 Brasov, Brasov
8 APICOM SRL 1.938 38,818,983 15 711,323 117 Ciumani, HARGHITA
9 RGHOLZ COMPANY SRL 1.925 56,493,171 12 582,464 528Viseul de Sus, MARAMURES
10 WERZALIT LEMN TECH SOCIETATE IN COMANDITA
1.925 48,176,072 13 1,695,537 251 Lugoj, TIMIS
11 LOSAN ROMANIA SRL 1.875 110,435,385 8 4,445,228 463 Brasov, BRASOV
12 DEKO RAME SRL 1.875 60,762,632 11 436,516 301Miercurea Sibiului,
SIBIU
13 SIMPE SRL 1.788 85,317,857 9 2,102,202 249 Sebes, ALBA
14 PORTA KMI ROMANIA SRL 1.688 30,124,090 19 1,563,041 177 Arad, ARAD
15 VITRAROM SRL 1.588 35,539,625 16 1,040,845 181 Lunca Calnicului,
BRASOV
16 JF FURNIR SRL 1.575 68,512,778 10 1,351,456 299 Brasov, BRASOV
17 UNIROM SA 1.550 151,116,670 5 120,907 27 Buzau, BUZAU
18 VIMAN WOOD SRL 1.500 45,199,951 14 -142,228 11 Bulz, BIHOR
19 HOLVER SRL 1.438 145,045,032 7 -5,335,397 226 Brasov, BRASOV
20 APLAST WOOD INDUSTRY SRL 1.288 30,151,367 18 -7,941,645 150Ceptura de Jos,
PRAHOVA
21 ECO - ENERG - LEMN SA 1.238 33,287,487 17 -4,181,096 70Campulung la Tisa,
MARAMURES

MANUFACTURE OF FURNITURERANK COMPANY NAME MCR SCORING ANNUAL TURNOVER
( 2011 RON)TURNOVER
RANKINGPROFIT/LOSS
(2011 RON)NO OF
EMPLOYEES CONTACT
1 TAPARO SA 2.513 235,860,894 2 8,037,080 1,025 Borcut, MARAMURES
2 ARAMIS INVEST SRL 2.463 462,621,227 1 6,727,816 2,728Baia Mare,
MARAMURES
3 PARISOT GREEN SOFA SRL 2.375 88,095,643 9 3,617,414 499 Oradea, BIHOR
4 COTTA INTERNATIONAL SRL 2.275 195,710,802 3 8,081,585 667 Arad, ARAD
5 COUNTRY ELEMENTS SRL 2.125 79,292,073 10 3,124,579 468Satu Mare, SATU
MARE
6 ECOLOR SRL 2.088 136,599,965 4 21,744,892 240 Jucu, CLUJ
7 POLIPOL MOBILA SRL 2.075 68,519,023 13 3,210,911 555 Foieni, SATU MARE
8 LEMET SRL 2.025 77,163,547 11 6,584,447 425 Campina, PRAHOVA
9 ADA FABRICA DE MOBILA SRL 1.975 100,937,770 5 4,004,835 501 Salonta, BIHOR
10 SORTILEMN SA 1.975 127,349,789 7 10,292,827 888 Gherla, CLUJ
11 PLIMOB SA 1.863 120,220,699 6 8,148,992 1,253Sighetu Marmatiei,
MARAMURES
12 DITRE INTERNATIONAL SRL 1.825 70,429,121 8 6,048,115 434 Arad, ARAD
13 GAMMET 2000 SRL 1.825 88,267,833 12 5,507,625 305 Lugoj, TIMIS
14 ELVILA SA 1.813 65,699,347 15 -341,516 1,242 Bucuresti, Sector 1
15 SAVINI DUE SRL 1.788 49,770,401 20 6,236,516 225 Sebes, ALBA
16 RUS-SAVITAR SRL 1.725 63,428,790 17 7,990,145 326 Dudestii Noi, TIMIS
17 MOBILUX SA 1.675 49,682,667 21 -1,371,357 253 Bucuresti, Sector 2
18 MAXSTILE SRL 1.588 66,148,225 14 587,021 205 Arad, ARAD
19 TOP DESIGN FURNITURE SRL 1.475 43,535,940 16 -2,697,201 275Mediesu Aurit,
SATU MARE
20 TRANSVAL MOB SA 1.475 63,932,669 18 -1,517,837 365Sighetu Marmatiei,
MARAMURES
21 ITALROM LEATHER SRL 1.475 60,373,138 22 -8,752,869 398 Mintia, HUNEDOARA
22 FORTISMOB SRL 1.388 52,857,296 19 -7,385,331 189 Ploiesti, PRAHOVA
RETAIL TRADE OF FURNITURE, CARPETS AND LIGHTING EQUIPMENTRANK COMPANY NAME MCR SCORING ANNUAL TURNOVER
( 2011 RON)TURNOVER
RANKINGPROFIT/LOSS
(2011 RON)NO OF
EMPLOYEES CONTACT
1 MOBEXPERT PIPERA SRL 2.288 59,663,229 2 2,898,976 135 Bucuresti, Sector 1
2 POLTERGEIST SRL 2.138 51,547,741 3 858,921 94 Timisoara, TIMIS
3 CASA DI ADRIANO SRL 1.938 13,631,552 15 397,282 60 Bucuresti, Sector 5
4 MOBEXPERT BRASOV SRL 1.750 11,773,641 18 1,123,744 39 Brasov, BRASOV
5 MOBEXPERT BANEASA SRL 1.738 64,330,807 1 7,159,208 122 Bucuresti, Sector 1
6 SORTEM COM SRL 1.688 17,841,247 9 26,809 74 Roman, NEAMT
7 BOGDAN MOB TRADING SRL 1.600 16,573,833 12 24,590 2 Bucuresti, Sector 1
8 MIVALIS COMPANY SRL 1.600 15,468,702 14 -2,039 0 Gilau, CLUJ
9 VENUS MOB SRL 1.600 12,872,171 17 16,428 50 Nanov, TELEORMAN
10 PHYLOSOPHY DESIGN SRL 1.500 20,886,410 7 165,371 46 Bucuresti , Sector 1
11 CASA RUSU SRL 1.488 44,023,647 5 -50,686 146 Dumbravita, TIMIS
12 2B GROUP SRL 1.488 20,404,337 8 63,021 87 Regin, MURES
13 MOBILIER OVO DESIGN SRL 1.450 9,328,287 20 194,423 14 Chitila, ILFOV
14 FURNITURE DESIGN DISTRIBUTION SRL 1.400 46,600,540 4 -5,864,440 48 Bucuresti, Sector 1
15 MOBEXPERT BERCENI SRL 1.388 17,830,650 10 -3,125,057 67 Bucuresti, Sector 2
16 ROMATEX SA 1.388 13,460,165 16 -1,994,932 95 Otopeni, ILFOV
17 MOBEXPERT MILITARI SRL 1.338 16,741,155 11 -326,782 56 Bucuresti, Sector 6
18 MOBEXPERT PANTELIMON SRL 1.338 16,124,509 13 -837,269 71 Bucuresti, Sector 2
19 MOBEXPERT IASI SRL 1.300 11,117,014 19 -1,337,215 42 Iasi, IASI
20 ROMEUR SRL 1.200 26,577,772 6 -7,649,101 31 Oradea, BIHOR
MCR WOOD, PAPER & FURNITURE

135
2012 EDITION Major Companies in Romania
MANUFACTURE OF PAPER AND PAPER PRODUCTSRANK COMPANY NAME MCR SCORING ANNUAL TURNOVER
( 2011 RON)TURNOVER
RANKINGPROFIT/LOSS
(2011 RON)NO OF
EMPLOYEES CONTACT
1 VRANCART SA 2.613 163,751,672 4 1,997,353 1,134 Adjud, VRANCEA
2 RONDOCARTON SRL 2.525 227,136,348 1 3,390,861 256Sannicoara/
apahida, CLUJ
3 PEHART TEC SA 2.325 210,733,160 2 2,110,088 366 Petresti, ALBA
4 DUNAPACK RAMBOX PRODIMPEX SRL 2.088 95,450,789 8 4,671,711 162Sfantu Gheorghe,
COVASNA
5 ABC-IMPEX SRL 2.088 31,913,712 19 4,862,684 118Odorheiu Secuiesc,
HARGHITA
6 ECOPAPER SA 2.038 115,333,200 6 12,443,820 140 Zarnesti, BRASOV
7 ECOPACK SA 2.038 86,129,630 9 1,705,689 193 Ghimbav, BRASOV
8 ROMPRIX EXIM SRL 1.988 42,356,469 16 1,455,185 140 Pantelimon , ILFOV
9 PETROCART SA 1.925 28,584,328 20 489,451 254Piatra Neamt,
NEAMT
10 AMBRO SA 1.825 161,795,924 5 9,263,547 382 Suceava, SUCEAVA
11 COMCEH SA 1.675 165,631,973 3 -8,639,888 256 Calarasi, CALARASI
12 PENTAROM SRL 1.650 39,215,539 17 196,859 46 Campulung, ARGES
13 ROMCARTON SA 1.638 115,133,219 7 1,991,635 248 Bucuresti, Sector 3
14 TIGER SOMES IMPEX SA 1.638 74,343,508 10 1,171,181 65 Dej, CLUJ
15 MAYR MELNHOF PACKAGING ROMANIA SRL 1.638 51,360,418 15 3,462,819 124 Blejoi, PRAHOVA
16 BARLETA SRL 1.638 33,144,531 18 319,355 174 Bacau, BACAU
17 SEGEZHA PACKAGING SRL 1.588 60,298,883 12 -4,495,789 72 Ploiesti, PRAHOVA
18 SCA PACKAGING ROMANIA SRL 1.588 55,983,189 14 -5,398,928 119 Timisoara, TIMIS
19 AVERY DENNISON MATERIALS ROM SRL 1.400 63,164,414 11 -460,760 16Comuna Remetea
Mare, TIMIS
20 VPK PACKAGING SRL 1.288 58,204,240 13 -6,852,283 145 Salonta, BIHOR

Manufacturer for ready to wear garments

Textile & Leather PREPARATION OF TEXTILE FIBERS AND TEXTILES MANUFACTURE MANUFACTURE OF WEARING APPAREL RETAIL TRADE OF CLOTHING IN SPECIALISED STORES MANUFACTURE OF FOOTWEAR AND LEATHER GOODS RETAIL TRADE OF FOOTWEAR AND LEATHER GOODS
1372012 EDITION Major Companies in Romania
85%of local production of textiles is exported

The domestic consumption of textiles shrank dramatically during 2009-2011, by even two or three times, according to market estimates. In 2009 a large number of producers relocated manufacturing facilities in Asia, while a part of the local companies closed or downsized significantly their output. This resulted in around 25% y/y decline of the domestic textiles production in 2009. Such abrupt plunge has not been alleviated yet, even though in 2011 and H1 2012 the market showed some signs of revival. Statistical data however reveal that clothing apparel output index further dropped by 1.5% y/y in 2011, after the marginal 0.1% y/y decline in 2010 and 25.5% y/y plunge in 2009. In H1 2012, the index turned in the positive area, increasing by 6.6% y/y.
Even so, Romania remained among the top European clothing and footwear producers in 2011 and the financial results of the top players show that large companies have managed to adapt to market circumstances. The total revenues of major 20
companies neared EUR 900mn in 2011. Nonetheless, very few of the top producers are present on the domestic retail market, as most of them shifted focus to orders under lohn system.
MCR TEXTILE & LEATHER
Production of textilesrecovers slowly after the 2009 plunge
Diana Macovei, Freelance Analyst
Foreign trade with apparel, accessories, knit or crochet in 2007-2011 (EUR mn)
Foreign trade with apparel, accessories, not knit or crochet in 2007-2011 (EUR mn)
810.7
723.3
634.5
683.1
734.2
301.4
350.9
304.1
305.7
339.4
509.3
372.4
330.4
377.4
394.8
0.0 100.0 200.0 300.0 400.0 500.0 600.0 700.0 800.0 900.0
2007
2008
2009
2010
2011
Balance
Import
Export
2,281.0
2,002.6
1,498.9
1,536.1
1,812.0
359.9
437.0
329.7
332.1
400.7
1,921.2
1,565.6
1,169.2
1,204.0
1,411.3
0.0 500.0 1,000.0 1,500.0 2,000.0 2,500.0
2007
2008
2009
2010
2011
Balance
Import
Export
1,300.4
1,188.8
975.0
1,111.4
1,305.5
468.7
501.7
404.2
473.6
592.4
831.7
687.1
570.8
637.8
713.1
0.0 200.0 400.0 600.0 800.0 1,000.0 1,200.0 1,400.0
2007
2008
2009
2010
2011
Balance
Import
Export
Foreign trade with footwear, gaiters in 2007-2011 (EUR mn)
Manufacturing of textile products - Monthly output indices (2005=100, unadjusted series)
Manufacturing of clothing apparel - Monthly output indices (2005=100, unadjusted series)
0
20
40
60
80
100
120
140
Jan Feb Mar Apr May Jun Jul Aug Sep Oct Nov Dec
2007 2008 2009 2010 2011 2012
0
20
40
60
80
100
120
Jan Feb Mar Apr May Jun Jul Aug Sep Oct Nov Dec
2007 2008 2009 2010 2011 2012

IMPORTS OF TEXTILES SHOW MORE DYNAMIC PERFORMANCE THAN EXPORTS, BUT TRADE BALANCE REMAINS POSITIVE IN 2011The imports of clothing and footwear products showed more dynamic performance than exports in 2011, yet the trade balance remains safely on the positive side. Imports of knitted apparel and accessories increased by 11% y/y in 2011, versus 7.5% y/y advance of exports during the year, but their value did not reach half of exports, statistical data show. The same situation is noted for the not knitted apparel and accessories, where imports surged by 20.7% y/y to EUR 400.3mn, versus exports advancing by 18% y/y to EUR 1.8bn in 2011. Footwear and gaiters exports reached EUR 1.3bn last year, up by 17.5% y/y, while imports rose by 25.1% y/y to EUR 592.4mn. The fervent dynamics of clothing and footwear imports last year is partially explained by the retailers’ expansion and the trade balance is unlikely to witness abrupt changes in the short run. According to market data, around 85% of the textiles production is exported. Traditionally, the main export countries have been Italy, Germany and the United Kingdom. There were no significant changes in this regard in 2011 compared to the previous year.
Prospects for the exports’ performance in the near future remain volatile and linked to the economic developments in the EU, as the economic downturn continues to affect European countries thus exerting downward pressure on external demand.
TEXTILE PRODUCERS CONTINUE TO FACE WITH QUALIFIED LABOUR FORCE SHORTAGE, INCREASING COSTS, DIFFICULT ACCESS TO FINANCINGThe Romanian textiles industry includes approximately 100,000 manufacturing companies, of which most are small and medium sized. Even though the larger players managed to generally overcome the adverse market conditions in 2011, the smaller companies continued to face with endogenous demand-side deterrents, as well as exogenous drawback factors, in the broader macroeconomic context impacting negatively on costs and financing conditions. The small and medium-sized companies have limited distribution options and are more vulnerable to the retailers’ shifting preference towards cheaper products, disregarding quality level, under the shrinking purchase power of customers. In addition to this, the sector is still facing a shortage of qualified labour force.
FOREIGN PLAYERS EXPAND AGGRESSIVELY ON RETAIL MARKETThe clothing and footwear retailers resumed expansion, taking advantage of the more advantageous terms offered by the shopping centre owners and of the modern retail space supply added to the market in 2011, which allowed them access to new locations across the country.
The retail chains’ expansion was rather linked to market circumstances, namely the availability of new spaces under more convenient conditions, than demand-driven, as the purchase power continued to shrink in 2011 and players actually reported declining sales per store last year.
Besides the expansion of the international retailers already present on the domestic market, Romania continued to be attractive for new entrants. Mas-market brands such as H&M, Calzedonia, New Look and Petit Bateau, but also luxury brands Burberry, Escada, Valentino entered the Romanian market last year.
The local clothing and footwear retailers, on the other hand, besides harsh competition from international companies, faced with difficult access to financing and liquidity problems for the past two years, which added to the rising cost of utilities.
Accordingly, the Romanian companies could not keep up the pace in expansion with international players and could not offset the shrinking sales per store with higher volumes sold in enlarged retail network, as it was the case of foreign companies. Some local players were forced to file for insolvency, while others restructured business and product portfolios.
Exports of apparel, accessories, not knit or crochet by country in 2010-2011 (% of total not knit, EUR mn)
38.9%
23.2%
15.5%
9.5%
2.2% 10.8%
39.0%
23.3%
15.5%
9.0%
2.7%
10.6%
Italy
Germany
United Kingdom
France
Spain
Others
1392012 EDITION Major Companies in Romania
Inner circle: 2010Outer circle: 2011

MANUFACTURE OF WEARING APPARELRANK COMPANY NAME MCR SCORING ANNUAL TURNOVER
( 2011 RON)TURNOVER
RANKINGPROFIT/LOSS
(2011 RON)NO OF
EMPLOYEES CONTACT
1 ROSKO TEXTIL SRL 2.913 332,469,063 2 21,491,773 1,207 Curtici, ARAD
2 BRAICONF SA 2.663 33,123,548 36 1,959,082 1,046 Braila, BRAILA
3 BENROM SRL 2.488 637,218,673 1 43,536,804 165Miercurea Sibiului,
SIBIU
4 NORADA SA 2.325 50,860,168 24 8,928,338 873Odorheiu Secuiesc,
HARGHITA
5 COTTONTEX SRL 2.275 68,382,284 16 6,997,326 651 Timisoara, TIMIS
6 TIME INTERNATIONAL TRADING SRL 2.263 84,186,970 13 10,356,453 1,082 Bucuresti, Sector 6
7 IC COMPANYS ROMANIA SRL 2.200 182,429,489 3 3,073,763 31 Bucuresti, Sector 2
8 FORMENS SRL 2.175 121,839,417 7 12,043,477 580 Botosani, BOTOSANI
9 PANCARPROD SRL 2.175 33,604,197 35 857,062 658 Vaslui, VASLUI
10 TANEX SRL 2.125 54,244,777 21 2,579,863 740 Bucuresti, Sector 5
11 ROMANITA SA 2.113 39,659,278 31 21,163 1,200 Caracal, OLT
12 ARIES TEXTILE SRL 2.075 135,028,106 4 10,894,723 430 Arad, ARAD
13 IKOS - CONF SA 2.063 51,380,178 23 7,625,780 1,211Odorheiu - Secuiesc,
HARGHITA
14 PANDORA PROD SRL 2.025 92,496,436 9 9,309,121 897 Focsani, VRANCEA
15 BIANCOSPINO SRL 2.025 55,045,378 20 11,953,845 338 Breaza, PRAHOVA
16 PRODUCTIE ZARAH MODEN SRL 1.975 123,467,384 6 13,318,427 705Targu Secuiesc,
COVASNA
17 UNICONFEX EXIM SRL 1.938 46,849,867 27 2,235,103 130 Slatina, OLT
18 KOSMOS TRE SRL 1.938 41,605,777 28 4,446,164 175 Alba Iulia, ALBA
19 VERSO CORPORATION SRL 1.875 61,022,269 18 4,042,225 457 Bucuresti, Sector 6
20 GRECALE IMPEX SRL 1.875 31,500,551 37 1,380,746 730 Macin, TULCEA
21 JOLIDON IMPORT EXPORT SRL 1.863 90,419,019 10 -24,343,450 1,042 Cluj-Napoca, CLUJ
22 STAFF COLLECTION SRL * 1.863 59,759,438 19 -6,402,083 1,026 Bucuresti, Sector 3
23 OZTASAR SRL 1.850 87,609,569 12 7,900,751 36 Paulesti, PRAHOVA
24 MAGLIERIE CRISTIAN IMPEX SRL 1.813 39,987,615 30 1,835,760 1,005 Calafat, DOLJ
25 BLAZER SRL 1.763 49,539,671 26 1,213,918 1,091 Braila, BRAILA
26 SONOMA SRL 1.725 62,696,249 17 893,274 732 Bacau, BACAU
27 IMPERIAL SA 1.725 50,104,648 25 1,192,933 641Turnu Magurele,
TELEORMAN
28 NEW-FASHION SA 1.725 40,446,948 29 5,848,662 876Targu Secuiesc,
COVASNA
29 FRANCESCA INDUSTRIES SA 1.688 36,533,517 33 1,099,180 228 Pitesti, ARGES
30 ADESGO SA 1.675 53,482,902 22 -2,583,478 367 Bucuresti, Sector 4
31 INCOM-VRANCO SA 1.675 31,227,674 38 1,345,467 604 Focsani, VRANCEA
32 ARTIFEX SRL 1.625 88,299,960 11 1,911,690 876 Focsani, VRANCEA
33 CATEX SA 1.625 33,883,461 34 2,686,663 678 Calarasi, CALARASI
34 ALISON HAYES (ROMANIA) SRL 1.613 126,114,708 5 2,654,329 1,499 Urziceni, IALOMITA
35 MAGREB KNITWEAR EAST SA 1.575 69,100,733 15 1,326,868 422 Cluj-Napoca, CLUJ
36 STEILMANN ROMANIA SRL 1.388 38,918,164 32 -2,141,495 227 Bucuresti, Sector 4
37 ROULEAU - GUICHARD ROUMANIE SRL 1.375 70,648,929 14 -6,961,917 865 Sacele, BRASOV
38 BETACOM PROD SRL 1.300 103,597,149 8 -222,458 43 Comanesti, BACAU
MCR TEXTILE & LEATHER

PREPARATION OF TEXTILE FIBRES AND TEXTILES MANUFACTURERANK COMPANY NAME MCR SCORING ANNUAL TURNOVER
( 2011 RON)TURNOVER
RANKINGPROFIT/LOSS
(2011 RON)NO OF
EMPLOYEES CONTACT
1 RIFIL SA 2.525 269,519,650 1 2,610,062 525 Savinesti, NEAMT
2 INTEX SA 2.475 98,854,440 6 3,478,047 276 Nasaud, BISTRITA-NASAUD
3 ROSEYARNS SRL 2.375 41,825,255 14 15,948,632 337 Bistrita, BISTRITA-NASAUD
4 TEXTILA OLTUL SA 2.375 33,215,784 16 3,538,773 430 Sfantu Gheorghe, COVASNA
5 READY GARMENT TECHNOLOGY SRL 1.988 32,157,662 17 11,046,119 193 Sfantu Gheorghe, COVASNA
6 TREVERTEX SRL 1.938 65,296,445 10 2,790,918 56 Curtici, ARAD
7 MINET SA 1.938 46,309,331 13 2,098,699 71 Ramnicu Valcea, VALCEA
8 TRANSILANA SA 1.938 26,606,051 19 52,541 167 Ghimbav, BRASOV
9 COATS ODORHEI SRL 1.925 134,480,934 4 6,860,252 448Odorheiu-Secuiesc,
HARGHITA
10 INDUSTRIA FILATI BUZAU SRL 1.925 93,890,803 7 2,519,063 392 Buzau, BUZAU
11 IASITEX SA 1.925 65,834,003 9 261,660 362 Iasi, IASI
12 MARTELLI EUROPE SRL 1.925 55,225,449 12 7,922,826 639 Buzau, BUZAU
13 TEXTOR DISTRIBUTIE SA 1.888 26,580,119 20 1,290,062 105 Targu Mures, MURES
14 ITALTEXTIL SARATA SRL 1.875 146,365,120 3 1,356,102 374 Sarata, BISTRITA-NASAUD
15 TE-ROX PROD SRL 1.875 86,822,477 8 911,674 271 Pascani, IASI
16 SUN GARDEN ROMANIA SRL 1.875 55,370,304 11 581,214 829 Sat Pucioasa, DAMBOVITA
17 SILVANIA WORSTED SPINNING SRL 1.875 26,635,053 18 2,198,131 309 Simleu Silvaniei, SALAJ
18 COATS ROMANIA IMPEX SRL 1.838 40,371,340 15 4,903,105 57 Bucuresti, Sector 6
19 YARNEA SRL 1.825 159,759,425 2 5,852,338 434 Savinesti, NEAMT
20 CARREMAN ROMANIA SRL 1.825 129,688,829 5 3,354,762 421 Botosani, BOTOSANI
RETAIL TRADE OF CLOTHING IN SPECIALISED STORESRANK COMPANY NAME MCR SCORING ANNUAL TURNOVER
( 2011 RON)TURNOVER
RANKINGPROFIT/LOSS
(2011 RON)NO OF
EMPLOYEES CONTACT
1 ZARA BUCURESTI SRL 2.725 262,871,579 1 44,040,102 491 Bucuresti, Sector 3
2 PEEK & CLOPPENBURG SRL 2.238 71,925,189 8 11,203,464 53 Bucuresti , Sector 1
3 RENANIA TRADE SRL 2.088 94,476,260 4 13,957,184 89 Targu Mures, MURES
4 ROUMASPORT SRL 1.975 144,087,186 2 951,049 262 Bucuresti, Sector 6
5 M - FASHION COM SRL 1.925 61,663,697 10 2,977,545 310 Otopeni, ILFOV
6 PULL & BEAR RO SRL 1.838 69,394,397 9 11,283,055 109 Bucuresti, Sector 3
7 BERSHKA CARPATI SRL 1.788 76,608,716 7 3,756,720 137 Bucuresti,
8 EMPORIO COM SRL 1.788 36,902,451 15 377,338 119 Constanta, CONSTANTA
9 HIGH FASHION CONCEPT SRL 1.700 23,977,148 22 99,952 27 Bucuresti , Sector 1
10 STRADIVARIUS RO SRL 1.688 41,815,468 13 4,658,004 79 Bucuresti, Sector 3
11 PEERAJ BRANDS INTERNATIONAL SRL 1.688 25,502,551 18 3,714,314 143 Bucuresti, Sector 2
12 MASSIMO DUTTI RO SRL 1.650 43,621,315 12 12,991,149 46 Bucuresti, Sector 3
13 TAKKO FASHION INTERNATIONAL SRL 1.575 103,478,625 3 -8,345,510 335 Bucuresti, Sector 1
14 SONYA MOD SA 1.575 26,841,455 16 -1,652,380 356 Bucuresti, BUCURESTI
15 NYER ROMANIA SRL 1.538 83,145,828 5 571,626 172 Cluj-Napoca, CLUJ
16 KENVELO ROMANIA SRL 1.525 81,739,445 6 -4,414,465 350 Bucuresti, Sector 6
17 SPRIDER STORES SRL 1.488 25,218,049 20 -10,767,388 170 Bucuresti, BUCURESTI
18 SOLMAR TRADING GRUP SRL 1.438 39,708,856 14 290,614 175 Bucuresti, Sector 1
19 PUMA SPORTS ROMANIA SRL 1.400 25,433,770 19 -5,870,381 25 Voluntari, ILFOV
20 HERVIS SPORTS AND FASHION SRL 1.388 60,562,141 11 -5,459,083 169 Voluntari, ILFOV
21 MIROGLIO ROMANIA SRL 1.338 26,224,695 17 -3,913,564 112 Bucuresti, Sector 1
22 MARKS & SPENCER MARINOPOULOS ROMANIA SA
1.288 24,107,143 21 -11,814,336 55 Bucuresti, Sector 1
1412012 EDITION Major Companies in Romania

MANUFACTURE OF FOOTWEAR AND LEATHER GOODSRANK COMPANY NAME MCR SCORING ANNUAL TURNOVER
( 2011 RON)TURNOVER
RANKINGPROFIT/LOSS
(2011 RON)NO OF
EMPLOYEES CONTACT
1 ARA SHOES ROMANIA SRL 3.063 220,667,632 2 7,114,881 1,548Valea Lui Mihai,
BIHOR
2 RIEKER ROMANIA SRL 2.488 337,861,521 1 3,864,433 169 Lugoj, TIMIS
3 REKORD SRL 2.375 102,048,080 5 6,522,836 481 Alba Iulia, ALBA
4 CLASS SHOE SRL 2.188 58,811,136 12 5,610,338 192 Cluj-Napoca, CLUJ
5 CFS-COMPONENTS FOR SHOES SRL 2.188 37,633,792 19 2,772,151 157 Ghisoda, TIMIS
6 MUSETTE EXIM SRL 2.175 33,048,794 24 4,650,070 251 Bucuresti, Sector 4
7 ALPINA SHOE PRODUCTION SRL 2.125 53,605,974 14 708,609 458 Reghin, MURES
8 COSTE SHOES SRL 2.088 119,623,710 4 4,509,611 71 Arad, ARAD
9 BELLARMA SRL 2.088 59,973,928 10 2,912,636 180 Sibiu, SIBIU
10 SIR SAFETY SRL 2.075 36,351,483 20 1,203,963 434 Bacau, BACAU
11 TRICOSTAR SRL 2.025 44,260,961 16 2,708,683 748 Oradea, BIHOR
12 GLOBAL FASHION SRL 2.025 35,996,600 21 207,129 269 Sibiu, SIBIU
13 SOMAREST SRL 1.975 80,747,433 7 6,641,449 793 Cisnadie , SIBIU
14 RO ALTO GRADIMENTO SRL 1.825 41,927,533 18 854,957 569 Timisoara, TIMIS
15 RAFFAELLO SHOES FACTORY SRL 1.775 80,627,804 8 339,108 712 Bucuresti, Sector 4
16 PROGRESS SA 1.738 33,222,369 23 368,184 154 Brasov, BRASOV
17 REROPAM SRL 1.725 75,343,598 9 1,531,277 252 Bors, BIHOR
18 ROMIPEL SRL 1.650 59,779,322 11 4,893,622 35 Sibiu, SIBIU
19 LLOYD SHOES ROMANIA SRL 1.625 146,964,251 3 6,914,154 624Valea Lui Mihai,
BIHOR
20 BIHORE SRL 1.625 92,147,809 6 985,195 625 Oradea, BIHOR
21 DTR DRAXLMAIER SISTEME TEHNICE ROMANIA SRL
1.625 50,891,352 15 2,059,105 625 Codlea, BRASOV
22CALZATURIFICIO SKANDIA SA SAN BIAGIO DI CALLALTA TREVISO-ITALIA SUCURSALA BRASOV-ROMANIA
1.600 57,671,552 13 2,564,245 0 Brasov, BRASOV
23 STAR INTERNATIONAL SRL 1.500 42,073,816 17 -2,146,950 38 Bucuresti, Sector 6
24 KROMO PIELMO COM SRL 1.288 35,051,675 22 -281,292 164 Topliceni, BUZAU
RETAIL TRADE OF FOOTWEAR AND LEATHER GOODSRANK COMPANY NAME MCR SCORING ANNUAL TURNOVER
( 2011 RON)TURNOVER
RANKINGPROFIT/LOSS
(2011 RON)NO OF
EMPLOYEES CONTACT
1 LEONARDO SRL * 2.313 251,342,774 1 -26,830,032 1,690 Oradea, BIHOR
2 BENVENUTI SRL 2.188 55,559,053 7 927,681 228 Oradea, BIHOR
3 OTTER - DISTRIBUTION SRL 2.038 69,708,737 6 5,963,041 203 Chiajna, ILFOV
4 E-QUATION SRL 1.950 199,276,625 2 1,893,817 1 Sebes, ALBA
5 ELMEC ROMANIA SRL 1.775 129,595,856 4 -21,320,778 560 Bucuresti, Sector 5
6 ADIDAS ROMANIA SRL 1.688 82,270,130 5 621,765 153 Bucuresti, Sector 1
7 DEICHMANN COMERCIALIZARE INCALTAMINTE SRL
1.338 136,476,318 3 -2,406,082 211 Bucuresti, Sector 1
8 LEATHER & SHOE SRL 1.338 36,821,329 8 -1,357,959 68 Sibiu, SIBIU
MCR TEXTILE & LEATHER


Agriculture GROWING AND TRADING AGRICULTURAL RAW MATERIALS GROWING AND TRADING FRUIT AND VEGETABLES FARMING AND MEAT PROCESSING
1452012 EDITION Major Companies in Romania
1.2million tons worth exports of sunflower from record production of 2 million tons in 2011
1.57 million tons worth exports of wheat in 2011, a 63 percent plunge y/y

The national under-regulation and the strict regulation at EU level are paradoxically both responsible for weak investments in Romania’s agriculture – which consequently lags behind potential. The lack of a predictable environment at home (plus atomised ownership inherited from the 90’s), added to the differential farming subsidies and discouraged foreign investors to pour their money in agriculture when their interest increased in the past decade.
Lack of capital and infrastructure left Romania’s farmers vulnerable to the natural, unpredictable drivers – as it happened in the last 2011-12 marketing year and might happen again in 2012-13 if the weather remains adverse. On the upside, strong global demand generates broadly favourable circumstances for the sector as the prices are still high.
CHANGE OF PARADIGM: FEEDING PEOPLE VS. GENERATING VALUERomania could feed up to 80mn people, experts conclude from time to time. It is often evoked the “golden age” when the large fields provided the country with a competitive advantage at European level in the context of extensive farming at the beginning of last century. However, today’s farming is quite a different business. Indeed, hypothetically country’s natural resources could produce more food than its population needs.
Problem is that country’s agriculture should not effectively feed as many people as possible – but to optimise the utilisation of natural resources and generate as much as possible value. While the former paradigm is more of political nature, of the same nature of “food security”, the latter is what is generally defined as a well-posed problem. People-feeding
paradigm is not a well-posed problem for many reasons. But it is followed by so many at microeconomic level that a shift in paradigm is unlikely to happen until the families actually feeding themselves from one-to-two ha plot of land effectively disappear: by either extinction, or migration to more developed European areas where their labour is better valued so they prefer trading it than using the plot of land back home.
FOREIGN TRADE: TRADING INPUTS FOR PROCESSED FOODThe foreign trade statistics for 2011 for the food sector shows one interesting fact: while “other” items account for 29% of exports, its share in imports is 54%. It means that while the exports is relatively dominated by several key [basic] items like maize and other grains, Romania imports a bit of everything. Local food producers hardly face the competition of foreign producers that have benefitted for decades of abundant subsidies extended by the EU under the Common Agricultural Policy.
The sunflower seeds exports increased markedly, doubling in volume to nearly 1.2mn tonnes in 2011, according to the government’s foreign trade agency. . The imports were 0.24mn tonnes and indeed the net exports were slightly below 1mn tonnes – but this is still notable. The high records were supported by the record sunflower crop of nearly 2mn tonnes.
The domestic crop increased more precisely by 0.6mn tonnes to 1.86mn tonnes in 2011. The whole supplementary production went to export. The effects of record sunflower crop last year was enhanced by certain increase in the average FOB export maize price to EUR 434 per ton – in 2011 against EUR 391 per ton in 2010.
The wheat exports on the opposite plunged in volume terms by 63% y/y to 1.57mn tonnes. On base effects after the record crop harvested the year before. Hopefully, the average wheat FOB export price increased from EUR 154 per ton in 2010 to EUR 200 per ton in 2011.
MCR AGRICULTURE
ROMANIA’Sethernal and fascinating promise
Iulian Ernst, Freelance Analyst
2011-12: SOUND 2011 CROPS FUEL COUNTRY’S ECONOMY Average Wheat Prices (USD per ton)

147
Major Companies in Romania 2012 EDITION Major Companies in Romania
The rise in imports was more moderated in 2011, only 12.5% y/y against 26.9% y/y rise of the exports. Romania imported mainly sugar and pork. The imports of sunflower surprisingly increased surprisingly in spite of the record crop. Imports of soy groats remain very high, as well as the imports of animal feed-like, prepared, as the cultivation of GM soy is still banned in the country.
2011-12: SOUND 2011 CROPS FUEL COUNTRY’S ECONOMYRomania’s vegetal crop, but also the animal produce, must have decreased in 2012 because of the dry weather one year earlier and because of the farmers’ difficult financial conditions.
Maize crop drops by some 60% to 4.7mn tonnes in 2012, according to estimates of the agriculture ministry dated late September. The country was the second largest European maize producer last year with 11.6mn tonnes harvested from 2.6mn ha. In 2012, farmers increased their exposure to maize to 2.8mn ha after the rapeseed crop was severely damaged by the adverse weather.
Romania’s potential for maize exports have diminished dramatically this year [2012-13], but the actual exports will finally depend on the distribution of the crop between large farms [more inclined to put on the market their crops] and small-sized farms that use predominantly the output for own consumption.
Wheat crop has decreased 32.7% to 4.78mn tonnes this year. Country’s wheat exports will decrease to 1.3mn tonnes in the 2012-2013 marketing year from 2mn tonnes a year earlier, the country’s agriculture minister Daniel Constantin was quoted as saying. Yet, the wheat quality is very good, with 100% of it qualifying as milling wheat, Constantin stressed.
Sunflower crop is 1.3mn tonners, down from 1.87mn tonnes last year, EU official projections show. Nonetheless, the line ministry announced that even at 1.5 tonnes per ha, the 0.65-0.7mn ha cultivates will yield enough sunflower to cover domestic demand.
INVESTORS GAIN INTEREST IN ROMANIA’S MEAT INDUSTRYThe US Smithfield was the sole Romanian pork producer that received license to export fresh and processed pork from Romania to EU after January 1, when the Union lifted the ban on Romanian pork. The US company, which operates a large-sized farm in Western Romania, plans to export to EU and Asian countries.
Out of the 12 farms applying for the permit, only two qualified and Marex [the other one] gave up export plans meanwhile.
The pork imports decreased significantly from nearly 250 thousand tonnes in 2008 to less than 160 thousand tonnes in 2011 – while the domestic pork production [weight in carcass] stagnated around 455 thousand tonnes.
Investors’ interest in Romania’s meat industry is witnessed by HKD Industries putting EUR 10mn into the takeover of Romanian meat processor Integra – a company that delivers its output mainly on the local market. Some 70% of the meat processed by Integra is of local origin, while the rest is imported from EU countries. The EUR 10mn include the cash injection as well as the service of Integra’s debt – in addition to the price paid for the 100% share to local owners.

The agricultural trading market in Romania is fairly competitive, operated by almost all the large groups active in this segment. Yet, it didn’t reach the maturity, neither as business models nor as stability and predictability. The local agricultural trading states a similar level or even a superior one compared with the other neighboring countries, due to its main logistics features: the Black Sea’s port at Constanta and the riverine positioning of the Southern part of the country on the Danube.
CHALLENGED FROM WITHIN The state of Romanian agriculture is rather unpredictable and even if the latest production volumes, especially the corn harvests have been significantly reduced by the dry weather, this industry triggers a lot of attention on a larger economic scale. The agriculture, as a strategic field of Romanian economy should benefit from a more coherent operational strategy and the development of a countrywide irrigation network should be a priority for investments. The country has the advantage of large agriculture areas and high quality of soil but the natural benefits sustained also by a national strategy could convey an enviable position of Romania among the worldwide agricultural industries.
The global economy turmoil affected every industry but, agriculture is a segment in economy that addresses the basic feeding needs of a population, hence, it cannot cease from existing.
I think that Romanian farmers could face better the harsh conditions delivered by the weather or the lack of subsidies and poor agricultural infrastructure if they found support. However, those who have understood to run a proper business in agriculture are now harvesting the results.
The performance obtained by Romanian farmers due to a national irrigation system could weight against the large differences regarding the subsidies granted for the agriculture industry in Romania, compared with other EU countries. Also, a coherent strategy in agriculture might significantly reduce the risks in this segment.
THE PRICE GAME The price of grains saw a significant increase in the last years and especially this year due to the dry weather and its effects on the autumn harvest. The prices increased not only locally but worldwide. If 2013 will benefit from normal weather conditions, the prices of grains could see a certain decline but not a significant one. Hence, the profitability in this segment will go on attracting investors as it delivers promising businesses and it will significantly impact the national economy.
The fortunate natural setting of Romania within the Black Sea’s coastal region and the Constanta harbor, one of the most dynamic logistic hubs in
MCR Opinion
Traders face unpredictable weatherANGELO NICOLAE,
General Manager, Agri Business at Brise Group Constanta
Europe, offers significant potential for exports. Overall, the goods delivered by sea targets the Middle East markets while the cargos which are being delivered by Danube or leaving from the Western part of Romania are exported on EU large markets as Italy, Austria, or Germany. Of course, the demand comes also from the local market, due to the large processors and consumers but, overall, Romania is a country with a large potential for exports in agriculture.
As for the challenges of this year, 2012 has been in deed a challenge for any trader on this market, no matter its size. I think that whoever managed to maintain a profitable business or at least tried to survive this year, will be ready to face future challenges in this segment. However, the unpredictability factor in agricultural trading is the highest challenge of all.
“2012 HAS BEEN A CHALLENGE FOR ANY SMALL OR BIG TRADER OPERATING IN ROMANIAN AGRICULTURAL MARKET.”

149
Major Companies in Romania 2012 EDITION Major Companies in Romania
GROWING AND TRADING AGRICULTURAL RAW MATERIALSRANK COMPANY NAME MCR SCORING ANNUAL TURNOVER
( 2011 RON)TURNOVER
RANKINGPROFIT/LOSS
(2011 RON)NO OF
EMPLOYEES CONTACT
1 INTERAGRO SA 3.875 2,741,108,028 2 162,792,694 257 Bucuresti, Sector 2
2 AGRO-CHIRNOGI SA 3.575 1,124,597,971 4 20,812,621 574Chirnogi,
CALARASI
3 CARGILL AGRICULTURA SRL 3.338 2,897,665,343 1 31,583,472 249 Bucuresti, Sector 1
4 ALFRED C TOEPFER INTERNATIONAL (ROMANIA) SRL
3.188 1,848,711,705 3 -17,460,690 138 Bucuresti, Sector 2
5 BRISEGROUP SRL 2.838 544,497,306 7 12,813,660 128Constanta,
CONSTANTA
6 AMEROPA GRAINS SA 2.838 483,949,128 8 11,351,261 200Constanta,
CONSTANTA
7 POPASUL TREBES SRL 2.800 233,903,759 19 13,234,054 31 Margineni, BACAU
8 TCE 3 BRAZI SRL 2.775 402,400,692 9 49,741,849 912Piatra Neamt,
NEAMT
9 GRANI COMERT SRL 2.750 374,804,985 11 7,656,500 49Constanta, CON-
STANTA
10 MARIA CEREALE SRL 2.700 316,630,800 14 5,619,256 14Constanta,
CONSTANTA
11 ROREX TRADER SRL 2.700 205,400,638 21 832,152 10Constanta,
CONSTANTA
12 ROMSPEED SRL 2.650 276,478,458 17 668,976 8Constanta,
CONSTANTA
13 ROMSILOZ CEREALE SRL 2.600 297,149,260 15 13,105,972 45 Bucuresti, Sector 1
14 AGRICOVER SA 2.575 640,188,662 5 2,351,989 451 Buzau, BUZAU
15 TOTALAGRO SA 2.450 209,576,565 20 694,605 33Posta Calnau,
BUZAU
16 INTERAGRO SRL 2.425 608,128,611 6 459,977 884Zimnicea,
TELEORMAN
17 COMCEREAL SA 2.325 187,004,012 24 6,061,306 501 Vaslui, VASLUI
18 BARTER TRADING ROMANIA SRL 2.288 386,507,424 10 145,781 77Agigea,
CONSTANTA
19 CEREALCOM DOLJ SA 2.288 346,567,101 12 526,398 213 Segarcea, DOLJ
20 INTERSNACK ROMANIA SRL 2.275 248,582,527 18 -8,243,566 460 Bucuresti, Sector 3
21 MONSANTO ROMANIA SRL 2.188 288,577,232 16 -31,706,571 107 Bucuresti, Sector 2
22 NIDERA ROMANIA SRL 2.000 323,679,543 13 -19,770,426 19 Bucuresti, Sector 1
23 GLENCORE PROTEIN ROMANIA SRL 2.000 196,182,861 23 3,139,657 16 Bucuresti, Sector 1
24 PIONEER HI-BRED ROMANIA SRL 2.000 167,779,717 27 5,204,998 18 Sindrilita, ILFOV
25 PIONEER HI - BRED SEEDS AGRO SRL 1.988 136,821,412 32 10,728,407 117 Sindrilita, ILFOV
26 RODBUN GRUP SRL 1.988 100,030,353 38 5,395,670 116 Bucuresti, Sector 6
27 AGROGLOBAL SA 1.950 198,399,718 22 928,468 20 Buzau, BUZAU
28 INTERCEREAL SA 1.938 143,831,151 31 21,500,744 213 Movila, IALOMITA
29 AGROIND CAUACEU SA 1.938 129,508,176 35 7,041,071 67 Oradea, BIHOR
30 COMCEREAL SA 1.938 100,250,519 37 6,910,783 224 Focsani, VRANCEA
31 PROMAT COMIMPEX SRL 1.850 130,858,626 34 11,252,227 29Tasnad, SATU
MARE
32 AGRIGROS SRL 1.800 114,675,482 36 2,430,833 15 Timisoara, TIMIS
33 ATIFCO INTERNATIONAL SA 1.738 164,069,569 29 1,620,399 156 Bucuresti, Sector 6
34 CEREALCOM SA 1.688 167,030,490 28 143,900 142 Braila, BRAILA
35 ARDEALUL TRADING SRL 1.688 150,009,152 30 2,514,385 115 Carei, SATU MARE
36 CARCO HOLDING SRL 1.600 132,731,618 33 1,058,374 11Constanta,
CONSTANTA
37 SOUFFLET MALT ROMANIA 1.550 168,213,178 26 -4,676,298 26 Buzau, BUZAU
38 PROVIMI ROMANIA SRL 1.338 182,142,951 25 -15,344,623 140 Craiova, DOLJ
39 KWS SEMINTE SRL 1.288 91,673,720 39 -6,516,082 90 Bucuresti, Sector 2

GROWING AND TRADING FRUIT AND VEGETABLESRANK COMPANY NAME MCR SCORING ANNUAL TURNOVER
( 2011 RON)TURNOVER
RANKINGPROFIT/LOSS
(2011 RON)NO OF
EMPLOYEES CONTACT
1 CONTEC FOODS SRL 2.175 75,023,439 7 7,440,021 436 Tecuci, GALATI
2 ALFREDO FRESH SRL 2.138 104,327,777 5 1,998,316 98 Afumati, ILFOV
3 AKPAROM SRL 2.050 100,961,199 6 3,162,612 9 Chiajna, ILFOV
4 TOTAL PRODUCE BUCHAREST SRL 1.950 43,779,969 18 677,480 1 Afumati, ILFOV
5 SMT FRUCT SRL 1.900 126,852,040 3 291,441 2 Chiajna, ILFOV
6 ENB SRL 1.888 70,086,927 9 575,574 66Constanta,
CONSTANTA
7 LUCO FRUCHT MARKETING SRL 1.850 63,077,771 13 2,526,074 26Stefanestii de Jos,
ILFOV
8 FLIPPER COMIMPEX SRL 1.838 105,753,089 4 272,489 201 Tunari, ILFOV
9 BELLA INTERNATIONAL SRL 1.800 63,939,653 12 1,739,995 28 Oradea, BIHOR
10 FRESH PLAZA SRL 1.750 188,081,029 1 692,379 36Stefanestii de Jos,
ILFOV
11 INTERFRUCT SRL 1.738 64,517,059 11 413,936 94 Afumati, ILFOV
12 LUCIDIUS SRL 1.700 47,205,639 17 354,767 28Bucuresti,
BUCURESTI
13 LEOSER SA 1.675 47,519,056 16 245,238 262Popesti - Leordeni,
ILFOV
14 SEMT INTERNATIONAL FRUCT SA 1.500 57,870,322 14 145,754 5 Chiajna, ILFOV
15 DOLE ROMANIA SRL 1.500 39,416,379 19 -18,325,522 30 Bucuresti, Sector 1
16 ORLANDO IMPORT - EXPORT 2001 SRL 1.488 50,327,688 15 302,335 94 Clinceni, ILFOV
17 HORTIFRUCT SRL 1.475 163,840,604 2 163,377 300 Bucuresti, Sector 4
18 ROXI FRUCT COM SRL 1.400 38,745,625 20 -296,196 14 Afumati, ILFOV
19 AGRICANTUS SRL 1.388 70,608,564 8 -862,008 59 Buftea, ILFOV
20 DOMINO TRADING SRL 1.388 66,218,484 10 -3,276,780 76 Afumati, ILFOV
MCR AGRICULTURE

FARMING AND MEAT PROCESSINGRANK COMPANY NAME MCR SCORING ANNUAL TURNOVER
( 2011 RON)TURNOVER
RANKINGPROFIT/LOSS
(2011 RON)NO OF
EMPLOYEES CONTACT
1 AVICOLA CREVEDIA SA 2.925 395,973,057 5 2,256,188 428Crevedia, DAMBO-
VITA
2 UNICARM SRL 2.763 635,301,465 1 13,781,420 2,688 Vetis, SATU MARE
3 TRANSAVIA SA 2.675 357,681,199 7 26,299,438 913 Oiejdea, ALBA
4 AGRISOL INTERNATIONAL RO SRL 2.675 231,060,622 13 8,441,745 953Boldesti-Scaeni,
PRAHOVA
5 CRISTIM 2 PRODCOM SRL 2.625 289,090,147 11 2,979,569 734 Bucuresti SECTOR 1
6 RECUNOSTINTA PRODCOM IMPEX SRL 2.575 227,983,546 14 7,736,300 785Filipestii de Padure,
PRAHOVA
7 ELIT SRL 2.563 355,471,527 8 13,884,870 1258 Cugir, ALBA
8 MAREX SA 2.525 398,187,149 4 3,546,829 371 Braila, BRAILA
9 DIANA SRL 2.525 232,632,287 12 1,285,435 557Ramnicu-Valcea,
VALCEA
10 AGRICOLA INTERNATIONAL SA 2.463 332,841,739 9 4,090,384 1,805 Bacau, BACAU
11 ALDIS SRL 2.463 329,845,455 10 -9,374,090 1,391 Calarasi, CALARASI
12 VEGETAL TRADING SRL 2.450 372,982,639 6 13,448,456 20 Braila, BRAILA
13 SAFIR SRL 2.425 91,746,073 36 2,923,190 254 Vaslui, VASLUI
14 SMITHFIELD PROD SRL 2.375 572,703,369 2 -17,153,428 593 Timisoara, TIMIS
15 SMITHFIELD FERME SRL 2.313 551,803,463 3 6,639,474 1,048 Timisoara, TIMIS
16 AGROALIM DISTRIBUTION S.R.L. 2.275 214,006,504 16 -13,229,272 376 Bucuresti SECTOR 6
17 SERGIANA PRODIMPEX SRL 2.275 90,471,377 37 3,095,788 438Poiana Marului,
BRASOV
18 AVICOLA BUZAU SA 2.225 94,375,282 34 1,815,149 372 Buzau, BUZAU
19 VIS AGRI SRL 2.138 125,146,607 23 12,508,843 120Com Glodeanu
Silistea, BUZAU
20 CAROLI FOODS GROUP SRL 2.125 218,510,899 15 -888,427 821 Pitesti, ARGES
21 FOX COM SERV SRL 2.075 116,447,424 26 4,391,375 304 Bucuresti, Sector 4
22 NUTRICOM SA 2.025 164,585,238 20 3,668,303 431 Oltenita, CALARASI
23 MARIA TRADING SRL 2.025 145,930,702 22 4,039,797 264Constanta, CON-
STANTA
24 AVICOLA BRASOV SA 1.975 105,702,863 31 617,935 480 Brasov, BRASOV
25 NUTRIENTUL SA 1.938 171,177,839 19 1,214,049 158 Palota, BIHOR
26 INTERAGROALIMENT SRL 1.838 80,616,889 38 1,835,022 201 BACAU
27 AVICOLA FOCSANI SA 1.825 123,066,698 24 770,380 471 Focsani, VRANCEA
28 CARMOLIMP SRL 1.825 91,775,055 35 687,081 324 Ucea de Jos, BRASOV
29 CARNIPROD SRL 1.825 77,817,738 39 8,747,871 431 Tulcea, TULCEA
30 ROM TRADING COMPANY SRL 1.825 76,161,260 40 2,033,444 291 Podu Iloaiei, IASI
31 AVICOLA MIHAILESTI SRL 1.788 198,416,888 17 1,170,892 179Draganescu,
GIURGIU
32 SCANDIA FOOD SRL 1.775 164,517,002 21 2,913,421 358 Sibiu, SIBIU
33 AVICARVIL SRL 1.775 121,587,413 25 5,799,997 616 Francesti, VALCEA
34 GALLI GALLO SRL 1.775 112,757,402 29 587,902 273 Codlea, BRASOV
35 MEDA PROD 98 SA 1.775 102,082,463 33 534,060 462 Bucuresti, Sector 3
36 AGRIMON SRL 1.738 75,153,608 41 47,452 178 Oprisenesti, BRAILA
37 ANGST RO SRL 1.725 186,333,586 18 11,773 692 Buftea, ILFOV
38 FERMA ZOOTEHNICA SRL 1.725 104,063,191 32 249,832 279Baia Mare,
MARAMURES
39 C+C SA 1.700 113,085,226 28 133,595 0Resita,
CARAS-SEVERIN
40 AVE IMPEX SRL 1.675 116,048,412 27 234,477 498Satu Mare,
SATU MARE
41 AVICOLA CALARASI SA 1.675 109,081,963 30 -3,237,573 467 Calarasi, CALARASI
151
Major Companies in Romania 2012 EDITION Major Companies in Romania


FMCG PROCESSING OF TEA AND COFFEE MANUFACTURE OF COCOA, CHOCOLATE AND CONFECTIONERY MANUFACTURE OF SUGAR MANUFACTURE OF CONDIMENTS AND SEASONINGS MANUFACTURE OF VEGETABLE AND ANIMAL OILS AND FATS MANUFACTURE OF DAIRY PRODUCTS MANUFACTURE OF GRAIN MILL PRODUCTS AND STARCHES MANUFACTURE OF WINE FROM GRAPE MANUFACTURE OF BEER MANUFACTURE OF SOFT DRINKS; PRODUCTION OF MINERAL WATERS AND
OTHER BOTTLED WATERS DISTILLING, RECTIFYING AND BLENDING OF SPIRITS MANUFACTURE OF TOBACCO PRODUCTS HOME AND PERSONAL CARE
1532012 EDITION Major Companies in Romania
2.3kg per capita is the annual coffee consumption in Romania, placing the country on the 49th place in a global ranking

Confronted with the financial crisis, consumers are now shopping in a more tempered and cost-effective way, they have reduced the value of the daily shopping basket and have given up on buying things they don’t really need. Otherwise put, the buying decision has become more and more a rational one, the quantity of products is now smaller and the price and offers are key factors in the decision to buy a product; consumers’ budgets have shifted mainly towards basic food supplies.
How did the market react?
A sector analysis by market research company Nielsen puts the 2011 fast moving consumer goods market slightly below the volumes it registered in 2010, however, in absolute value, the FMCG market has grown to some extent, testifying to an increase in prices in 2011.
The Nielsen study shows that the sectors most hit by the financial and economic crisis were the food one (a decrease of over five per cent in volume) and the juice one (minus six per cent in overall sales). Speaking about non-food products, it seems that heavy water treatment, home care products, electric toothbrushes and bleachers have witnessed the steepest decline in 2011, according to the Nielsen study.
Regardless of the field of activity (be them producers, retailers or distributors), all major market players bet on further development in 2012, as opportunities still exists when it comes to finding cheaper locations or better selling points. Large expansion projects go hand in hand with emphasizing brand value and in-store advertising, as well as strengthening existing relations with traditional partners.
For example, beer consumption went up four per cent in the first half of this year as compared to the similar period in 2011, according to the Romanian Brewers Association. Romanians drank 8.3 million hectoliters in the first six months of 2012, the volume of sales registered between January and June 2012 by the Association’s members – Bergenbier, Heineken Romania, Romaqua Group, Ursus Breweries and United Romanian Breweries – also registering an uptrend, reaching 7.8 million hectoliters, up 5.4 per cent over the year-ago period. The association says, at present, 98.4 per cent of all
beer consumed in Romania is produced locally, with the beer market witnessing the lowest level of imports in the food industry.
Still, the beer market was severely hit by the economic crisis, which in turn induced a major decline in the Romanians’ purchasing power. The Brewers Association says the cumulated decrease of the market in 2009 and 2010 stood at 16 per cent, followed by a short stable setting in 2011 which was, unfortunately, canceled in the first three months of 2012, when the decline started again.
The decrease in beer consumption in the past four years had major negative social implications, as, in just three years, jobs in the sectors at a national level were cut by 21 per cent, says the Association. Based on the latest census data, the Romanian beer consumption per capita stood at 89 liters in 2011.
An indirect but positive influence seems to come from the fierce competition in modern retail, which is actively looking to attract new consumers through the best offers and price promotions. Almost all major European players are active in Romania, and the ratio of the modern sales channel in the overall sales mix is becoming a more and more important partner for FMCG producers, be them food or non-food ones.
Market analysts hint towards viewing the current moment in Romania not as a crisis, but as a different context. The crisis is, in fact, a general framework dominated by volatility, with small increases immediately replaced by small decreases. Most talk about a consumption crisis no one knows when it’ll come to an end, hence the need to find ways to counteract it. FMCG players need to identify the market’s strong points, look for opportunities given by this context and find a way to exploit them at full impact and be prudent, as well as thinking on the long term
Along these lines, rethinking communication strategies based on consumer behavior might be the way out.
At the end of 2011, official economic predictions were positive for 2012; however, the deepening of the EU crisis has brought new reasons of concern for Romania. Not to mention the
MCR FMCG
How fast are consumer goods moving?
Corina Mica - Freelance Journalist

155
political debacle the country has seen this summer and the increased European Commission scrutiny with regards to the rule of law in this country…
In this context, what were the main consumer trends in 2012?
The focus on budgeting continued to deepen, buoyed by the ability of consumers to easier monitor outgoings – from spending on grocery shopping to household energy usage – in real time. Recession had a strong impact on the consumers’ budgets and lifestyle. Faced with the reduction of personal income and increasing price rates, they learned to cut out spending on goods considered unessential or they delayed major purchases like cars, houses and electronics. They became smarter shoppers looking for the best prices, comparing between products alternatives, searching for more information before any purchase and finally, reducing quantity and frequency of consumption, resulting in a negative effect on loyalty towards brands, products or service providers.
The consumer market seemed to be mainly driven by the aging of population. In the near future, there are likely to be more people with a traditional mindset, placing high stability on life, respecting rules and conventions, resistant to anything new and innovative or longing for the past. According to one of the latest Euromonitor predictions, it is expected that all age groups below 43 will see a decline in numbers in the next years. The steepest decline, in both percentage terms and actual numbers, will be for those aged 20-35. The trends are driven by a combination of factors, and the variations in the natural rate of change are caused by the low birth rate, the ageing population and the emigration of young adults.
Given all these, FMCG players should think about approaching consumers through the “Me Branding” paradigm. It’s about being different and recognized by others, or showing off, also about being faithful to the personal style more than being trendy, about building one’s own personal brand in society (investing in personal image and striving for a better position in society), in the digital space (personal blogging and social networking sites). This will also be reflected in consumption – demand for products and experiences that are deemed to be authentic, those offerings that feel “really real” and different.
2012 EDITION Major Companies in Romania
MCR Opinion
Nowadays, CAUTION is what Romanian consumers have in mind as far as their spending habit is concerned and what companies guide their actions by. Spending intentions have declined across all sectors and it is more crucial than ever that companies adjust to the current situation.
The Romanian coffee market has gradually decreased over the last years mainly owing to the consumers’ financial uncertainty. According to the World Research Institute, the annual coffee consumption in Romania is of 2,3 kg per capita, placing our country on the 49th place in a global ranking. In comparison, Finland comes first with over five times as much coffee drunk per capita, on an annual basis (12 kg).
Irrespective of the financial situation, Romanian coffee consumers have not resorted to down-trading, to switching their favourite coffee brand for a more economical one; generally, they would rather drink less coffee but at the same quality they are used to. Brand loyalty is something that defines the entire coffee market.
Another aspect relevant for the Romanian consumers is the kind of coffee they drink and the way they prefer to prepare it. The roast and ground coffee is by far the most sought after and they usually prepare it using the kettle. This kind of preparation brings out the most caffeine in coffee, although most people are tempted to
believe that the espresso holds that characteristic.
The fact that Romania is not an avid coffee drinking country, such as the northern European states, can be explained by its recent history. During the communist regime, coffee was hard to find, being handed out in rations. As a result, people would only enjoy a cup of coffee when guests would come to visit – coffee was seen as a luxury. Although times have changed and now coffee is easily accessible in a variety of blends, such perceptions are hard to shift.
In one way, coffee continues to be treated as a luxury. Although scheduled to be eliminated in 2010, after a gradual decrease as of 2007, the coffee excise duty is still applicable in our country. Romania is one of the few states to maintain this tax in the European Union, alongside Belgium, Latvia and Germany. Bulgaria eliminated it on entering the European Union. The coffee excise duty rate applicable in Romania varies between EUR 153 /tone and EUR 900/tone, depending on the type of coffee.
The existence of this tax brings about at least two issues: one is the growth of the black coffee market and the other, easier to measure, is the increased price consumers have to pay for their daily cup of coffee. The exchange rate at which all the taxes will be calculated in 2013 is of 4,5223 lei per euro, 5,1% higher than in 2011.
X-Raying the Romanian coffee marketMARIUS MELESTEU,
General Manager,Strauss Romania
Coffee producers have to cope with a series of realities having to do with coffee prices and the way they impact end-consumers. Being a commodity traded in the stock exchange, green coffee prices may vary on several grounds: poor or rich harvests, changes in climate, speculations, to name just a few. When green coffee prices are on the rise, local producers such as Strauss Romania have a very difficult task at hand: try not to transfer the entire financial burden to end consumers. How can we do that? By effectively managing all the operational costs but, at the same time, keeping an eye on the quality of our products.
“AT THE END OF THE DAY THE WINNERS WILL BE THE COMPANIES THAT WILL LOOK ABOUT OPERATIONAL EXCELLENCE, EXCEPTIONAL EXECUTION AND DEVELOP A PORTFOLIO OF POWERFULL BRANDS.”

PROCESSING OF TEA AND COFFEERANK COMPANY NAME MCR SCORING ANNUAL TURNOVER
( 2011 RON)TURNOVER
RANKINGPROFIT/LOSS
(2011 RON)NO OF
EMPLOYEES CONTACT
1 KRAFT FOODS ROMANIA SA 2.675 563,555,504 1 26,064,691 262 Ghimbav, BRASOV
2 STRAUSS ROMANIA SRL 2.025 212,401,106 2 -15,372,091 282 Bucuresti, Sector 3
3 PANFOODS ROMANIA SRL 1.938 50,954,363 8 4,531,213 67 Bucuresti, Sector 1
4 TCHIBO BRANDS SRL 1.900 58,485,996 7 1,100,621 38 Bucuresti, Sector 1
5 PRO SOFT SRL 1.888 93,652,073 6 2,629,640 137 Brasov, BRASOV
6 ALKA CO SRL 1.688 46,898,271 9 -9,533,491 234 Bucuresti, Sector 1
7 MERIDIAN CC SRL 1.588 94,847,857 5 92,323 91Orsova,
MEHEDINTI
8 CAFEA FORTUNA SRL 1.488 105,783,963 3 181,449 94Dragomiresti -
Deal, ILFOV
9 DUO SRL 1.488 98,028,392 4 -2,918,029 182Constanta, CON-
STANTA
MANUFACTURE OF CONDIMENTS AND SEASONINGSRANK COMPANY NAME MCR SCORING ANNUAL TURNOVER
( 2011 RON)TURNOVER
RANKINGPROFIT/LOSS
(2011 RON)NO OF
EMPLOYEES CONTACT
1 DR OETKER RO SRL 2.525 219,308,602 2 23,042,119 446Curtea de Arges,
ARGES
2 SOCIETATEA NATIONALA A SARII SA 2.363 250,210,387 1 1,363,946 1,936 Bucuresti, Sector 1
3 ION MOS SRL 2.038 83,178,716 4 9,082,812 157 Chiajna, ILFOV
4 ALEX & COMP SRL 1.938 62,360,964 5 1,019,011 242 Vanatori, GALATI
5 DOHLER ROMANIA SRL 1.850 33,052,403 7 2,454 25 Chiajna, ILFOV
6 COMPANIA INDIILOR ORIENTALE PROD SRL 1.838 31,551,779 8 2,086,055 109 Bucuresti, Sector 2
7 KAMIS - CONDIMENTE SRL 1.700 20,202,828 9 1,826,626 46 Bucuresti, Sector 6
8 PACOVIS ROMANIA SRL 1.700 15,325,539 10 494,257 28Targul Mures,
MURES
9 FUCHS CONDIMENTE RO SRL 1.688 56,421,713 6 2,202,165 223Curtea de Arges,
ARGES
10 SUPREMIA GRUP SRL 1.638 114,270,456 3 2,010,176 190 Alba Iulia, ALBA
11 KOTANYI CONDIMENTE SRL 1.600 4,819,761 11 198,271 11 Bucuresti, Sector 1
12 CONDIMENTE ROMANIA SRL 1.300 3,772,500 12 -245,942 13 Bucuresti, Sector 4
MANUFACTURE OF TOBACCO PRODUCTSRANK COMPANY NAME MCR SCORING ANNUAL TURNOVER
( 2011 RON)TURNOVER
RANKINGPROFIT/LOSS
(2011 RON)NO OF
EMPLOYEES CONTACT
1 BRITISH AMERICAN TOBACCO (ROMANIA) TRADING SRL
4.475 6,051,829,824 1 317,054,628 299 Bucuresti, Sector 1
2 JT INTERNATIONAL (ROMANIA) SRL 3.675 2,375,824,912 2 6,030,690 577 Bucuresti, Sector 2
3 PHILIP MORRIS TRADING SRL 3.625 2,362,448,641 3 14,966,343 270 Otopeni, ILFOV
4 JT INTERNATIONAL MANUFACTURING SA 3.175 1,979,436,255 4 -12,647,951 318 Bucuresti, Sector 2
5 LUZAN LOGISTIC SRL 2.538 230,165,760 6 1,696,090 66 Targu Jiu, GORJ
6 PAMIMAI DISTRIBUTION SRL 2.438 351,135,243 5 261,989 166 Bucuresti , Sector 1
7 SHARK GROUP SRL 2.100 181,286,815 7 233,032 21 Bucuresti, Sector 6
8 PHILIP MORRIS ROMANIA SRL 1.975 135,787,077 9 18,662,086 519 Otopeni, ILFOV
9 HTS HONGTA SERVICES SRL 1.700 127,716,486 10 -521,448 32 Bucuresti, Sector 2
10 BRITISH - AMERICAN TOBACCO ROMANIA INVESTMENT SRL
1.575 144,825,508 8 5,559,206 502 Ploiesti, PRAHOVA
157
2012 EDITION Major Companies in Romania

MANUFACTURE OF COCOA, CHOCOLATE AND CONFECTIONERYRANK COMPANY NAME MCR SCORING ANNUAL TURNOVER
( 2011 RON)TURNOVER
RANKINGPROFIT/LOSS
(2011 RON)NO OF
EMPLOYEES CONTACT
1 CHIPITA ROMANIA SRL 2.875 212,667,390 8 15,464,874 555 Clinceni, ILFOV
2 WRIGLEY ROMANIA SRL 2.688 213,525,542 7 30,201,909 196 Bucuresti, Sector 1
3 STAR FOODS EM SRL 2.625 322,565,844 4 1,347,558 867 Bucuresti, Sector 4
4 SECA DISTRIBUTION SRL 2.625 312,020,361 5 2,309,541 631 Ploiesti, PRAHOVA
5 INTERBRANDS MARKETING & DISTRIBUTION SA 2.613 575,287,107 2 1,205,208 1,951 Bucuresti, Sector 5
6 MERSEL COMPANY SRL 2.488 208,940,371 10 468,060 213 Afumati, ILFOV
7 LEKKERLAND CONVENIENCE DISTRIBUTIE SRL 2.438 210,035,820 9 420,742 115 Chiajna, ILFOV
8 NESTLE ROMANIA SRL 2.375 664,906,677 1 -9,294,735 875 Bucuresti, Sector 3
9 EUROPEAN FOOD SA 2.363 416,744,657 3 -91,088,189 1,525 Oradea, BIHOR
10 DOBROGEA GRUP SA 2.275 229,889,470 6 -3,983,303 845Constanta,
CONSTANTA
11 DE SILVA EXCLUSIV SRL 2.188 92,840,001 24 9,588,750 76 Bucuresti, Sector 1
12 OVERSEAS GROUP IMPEX SRL 2.088 121,115,344 17 2,122,180 98 Bucuresti, Sector 1
13 T&O PRODCOM SRL 2.088 117,705,987 18 2,746,149 145Hunedoara,
HUNEDOARA
14 LIDO GIRBEA SRL 2.088 79,928,170 30 11,095,845 233 Paulesti, PRAHOVA
15 TECSA BUSINESS SRL 2.075 66,273,198 35 1,045,538 529 Bucuresti, Sector 3
16 ELAN-TRIO SRL 2.025 151,425,381 13 2,076,188 458Odorheiul Secuiesc,
HARGHITA
17 TOP GEL PROD SRL 2.025 73,468,766 33 7,022,411 505 Carcea, DOLJ
18 BETTY ICE SRL 1.975 81,526,639 28 4,320,178 545 Suceava, SUCEAVA
19 RESCO SA 1.938 62,975,844 37 3,122,703 111 Arad, ARAD
20 FERRERO ROMANIA SRL 1.900 173,236,182 11 11,757,643 30 Bucuresti, Sector 1
21 MARS ROMANIA SRL 1.888 170,676,783 12 13,249,207 76 Bucuresti, Sector 2
22 ECUATOR SRL 1.888 125,717,415 15 1,430,275 178 Ipotesti, SUCEAVA
23 NARDO TRADING CO SRL 1.888 75,673,074 31 1,004,969 69 Bucuresti, Sector 5
24 FREE MARKET PRODCOM SRL 1.850 103,585,786 21 2,720,292 46 Bucuresti, Sector 1
25 SUPREME CHOCOLAT SRL 1.825 83,190,984 27 693,226 346 Bucuresti, Sector 4
26 NORDIC IMPORT EXPORT CO SRL 1.775 143,530,753 14 4,352,445 251 Bucuresti, Sector 3
27 DRIM DANIEL SRL 1.775 107,339,706 19 641,119 315 Maracineni, ARGES
28 PHOENIXY SRL 1.775 74,685,428 32 7,174,983 258 Baicoi, PRAHOVA
29 BOEMA SRL 1.738 90,782,410 25 491,932 247 Sibiu, SIBIU
30 CREAM LINE ROMANIA SA 1.688 67,345,972 34 -4,999,725 183Olteni, Comuna Clinceni, ILFOV
31 KANDIA DULCE SA 1.675 122,656,470 16 -3,814,949 428 Bucuresti, Sector 5
32 GENERAL PARMA FOOD SRL 1.638 92,868,504 23 17,344 101 Bucuresti, Sector 2
33 SAFF TRADING SRL 1.588 63,610,001 36 123,608 116 Carcea, DOLJ
34 HEIDI CHOCOLAT SA 1.575 61,411,965 38 -1,389,671 305 Pantelimon, ILFOV
35 DINAMICA IMPEX SRL 1.538 106,231,946 20 4,032,008 118 Bucuresti, Sector 1
36 ROMPAK SRL 1.488 93,663,848 22 15,574,616 210 Pascani, IASI
37 PET PRODEXIM SRL 1.450 59,182,075 39 1,634,473 44 Bucuresti, Sector 2
38 ALKA TRADING CO SRL 1.338 87,520,215 26 -4,984,728 221 Bucuresti, Sector 1
39 PURATOS PROD SRL 1.338 80,666,146 29 -864,842 150 Tunari, ILFOV
MCR FMCG
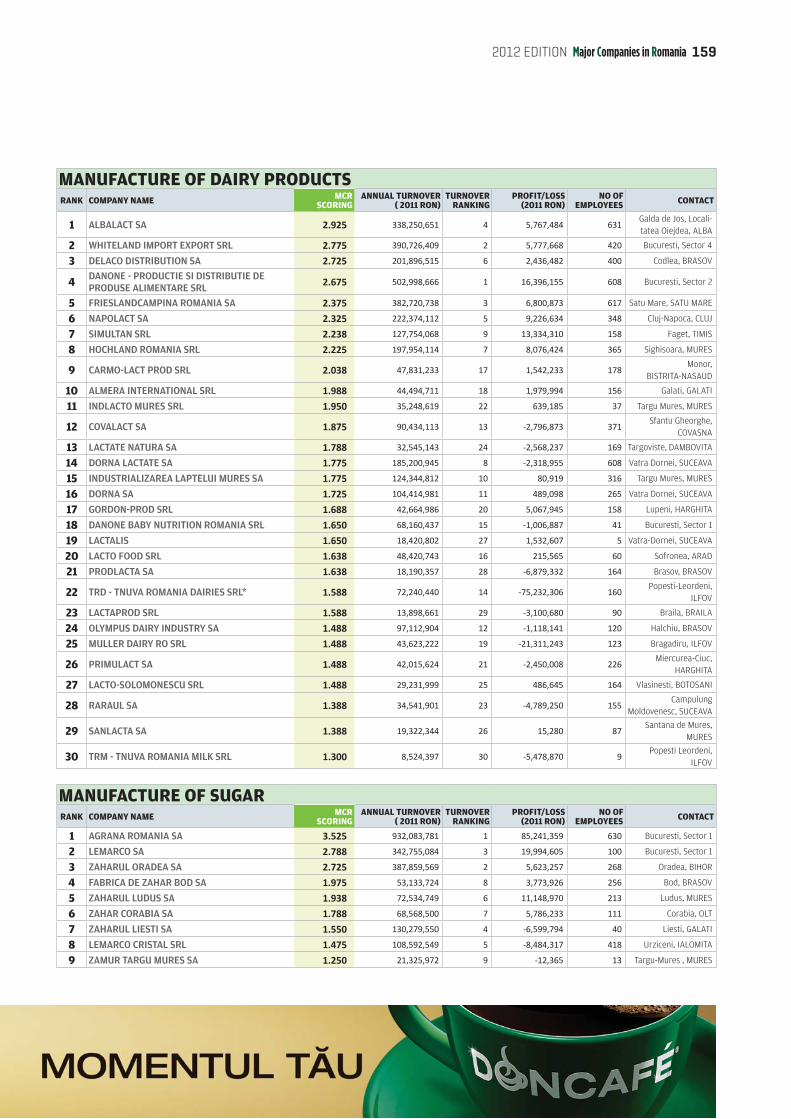
MANUFACTURE OF DAIRY PRODUCTSRANK COMPANY NAME MCR
SCORING ANNUAL TURNOVER
( 2011 RON)TURNOVER
RANKINGPROFIT/LOSS
(2011 RON)NO OF
EMPLOYEES CONTACT
1 ALBALACT SA 2.925 338,250,651 4 5,767,484 631 Galda de Jos, Locali-tatea Oiejdea, ALBA
2 WHITELAND IMPORT EXPORT SRL 2.775 390,726,409 2 5,777,668 420 Bucuresti, Sector 4
3 DELACO DISTRIBUTION SA 2.725 201,896,515 6 2,436,482 400 Codlea, BRASOV
4 DANONE - PRODUCTIE SI DISTRIBUTIE DE PRODUSE ALIMENTARE SRL
2.675 502,998,666 1 16,396,155 608 Bucuresti, Sector 2
5 FRIESLANDCAMPINA ROMANIA SA 2.375 382,720,738 3 6,800,873 617 Satu Mare, SATU MARE
6 NAPOLACT SA 2.325 222,374,112 5 9,226,634 348 Cluj-Napoca, CLUJ
7 SIMULTAN SRL 2.238 127,754,068 9 13,334,310 158 Faget, TIMIS
8 HOCHLAND ROMANIA SRL 2.225 197,954,114 7 8,076,424 365 Sighisoara, MURES
9 CARMO-LACT PROD SRL 2.038 47,831,233 17 1,542,233 178 Monor,
BISTRITA-NASAUD
10 ALMERA INTERNATIONAL SRL 1.988 44,494,711 18 1,979,994 156 Galati, GALATI
11 INDLACTO MURES SRL 1.950 35,248,619 22 639,185 37 Targu Mures, MURES
12 COVALACT SA 1.875 90,434,113 13 -2,796,873 371 Sfantu Gheorghe,
COVASNA
13 LACTATE NATURA SA 1.788 32,545,143 24 -2,568,237 169 Targoviste, DAMBOVITA
14 DORNA LACTATE SA 1.775 185,200,945 8 -2,318,955 608 Vatra Dornei, SUCEAVA
15 INDUSTRIALIZAREA LAPTELUI MURES SA 1.775 124,344,812 10 80,919 316 Targu Mures, MURES
16 DORNA SA 1.725 104,414,981 11 489,098 265 Vatra Dornei, SUCEAVA
17 GORDON-PROD SRL 1.688 42,664,986 20 5,067,945 158 Lupeni, HARGHITA
18 DANONE BABY NUTRITION ROMANIA SRL 1.650 68,160,437 15 -1,006,887 41 Bucuresti, Sector 1
19 LACTALIS 1.650 18,420,802 27 1,532,607 5 Vatra-Dornei, SUCEAVA
20 LACTO FOOD SRL 1.638 48,420,743 16 215,565 60 Sofronea, ARAD
21 PRODLACTA SA 1.638 18,190,357 28 -6,879,332 164 Brasov, BRASOV
22 TRD - TNUVA ROMANIA DAIRIES SRL* 1.588 72,240,440 14 -75,232,306 160 Popesti-Leordeni,
ILFOV
23 LACTAPROD SRL 1.588 13,898,661 29 -3,100,680 90 Braila, BRAILA
24 OLYMPUS DAIRY INDUSTRY SA 1.488 97,112,904 12 -1,118,141 120 Halchiu, BRASOV
25 MULLER DAIRY RO SRL 1.488 43,623,222 19 -21,311,243 123 Bragadiru, ILFOV
26 PRIMULACT SA 1.488 42,015,624 21 -2,450,008 226 Miercurea-Ciuc,
HARGHITA
27 LACTO-SOLOMONESCU SRL 1.488 29,231,999 25 486,645 164 Vlasinesti, BOTOSANI
28 RARAUL SA 1.388 34,541,901 23 -4,789,250 155 Campulung
Moldovenesc, SUCEAVA
29 SANLACTA SA 1.388 19,322,344 26 15,280 87 Santana de Mures,
MURES
30 TRM - TNUVA ROMANIA MILK SRL 1.300 8,524,397 30 -5,478,870 9 Popesti Leordeni,
ILFOV
MANUFACTURE OF SUGARRANK COMPANY NAME MCR
SCORING ANNUAL TURNOVER
( 2011 RON)TURNOVER
RANKINGPROFIT/LOSS
(2011 RON)NO OF
EMPLOYEES CONTACT
1 AGRANA ROMANIA SA 3.525 932,083,781 1 85,241,359 630 Bucuresti, Sector 1
2 LEMARCO SA 2.788 342,755,084 3 19,994,605 100 Bucuresti, Sector 1
3 ZAHARUL ORADEA SA 2.725 387,859,569 2 5,623,257 268 Oradea, BIHOR
4 FABRICA DE ZAHAR BOD SA 1.975 53,133,724 8 3,773,926 256 Bod, BRASOV
5 ZAHARUL LUDUS SA 1.938 72,534,749 6 11,148,970 213 Ludus, MURES
6 ZAHAR CORABIA SA 1.788 68,568,500 7 5,786,233 111 Corabia, OLT
7 ZAHARUL LIESTI SA 1.550 130,279,550 4 -6,599,794 40 Liesti, GALATI
8 LEMARCO CRISTAL SRL 1.475 108,592,549 5 -8,484,317 418 Urziceni, IALOMITA
9 ZAMUR TARGU MURES SA 1.250 21,325,972 9 -12,365 13 Targu-Mures , MURES
159
2012 EDITION Major Companies in Romania

MANUFACTURE OF GRAIN MILL PRODUCTS AND STARCHES RANK COMPANY NAME MCR SCORING ANNUAL TURNOVER
( 2011 RON)TURNOVER
RANKINGPROFIT/LOSS
(2011 RON)NO OF
EMPLOYEES CONTACT
1 TITAN SA 2.925 338,268,130 1 8,287,814 872 Pantelimon, ILFOV
2 BOROMIR IND SRL 2.775 264,813,069 3 4,972,163 827Ramnicu Valcea,
VALCEA
3 SAPTE SPICE SA 2.525 230,834,578 4 199,521 495Ramnicu Valcea,
Valcea
4 ROMPAN PROIECT - SERVICE SA 2.450 208,717,028 5 12,545,799 8 Bucuresti, Sector 6
5 OLTINA IMPEX PROD COM SRL 2.388 110,318,424 12 12,491,745 205 Urlati, PRAHOVA
6 BOROMIR PROD SA 2.363 148,719,552 8 1,177,362 1,032 Buzau, BUZAU
7 PAMBAC SA 2.325 156,688,866 7 3,476,449 605 Bacau, BACAU
8 VEL PITAR SA 2.263 292,290,286 2 -15,129,451 2,754Ramnicu Valcea,
VALCEA
9 SAM MILLS SRL 2.238 201,783,415 6 2,086,174 149 Botiz, SATU MARE
10 TRANS AGAPE SRL 2.175 71,535,797 13 1,971,678 384 Sibiu, SIBIU
11 MP BANEASA - MOARA SA 2.038 135,420,438 9 5,040,712 62 Bucuresti, Sector 1
12 PAN GROUP SA 2.025 111,483,843 11 165,784 926 Craiova, DOLJ
13 PANGRAM SA 2.025 65,055,411 14 782,009 324Resita,
CARAS-SEVERIN
14 MORARIT-PANIFICATIE BANEASA SA 1.838 24,878,393 18 561,738 147 Bucuresti, Sector 1
15 MOPAN SA 1.825 123,535,310 10 5,336,994 674 Vaslui, VASLUI
16 DOBRE SI FIII SRL 1.738 25,260,321 17 669,467 158Constanta,
CONSTANTA
17 LUJERUL SA 1.688 32,966,304 15 1,571,433 77 Bucuresti, Sector 6
18 ANA PAN SA 1.638 18,827,387 19 686,880 161 Bucuresti, Sector 2
19 DELTAPAN SA 1.600 2,708,225 24 -153,166 43 Tulcea, TULCEA
20 PLEVNEI SA 1.588 5,456,121 21 69,558 77 Bucuresti, Sector 6
21 DEMOPAN SA 1.488 9,035,912 20 -140,414 145 Galati, GALATI
22 ABO MILL SA 1.388 4,626,182 22 -2,657,373 61 Zalau, SALAJ
23 GALMOPAN SA 1.375 29,898,195 16 -762,080 281 Galati, GALATI
24 COMPAN SA 1.288 3,453,141 23 -1,614,965 96 Iasi, IASI
MANUFACTURE OF VEGETABLE AND ANIMAL OILS AND FATSRANK COMPANY NAME MCR SCORING ANNUAL TURNOVER
( 2011 RON)TURNOVER
RANKINGPROFIT/LOSS
(2011 RON)NO OF
EMPLOYEES CONTACT
1 EXPUR SA 3.425 781,211,255 106,983,324 473 Urziceni, IALOMITA
2 BUNGE ROMANIA SRL 3.388 1,377,067,121 -232,841 237 Buzau, BUZAU
3 ARGUS SA 2.875 231,042,645 7,930,422 291Constanta,
CONSTANTA
4 UNILEVER SOUTH CENTRAL EUROPE SA 2.875 727,113,466 -66,077 279 Bucuresti, Sector 1
5 ARDEALUL SA 2.775 222,340,428 29,744,158 282 Carei, SATU MARE
6 CARGILL OILS SA 2.675 313,656,544 -2,839,381 277 Bucuresti, Sector 1
7 PRUTUL SA 2.625 489,975,996 2,362,422 416 Galati, GALATI
8 ULEROM SA 1.588 150,584,476 947,357 172 Vaslui, VASLUI
9 ULTEX SA 1.538 17,182,391 11,583,757 193 Tandarei, IALOMITA
10 ORKLA FOODS ROMANIA SA 1.488 101,480,930 -1,725,867 216 Bucuresti, Sector 1
MCR FMCG

1612012 EDITION Major Companies in Romania
MANUFACTURE OF WINE FROM GRAPERANK COMPANY NAME MCR SCORING ANNUAL TURNOVER
( 2011 RON)TURNOVER
RANKINGPROFIT/LOSS
(2011 RON)NO OF
EMPLOYEES CONTACT
1 COTNARI SA 2.125 99,618,820 2 3,475,123 292 Cotnari, IASI
2 ZAREA SA 2.038 47,281,446 8 118,712 147 Bucuresti, Sector 1
3 TOHANI SA 1.938 4,087,347 20 1,301,207 75Comuna Gura
Vadului, PRAHOVA
4 VINCON VRANCEA SA 1.925 80,438,619 4 3,973,723 611 Focsani, VRANCEA
5 MURFATLAR ROMANIA SA 1.888 139,737,790 1 887,282 207Murfatlar,
CONSTANTA
6 CRAMELE RECAS SA 1.838 59,875,383 5 9,118,628 76 Recas, TIMIS
7 JIDVEI SRL FILIALA ALBA 1.788 93,329,997 3 7,994,179 165 Jidvei, ALBA
8 CASA DE VINURI ZORESTI SA 1.638 53,917,877 6 137,591 57 Vernesti, BUZAU
9 AGROINDUSTRIALA BUCIUM SA 1.638 15,572,854 14 65,420 60 Iasi, IASI
10 ANGELLI SPUMANTE & APERITIVE SRL 1.588 50,555,688 7 2,978,627 99 Bucuresti, Sector 6
11 CRAMELE HALEWOOD SA 1.588 41,107,552 10 -2,739,783 171 Ploiesti, PRAHOVA
12 VINEXPORT SA 1.588 29,120,920 12 149,515 113 Focsani, VRANCEA
13 DOMENIILE VITICOLE TOHANI SRL 1.488 43,227,338 9 546,141 153 PRAHOVA
14 VINEXPORT TRADE-MARK SA 1.488 40,149,626 11 -8,315,797 123 Focsani, VRANCEA
15 VINIA SA 1.488 11,205,053 17 -9,407,736 113 Iasi, IASI
16 CARL REH WINERY SRL 1.438 15,205,307 15 -1,547,968 196 Bucuresti, Sector 2
17 VINARTE SA 1.438 11,225,494 16 166,134 67 Bucuresti, Sector 2
18 VINCON DISTRIBUTION SRL 1.400 28,261,050 13 27,775 35 Bucuresti, Sector 3
19 VERITAS PANCIU SA 1.388 10,812,290 18 -14,404,175 85 Panciu, VRANCEA
20 ROVIT SA 1.338 4,771,255 19 8,216 58Valea Calugareasca,
PRAHOVA
MANUFACTURE OF BEERRANK COMPANY NAME MCR SCORING ANNUAL TURNOVER
( 2011 RON)TURNOVER
RANKINGPROFIT/LOSS
(2011 RON)NO OF
EMPLOYEES CONTACT
1 HEINEKEN ROMANIA SA 3.813 1,042,285,902 2 182,888,969 1,198 Bucuresti, Sector 1
2 URSUS BREWERIES SA 3.363 1,108,012,643 1 -57,660,007 1,440 Bucuresti, Sector 1
3 UNITED ROMANIAN BREWERIES BEREPROD SRL
2.325 293,197,720 5 4,004,899 306 Pantelimon, ILFOV
4 BERMAS SA 2.288 23,098,100 8 1,915,904 205 Scheia, SUCEAVA
5 CARLSROM BEVERAGE CO SRL 2.275 463,388,608 3 -10,806,238 471 Bucuresti, Sector 5
6 BERGENBIER SA 2.175 448,984,447 4 -20,831,109 573 Bucuresti, Sector 2
7 MARTENS SA 1.838 29,088,607 6 -988,297 137 Galati, GALATI
8 ALBRAU PROD SA 1.738 26,332,010 7 509,312 121 Onesti, BACAU
9 ALBRAU GRUP SRL 1.400 9,178,605 9 -16,101,888 5 Onesti, BACAU
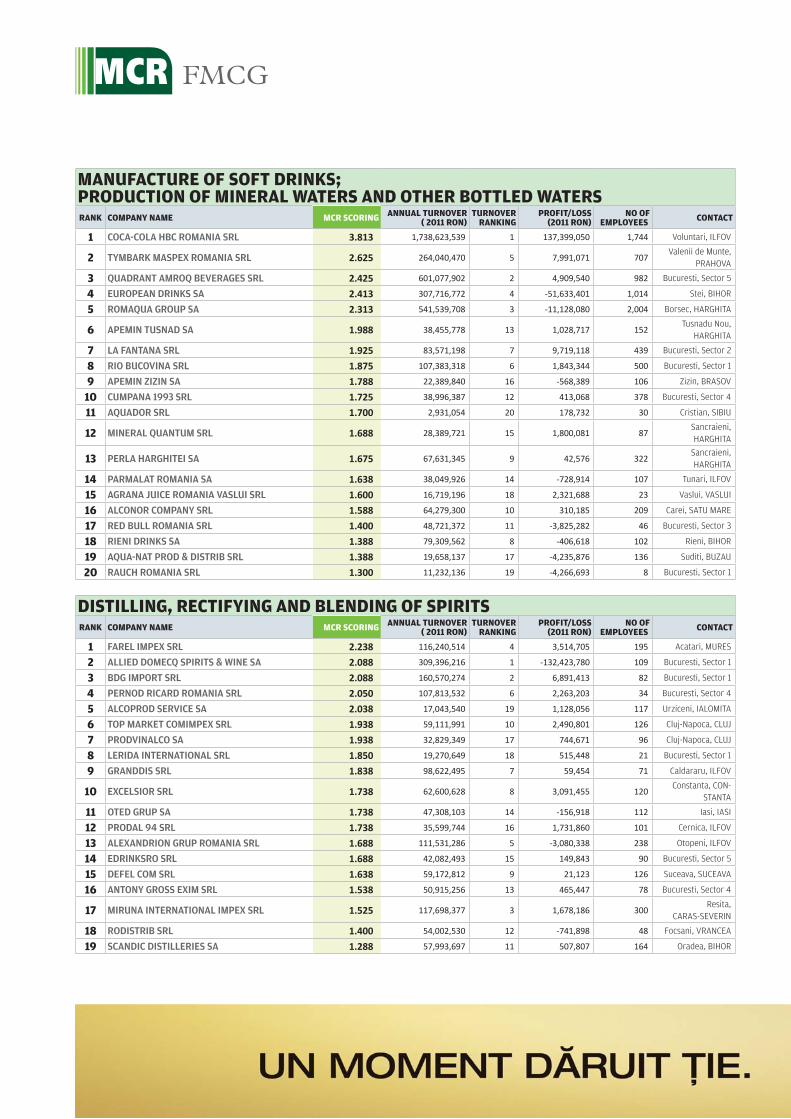
MANUFACTURE OF SOFT DRINKS; PRODUCTION OF MINERAL WATERS AND OTHER BOTTLED WATERSRANK COMPANY NAME MCR SCORING ANNUAL TURNOVER
( 2011 RON)TURNOVER
RANKINGPROFIT/LOSS
(2011 RON)NO OF
EMPLOYEES CONTACT
1 COCA-COLA HBC ROMANIA SRL 3.813 1,738,623,539 1 137,399,050 1,744 Voluntari, ILFOV
2 TYMBARK MASPEX ROMANIA SRL 2.625 264,040,470 5 7,991,071 707Valenii de Munte,
PRAHOVA
3 QUADRANT AMROQ BEVERAGES SRL 2.425 601,077,902 2 4,909,540 982 Bucuresti, Sector 5
4 EUROPEAN DRINKS SA 2.413 307,716,772 4 -51,633,401 1,014 Stei, BIHOR
5 ROMAQUA GROUP SA 2.313 541,539,708 3 -11,128,080 2,004 Borsec, HARGHITA
6 APEMIN TUSNAD SA 1.988 38,455,778 13 1,028,717 152Tusnadu Nou,
HARGHITA
7 LA FANTANA SRL 1.925 83,571,198 7 9,719,118 439 Bucuresti, Sector 2
8 RIO BUCOVINA SRL 1.875 107,383,318 6 1,843,344 500 Bucuresti, Sector 1
9 APEMIN ZIZIN SA 1.788 22,389,840 16 -568,389 106 Zizin, BRASOV
10 CUMPANA 1993 SRL 1.725 38,996,387 12 413,068 378 Bucuresti, Sector 4
11 AQUADOR SRL 1.700 2,931,054 20 178,732 30 Cristian, SIBIU
12 MINERAL QUANTUM SRL 1.688 28,389,721 15 1,800,081 87Sancraieni, HARGHITA
13 PERLA HARGHITEI SA 1.675 67,631,345 9 42,576 322Sancraieni, HARGHITA
14 PARMALAT ROMANIA SA 1.638 38,049,926 14 -728,914 107 Tunari, ILFOV
15 AGRANA JUICE ROMANIA VASLUI SRL 1.600 16,719,196 18 2,321,688 23 Vaslui, VASLUI
16 ALCONOR COMPANY SRL 1.588 64,279,300 10 310,185 209 Carei, SATU MARE
17 RED BULL ROMANIA SRL 1.400 48,721,372 11 -3,825,282 46 Bucuresti, Sector 3
18 RIENI DRINKS SA 1.388 79,309,562 8 -406,618 102 Rieni, BIHOR
19 AQUA-NAT PROD & DISTRIB SRL 1.388 19,658,137 17 -4,235,876 136 Suditi, BUZAU
20 RAUCH ROMANIA SRL 1.300 11,232,136 19 -4,266,693 8 Bucuresti, Sector 1
DISTILLING, RECTIFYING AND BLENDING OF SPIRITSRANK COMPANY NAME MCR SCORING ANNUAL TURNOVER
( 2011 RON)TURNOVER
RANKINGPROFIT/LOSS
(2011 RON)NO OF
EMPLOYEES CONTACT
1 FAREL IMPEX SRL 2.238 116,240,514 4 3,514,705 195 Acatari, MURES
2 ALLIED DOMECQ SPIRITS & WINE SA 2.088 309,396,216 1 -132,423,780 109 Bucuresti, Sector 1
3 BDG IMPORT SRL 2.088 160,570,274 2 6,891,413 82 Bucuresti, Sector 1
4 PERNOD RICARD ROMANIA SRL 2.050 107,813,532 6 2,263,203 34 Bucuresti, Sector 4
5 ALCOPROD SERVICE SA 2.038 17,043,540 19 1,128,056 117 Urziceni, IALOMITA
6 TOP MARKET COMIMPEX SRL 1.938 59,111,991 10 2,490,801 126 Cluj-Napoca, CLUJ
7 PRODVINALCO SA 1.938 32,829,349 17 744,671 96 Cluj-Napoca, CLUJ
8 LERIDA INTERNATIONAL SRL 1.850 19,270,649 18 515,448 21 Bucuresti, Sector 1
9 GRANDDIS SRL 1.838 98,622,495 7 59,454 71 Caldararu, ILFOV
10 EXCELSIOR SRL 1.738 62,600,628 8 3,091,455 120Constanta, CON-
STANTA
11 OTED GRUP SA 1.738 47,308,103 14 -156,918 112 Iasi, IASI
12 PRODAL 94 SRL 1.738 35,599,744 16 1,731,860 101 Cernica, ILFOV
13 ALEXANDRION GRUP ROMANIA SRL 1.688 111,531,286 5 -3,080,338 238 Otopeni, ILFOV
14 EDRINKSRO SRL 1.688 42,082,493 15 149,843 90 Bucuresti, Sector 5
15 DEFEL COM SRL 1.638 59,172,812 9 21,123 126 Suceava, SUCEAVA
16 ANTONY GROSS EXIM SRL 1.538 50,915,256 13 465,447 78 Bucuresti, Sector 4
17 MIRUNA INTERNATIONAL IMPEX SRL 1.525 117,698,377 3 1,678,186 300Resita,
CARAS-SEVERIN
18 RODISTRIB SRL 1.400 54,002,530 12 -741,898 48 Focsani, VRANCEA
19 SCANDIC DISTILLERIES SA 1.288 57,993,697 11 507,807 164 Oradea, BIHOR
MCR FMCG

HOME AND PERSONAL CARERANK COMPANY NAME MCR
SCORING ANNUAL TURNOVER
( 2011 RON)TURNOVER
RANKINGPROFIT/LOSS
(2011 RON)NO OF
EMPLOYEES CONTACT
1 PROCTER & GAMBLE DISTRIBUTION SRL 3.600 1,253,875,543 1 22,697,889 45 Bucuresti, BUCURESTI
2 AVON COSMETICS (ROMANIA) SRL 2.675 444,432,678 4 56,435,043 315 Bucuresti, BUCURESTI
3 COLGATE-PALMOLIVE (ROMANIA) SRL 2.638 248,723,770 6 5,933,337 100 Bucuresti, BUCURESTI
4 L'OREAL ROMANIA SRL 2.588 219,764,897 7 7,802,082 136 Bucuresti, BUCURESTI
5 SILNEF MG SRL 2.575 541,039,974 3 3,144,958 434 Brasov, BRASOV
6 INTERBRANDS MARKETING & DISTRIBUTION SRL
2.413 575,287,107 2 1,205,208 1,951 Bucuresti, BUCURESTI
7 RECKITT BENCKISER (ROMANIA) SRL 2.388 250,903,910 5 45,207,089 78 Bucuresti, BUCURESTI
8 FICOSOTA SINTEZ ROMANIA SRL 2.300 65,362,403 23 3,503,244 32 Bucuresti, BUCURESTI
9 JOHNSON WAX SRL 2.250 151,115,239 10 2,626,997 34 Bucuresti, BUCURESTI
10 DETERGENTI SA 2.225 142,063,583 11 15,777,982 644 Timisoara, TIMIS
11 BEIERSDORF ROMANIA SRL 2.188 183,861,295 8 1,364,241 69 Bucuresti, BUCURESTI
12 CALIFORNIA FITNESS ROMANIA SRL 2.188 33,399,974 32 1,687,390 65 Ghiroda, TIMIS
13 PROFESSIONAL BRANDS MARKETING & DISTRIBUTION SRL
2.138 39,941,741 30 3,434,520 73 Bucuresti, BUCURESTI
14 PROCTER & GAMBLE MARKETING ROMANIA SRL
2.125 124,383,347 13 5,525,616 409 Bucuresti, BUCURESTI
15 SCA HYGIENE PRODUCTS SRL 2.100 108,846,535 15 196,396 26 Bucuresti, BUCURESTI
16 COSMETICS ORIFLAME ROMANIA SRL 2.038 139,387,827 12 7,065,004 123 Bucuresti, BUCURESTI
17 FARMEC SA 2.025 110,890,565 14 8,302,959 544 Cluj-Napoca, CLUJ
18 UNILEVER ROMANIA SA 2.025 61,788,268 25 1,525,026 300 Ploiesti, PRAHOVA
19 AMWAY ROMANIA MARKETING SRL 2.000 78,257,667 20 2,928,380 29 Bucuresti, BUCURESTI
20 POINT DISTRIBUTION GRUP SRL 1.988 62,608,993 24 302,770 94 Vanatori, GALATI
21 CLEOPATRA CENTER SRL 1.938 82,118,348 19 334,637 156 Barlad, VASLUI
22 COTY COSMETICS ROMANIA SRL 1.900 69,129,698 22 879,673 41 Bucuresti, BUCURESTI
23 ROLICOM IMPORT EXPORT SRL 1.888 44,455,336 29 423,098 186 Cluj-Napoca, CLUJ
24 INTERSTAR CHIM SA 1.888 91,457,657 17 172,459 210 Bucuresti, BUCURESTI
25 SUPERFOOD COMPANY SRL 1.888 74,216,156 21 1,674,820 213 Pantelimon, ILFOV
26 SANO ROMANIA SRL 1.888 60,552,169 26 908,154 77 Pantelimon, ILFOV
27 FOREVER LIVING PRODUCTS ROMANIA SRL 1.888 57,914,808 27 954,792 69 Bucuresti, BUCURESTI
28 EVERET ROMANIA DISTRIBUTION SRL 1.888 56,224,497 28 281,343 97 Bucuresti, BUCURESTI
29 LA-RO IMPEX 2001 SRL 1.888 30,450,054 33 186,165 160 Bucuresti, BUCURESTI
30 SARANTIS ROMANIA SA 1.875 156,573,733 9 9,645,701 348 Chiajna, ILFOV
31 ZEPTER INTERNATIONAL ROMANIA IMPORT EXPORT SRL
1.788 33,722,581 31 -592,187 84 Bucuresti, BUCURESTI
32 BELLA ROMANIA IMPEX SRL 1.788 91,838,171 16 -910,214 118 Bucuresti, BUCURESTI
33 TOTAL DISTRIBUTION GROUP & LOGISTICS SRL 1.638 82,222,829 18 -5,124,213 242 Bucuresti, BUCURESTI
1632012 EDITION Major Companies in Romania


Trade CASH & CARRY HYPERMARKETS SUPERMARKETS DO-IT-YOURSELF DISCOUNT MALLS & SHOPPING CENTERS
1652012 EDITION Major Companies in Romania
1%net profit margin for retailers in 2011, compared with a 3 percent – 5 percent net profit margin registered in the boom years

One year ago, I was writing about how mass grocery retailers bet on accelerated expansion, private labels and diversification of store formats to cope with a shrinking market. It appears nothing has changed since.
The rush for additional selling space continued to be the main trend in the last year, and we will continue to see consolidation in the sector. Selling surface of modern retail increased by 50% in the last 3 years, despite the double digit drop in consumption. The most active players Kaufland, Lidl, Penny Market, Auchan or Mega Image have added more than 50% to their selling area in only one year, during 2011. And 2012 started more furious than ever, with 42 new stores in the first quarter. The same pattern was followed by the Do-It-Yourself sector, Romania recording the second largest expansion in the Central Europe in the last 3 years, despite the 20% decrease in the DIY market.
The most interesting trend is the rise of the local convenience stores: the ones that survived the first recession years have maintained the number of stores and even invested in new locations. Domestic players are mainly small, specialized networks developed by meat processors as an adjacent distribution channel of their products and for cashflow improvement.
INVESTMENTS TO CONTINUE, AS THE MARKET RECORDS A SLIGHT RECOVERYAs everyone is betting on the increase in the private consumption and on the shift of consumers from traditional to modern retail, it all comes down to fighting for the pole position in a race with a postponed start. An expensive pole position, but big players seem to be willing to spare no expense.
Somewhere in the corporate headquarters, Group CEOs and CFOs have drawn up their business plans, and have concluded that Romania is the place to be, once the recession will end. They have taken into account the real –estate opportunities created by the market downturn and by the availability of attractive locations, abandoned by local players going bankrupt. They have also considered the population size (and statistics show that Romanians spend half of their disposable income on food, drinks and tobacco), and the low degree of penetration of modern retail and private spending, compared
to other European countries. Take all these factors into equation, and the conclusion is obvious.
But is it?
Everyone is predicting that consumer demand is likely to return in the long term. Retailers are arguing the potential of the market is great, so they continue to announce impressive capital expenditure budgets. But what does long term mean – (is it 3 years? Is it 5 years? ) and what are retailers’ growth expectations – are we thinking at the pre-crisis peak levels?
Why not happen now? For a start, let’s remember that the growth in the retail market in the boom years has been fueled by a rapidly increase in disposable income (not correlated with productivity) and most important, by credit availability.
With an un-restructured banking sector, and continued increase in the non performing loans, banks have their own issues to sort out first and some of them are reducing their retail operations. That means we will not see anytime soon bankers willing to lend in the same relaxed manner as before. On the other hand, consumers have learned to be more prudent, as consumer confidence is rather low: population cash savings have increased, but are sitting in bank deposits, instead of fueling consumption. According to the latest study performed by GfK, although the willingness to make major purchases has risen in the last months, it is still at a very low level.
The austerity measures from 2010 and especially the salary cuts in the public sector have had their direct hit in the households’ consumption. The average salary level increased in August 2012 by only 1.5% (in real terms) compared to the same month one year ago, hardly a sign of recovery. This year, the new Government had increased salaries in the public sector, and a new rise was recently announced for December this year, a predictable move, given the upcoming parliamentary elections. However, this would not be enough to boost consumption, as the private sector was also faced with salary corrections.
And yet, the key indicator in this sector - consumption of food, drinks and tobacco - has increased this year. In the first 8 months of the year, retail sales increased by 4.3%, compared to
MCR TRADE
With a slow economicrecovery ahead, retailers cannot afford to think short term
Marius Boatca, Manager, Transaction Advisory Services, Ernst & Young

167
Major Companies in Romania 2012 EDITION Major Companies in Romania
the same period in 2011. A higher growth (+9.3%) was reported on sales of fuel and consumption of food, drinks and tobacco (+4.5%), while non-food trade increased by 1.9%. Could this be the revival sign that everyone was expecting? Modern retailers have already announced increased revenues last year compared to 2010 (driven by an expanding network). However, the August 2012 retail index represents only 55% of the August 2008 level. Assuming a constant 4.5% year-on-year growth, it will take 15 years to reach the August 2008 peak level (this is however, only arithmetics, the economy might surprise us).
IN THE MEANTIME, THE PRICING WARS AND INCREASED OPERATING COSTS ERODE RETAILERS’ PROFIT MARGINSMain players have continued to experience a decrease in profitability, from a net profit margin of 3%-5% in the boom years, to 2-3% in 2009 and to a minimum net profit margin of 0-1% in 2010 and 2011.
Gross profit margins of the most important players decreased by 3-5% in 2011, except for Auchan and Mega Image, who improved their gross margins in 2011. But at the current sales level, a 15-20% gross margin (and lower for discount stores) barely covers the increased operating costs of a higher network.
With the common strategy of the smallest price in the market, the truth is it is difficult to distinguish between different formats, simply by comparing shelf prices. Making a simplistic calculation, using the sales and the selling areas at the end of 2011, there is no difference in the sales per square meter between Mega Image, Kaufland or Auchan. As the price is the one criteria consumers seem to care about, retailers are reluctant to differentiate, or implement value added services. Now is not the right time. Now is the time for price cuts, promotional sales and value for money. The larger the network, the higher the negotiating power and the ability to pass the price squeeze on the producers.
A good private labels offering has become more necessary than ever, and private labels sales continued to increase, as we have anticipated. There is still huge potential on the private labels line of business, especially on the non-food sector, which is under-developed. Private labels and the multi-format network are the two main weapons retailers use in the battle for the wallets of new consumers: a consumer which is price sensitive, with more frequent visits in the shops, more informed and less loyal to the store.
The problem with price cuts is that it puts pressure on the whole chain, from producers to retailers. Food prices are already considered too low, compared to the European average. The poor agricultural season has led to rising food prices, inflation and conflicts between farmers and processors. Meat processors are unwilling to pay more, as they are aware that an increased shelf price would drive away consumers, which puts extra pressure on the producers. The announced price increases on meat, bakery and dairy products expected to occur in the following months are not good news for anyone.
CONSUMPTION GROWTH PROSPECTS CONTINUE TO LURE INTERNATIONAL PLAYERS’ INVESTMENTSSo what should we expect in the near future? Modern retail will continue to gain market share from the traditional retail. There is still room for development, although the “white spots” period is over. According to a study by retail and property experts, international retailers regards Romania as the third most attractive CEE investment prospect over the next two years, after Russia and the Czech Republic. However, in August there were rumors about Carrefour making an exit, contrary to the market trends, as part of its 3 billion euro revival plan for its underperforming European hypermarkets. This raises new concerns, as we see the development of modern retail in Romania is exposed to the international groups’ results on their larger, strategic markets, affected by the Eurozone problems.
Should the consumption level increase at a slower pace than anticipated, it will be interesting to observe what will be the next move of the main players, once the expansion will slow-down. And with so many variables (volatility of the exchange rate, parliamentary elections, low consumer confidence, Eurozone context), having the financial means to tolerate and sustain the current low profit margins, while continuing to burn cash in capital expenditure in a market that has not shown a clear sign of recovery, will make the difference between success and an unplanned exit.
One thing is sure: modern retail is here to stay and demands a bigger slice of the market. And the word of the day in the rush for space is location, location, location. Who said real-estate is suffering?
Consumption of food, drinks and tobacco (INSSE Index) – adjusted series
120
125
130
135
140
145
Po
ints
Consumption of food, drinks and tobacco (INSSE Index) - adjusted series

CASH & CARRYRANK COMPANY NAME MCR SCORING ANNUAL TURNOVER
( 2011 RON) TURNOVER
RANKINGPROFIT/LOSS
(2011 RON) NO OF
EMPLOYEES CONTACT
1 METRO CASH & CARRY ROMANIA SRL 4.300 4,963,012,603 95,208,230 6,003 Bucuresti, Sector 3
2 SELGROS CASH & CARRY SRL 3.713 3,408,091,410 86,702,217 4,248 Brasov, BRASOV
HYPERMARKETSRANK COMPANY NAME MCR SCORING ANNUAL TURNOVER
( 2011 RON) TURNOVER
RANKINGPROFIT/LOSS
(2011 RON) NO OF
EMPLOYEES CONTACT
1 KAUFLAND ROMANIA SCS 4.350 5,586,202,967 1 167,624,061 10,493 Bucuresti, Sector 2
2 CARREFOUR ROMANIA SA 4.300 4,031,266,685 2 133,799,794 6,951 Bucuresti, Sector 6
3 ROMANIA HYPERMARCHE SA 3.763 1,378,385,595 5 39,962,988 3,665 Bucuresti, Sector 3
4 AUCHAN ROMANIA SA 3.313 1,578,059,613 4 -7,152,681 3,289 Bucuresti, Sector 1
5 real,- HYPERMARKET ROMANIA SRL 3.300 3,008,864,542 3 -120,760,658 5,771 Bucuresti, Sector 3
SUPERMARKETSRANK COMPANY NAME MCR SCORING ANNUAL TURNOVER
( 2011 RON) TURNOVER
RANKINGPROFIT/LOSS
(2011 RON) NO OF
EMPLOYEES CONTACT
1 MEGA IMAGE SRL 3.913 1,221,043,229 1 13,097,320 4,277 Bucuresti, Sector 1
2 BILLA ROMANIA SRL 3.813 1,127,473,002 2 5,222,261 2,734 Bucuresti, Sector 2
3 SUCCES NIC COM SRL 2.663 273,925,545 5 2,470,789 1,431 Targu Jiu, GORJ
4 ARTIMA SA 2.513 522,216,337 4 728,778 1,374 Chiajna, ILFOV
5 ANNABELLA SRL 1.925 187,116,579 6 1,434,457 750 Ramnicu Valcea,
VALCEA
6 GENERAL NIC IMPORT-EXPORT SRL 1.838 64,572,510 12 2,778,497 206 Bucuresti, Sector 1
7 KONSTA SPLENDID SRL 1.738 102,517,047 8 1,791,677 171 Medias, SIBIU
8 TREI G RETAIL BEIUS SRL 1.675 98,721,275 9 283,049 311 Oradea, BIHOR
9 ZANFIR SNC 1.675 97,507,273 10 -196,597 316 Focsani, VRANCEA
10 DACIA SA 1.638 45,626,272 13 1,317,803 166 Alba Iulia, ALBA
11 CDE R INTEREX SA 1.575 163,639,312 7 -69,630,445 475 Ploiesti, PRAHOVA
12 DM DROGERIE MARKT SRL 1.575 90,687,194 11 -17,846,822 277 Timisoara, TIMIS
13 GIMROM HOLDING SA 1.388 45,563,939 14 -19,995,134 73 Bucuresti, Sector 6
DISCOUNT RANK COMPANY NAME MCR SCORING ANNUAL TURNOVER
( 2011 RON) TURNOVER
RANKINGPROFIT/LOSS
(2011 RON) NO OF
EMPLOYEES CONTACT
1 REWE Romania - Penny Market 3.513 1,750,171,052 1 5,145,553 2,493 Stefanestii de Jos,
ILFOV
2 PROFI ROM FOOD S.R.L. 3.463 934,039,541 3 13,222,420 2,476 Timisoara, TIMIS
3 LIDL DISCOUNT S.R.L. 3.363 1,678,989,043 2 -283,414,839 2,325 Nedelea, PRAHOVA
4 MINIMAX DISCOUNT S.R.L 2.263 433,791,519 4 -125,915,708 1,323 Voluntari, ILFOV
MCR TRADE

169
Major Companies in Romania 2012 EDITION Major Companies in Romania
DO IT YOURSELFRANK COMPANY NAME MCR
SCORING ANNUAL TURNOVER
( 2011 RON) TURNOVER
RANKINGPROFIT/LOSS
(2011 RON) NO OF
EMPLOYEES CONTACT
1 DEDEMAN SRL 4.063 2,016,376,729 1 205,670,978 4,646 Bacau, BACAU
2 ARABESQUE SRL 3.763 1,715,508,601 2 34,635,851 2,530 Galati, GALATI
3 AMBIENT SA 2.563 585,819,692 5 -17,013,917 1,363 Sibiu, SIBIU
4 PRAKTIKER ROMANIA SRL 2.363 661,978,291 3 -82,224,954 1,905 Voluntari, ILFOV
5 BRICOSTORE ROMANIA SA 2.313 611,763,639 4 -2,906,016 1,584 Bucuresti, Sector 6
6 BAUMAX ROMANIA SRL 2.313 574,396,085 6 -54,771,939 1,175 Bucuresti, Sector 2
7 ARTSANI COM SRL 2.125 123,580,415 9 4,096,985 304 Ploiesti, PRAHOVA
8 HORNBACH CENTRALA SRL 2.025 358,916,451 7 -32,024,497 506 Domnesti , ILFOV
9 OBI ROMANIA SRL 1.775 178,540,150 8 -50,956,765 632 Oradea, BIHOR
10 BRICO EXPERT SA 1.388 70,983,714 10 -3,882,203 245 Bucuresti, Sector 3
MALLS & SHOPPING CENTERSRANK COMPANY NAME MCR
SCORING ANNUAL TURNOVER
( 2011 RON)TURNOVER
RANKINGPROFIT/LOSS
(2011 RON)NO OF
EMPLOYEES CONTACT
1 UNIREA SHOPPING CENTER SA 1.988 78,596,802 3 3,493,802 145 Bucuresti, Sector 3
2 BANEASA DEVELOPMENTS SRL 1.638 141,041,775 1 21,909,530 88 Bucuresti, Sector 1
3 IULIUS MALL SUCEAVA SRL 1.588 27,575,816 8 -52,607,385 135 Suceava, SUCEAVA
4 IULIUS MALL CLUJ SRL 1.500 58,727,215 5 -33,781,929 1 Cluj-Napoca, CLUJ
5 COMETEX SA 1.500 22,082,611 9 1,745,714 28 Suceava, SUCEAVA
6 SUCEAVA SHOPPING CITY SRL 1.500 20,844,184 11 133,729 0 Suceava, SUCEAVA
7 LAND DEVELOPMENT PROIECT SRL 1.400 40,074,605 7 -11,411,227 0 Bucuresti, Sector 6
8 COTROCENI PARK SA 1.350 106,905,396 2 7,172,507 27 Bucuresti, Sector 6
9 ARENA CITY CENTER SRL 1.350 20,933,037 10 443,436 20 Bacau, BACAU
10 IULIUS MALL TIMISOARA SRL 1.300 66,676,307 4 -80,274,434 2 Timisoara, TIMIS
11 WIN MAGAZIN SA 1.300 52,746,403 6 6,016,350 0 Bucuresti, Sector 5
12 ARMONIA CENTER ARAD SRL 1.300 11,464,599 15 -22,124,964 0 -
13 CITY PARK MANAGEMENT SRL 1.300 8,188,332 17 69,971 35 Constanta, CONSTANTA
14 TOMIS SA 1.288 14,414,440 14 -56,446,351 52 Constanta, CONSTANTA
15 LIBERTY CENTER SRL 1.200 17,660,233 12 -22,850,387 7 Bucuresti, Sector 4
16 VITANTIS SRL 1.200 17,070,648 13 -7,229,841 0 Bucuresti, Sector 4
17 RIVER PLAZA MALL SRL 1.000 10,400,191 16 -5,181,368 0Ramnicu Valcea,
VALCEA
DISTRIBUTION COMPANIESRANK COMPANY NAME MCR
SCORING ANNUAL TURNOVER
( 2011 RON)TURNOVER
RANKINGPROFIT/LOSS
(2011 RON)NO OF
EMPLOYEES CONTACT
1 AMIGO & INTERCOST SRL 2.925 213,184,227 12 7,982,487 488Odorheiu secuiesc,
HARGHITA
2 LS TRAVEL RETAIL ROMANIA SRL 2.788 264,051,362 8 5,268,709 139 Bucuresti, sector 1
3 CARMISTIN SRL 2.738 384,794,152 4 6,815,105 72 Mizil, PRAHOVA
4 PUNCTUAL COMIMPEX SRL 2.688 249,260,965 9 1,520,548 62 Cluj-Napoca, CLUJ
5 SIMBA INVEST SRL 2.625 388,199,105 3 11,903,010 487 Bacau, BACAU
6 SECA DISTRIBUTION S.R.L. 2.625 312,020,361 5 2,309,541 631 Ploiesti, PRAHOVA
7 MACROMEX SRL 2.575 394,501,573 2 4,021,904 376 Bucuresti, sector 1
8 MARATHON DISTRIBUTION GROUP SRL 2.575 246,426,412 10 7,312,277 424 Afumati ILFOV
9 LICURICI IMPEX SRL 2.538 242,035,692 11 648,884 221 Onesti, BACAU
10 ELGEKA - FERFELIS ROMANIA SA 2.525 282,092,710 7 1,887,738 400 Bucuresti, Sector 3
11 SECA DISTRIBUTION SRL 2.175 312,020,361 6 2,309,541 631 Prahova, PLOIESTI
12 TOP BRANDS DISTRIBUTION SRL 2.075 457,603,358 1 -13,751,072 436 Otopeni, ILFOV
13 DUO SRL 1.788 98,028,392 13 -2,918,029 182 Constanta, CONSTANTA


Transport & Cargo ROAD TRANSPORT RAIL TRANSPORT AIR TRANSPORT MARITIME & RIVER TRANSPORT FREIGHT TRANSPORT POSTAL AND COURIER ACTIVITIES
1712012 EDITION Major Companies in Romania
200million EUR, the estimated value of carriers market in 2011
50 percent is the share of fuel price within the total transportation price. Three years ago, the share of fuel price was about 30 percent of the total price

Transport and cargo industry in Romania carries some of the most important privatization assignments to the local economy and seemingly, the year comes to an end close to a bitter conclusion, that of a hard and very slow process. The only company in this industry that seems to have seen an advance is Romanian Post National Company (Posta Romana), where the consultancy group has been selected. On the other hand, the state-owned postal company started already to compete side by side with private carriers, many of them part of multinational groups. This segment saw recently a large joint-venture of two large international operators and the companies feel the rush of market share on a very competitive market.
PRIVATIZATIONS, HARDER THAN NEVER The largest operator on the couriers market, Romanian Post National Company, is heading towards a long-waited privatization after a consortium established by KPMG Romania and law firm Tuca Zbarcea si Asociatii has been selected in September this year to offer consultancy services in the privatization process conducted by the Ministry of Communications and Information Society (MCTI). According to the ministry, the first stage of privatization has been completed so far and a strategic investor has to be selected. The new investor at the national postal services company will own more than 20 percent share package and the operation will be done through a capital increase procedure. The state company runs over 7,000 postal offices, over 32,000 employees and its main shareholders are the Romanian state with 75 percent of shares and Proprietatea Fund, with 25 percent.
CEO FOR STATE, WRETCHED RESULT As the privatization of “Posta Romana” is part of the agreement with the International Monetary Fund and European Union, another major privatization on the IMF list and expected to happen is the national air company Tarom. October came with a surprise, that of the selection of a new board for Tarom, including names as Dumitru Prunariu, Dan Pascariu, Lucian Isar, Marius Ghenea, Ciprian Ladunca, Valentin Macec. Though, the helm of the company was empty at the end of October as the would-be CEO of Romanian flag air carrier Tarom, Heinrich Vystoupil, has reportedly refused to take the post at the end of October. The naming marked an unsuccessful debut of the national program “CEO for state” agreed with IMF at one year since it started.
Another state-owned company on the privatizations list is The National Rail Freight Company “C.F.R. Marfa” S.A. The privatization procedure is pending until the year-end, as the privatization strategy has got a red line from the Supreme Council of National Defense (CSAT). The strategy has been firstly approved by the Ministry of Finances, Ministry of Administration and Interior, Justice and Competition Council.
PRIVATE VS. STATE: COMPETING SIDE BY SIDE For 2012, carriers estimate a rather modest growth of this industry, of some 3-4 percent. According to Fan Courier, the local market’s value remains at an amount around EUR 200 million.
MCR TRANSPORT & CARGO
The long road to effectiveness
Magda Purice, Journalist
Transport 2007 - 2011 (Romania)2007 2008 2009 2010 2011
Air transport of passengers 6,908,599 8,031,267 7,984,057 8,848,949 9,687,456
Air transport of goods 6,908,599 8,031,267 7,984,057 8,848,949 9,687,456Sea transport of goods(1,000 tonnes) 48,928 50,458 36,094 38,122Goods transport by inland waterways (1,000 tones) 29,425 30,295 24,743 32,088 29,396Goods transport by road (1,000 tones) 356,971 364,952 293,422 174,124 183,935
Source: Eurostat
2007 2008 2009 2010Volume of passenger transport relative to GDP - Index (2000 = 100) 80.7 78.8 87.2 86.7
Transport of passenger 2007 - 2010 (Romania)

The ANCOM statistics noticed spectacular leap in the cross-border traffic in 2011, with reference to the items sent from abroad to Romania, which grew by over 300 percent as against 2010 - to 3,196,000 items. At the same time, the postal items sent from Romania to other countries went down by 16 percent (from 235,716 processed in 2010 to 198,584 processed in 2011).
The services outside the scope of universal service also registered increases in terms of total traffic. In this segment, 103,250,000 items were collected and distributed, accounting for 20 percent of the overall mail traffic in 2011. Domestic items grew by 21 percent compared to 2010, while the cross-border traffic fell by 6 percent.
CARRIERS: A GROWING PRIVATE MARKET Postal services grew in the last two years and become more differentiated as services. The companies understood that, in order to perform, they need to add innovation and more efficient operations. As DPD Romania’s CEO states, the postal services market can be defined as “mature”, both as parcel and express services and the main trigger for its maturity is represented by the growth of online trade in Romania in the last few years. For DPD Romania, as the manager says, 2012 seems to be a good year and the target of 15 percent growth of the company’s turnover this year is estimated to be reached”. The company budgeted over 800.000 EUR to launch new online services and tailored solutions.
Still, within the mature and steady landscape of a market growing and adjusting to the new consumer trends, the main challenge remains “the innovation”. “The postal services evolved a lot in the last years, they have nothing in common with those offered in times when Romanian Post National Company (Posta Romana) was the mammoth company functioning on the same recipe for decades. Now, the market is deeply impacted by an intense competition that faces more and more selective and exigent customers. Also, a challenge of this market and impacting the competition of costs and profits, is
represented by the increasing costs for fuel, a very significant indicator for the couriers’ P&Ls.
Another big player on the this market, Fan Courier, states that the this industry can be compared as a true barometer of the overall economy, as the postal services stand for regular services for all the companies: international or medium-sized, entrepreneurial, start-ups, developing or mature. The company’s officials estimate that the strong competition defining this industry which have registered a fast growing rhythm in the last ten to twelve years, didn’t fundamentally changed its profile. It is still a heterogenic market, defined by indigene or foreign companies, large international groups or smaller entrepreneurial businesses. “What we have noticed in the last years is an attempt to concentrate de money capitals and, by saying that, we surely refer to the merger between TNT and UPS, from this spring.
THE CARGO QUEST FOR CLIENTS“What really matters is how and when the product reaches the shelf,” one said the general manager of one of the largest logistics company in Romania, KLG Europe Logistics, the Romanian office of Dutch company KLG Europe. Along with companies as Gefco, Ekol, Gebruder Weiss, DSV Solutions, FM Logistic, Delamode Romania, DHL Logistics and DHL Freight, Belgian groups Essers and Van Moer, Ahead Logistics, the company is sharing a market that states a continuous growth. The players on the market base their estimations on the premises that the companies will transform the fix costs in variable costs, in order to optimize the logistics process by reducing stocks and increasing the volume of direct deliveries. Still, the logistics market is operating in the same economic context, as all the others industries and some of the market’s challenges are: the pressure on prices, the sharp demands of the clients. For instance, the delivery time has decreased significantly since 2008, when a transport order could have been completed within 48-72 hours, according to the players on this market. The pressure on profit margins is being felt all over this market, the companies admit.
1732012 EDITION Major Companies in Romania
Source: The National Authority for Management and Regulation in Communications (ANCOM)
Postal traffic 2010 - 2011 (Romania)
2010 2011 Growth y-o-y
Processing rateThe National
Postal ServicesCompany
Processing rate Private carriers
Domestic postal items 352,420,570 496,367,000 29% 79% 21%Cross-border traffic 262,735,000 30,910,000 15%

The pressure on prices, integrated logistics solutions and the delivery factors are being felt across the entire logistics market, an industry that speaks loudly about the consumption and production regional trends, especially in the FMCG industry.
INCREASING OPERATIONAL COSTS The transport & cargo market is one of the most sensitive industries to the economic challenges as it is also influenced by the business performances of producers and suppliers. The business of logistic operators are influenced by a sum of factors as infrastructure, fuel price, the unpredictability of law environment, exchange rates, the strategy of local and central authorities for attracting and stimulating foreign and Romanian investors, evolution of consumer market.
Being a freight forwarder and logistics provider our main cost is the cost of haulers, and this is closely linked to the evolution of fuel price. During last years, the fuel price has constantly increased. Three or four years ago, the fuel price represented about 30 percent of the total transportation price. Today, it is more than 50 percent. This is related to the domestic transportation market, the proportion is slightly different for international transportation, where the fuel price weights lower in the total transportation price.
Other major components of the cost are the staff costs and, of course, the logistics terminals costs. Basically those 3 main
components cover more than 90 percent of the operations costs. The staff costs also increased, the only decrease was related to the warehouse terminals rent, that today reached at the level of 4 or even less than 4 euro/sqm.
THE PURSUIT OF GROWTH ON A FRAGMENTED MARKET One aspect of the market will be that existing players will enhance some specific services within their portfolio, some of us being focused more on forwarding rather than logistics or vice versa. Also, it is possible that some Romanian haulers will face downturns or even closure of the business due to the lack of cash flow and external financing. M&A would be possible in the near future, because the forwarding market is fragmented.
Most of the big names in forwarding are present on the Romanian market and for sure, they want to grow their business. This will be done both organic and by acquisition. DSV is also aiming to keep pace with the double digits growth, and our strategy will include both options. Even if today the market is fragmented, on long and medium-range forecast it will be “dominated” by the same big names because of their experience and know-how and also their resources, which afford them to invest year after year, and they will be able to offer services to any kind of customer.
The local logistics market is not as transparent as it is flexible, but it still has a significant growth potential. The
MCR Opinion
Getting into gear SERGIU IORDACHE,
Managing Director DSV Solutions
outsourcing of logistics services towards specialized companies makes from this segment to be a fast developing one, as it still has to catch up with the level registered on the European markets. For Danish mother company of DSV Solutions, running offices in 60 countries, Romania is a hot spot due to the increasing potential and the generous offer of large growth rate. The mature markets are also delivering growth rates but in a smaller and slower pace, while Romania still has the features of a fast-growing market.
A SNEAK PEEK TOWARDS THE CLIENTS Within the last few years, all logistics solutions providers have observed a tendency in the clients’ business to optimize stocks, sell warehoused goods fast and rotate merchandise in the deposits more quickly, through cross docking. Regarding the volumes of transported goods, we have noticed an increase of the transported automotive spare parts, like tires, while the FMCG segment has shrunk. But, in the same time, clients coming from growing industries such as pharmaceutical and automotive sectors are compensating for the variability of the other businesses.
“BEING A FREIGHT FORWARDER AND LOGISTICS PROVIDER, WE PAY ATTENTION TO THE COST OF HAULERS AS THIS IS CLOSELY LINKED TO THE EVOLUTION OF FUEL PRICE.”

ROAD TRANSPORTRANK COMPANY NAME MCR SCORING ANNUAL TURNOVER
( 2011 RON)TURNOVER
RANKINGPROFIT/LOSS
(2011 RON)NO OF
EMPLOYEES CONTACT
1 TRANS BITUM SRL 2.825 314,694,139 3 7,039,912 280 Bucuresti, Sector 1
2 ATLASSIB SRL 2.613 276,344,037 4 17,304,682 1,249 Sibiu, SIBIU
3 AQUILA PART PROD COM SRL 2.563 492,476,568 2 2,654,818 1,712 Ploiesti, PRAHOVA
4 REGIA AUTONOMA DE TRANSPORT BUCURESTI RA 2.550 686,099,298 1 0 11,190 Bucuresti, Sector 1
5 TRANSPECO LOGISTICS &DISTRIBUTION SA 2.375 131,088,864 14 32,774,741 430 Bucuresti, Sector 1
6 DUVENBECK LOGISTIK SRL 2.275 110,108,031 17 5,014,082 328 Cristian, BRASOV
7 GEFCO ROMANIA SRL 2.188 184,596,684 8 12,731,190 76 Bucuresti, Sector 2
8 WABERER`S ROMANIA SA 2.175 207,315,326 5 58,524 689 Bucuresti, Sector 6
9 ALPHA CONSTRUCT SISTEM SA 2.125 116,949,636 16 9,172,053 582Drobeta Turnu
Severin, MEHEDINTI
10 HOLLEMAN SPECIAL TRANSPORT &PROJECT CARGO SRL
2.088 81,041,125 25 3,946,545 87 Bucuresti, Sector 3
11 DUMAGAS TRANSPORT SA 2.075 205,361,292 6 -4,711,588 775Podari,Sat Braniste,
DOLJ
12 LOGISTIC E VAN WIJK SRL 2.075 92,137,279 24 4,532,841 304Sannicoara, Com
Apahida, CLUJ
13 COM DIVERS AUTO RO SA 1.975 96,813,916 21 3,386,245 309 Bascov, ARGES
14 TRANS BACO SRL 1.950 109,489,105 18 4,739,904 49Drobeta Turnu-
Severin, MEHEDINTI
15 HAVI LOGISTICS SRL 1.938 189,699,250 7 143,188 93 Bucuresti, Sector 1
16 HOEDLMAYR-LAZAR ROMANIA SRL 1.938 128,273,271 15 3,255,375 130 Bascov, ARGES
17 CIPCOS MAR COMPLEX SRL 1.938 77,516,198 26 4,606,983 91 Albota, ARGES
18 LAGERMAX AUTOTRANSPORT SRL 1.838 77,040,521 28 2,461,683 242 Curtici, ARAD
19 TIR EXPRESS SRL 1.738 136,780,384 13 43,764 233 Timisoara, TIMIS
20 REGIA AUTONOMA DE TRANSPORT URBAN DE CALATORI CLUJ NAPOCA RA
1.713 96,428,187 22 494,249 1,493 Cluj-Napoca, CLUJ
21 TRANSCONDOR SA 1.675 163,701,058 9 348,512 408 Arad, ARAD
22 TRANS CAR SRL 1.675 68,424,370 35 -1,953,560 257 Sibiu, SIBIU
23 REGIA AUTONOMA DE TRANSPORT PUBLIC PLOIESTI RA
1.663 66,593,042 38 77,212 1,084 Ploiesti , PRAHOVA
24 TRANSMEC RO SRL 1.638 141,991,733 12 799,659 210 Cluj Napoca, CLUJ
25 INT TRANSPORTE POPOVICI SRL 1.638 96,986,287 20 1,250,603 240Sfantu Gheorghe,
COVASNA
26 DUNCA EXPEDITII SA 1.625 151,207,263 11 2,688,152 583 Dumbravta, TIMIS
27 ASTALROM SA 1.625 92,454,651 23 5,851,969 480 Calarasi, CALARASI
28 TRANSEXPED AGRO SRL 1.600 69,628,191 32 362,400 40 Vadeni, BRAILA
29 CARPAT CEMTRANS SRL 1.588 69,571,125 33 973,580 67 Bucuresti, Sector 1
30 H ESSERS SRL 1.575 69,310,765 34 -1,174,028 297 Oradea, BIHOR
31 AGETAPS SRL 1.575 68,044,669 36 896,162 343 Brasov, BRASOV
32 VECTOR SPEDITION SRL 1.575 67,588,516 37 130,893 375 Slobozia, IALOMITA
33 TOTAL N S A SRL 1.538 98,231,980 19 17,081 250 Saliste, SIBIU
34 INTERNATIONAL LAZAR COMPANY SRL 1.525 154,182,181 10 325,140 418 Bascov, ARGES
35 REGIA AUTONOMA DE TRANSPORT TIMISOARA 1.463 77,417,543 27 -2,732,636 1,076 Timisoara, TIMIS
36 REGIA AUTONOMA DE TRANSPORT PUBLIC IASI RA 1.463 74,820,564 30 -8,784,423 1,382 Iasi, IASI
37 PANALPINA ROMANIA SRL 1.350 73,673,242 31 -541,434 0 Bucuresti, Sector 3
38 FRIGOEXPRES SA 1.225 76,182,580 29 -940,734 353 Oradea, BIHOR
1752012 EDITION Major Companies in Romania

MARITIME & RIVER TRANSPORTRANK COMPANY NAME MCR
SCORING ANNUAL TURNOVER
( 2011 RON)TURNOVER
RANKINGPROFIT/LOSS
(2011 RON)NO OF
EMPLOYEES CONTACT
1 CHIMPEX SA 2.525 61,009,622 12 8,817,733 260 Constanta, CONSTANTA
2 TTS ( TRANSPORT TRADE SERVICES ) SA 2.450 264,913,404 2 19,207,212 44 Bucuresti, Sector 2
3 SOCEP SA 2.275 59,103,455 13 7,092,137 440 Constanta, CONSTANTA
4 TOMINI TRADING SRL 2.188 436,407,429 1 18,797,771 205 Constanta, CONSTANTA
5 COMPANIA DE NAVIGATIE FLUVIALA ROMANA NAVROM SA
2.125 199,359,768 3 -3,450,189 586 Galati, GALATI
6 CONSTANTA SOUTH CONTAINER TERMINAL SRL 2.025 155,412,888 6 58,982,757 499 Agigea, CONSTANTA
7 SARGEANT MARINE ROMANIA SRL 2.000 179,101,413 4 188,652 29 Constanta, CONSTANTA
8 ROMAR SHIPPING AGENCY SRL 2.000 72,034,319 9 1,473,206 45 Constanta, CONSTANTA
9 COMVEX SA 1.938 63,216,633 11 6,306,947 200 Constanta, CONSTANTA
10 MAYA SD TRANS SRL 1.900 55,278,825 14 2,720,299 44 Bucuresti, Sector 5
11 TEAM LOGISTIC SPECIALISTS SRL 1.900 44,957,914 16 7,388,469 27 Bucuresti, Sector 3
12 NORTH STAR SHIPPING SRL 1.888 74,119,486 8 27,336,515 180 Constanta, CONSTANTA
13 PORT BAZINUL NOU SA 1.825 31,937,460 20 736,613 299 Galati, GALATI
14 COMPANIA NATIONALA ADMINISTRATIA CANALELOR NAVIGABILE SA
1.775 35,971,195 18 2,594,755 424 Agigea, CONSTANTA
15 KAPITAL LEADING TRANSPORT SRL 1.700 45,535,449 15 34,291 35 Bucuresti, Sector 2
16 MSC ROMANIA SHIPPING SRL 1.688 157,002,148 5 12,432,781 51 Bucuresti, Sector 1
17 MINMETAL SA 1.588 39,629,732 17 5,194,201 205 Constanta, CONSTANTA
18 ROMPORTMET SA 1.588 33,231,449 19 10,494,231 202 Galati, GALATI
19 DG PETROL SRL 1.488 82,978,946 7 -396,826,284 116 Bucuresti, Sector 6
20 REGIA AUTONOMA ADMINISTRATIA FLUVIALA A DUNARII DE JOS GALATI RA
1.475 68,257,594 10 0 703 Galati, GALATI
MCR TRANSPORT & CARGO

AIR TRANSPORTRANK COMPANY NAME MCR
SCORING ANNUAL TURNOVER
( 2011 RON)TURNOVER
RANKINGPROFIT/LOSS
(2011 RON)NO OF
EMPLOYEES CONTACT
1 ADMINISTRATIA ROMANA A SERVICIILOR DE TRAFIC AERIAN ROMATSA RA
3.013 742,857,431 2 45,403,645 1,545 Bucuresti, Sector 1
2 COMPANIA NATIONALA DE TRANSPORTURI AERIENE ROMANE TAROM SA
2.863 946,315,772 1 -262,224,490 2,286 Otopeni, ILFOV
3 COMPANIA NATIONALA AEROPORTURI BUCURESTI SA 2.813 474,335,158 3 52,608,755 1,099 Otopeni, ILFOV
4 CARPATAIR SA 2.100 293,249,163 4 -36,504,529 0 Ghiroda, TIMIS
5 REGIONAL AIR SUPORT SRL 1.900 21,239,383 13 888,408 26 Bucuresti, Sector 1
6 SOCIETATEA NATIONALA AEROPORTUL INTERNA-TIONAL TIMISOARA - TRAIAN VUIA SA
1.788 42,831,542 7 8,722,185 248 Timisoara, TIMIS
7 LUFTHANSA CARGO AG - GERMANIA - KELSTER-BACH - SA SUCURSALA ROMANIA
1.650 29,900,972 10 27,149,221 3 Otopeni, ILFOV
8 REGIONAL AIR SERVICES SRL 1.588 32,124,657 9 763,174 83 Tuzla, CONSTANTA
9 MEDALLION AIR SRL 1.588 22,173,315 12 126,213 67 Bucuresti, Sector 1
10 GLOBE GROUND ROMANIA SRL 1.575 69,783,115 5 10,376,613 791 Otopeni, ILFOV
11 AUTORITATEA AERONAUTICA CIVILA ROMANA RA 1.488 40,062,426 8 2,566,512 198 Bucuresti, Sector 1
12 AEROPORTUL CLUJ NAPOCA RA 1.438 54,361,834 6 0 210 Cluj-Napoca, CLUJ
13 JETRAN AIR SRL 1.388 19,050,455 14 -8,096,135 94 Bucuresti, Sector 1
14 COMPANIA ROMANA DE AVIATIE ROMAVIA RA 1.338 27,534,076 11 281,829 120 Bucuresti, Sector 4
RAIL TRANSPORTRANK COMPANY NAME MCR
SCORING ANNUAL TURNOVER
( 2011 RON)TURNOVER
RANKINGPROFIT/LOSS
(2011 RON)NO OF
EMPLOYEES CONTACT
1 SOCIETATEA NATIONALA DE TRANSPORT FEROVIAR DE MARFA - CFR MARFA - SA
3.450 1,107,684,939 3 -93,452,745 9,145 Bucuresti, Sector 1
2 SOCIETATEA NATIONALA DE TRANSPORT FEROVIAR DE CALATORI CFR CALATORI SA
3.400 2,189,750,845 1 1,522,533 13,924 Bucuresti, Sector 1
3 COMPANIA NATIONALA DE CAI FERATE CFR SA 3.350 1,149,704,461 2 -708,455,012 23,839 Bucuresti, Sector 1
4 GRUP FEROVIAR ROMAN SA 3.263 761,053,345 4 28,920,981 2,386 Bucuresti, Sector 1
5 REGIOTRANS SRL 2.875 225,505,914 6 8,669,801 760 Bucuresti, BRASOV
6 METROREX SA 2.313 509,479,589 5 - 4,117 Bucuresti, Sector 1
7 TRANSFER INTERNATIONAL SPEDITION SRL 2.188 132,095,113 9 2,218,545 52 Bucuresti, Sector 2
8 UNICOM TRANZIT SA 2.075 198,738,503 7 2,891,439 352 Voluntari, ILFOV
9 UNIFERTRANS SA 2.075 89,611,227 11 8,193,051 513 Voluntari, ILFOV
10 TRANSFEROVIAR GRUP SA 2.025 87,685,113 12 13,475,845 355 Cluj Napoca, CLUJ
11 DB SCHENKER RAIL ROMANIA SRL 1.938 72,388,000 14 2,892,570 189 Timisoara, TIMIS
12 TRANS EXPEDITION FEROVIAR SRL 1.825 82,185,378 13 1,683,103 565 Bucuresti, Sector 2
13 ROFERSPED SA 1.800 144,082,157 8 984,433 22 Bucuresti, Sector 1
14 GRAMPET SA 1.700 93,337,708 10 2,356,799 31 Bucuresti, Sector 1
FREIGHT TRANSPORTRANK COMPANY NAME MCR
SCORING ANNUAL TURNOVER
( 2011 RON)TURNOVER
RANKINGPROFIT/LOSS
(2011 RON)NO OF
EMPLOYEES CONTACT
1 SCHENKER ROMTRANS S.A. 2.513 315,691,295 1 4,935,208 1,059 Bucuresti, Sector 5
2 DSV SOLUTIONS S.R.L. 2.375 120,128,575 5 6,006,860 273 Otopeni, ILFOV
3 GEBRUDER WEISS S.R.L. 2.188 143,050,565 3 5,692,783 232 Bolintin Deal, GIURGIU
4 TIBBETT RETAIL SERVICES SRL 2.088 65,000,194 9 5,330,984 227 Chiajna, ILFOV
5 KUEHNE + NAGEL ROMANIA S.R.L. 1.988 153,958,010 2 3,230,814 160 Joita, GIURGIU
6 GOPET ROMANIA S.R.L. 1.750 121,912,345 4 213,997 44 Bucuresti, Sector 2
7 DELAMODE ROMANIA S.R.L. 1.738 62,449,573 10 397,197 106 Bucuresti, Sector 6
8 KLG EUROPE LOGISTICS S.R.L. 1.725 83,546,352 7 3,121,190 327 Bolintin Deal, GIURGIU
9 ALL CARGO EXPRES S.R.L. 1.650 83,084,120 8 5,850,919 39 Ghisoda, TIMIS
10 DHL LOGISTICS SRL 1.600 98,656,728 6 4,058,930 45 Bucuresti, Sector 1
1772012 EDITION Major Companies in Romania

POSTAL AND COURIER ACTIVITIESRANK COMPANY NAME MCR SCORING ANNUAL TURNOVER
( 2011 RON)TURNOVER
RANKINGPROFIT/LOSS
(2011 RON)NO OF
EMPLOYEES CONTACT
1 COMPANIA NATIONALA POSTA ROMANA SA 3.450 1,264,810,799 1 -182,932,177 32,124 Bucuresti, Sector 2
2 FAN COURIER EXPRESS SRL 2.813 222,633,218 2 43,993,292 1,137 Bucuresti, Sector 2
3 DHL INTERNATIONAL ROMANIA SRL 2.375 175,525,812 3 3,752,284 424 Bucuresti, Sector 1
4 TNT ROMANIA SRL 2.375 160,820,267 4 11,190,242 308 Bucuresti, Sector 1
5 CARGUS INTERNATIONAL SRL 2.275 93,309,126 5 6,121,503 969 Bucuresti, Sector 1
6 INBOX MARKETING SRL 2.075 16,381,372 17 909,074 571 Bucuresti, Sector 1
7 URGENT CURIER SRL 2.025 68,394,458 7 5,045,571 548 Bucuresti, Sector 4
8 POSTA ATLASSIB CURIER RAPID SRL 2.025 27,364,323 12 2,598,417 470 Sibiu, SIBIU
9 NEMO PROD COM IMPEX SRL 1.925 62,818,530 8 2,789,613 350 Bucuresti, Sector 2
10 UPS ROMANIA SRL 1.838 87,036,534 6 790,667 115 Bucuresti, Sector 1
11 INTERNATIONAL ROMEXPRESS SERVICE LTD SRL 1.838 15,164,240 19 2,211,698 105 Otopeni, ILFOV
12 POSTMASTER SRL 1.825 41,822,495 9 4,299,537 278 Bucuresti, Sector 1
13 DYNAMIC PARCEL DISTRIBUTION SA 1.788 36,015,126 10 1,676,878 148 Bucuresti, Sector 1
14 GLS GENERAL LOGISTICS SYSTEMS ROMANIA SRL 1.738 33,869,236 11 4,017,594 53 Sibiu, SIBIU
15 OTTO EXPEDITII SRL 1.675 18,656,791 15 -3,439,973 320 Bucuresti, Sector 1
16 FULL DISTRIBUTION SERVICES SRL 1.500 16,838,596 16 14,406 1Sfantu Gheorghe,
COVASNA
17 INFODIREKT SRL 1.400 26,287,374 13 -1,138,479 10Piatra Neamt,
NEAMT
18 WORLD MEDIATRANS SRL 1.338 22,608,129 14 7,924 102 Timisoara, TIMIS
19 SPRINT CURIER EXPRESRL 1.288 16,368,573 18 -616,415 160 Bucuresti, Sector 6
MCR TRANSPORT & CARGO

1792012 EDITION Major Companies in Romania
30.7%decrease of domestic passenger car sales in the first nine months of 2012, while imports of domestic passenger car sales dropped only 19.1 percent
Automotive Industry PRODUCERS & IMPORTERS CAR DEALERS AUTOMOTIVE PARTS PRODUCERS AUTOMOTIVE PARTS DISTRIBUTORS

With a car density lower than ½ of the EU average (according to the Automobile Industry Pocket Guide published in September 2012 by the European Automobile Manufacturers’ Association (ACEA)), the auto market in Romania exhibits a big potential for development in the context of the European auto market.
Still, sales recovery in Romania is expected to be long-drawn-out, thanks to two years of recession resulting in elevated unemployment levels and stymied wage growth in the face of high inflation, according to Romania Autos Report Q3 2012 published by Business Monitor International (BMI). Furthermore, with external credit much less readily available, retail lending in the Romanian economy practically stalled in the wake of the global financial crisis. Consumer spending on big-ticket items therefore remains very cautious as is evident from a massive 13.6% y-o-y decline in new passenger car sales during 2011, according to estimates from ACEA.
SALESDuring the first nine months of 2012, the domestic passenger car sales registered a total decrease by 30.7% compared to 2011, to 14,208 units, while the imported passenger car sales registered a total decrease by 19.1%, when compared to 2011, to 39,374 units1. Total passenger car sales during this period reached 53,582 units, lower by 22.5% compared to the corresponding period from 2011.
The domestic demand in the Romanian auto market continues to be dominated by Dacia although there is increasing participation from other international brands and growth in the
country's used car market. Dacia Logan occupied the leader position in the top of passenger cars sales by model, at the end of September 2012, with a total sales volume of 7,107 units, significantly higher than the second place occupied by Dacia Duster, with a total sales volume of 3,994 units. The following positions are occupied by Skoda Octavia (2,611 units), Renault Clio (1,834 units), Dacia Logan MCV (1,571 units) and Volkswagen Golf (1,438 units).
On the other hand, sales of light commercial vehicles (LCV) (and minibus sales) did not fluctuate significantly during the first nine months of 2012 compared to prior year: sales of domestic LCVs registered a total decrease by 4.4%, to 1,800 units, while the imported LCVs sales registered a total decrease by only 0.4%, to 6,760 units. Total LCV sales during the first nine months of 2012 were 8,560 units, lower by only 1.2% compared to the corresponding period from 2011. The segmentation by type of fuel of sales of new vehicles during the first nine months of 2012 shows a 49.8% - 50.2% split between gasoline and diesel, compared to a 60.2% - 39.8% corresponding split in 2011.
The automotive market continues therefore the decrease started during years 2008-2009. While total sales of new vehicles during 2011 were 106,617 units (passenger cars, LCVs and minibus sales), the estimation for current year sales is only around 92,000 new vehicles, according to APIA. However, based on the trend of actual sales during the first nine months of the year, the actual results may be lower at year end. The main causes for the decrease of the auto market are the late launch of the Program
MCR AUTOMOTIVE INDUSTRY
changing gear or changing lanes?Ariadna Oslobeanu, Senior Manager, Assurance & Advisory Business Services, Ernst & Young
The Romanian automotive industry:
Sales of passenger cars by brand, in units and percentages Sales of light commercial vehicles by brand, in units and percentages
DACIA 14,292
27%
VOLKSWAGEN 6,038 11%
SKODA 4,915
9% RENAULT 3,599
7%
FORD 3,480
6%
HYUNDAI 2,423
5%
OPEL 1,829
3%
TOYOTA 1,747
3%
BMW 1,511
3%
PEUGEOT 1,510
3%
Other 12,238
23% DACIA 1,838 22%
FORD 1,385 16%
VOLKSWAGEN 921 11% RENAULT
895 10%
FIAT 871 10%
PEUGEOT 574 7%
CITROEN 553 6%
MERCEDES BENZ 501 6%
NISSAN 253 3%
IVECO 209 2%
Other 560 7%

for encouraging the renewal of national auto park (Rabla), but also the reduced buying power and the increased imports of second-hand vehicles during the last years. Although Rabla Program continues to have a positive impact on sales, the program is below market expectations.
For Rabla Program 2012, the Environment Fund Administration allocated a budget of RON 114 million, which allows scrappage of 30,000 vehicles older than 10 years. This translates into sales of only 10,000 new vehicles (for acquisition of a new vehicle can be used maximum 3 vouchers), representing a quarter of the sales made through this program. As in 2010 and 2011, the value of the scrappage premium is RON 3,800, being the nominal value of one voucher. A number of 25,964 vehicles older than 10 years were scrapped through the initial phase of Rabla Program 2012 that started on 5 April 2012, and a number of 8,006 new vehicles were acquired, out of which 3,661 from domestic production. A second phase of Rabla Program 2012 was launched on 8 August 2012, for which the Environment Fund Administration allocated a budget of RON 57 million, allowing the scrappage of additional 15,000 vehicles older than 10 years. Still, total sales of new vehicles during the first nine months of 2012 through this program are significantly lower compared to the same period in 2011. PRODUCTIONThe national production of new vehicles registered a total decrease by 4.7% (to 239,153 units) up to the end of September 2012 – by 1.4% in passenger cars (to 227,952 units) and by 43.3% (to 11,187 units) in LCVs.
Besides the impact of lower demand from domestic market, the decrease was also determined by the discontinued production of model Ford Transit Connect, which was replaced by the new multi-activity vehicle Ford B-MAX, for which production was officially launched in June 20122. Ford B-MAX is the first car to be built at Craiova and will be manufactured exclusively in the Romanian plant. It is estimated that approximately 60,000 vehicles will be produced until the end of this year. Also, the production of Logan Pick-up was discontinued in May 2012, after almost 5 years of production of this model. Logan Pick-up was launched in 2007 and during the 5 years of production, Dacia produced a number of 31,341 vehicles, out of which 75% were exported (main markets were France and Turkey). Over 6,700 vehicles were sold in Romania.
In addition, Dacia launched Dacia Lodgy in June 2012 and Dokker (the combi family model Dokker and the utilitary vehicle Dokker VAN) in September 2012, both of which are being produced in Marocoo. As a result, the production of Logan VAN was discontinued at Mioveni at the beginning of August 2012 and it is expected that the production of Logan MCV (break) will also be discontinued towards the end of 2012. Since the launch in 2007 and until August this year at Mioveni were assembled in total over 53,000 units of Logan VAN. Given the expected launch of the new Logan and Sandero models, the production of the
current Logan (sedan) is also expected to be discontinued at Mioveni. Thus, Dacia production plant from Romania will remain with only three models instead of six in prior year, while the spare production capacity will be most probably taken over by the Duster model.
EXPORTSExports of new vehicles during the nine months of 2012 (233,728 units) are higher by 3.9% compared to the same period in 2011. The increase is being driven by the higher export of passenger cars by 8% (223,619 units in 2012 compared with 207,108 units in 2011), while the exports of LCVs were lower by 43.1% (10,109 units in 2012 compared with 17,774 units in 2011). The decrease recorded by LCVs has the same main cause, the discontinuance of production of model Ford Transit Connect. However, it is expected that the new Ford B-MAX will contribute to an increase in the volumes of exports during the last quarter of the year. As the domestic demand continues to be extremely low, the share of the exports in total production increased during 2012, representing 97.7% at the end of September 2012 (89.6% in 2011).
IMPORTSImports of new vehicles during the first nine months decreased by 19.1% (to 39,374 units) for passenger cars, while it increased by 0.7% (to 6,248 units) for LCVs, compared to the same period in 2011. However, the imports of second-hand vehicles continued to increase significantly during 2012. APIA stated in June 2012 that the imports of second-hand vehicles increased by 66% during the first half of the year, compared with 2011, and that the majority of these second-hand vehicles is more than 10 years old (45% of passenger cars and 60% of commercial vehicles). In Romania, the imports of second-hand vehicles are approximately 2.5 times higher than imports of new vehicles, while the mature markets of Europe show a reverse ratio: 1 second-hand vehicle for each 3 new vehicles.
SUPPLIERSAccording to BMI, industry data suggest that Romania boasts a strong integrated supply base with the presence of nearly 500 suppliers, employing around 100,000 staff. Traditionally, the segment has been dominated by electric systems manufacturers, but this is rapidly changing as a host of foreign players such as Michelin to Autoliv have gradually set up production in Romania. However, BMI research shows that much of this investment has been fairly unbalanced, as suppliers are mostly concentrated in the western part of Romania, where numerous industrial parks host vehicle manufacturers. More recently, however, the southern part of the country has emerged as an alternative region on the back of various investments. Another major concern for the parts segment is the low level of orders from carmakers due to slow recovery in auto production, which may delay new investments in the country. BMI believes that Romania offers huge potential for the parts segment. It is strategically placed to serve demand in Western and Eastern Europe and an improved regulatory structure following EU accession has made it an attractive destination for investment.
1812012 EDITION Major Companies in Romania

Automotive market in Romania saw in the last years a real crash, plummeting to levels comparable with those recorded in the mid 90’s. In order to sketch the scale of this market, it is enough to mention that car sales in Romania equal the sales registered by Slovakia, a country with a population four times smaller.
In this context, the main change that widened over the last two years is related to the growing share of corporate customers within the total car sales.
Basically, now, individuals represent barely a quarter within the total sales of new cars. The rest is represented by companies or institutions acquiring larger or smaller fleets.
I estimate this trend to continue in 2013…
THE CAR – A LONG TERM INVESTMENT IN ROMANIA In Romania, the purchase of a car is perceived as a long term investment. Romanian buyers keep a car for on average period of 11 years, compared to the average rate in Western Europe, of 6 years at most. Hence, Romanian buyers tend to invest time and resources in informing themselves before performing an acquisition and the selection process is rigorous.
Obviously, there is a share of wealthy customers that has been less affected
by the crisis. For them, the image is the main benchmark in selecting a car and usually, that car will be an expensive and a premium brand.
However, for the mainstream buyers, the major criteria in choosing a car are the costs related to operating and maintenance, the fuel consumption, comfort, reliability and durability of a vehicle.
THE NOVELTY FACTOR STILL MATTERSAs I mentioned before, the car market in Romania crosses a very difficult period and the return towards growth is still not definite for the next year. The sole certainty is that the novelty factor still matters to buyers.
Within this context, Dacia has the youngest range of cars in Europe, covering segments with growth potential as SUVs, light utility vehicles and family vehicles and this represents a major asset fort the company. In order to better lighten my statement is that 70 percent of our local production in Romania is exported on the Western European markets.
The car market in Romania is still dominated by used cars, their sale being double compared to the sales of new cars.
Unfortunately, this phenomenon contributes to the aging of the national fleet car in Romania, already being one of the oldest in Europe.
The return to growth
MIHAI BORDEANU,Marketing Director Dacia & Renault Romania
It is hard to estimate now the contribution of automotive sector to Romania’s GDP until the year-end, when official statistics are available.
In my opinion, Romania needs a healthy car market and the return to growth depends on the stability and predictability of the legislative and fiscal policies, conveying also a more stable economic landscape.
MCR Opinion
“ROMANIA NEEDS A HEALTHY CAR MARKET AND THE RETURN TO GROWTH DEPENDS ON THE STABILITY AND PREDICTABILITY OF THE LEGISLATIVE AND FISCAL POLICIES.”

AUTOMOTIVE PRODUCERS&IMPORTERSRANK COMPANY NAME MCR SCORING ANNUAL TURNOVER
( 2011 RON)TURNOVER
RANKINGPROFIT/LOSS
(2011 RON)NO OF
EMPLOYEES CONTACT
1 AUTOMOBILE DACIA SA 4.500 13,177,841,584 1 275,111,397 13,652 Mioveni, ARGES
2 PORSCHE ROMANIA SRL 3.538 1,798,618,534 2 114,723,266 150 Voluntari, ILFOV
3 MERCEDES-BENZ ROMANIA SRL 3.288 764,704,445 4 26,137,904 136 Bucuresti, Sector 1
4 TRUST MOTORS SRL 2.838 248,839,423 8 10,898,148 75 Bucuresti, Sector 6
5 FORD ROMANIA SA 2.713 797,674,088 3 -471,350,988 3,501 Craiova, DOLJ
6 EVW HOLDING SRL 2.625 293,419,941 7 13,454,707 436 Gilau, CLUJ
7 IVECO ROMANIA SRL 2.450 203,554,231 9 4,118,112 25 Bucuresti, Sector 1
9 AUTOMOBILE BAVARIA SRL 2.388 377,483,875 6 3,894,889 181 Otopeni, ILFOV
8 TOYOTA ROMANIA SRL 2.388 478,104,096 5 2,691,389 63 Voluntari, ILFOV
10 ROMAN SA 2.125 47,711,012 20 -6,192,368 450 Brasov, BRASOV
11 PREMIUM AUTO SRL 2.000 103,070,372 16 4,689,430 31 Bucuresti, Sector 1
12 M CAR TRADING SRL 1.950 122,014,764 14 909,929 41 Bucuresti, Sector 1
13 ASTRA BUS SRL 1.888 27,569,544 23 44,260 60 Arad, ARAD
14 AUTO ITALIA IMPEX SRL 1.800 201,976,541 10 -1,928,261 0 Bucuresti, Sector 2
15 HYUNDAI AUTO ROMANIA SRL 1.738 189,643,713 11 1,908,328 53 Bucuresti, Sector 1
16 SUBARU MOTORS TRADING SRL 1.650 28,999,000 22 37,613 30 Bucuresti, Sector 1
17 VOLVO ROMANIA SRL 1.638 168,929,292 12 -3,606,619 215 Bucuresti, Sector 6
18 ROMCAR MOTORS SRL 1.588 84,618,079 17 -4,399,169 123 Bucuresti, Sector 1
19 GERMAN TOP TRADING SRL 1.538 39,776,278 21 1,578,729 65 Bucuresti, Sector 3
20 KIA ROMAUTO SRL 1.500 60,264,265 19 298,719 46 Bucuresti, Sector 1
21 CITROEN ROMANIA SRL 1.450 113,138,783 15 1,603,540 39 Bucuresti, Sector 1
22 DURA AUTOMOTIVE ROMANIA SRL 1.325 124,195,291 13 -241,097 501 Ghiroda, TIMIS
23 HONDA TRADING ROMANIA SRL 1.300 61,756,005 18 -6,594,121 19 Bucuresti, Sector 2
1832012 EDITION Major Companies in Romania
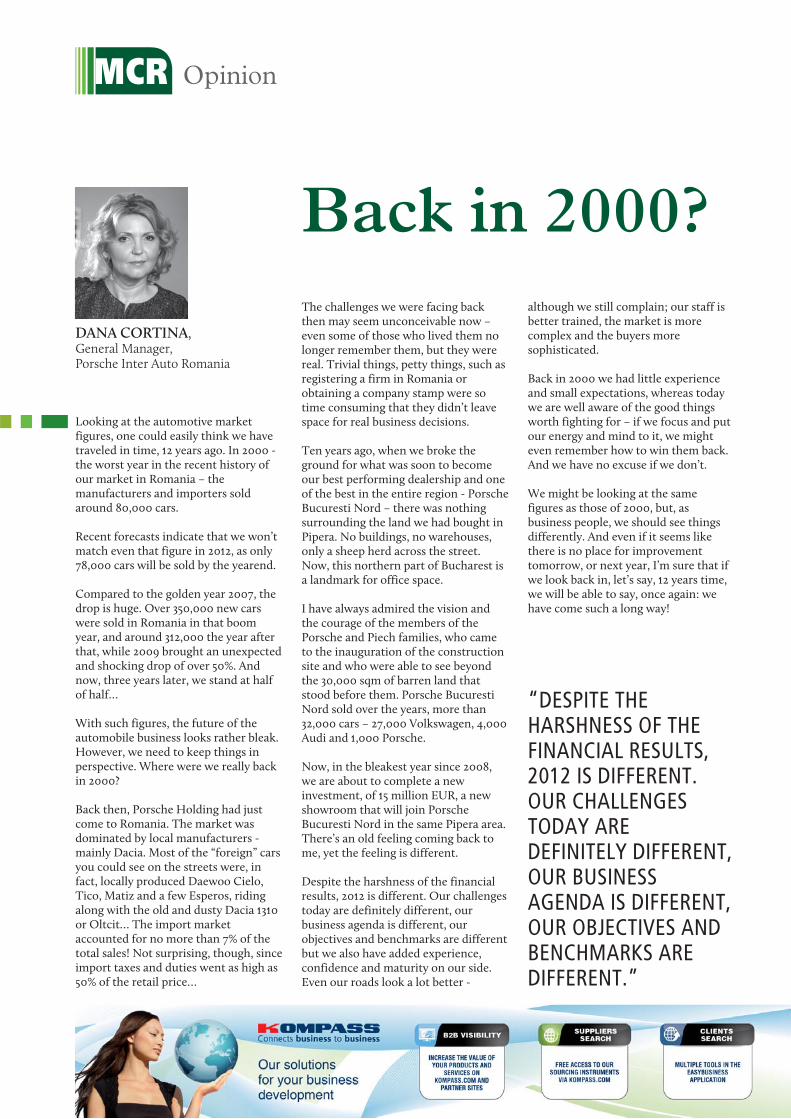
Looking at the automotive market figures, one could easily think we have traveled in time, 12 years ago. In 2000 - the worst year in the recent history of our market in Romania – the manufacturers and importers sold around 80,000 cars.
Recent forecasts indicate that we won’t match even that figure in 2012, as only 78,000 cars will be sold by the yearend.
Compared to the golden year 2007, the drop is huge. Over 350,000 new cars were sold in Romania in that boom year, and around 312,000 the year after that, while 2009 brought an unexpected and shocking drop of over 50%. And now, three years later, we stand at half of half…
With such figures, the future of the automobile business looks rather bleak. However, we need to keep things in perspective. Where were we really back in 2000?
Back then, Porsche Holding had just come to Romania. The market was dominated by local manufacturers - mainly Dacia. Most of the “foreign” cars you could see on the streets were, in fact, locally produced Daewoo Cielo, Tico, Matiz and a few Esperos, riding along with the old and dusty Dacia 1310 or Oltcit… The import market accounted for no more than 7% of the total sales! Not surprising, though, since import taxes and duties went as high as 50% of the retail price…
The challenges we were facing back then may seem unconceivable now – even some of those who lived them no longer remember them, but they were real. Trivial things, petty things, such as registering a firm in Romania or obtaining a company stamp were so time consuming that they didn’t leave space for real business decisions.
Ten years ago, when we broke the ground for what was soon to become our best performing dealership and one of the best in the entire region - Porsche Bucuresti Nord – there was nothing surrounding the land we had bought in Pipera. No buildings, no warehouses, only a sheep herd across the street. Now, this northern part of Bucharest is a landmark for office space.
I have always admired the vision and the courage of the members of the Porsche and Piech families, who came to the inauguration of the construction site and who were able to see beyond the 30,000 sqm of barren land that stood before them. Porsche Bucuresti Nord sold over the years, more than 32,000 cars – 27,000 Volkswagen, 4,000 Audi and 1,000 Porsche.
Now, in the bleakest year since 2008, we are about to complete a new investment, of 15 million EUR, a new showroom that will join Porsche Bucuresti Nord in the same Pipera area. There’s an old feeling coming back to me, yet the feeling is different.
Despite the harshness of the financial results, 2012 is different. Our challenges today are definitely different, our business agenda is different, our objectives and benchmarks are different but we also have added experience, confidence and maturity on our side. Even our roads look a lot better -
MCR Opinion
Back in 2000?
DANA CORTINA,General Manager,Porsche Inter Auto Romania
although we still complain; our staff is better trained, the market is more complex and the buyers more sophisticated.
Back in 2000 we had little experience and small expectations, whereas today we are well aware of the good things worth fighting for – if we focus and put our energy and mind to it, we might even remember how to win them back. And we have no excuse if we don’t.
We might be looking at the same figures as those of 2000, but, as business people, we should see things differently. And even if it seems like there is no place for improvement tomorrow, or next year, I’m sure that if we look back in, let’s say, 12 years time, we will be able to say, once again: we have come such a long way!
“DESPITE THE HARSHNESS OF THE FINANCIAL RESULTS, 2012 IS DIFFERENT. OUR CHALLENGES TODAY ARE DEFINITELY DIFFERENT, OUR BUSINESS AGENDA IS DIFFERENT, OUR OBJECTIVES AND BENCHMARKS ARE DIFFERENT.”

CAR DEALERSRANK COMPANY NAME MCR SCORING ANNUAL TURNOVER
( 2011 RON)TURNOVER
RANKINGPROFIT/LOSS
(2011 RON)NO OF
EMPLOYEES CONTACT
1 PORSCHE INTER AUTO ROMANIA SRL 2.875 636,456,271 1 5,915,195 521 Tunari, ILFOV
2 MHS TRUCK & BUS SRL 2.788 376,513,172 5 14,112,199 135 Bucuresti, Sector 6
3 BMW VERTRIEBS GMBH SALZBURG SUCURSALA BUCURESTI
2.500 439,260,529 3 25,317,860 11 Bucuresti, Sector 1
4 CEFIN ROMANIA SRL 2.475 429,536,743 4 -3,808,713 532 Bucuresti, Sector 1
5 RENAULT COMMERCIAL ROUMANIE SRL 2.388 619,656,281 2 14,177,119 132 Bucuresti, Sector 6
6 CASA AUTO SRL 2.375 201,605,343 8 -5,332,217 295 Bucuresti, Sector 1
7 AUTOKLASS CENTER SRL 2.275 217,945,735 6 -4,968,999 323 Bucuresti, Sector 4
8 RADACINI MOTORS SRL 2.188 203,197,350 7 7,306,893 220 Bucuresti, Sector 6
9 AVIA MOTORS SRL 2.088 93,053,959 16 5,310,067 182 Pantelimon, ILFOV
10 SCANIA ROMANIA SRL 2.038 150,081,781 10 675,142 110 Ciorogarla, ILFOV
11 AUTOWORLD SRL 1.988 99,255,025 14 1,029,481 136 Cluj-Napoca, CLUJ
12 AUTO SCHUNN SRL 1.988 68,921,026 26 1,460,844 92 Arad, ARAD
13 EUROSPEED SRL 1.938 69,799,435 25 721,762 60 Suceava, SUCEAVA
14 CTE TRAILERS SRL 1.900 68,330,041 27 794,516 36 Ciorogarla, ILFOV
15 NURVIL SRL 1.888 97,885,519 15 1,883,959 178Ramnicu Valcea,
VALCEA
16 BRADY TRADE SRL 1.888 78,570,453 21 2,029,402 123 Bucuresti, Sector 6
17 RMB INTER AUTO SRL 1.838 108,010,661 13 3,679,317 228 Cluj-Napoca, CLUJ
18 CASA AUTO SRL 1.838 53,325,106 34 28,169 103 Iasi, IASI
19 COLINA MOTORS SRL 1.788 59,362,636 32 -2,407,725 136 Bucuresti, Sector 1
20 SERVICE AUTO SERUS SRL 1.775 91,457,673 17 7,481,970 309 Bucuresti, Sector 6
21 MIDOCAR SRL 1.688 184,393,884 9 -462,149 247 Bucuresti, Sector 1
22 RMB CASA AUTO TIMISOARA SRL 1.688 83,789,843 19 102,250 96 Timisoara, TIMIS
23 AUTO ALEX SRL 1.688 50,333,175 38 1,265,525 98Moldova Noua,
CARAS-SEVERIN
24 EURIAL INVEST SRL 1.675 127,159,852 12 1,523,807 434 Bucuresti, Sector 6
25 EURO INTER TRADE CORPORATION SRL 1.650 62,658,069 29 2,561,302 16 Bucuresti, Sector 1
26 DELCAR SRL 1.638 64,592,543 28 12,200 120 Ghimbav, BRASOV
27 D & C IMPEX SRL 1.588 75,693,079 22 -354,001 109 Oradea, BIHOR
28 DUMATRUCKS SRL 1.588 54,496,135 33 1,097,629 161 Podari, DOLJ
29 DI - BAS AUTO SRL 1.588 50,376,871 37 1,032,338 75 Bucuresti, Sector 2
30 PROTRUCK INTERNATIONAL SRL 1.488 86,725,181 18 -1,701,377 163 Jilava, ILFOV
31 EURO TEHNO GROUP SRL 1.488 72,136,408 24 544,226 132 Pitesti, ARGES
32 CYBERNET AUTO CENTER SRL 1.488 61,881,076 31 410,956 102 Bacau, BACAU
33 MIT MOTORS INTERNATIONAL SRL 1.488 52,625,549 35 486,007 77 Bucuresti, Sector 1
34 TIRIAC AUTO SA 1.388 141,062,438 11 -1,591,723 232 Bucuresti, Sector 1
35 BUSINESS DEVELOPMENT TEAM SRL 1.388 82,813,420 20 -9,088,286 131 Bucuresti, Sector 6
36 INCHCAPE MOTORS SRL 1.338 50,470,086 36 -70,889 77 Voluntari, ILFOV
37 TESS SRL 1.288 75,572,116 23 5,492 131 Ghimbav, BRASOV
38 AUTO COBALCESCU SRL 1.175 62,213,150 30 -2,292,888 707 Bucuresti, Sector 1
1852012 EDITION Major Companies in Romania

AUTOMOTIVE PARTS PRODUCERS RANK COMPANY NAME MCR SCORING ANNUAL TURNOVER
( 2011 RON)TURNOVER
RANKINGPROFIT/LOSS
(2011 RON)NO OF
EMPLOYEES CONTACT
1 PIRELLI TYRES ROMANIA SRL 4.013 1,501,679,442 6 94,411,056 1,890 Slatina, OLT
2 TAKATA ROMANIA SRL 3.913 1,522,320,748 5 46,228,727 4,230 Arad, ARAD
3 AUTOLIV ROMANIA SRL 3.813 1,911,619,925 3 160,959,700 3,101 Brasov, BRASOV
4 CONTINENTAL AUTOMOTIVE PRODUCTS SRL 3.650 2,224,673,603 1 202,239,107 0 Timisoara, TIMIS
5 DELPHI PACKARD ROMANIA SRL 3.650 1,700,702,239 4 34,612,356 9,812Sannicolau Mare,
TIMIS
6 MICHELIN ROMANIA SA 3.563 2,146,783,116 2 44,927,593 2,657 Bucuresti, Sector 1
7 DELPHI DIESEL SYSTEMS ROMANIA SRL 3.463 1,317,523,227 7 47,686,003 2,070 Bratuleni, IASI
8 JOHNSON CONTROLS ROMANIA SRL 3.363 1,119,868,177 10 -10,661,767 3,350 Mioveni, ARGES
9 TRW AUTOMOTIVE SAFETY SYSTEMS SRL 3.313 878,392,258 12 23,484,769 2,788 Timisoara, TIMIS
10 CONTINENTAL AUTOMOTIVE SYSTEMS SRL 3.263 1,264,430,015 8 -104,789,414 1,577 Sibiu, SIBIU
11 CONTINENTAL AUTOMOTIVE ROMANIA SRL 3.263 1,139,142,245 9 -150,597,676 3,461 Timisoara, TIMIS
12 SEWS ROMANIA SRL 3.200 905,507,808 11 5,699,559 6974 Deva, Hunedoara
13 COMPA SA 3.113 475,420,370 18 17,369,837 1,782 Sibiu, SIBIU
14 CRH ROMANIA SRL 2.975 383,968,466 23 29,874,301 550 Jimbolia, TIMIS
15 CONTITECH FLUID AUTOMOTIVE ROMANIA SRL 2.963 509,780,658 17 40,536,731 1,230 Carei, SATU MARE
16 KROMBERG &SCHUBERT ROMANIA SRL 2.963 360,789,334 24 5,492,288 1,955 Timisoara, TIMIS
17 MW ROMANIA SA 2.925 231,000,062 31 25,479,269 337 Dragasani, VALCEA
18 PREH ROMANIA SRL 2.875 216,340,379 33 9,736,777 324 Ghimbav, BRASOV
19 LEONI WIRING SYSTEMS RO SRL 2.863 664,314,181 13 16,838,477 3,413Bistrita,
BISTRITA-NASAUD
20 CONTITECH ROMANIA SRL 2.863 646,344,364 14 106,239,205 1,554 Timisoara, TIMIS
21 YAZAKI ROMANIA SRL 2.863 612,330,127 15 15,317,650 3,489 Ploiesti, PRAHOVA
22 CORTUBI SRL 2.838 431,773,722 21 5,322,664 122 Mioveni, ARGES
23 EURO AUTO PLASTIC SYSTEMS SRL 2.825 436,829,312 20 35,942,357 667 Mioveni, ARGES
24 HELLA ROMANIA SRL 2.775 592,357,122 16 31,240,868 928Sannicolau Mare,
TIMIS
25 GLOBAL E-BUSINESS OPERATIONS CENTRE SRL 2.763 274,220,700 28 27,755,616 2594 Bucuresti, Sector 2
26 LISA DRAXLMAIER AUTOPART ROMANIA SRL 2.713 295,424,439 27 8,831,594 3,515 Pitesti, ARGES
27 3M ROMANIA SRL 2.688 267,863,415 29 43,900,023 70 Bucuresti, Sector 1
28 BOS AUTOMOTIVE PRODUCTS ROMANIA SCS 2.675 304,484,903 25 16,333,470 855 Arad, ARAD
29 VALEO SISTEME TERMICE SRL 2.588 216,831,594 32 18,995,195 99 Mioveni, ARGES
30 ROBERT BOSCH SRL 2.538 251,282,400 30 5,042,173 163 Bucuresti, Sector 1
31 TAKATA-PETRI SIBIU SRL 2.513 398,308,814 22 67,925,332 2,159 Sibiu, SIBIU
32 LEAR CORPORATION ROMANIA SRL 2.513 298,924,490 26 6,742,398 1,679 Pitesti, ARGES
33 RENAULT MECANIQUE ROUMANIE SRL 2.475 473,451,143 19 9,963,363 638 Mioveni, ARGES
34 ECKERLE AUTOMOTIVE SRL 2.375 147,814,021 41 1,671,928 678 Cluj-Napoca, CLUJ
35 LEONI WIRING SYSTEMS PITESTI SRL 2.275 190,558,453 36 9,217,196 716 Pitesti, ARGES
36 WEBASTO ROMANIA SRL 2.238 196,832,878 35 13,236,302 204 Zimandu Nou, ARAD
37 TMD FRICTION ROMANIA SRL 2.225 197,249,568 34 38,813,775 400Caransebes,
CARAS-SEVERIN
38 HIRSCHMANN ROMANIA SRL 2.225 161,951,126 37 5,474,455 894 Sanpaul, MURES
39 DRM DRAXLMAIER ROMANIA SISTEME ELECTRICE SRL
2.213 149,618,566 40 7,200,102 4,229Satu Mare, SATU
MARE
40 TRELLEBORG AUTOMOTIVE SRL 1.938 143,879,544 42 8,538,955 205 Dej, CLUJ
41 HONEYWELL GARRETT SRL 1.925 152,777,500 39 13,468,737 534 Bucuresti, Sector 6
42 QUIN ROMANIA SRL 1.875 155,659,429 38 8,439,895 733 Ghimbav, BRASOV
43 THYSSENKRUPP BILSTEIN COMPA SA 1.825 140,237,182 43 4,055,833 449 Sibiu, SIBIU
MCR AUTOMOTIVE INDUSTRY

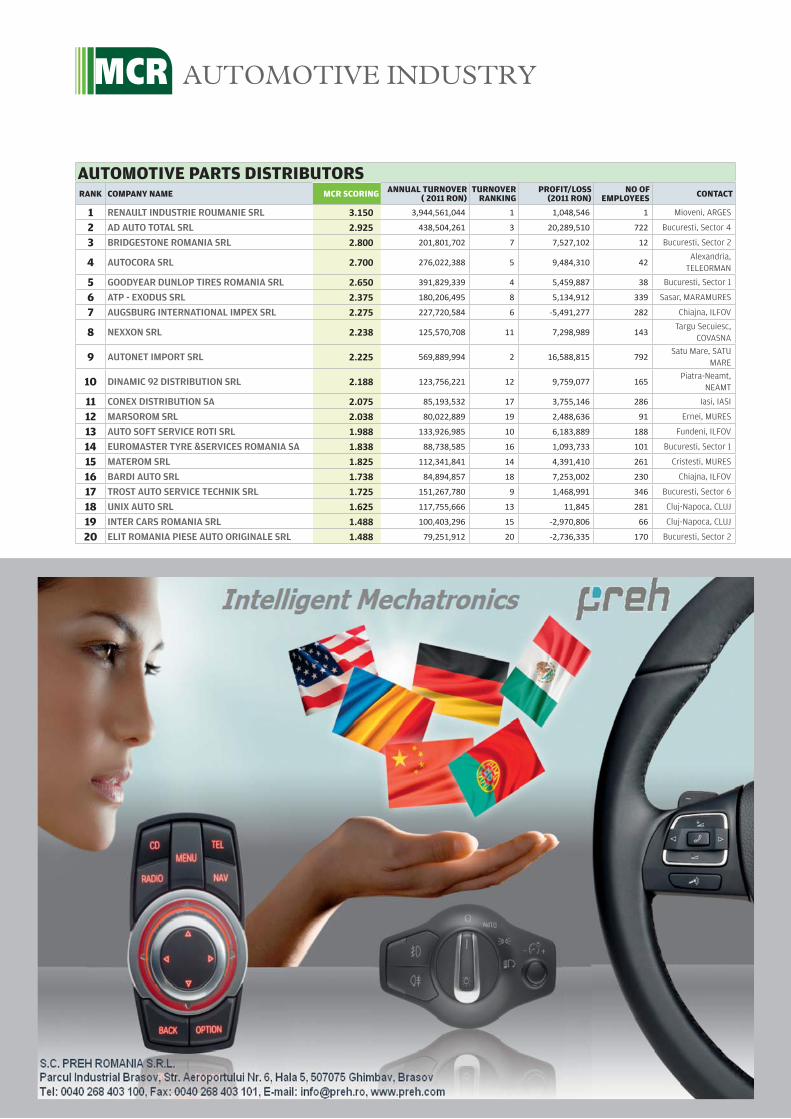
MCR AUTOMOTIVE INDUSTRY
AUTOMOTIVE PARTS DISTRIBUTORSRANK COMPANY NAME MCR SCORING ANNUAL TURNOVER
( 2011 RON)TURNOVER
RANKINGPROFIT/LOSS
(2011 RON)NO OF
EMPLOYEES CONTACT
1 RENAULT INDUSTRIE ROUMANIE SRL 3.150 3,944,561,044 1 1,048,546 1 Mioveni, ARGES
2 AD AUTO TOTAL SRL 2.925 438,504,261 3 20,289,510 722 Bucuresti, Sector 4
3 BRIDGESTONE ROMANIA SRL 2.800 201,801,702 7 7,527,102 12 Bucuresti, Sector 2
4 AUTOCORA SRL 2.700 276,022,388 5 9,484,310 42Alexandria,
TELEORMAN
5 GOODYEAR DUNLOP TIRES ROMANIA SRL 2.650 391,829,339 4 5,459,887 38 Bucuresti, Sector 1
6 ATP - EXODUS SRL 2.375 180,206,495 8 5,134,912 339 Sasar, MARAMURES
7 AUGSBURG INTERNATIONAL IMPEX SRL 2.275 227,720,584 6 -5,491,277 282 Chiajna, ILFOV
8 NEXXON SRL 2.238 125,570,708 11 7,298,989 143Targu Secuiesc,
COVASNA
9 AUTONET IMPORT SRL 2.225 569,889,994 2 16,588,815 792Satu Mare, SATU
MARE
10 DINAMIC 92 DISTRIBUTION SRL 2.188 123,756,221 12 9,759,077 165Piatra-Neamt,
NEAMT
11 CONEX DISTRIBUTION SA 2.075 85,193,532 17 3,755,146 286 Iasi, IASI
12 MARSOROM SRL 2.038 80,022,889 19 2,488,636 91 Ernei, MURES
13 AUTO SOFT SERVICE ROTI SRL 1.988 133,926,985 10 6,183,889 188 Fundeni, ILFOV
14 EUROMASTER TYRE &SERVICES ROMANIA SA 1.838 88,738,585 16 1,093,733 101 Bucuresti, Sector 1
15 MATEROM SRL 1.825 112,341,841 14 4,391,410 261 Cristesti, MURES
16 BARDI AUTO SRL 1.738 84,894,857 18 7,253,002 230 Chiajna, ILFOV
17 TROST AUTO SERVICE TECHNIK SRL 1.725 151,267,780 9 1,468,991 346 Bucuresti, Sector 6
18 UNIX AUTO SRL 1.625 117,755,666 13 11,845 281 Cluj-Napoca, CLUJ
19 INTER CARS ROMANIA SRL 1.488 100,403,296 15 -2,970,806 66 Cluj-Napoca, CLUJ
20 ELIT ROMANIA PIESE AUTO ORIGINALE SRL 1.488 79,251,912 20 -2,736,335 170 Bucuresti, Sector 2

Professional Services LEGAL MANAGEMENT CONSULTING COMPANIES ACCOUNTING, AUDIT, FAS & TAX EXECUTIVE SEARCH, RECRUITMENT AND HR MANAGEMENT TRAINING COMPANIES MARKET RESEARCH COMPANIES BUSINESS PROCESS OUTSOURCING
1912012 EDITION Major Companies in Romania
16%the flat-tax, applied both for individuals and commercials, is one of the main triggers for foreign investments

Take a market, any market, and try to assess its strong points as well as reveal the weak links that may hinder potential business development.
Teamwork, in such cases, becomes more than just a fancy, politically correct concept that board members like to hear about when presented with a strategy plan. It becomes a must-have in blurry business environments, the one thing any potential investor has to make work.
Fade in to the otherwise bad-mouthed ‘partners in crime’ that make such plans actually come to fruition. We now get to meet the often-despised lawyers, auditors, management advisers or headhunters, who have built up a network so strong that things actually start to appear brighter.
WHEN LAWYER JOKES ARE NO LONGER APPROPRIATE…Romania’s development over the last 23 years has been to the advantage of commercial law firms, with the shock treatment of rapid privatization and a mad rush from foreign investors seen in much of Central and Eastern Europe, meaning the legal industry in those nations grew massively in a short period of time.
The profession wins out when the good times roll, by fixing mergers and acquisitions and transactions and also when the bad times come, by dealing with liquidations and foreclosures.
The legal services market in Romania currently witness strong growth on the back of major deals in energy and dispute resolution.
Of course, with ‘crisis’ being everybody’s go-to word nowadays, challenges are popping out every given moment, but the legal market in Romania is viewed by most major players as a stable and mature enough one, highly competitive and yielding, if not hefty profits, at least solid basis for future development.
Although there is no official data that everyone can agree upon to confirm the top tier of law firms in Romania, they are understood to include names such as NNDKP, Tuca, Musat and Bostina – all Romanian-based firms. They have all managed to grow with the economy, continue to thrive and gain market recognition.
But there is competition in the form of a pincer movement: international firms scouting the market from above and a growing second tier of firms of young upstarts from below. With Romania becoming home to headline-making investment news in the past years, foreign counsel has followed suit, setting up shop locally to better serve the needs of their billion-Euro clients.
Along these lines, there is no doubt that commercial law has evolved into a distinctive branch of the legal profession, with ‘billing hours’ becoming one of the most popular ways to measure a lawyer’s productivity.
The demand for niche services in law will increase – but there still is dispute among the legal community as to whether Romania has a ‘critical lack’ of specialist lawyers, or whether it is still at the development stage where generalist lawyers are most necessary. With deals still in the making, and with every election year casting doubts on the natural functioning of any industry in Romania, one can only wait and see what’s in store for the years to come.
TAXATION, VIEW FROM A NEW PERSPECTIVE The reduction of trade barriers, the ease of moving goods and services around the globe via the internet, and modern transportation means that cross-border trading – once the preserve of a small group of multinational companies – is now part of mainstream business activity.
Such cross-border activity exposes businesses and the people they employ to taxes and tax systems in the jurisdictions where customers are based, which brings not only opportunity but also potential issues and conflict between tax systems.
Tax consultancy companies make their way to the front of the line in such cases, with never-ending changes to Romania’s fiscal code and procedural glitches keeping market players on their toes. These changes have made the role of tax advisers ever more crucial in helping businesses reach their desired destinations and avoiding the hazards.
Although Romania continues to be an attractive location for important investors, due to its reduced flat-rate tax of 16 per cent both for individuals and corporations, cheaper labour force, strategic location and natural resources, the recent
MCR PROFESSIONAL SERVICES
Circle of trust:relying on the right partner
Creating value. Achieving potential.
Corina Mica - Freelance Journalist

193
downturn in the economy has adversely affected the level of foreign investment. Investors are also discouraged by factors such as the unstable tax legislation or level of bureaucracy – which is indicated by the relatively high number of taxes and declarations a business must comply with.
WHEN FINDING THE RIGHT PEOPLE REALLY MAKES THE DIFFERENCEAnd yes, cheap labour force is another overused turn of phrase when referring to Romania’s most appealing assets.
But can cheap always mean better? How much does saving costs by paying low wages count in a company’s business plan?
A recent study by PricewaterhouseCoopers, dubbed ‘CEO Survey 2012’, reveals that Romanian managers believe more in a positive evolution of the businesses they run and are more sceptical with regards to the evolution of the global economy, expecting a new period filled with volatility and insecurities.
In a move to counteract the adverse effects of a climate flawed by political and economic instabilities, CEOs of large local companies say they need gifted managers and better prepared employees.
But Romania’s talent deficit still is a burning question for businesses wanting to grow their volumes, and, unfortunately, the Romanian education system offers less and less prepared graduates. The ‘brain drain’ seems more current than ever, when every young graduate’s dream is to leave this country and do whatever it takes to make it in other markets.
With such a background, recruiting firms in Romania are taking the extra step in tailoring results to requests that tend to produce low margins. Around 1,000 are employed in executive search and recruitment in Romania - while those employed in human resources are probably in the 10,000s.
On a side note, one extremely challenging and worth following experiment in Romania is the request by the International Monetary Fund - included in the agreement it signed with Romania for a loan worth 3.6 million Euro - to appoint private managers to several state-owned companies, in a move to instill private spirit into the ailing loss-making
mammoths that stall development. At present, the Ministry of Economy runs two parallel projects - the support of private executive search companies - with the aim of, on one hand, selecting CEOs and CFOs for some state companies and, on the other hand, of changing boards of administrators for others.
The question still remains: can such a circle of trust be built?
And who is the right partner to move forward with?
2012 EDITION Major Companies in Romania
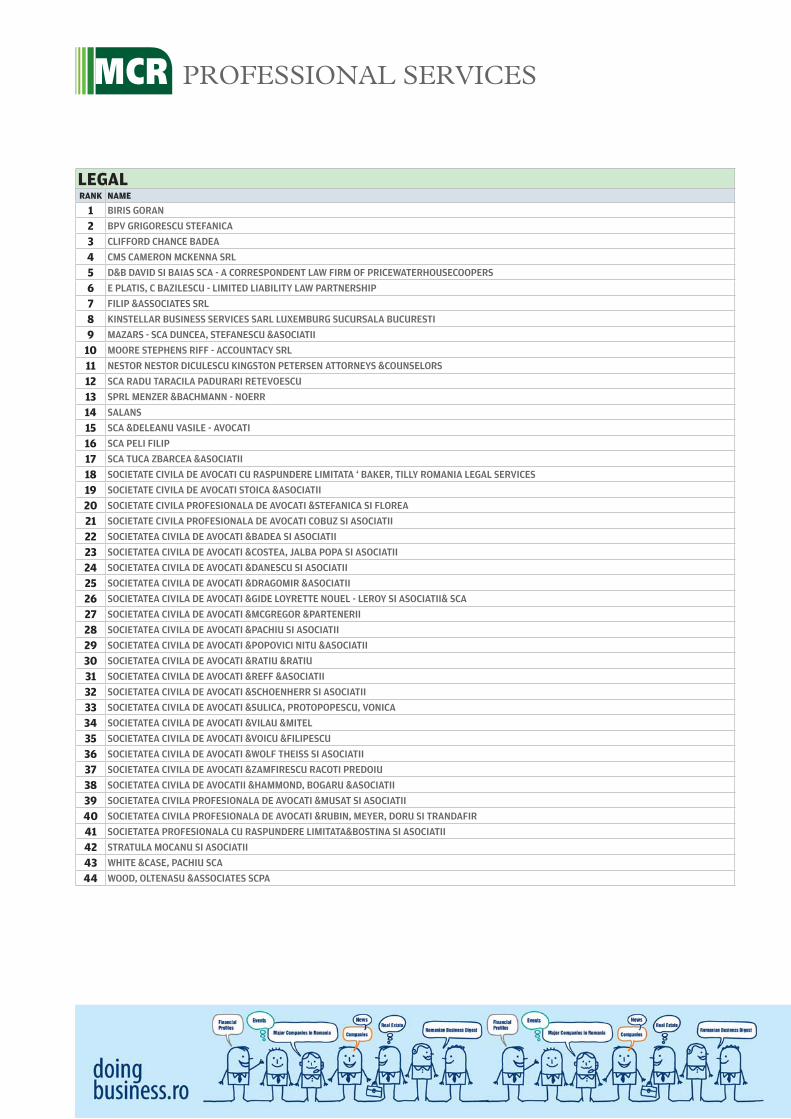
MCR PROFESSIONAL SERVICES
LEGALRANK NAME
1 BIRIS GORAN
2 BPV GRIGORESCU STEFANICA
3 CLIFFORD CHANCE BADEA
4 CMS CAMERON MCKENNA SRL
5 D&B DAVID SI BAIAS SCA - A CORRESPONDENT LAW FIRM OF PRICEWATERHOUSECOOPERS
6 E PLATIS, C BAZILESCU - LIMITED LIABILITY LAW PARTNERSHIP
7 FILIP &ASSOCIATES SRL
8 KINSTELLAR BUSINESS SERVICES SARL LUXEMBURG SUCURSALA BUCURESTI
9 MAZARS - SCA DUNCEA, STEFANESCU &ASOCIATII
10 MOORE STEPHENS RIFF - ACCOUNTACY SRL
11 NESTOR NESTOR DICULESCU KINGSTON PETERSEN ATTORNEYS &COUNSELORS
12 SCA RADU TARACILA PADURARI RETEVOESCU
13 SPRL MENZER &BACHMANN - NOERR
14 SALANS
15 SCA &DELEANU VASILE - AVOCATI
16 SCA PELI FILIP
17 SCA TUCA ZBARCEA &ASOCIATII
18 SOCIETATE CIVILA DE AVOCATI CU RASPUNDERE LIMITATA ‘ BAKER, TILLY ROMANIA LEGAL SERVICES
19 SOCIETATE CIVILA DE AVOCATI STOICA &ASOCIATII
20 SOCIETATE CIVILA PROFESIONALA DE AVOCATI &STEFANICA SI FLOREA
21 SOCIETATE CIVILA PROFESIONALA DE AVOCATI COBUZ SI ASOCIATII
22 SOCIETATEA CIVILA DE AVOCATI &BADEA SI ASOCIATII
23 SOCIETATEA CIVILA DE AVOCATI &COSTEA, JALBA POPA SI ASOCIATII
24 SOCIETATEA CIVILA DE AVOCATI &DANESCU SI ASOCIATII
25 SOCIETATEA CIVILA DE AVOCATI &DRAGOMIR &ASOCIATII
26 SOCIETATEA CIVILA DE AVOCATI &GIDE LOYRETTE NOUEL - LEROY SI ASOCIATII& SCA
27 SOCIETATEA CIVILA DE AVOCATI &MCGREGOR &PARTENERII
28 SOCIETATEA CIVILA DE AVOCATI &PACHIU SI ASOCIATII
29 SOCIETATEA CIVILA DE AVOCATI &POPOVICI NITU &ASOCIATII
30 SOCIETATEA CIVILA DE AVOCATI &RATIU &RATIU
31 SOCIETATEA CIVILA DE AVOCATI &REFF &ASOCIATII
32 SOCIETATEA CIVILA DE AVOCATI &SCHOENHERR SI ASOCIATII
33 SOCIETATEA CIVILA DE AVOCATI &SULICA, PROTOPOPESCU, VONICA
34 SOCIETATEA CIVILA DE AVOCATI &VILAU &MITEL
35 SOCIETATEA CIVILA DE AVOCATI &VOICU &FILIPESCU
36 SOCIETATEA CIVILA DE AVOCATI &WOLF THEISS SI ASOCIATII
37 SOCIETATEA CIVILA DE AVOCATI &ZAMFIRESCU RACOTI PREDOIU
38 SOCIETATEA CIVILA DE AVOCATII &HAMMOND, BOGARU &ASOCIATII
39 SOCIETATEA CIVILA PROFESIONALA DE AVOCATI &MUSAT SI ASOCIATII
40 SOCIETATEA CIVILA PROFESIONALA DE AVOCATI &RUBIN, MEYER, DORU SI TRANDAFIR
41 SOCIETATEA PROFESIONALA CU RASPUNDERE LIMITATA&BOSTINA SI ASOCIATII
42 STRATULA MOCANU SI ASOCIATII
43 WHITE &CASE, PACHIU SCA
44 WOOD, OLTENASU &ASSOCIATES SCPA

tunnel, since the beginning of the previous century, scientists have continuously developed the aerodynamic and aeroacoustic qualities ofmotor cars, airships and buildings. Today, excellent values ensure low consumption and longer useful life – Excellence Creating Value.
Noerr in Romania
EXCELLENCECREATING VALUE

ACCOUNTING, AUDIT, FAS AND TAXRANK COMPANY NAME
ANNUAL TURNOVER ( 2011 RON)
ANNUAL TURNOVER
(2010 RON)
ANNUAL TURNOVER GROWTH %
PROFIT/LOSS (2011 RON)
NO OF EMPLOYEES CONTACT
1 KPMG ROMANIA S.R.L. 109,563,568 125,134,620 -12.4% 1,931,320 438 Bucuresti, Sector 1
2 ERNST & YOUNG S.R.L. 83,552,164 69,664,758 19.9% 11,319,817 192 Bucuresti, Sector 1
3 PRICEWATERHOUSECOOPERS AUDIT S.R.L. 68,701,522 61,300,697 12.1% 246,204 279 Bucuresti, Sector 2
4 ERNST & YOUNG ASSURANCE SERVICES SRL 55,752,617 44,998,616 23.9% 1,027,259 168 Bucuresti, Sector 1
5 DELOITTE AUDIT S.R.L. 55,205,075 49,906,241 10.6% 2,710,394 205 Bucuresti, Sector 1
6 BRITISH AMERICAN SHARED SERVICES (EUROPE) SRL
50,948,546 48,822,334 4.4% -1,914,242 225 Bucuresti, Sector 6
7 PRICEWATERHOUSECOOPERS TAX ADVISORS & ACCOUNTANTS S.R.L.
50,448,931 51,127,239 -1.3% 4,183,679 152 Bucuresti, Sector 2
8 KPMG AUDIT SRL 38,057,563 35,164,886 8.2% 807,582 30 Bucuresti, Sector 1
9 KPMG TAX SRL 23,453,797 18,203,105 28.8% 2,392,708 69 Bucuresti, Sector 1
10 DELOITTE CONSULTANTA S.R.L. 23,196,617 27,559,583 -15.8% 315,236 61 Bucuresti, Sector 1
11 BDO AUDIT S.R.L. 20,011,214 23,188,292 -13.7% 3,989,727 99 Bucuresti, Sector 3
12 DELOITTE TAX S.R.L. 17,739,790 11,570,659 53.3% 3,048,538 52 Bucuresti, Sector 1
13 MIDOCAR CONSULTING S.R.L. 16,569,858 16,213,322 2.2% -3,539,204 59 Bucuresti, Sector 1
14 TMF ROMANIA S.R.L. 16,110,982 16,135,277 -0.2% 6,059,025 70 Bucuresti, Sector 4
15 SOTER SRL 9,607,896 9,530,421 0.8% 1,308,001 36 Bucuresti, Sector 1
16 NESTOR NESTOR DICULESCU KINGSTON PETERSEN CONSULTANTA FISCALA SRL
9,035,232 6,702,585 34.8% 507,283 13 Bucuresti, Sector 1
17 FIN EXPERT CONSULTING SRL 8,417,956 8,086,510 4.1% 1,105,433 41 Bucuresti, Sector 6
18 MAZARS CONSULTING S.R.L. 8,395,931 7,752,239 8.3% 2,490 48 Bucuresti, Sector 6
19 MAZARS ROMANIA S.R.L. 8,380,995 9,036,291 -7.3% -102,658 26 Bucuresti, Sector 6
20 A&F CLASSIC OFFICE SRL 8,231,305 8,758,421 -6.0% 568,715 10 Bucuresti, Sector 1
21 RSM SCOT S.R.L. 5,916,853 5,435,434 8.9% 589,956 40 Bucuresti, Sector 1
22 BOSCOLO &PARTNERS CONSULTING SRL 5,865,401 7,443,360 -21.2% 1,058,139 33 Bucuresti, Sector 1
23 NOERR FINANCE & TAX S.R.L. 4,892,179 4,533,148 7.9% 1,342,963 11 Bucuresti, Sector 1
24 ROEDL & PARTNER OUTSOURCING S.R.L. 4,889,433 4,391,904 11.3% 776,883 38 Bucuresti, Sector 1
25 BG CONTA S.R.L. 3,304,454 3,506,329 -5.8% 108,678 12 Bucuresti, Sector 5
26 ACCACE EUROPE S.R.L. 3,240,580 3,462,384 -6.4% -118,038 22 Bucuresti, Sector 1
27 BAKER TILLY KLITOU AND PARTNERS SRL 3,201,564 3,461,358 -7.5% 586,275 20 Bucuresti, Sector 5
28 FIDEXPERT SRL 3,097,527 3,866,044 -19.9% 3,992 22 Bucuresti, Sector 3
29 ROEDL & PARTNER AUDIT S.R.L. 2,529,388 3,006,793 -15.9% -185,000 22 Bucuresti, Sector 1
30 TMF ACCOUNTING & PAYROLL S.R.L. 2,267,064 2,518,140 -10.0% 309,329 20 Bucuresti, Sector 4
BUSINESS PROCESS OUTSOURCINGRANK COMPANY NAME
ANNUAL TURNOVER ( 2011 RON)
ANNUAL TURNOVER
(2010 RON)
ANNUAL TURNOVER GROWTH %
PROFIT/LOSS (2011 RON)
NO OF EMPLOYEES CONTACT
1 GENPACT ROMANIA S.R.L. 220,997,557 194,123,647 13.8% 26,277,385 1571 Bucuresti, Sector 2
2 COMPUTER GENERATED SOLUTIONS ROMANIA S.R.L.
112,066,525 83,311,292 34.5% 18,779,606 2151 Bucuresti, Sector 6
3 WIPRO TECHNOLOGIES S.R.L. 93,100,221 93,933,500 -0.9% 7,952,431 858 Bucuresti, Sector 6
4 ACCENTURE SERVICES S.R.L. 41,662,609 40,188,730 3.7% 2,510,283 296 Bucuresti, Sector 2
5 AROBS TRANSILVANIA SOFTWARE S.R.L. 33,599,647 31,006,638 8.4% 4,272,570 219 Cluj-Napoca, CLUJ
6 I Q MANAGEMENT S.R.L. 19,309,399 15,228,511 26.8% 6,581,050 31 Petresti, ILFOV
7 SPAR BUSINESS IDEAS PROVIDER SRL 16,908,870 - 11,202 634 Bucuresti, Sector 1
8 NESS ROMANIA S.R.L. 16,531,227 40,694,227 -59.4% -2,833,221 53 Iasi, IASI
9 BERG COMPUTERS S.R.L. 12,298,482 9,130,420 34.7% 1,886,746 86 Ghiroda, TIMIS
10 IT SIX GLOBAL SERVICES S.R.L. 8,343,094 7,539,682 10.7% 1,832,471 70 Craiova, DOLJ
11 EVALUESERVE SRL 7,887,623 5,188,755 52.0% 518,841 55 Cluj-Napoca, CLUJ
12 ARCHITECTED BUSINESS SOLUTIONS S.R.L. 5,602,975 - 613,528 10 Bucuresti, Sector 2
MCR PROFESSIONAL SERVICES


MANAGEMENT CONSULTINGRANK COMPANY NAME
ANNUAL TURNOVER ( 2011 RON)
ANNUAL TURNOVER
(2010 RON)
ANNUAL TURNOVER GROWTH %
PROFIT/LOSS (2011 RON)
NO OF EMPLOYEES CONTACT
1 MCKINSEY & COMPANY S.R.L. 58,091,702 31,597,528 83.8% 5,549,781 25 Bucuresti, Sector 1
2 ACCENTURE CENTRAL EUROPE B.V AMSTERDAM, OLANDA-SUCURSALA BUCURESTI
41,081,110 43,477,674 -5.5% -250,602 57 Bucuresti, Sector 6
3 PRICEWATERHOUSECOOPERS SERVICII S.R.L. 39,285,464 44,759,295 -12.2% 1,439,584 95 Bucuresti, Sector 2
4 ACTIV EXPERT CONSULTANTA SI SERVICII SA 37,820,071 42,694,521 -11.4% 444,493 4 Buzau, BUZAU
5 HORVATH & PARTNERS MANAGEMENT CON-SULTING S.R.L.
29,265,563 40,622,882 -28.0% 2,662,865 26 Bucuresti, Sector 1
6 PRICEWATERHOUSECOOPERS MANAGEMENT CONSULTANTS S.R.L.
24,117,554 18,218,645 32.4% 1,376,048 48 Bucuresti, Sector 2
7 ROMCAPITAL INVEST S.A. 19,766,927 29,265,189 -32.5% 10,463,672 23 Bucuresti, Sector 1
8 A.T. KEARNEY MANAGEMENT CONSULTING S.R.L.
17,745,993 20,846,617 -14.9% -587,514 12 Bucuresti, Sector 1
9 ASCENDIS CONSULTING S.R.L. 14,155,755 10,997,109 28.7% 3,030,204 27 Bucuresti, Sector 1
10 ENSIGHT MANAGEMENT CONSULTING S.R.L. 12,244,156 15,300,385 -20.0% 1,886,916 27 Bucuresti, Sector 5
11 ROLAND BERGER STRATEGY CONSULTANTS S.R.L.
12,101,844 - -392,757 34 Bucuresti, Sector 2
12 CAPITAL PARTNERS S.R.L. 11,849,944 9,068,993 30.7% 5,374,388 12 Bucuresti, Sector 2
13 HAY GROUP MANAGEMENT CONSULTANTS S.R.L.
5,356,783 4,232,778 26.6% 708,619 11 Bucuresti, Sector 1
14 BPI MANAGEMENT CONSULTING ROMANIA S.R.L.
2,930,644 2,216,814 32.2% 347,570 24 Bucuresti, Sector 2
15 PIERRE AUDOIN CONSULTANTS S.R.L. 1,784,344 1,671,690 6.7% 30,866 15 Bucuresti, Sector 5
16 LARIVE ROMANIA INTERNATIONAL BUSINESS DEVELOPMENT S.R.L.
915,454 458,011 99.9% -225,068 2 Bucuresti, Sector 1
17 PLURI CONSULTANTS ROMANIA S.R.L. 846,876 971,450 -12.8% 69,453 15 Bucuresti, Sector 2
EXECUTIVE SEARCH, RECRUITMENT AND HR MANAGEMENTRANK COMPANY NAME
ANNUAL TURNOVER ( 2011 RON)
ANNUAL TURNOVER
(2010 RON)
ANNUAL TURNOVER GROWTH %
PROFIT/LOSS (2011 RON)
NO OF EMPLOYEES CONTACT
1 MANPOWER ROMANIA S.R.L. 112,360,432 78,717,483 42.7% 560,652 3497 Bucuresti, Sector 1
2 ADECCO RESURSE UMANE S.R.L. 107,083,586 81,632,898 31.2% 2,673,020 3659 Bucuresti, Sector 5
3 TRENKWALDER SRL 90,913,421 83,459,939 8.9% -783 3437 Timisoara, TIMIS
4 LUGERA & MAKLER ROMANIA S.R.L. 78,188,276 76,085,057 2.8% 1,354,985 1983 Bucuresti, Sector 3
5 LUGERA & MAKLER S.R.L. 64,587,732 53,028,527 21.8% 270,935 1698 Bucuresti, Sector 3
6 ADECCO ROMANIA S.R.L. 48,743,210 44,512,466 9.5% 63,879 607 Bucuresti, Sector 5
7 ARCFORCE SRL 45,623,401 32,927,000 38.6% 3,093,160 400 Craiova, DOLJ
8 APT RESOURCES & SERVICES S.R.L. 43,859,263 40,615,175 8.0% 496,998 738 Bucuresti, Sector 1
9 AGENTIA DE SERVICII PROFESSIONAL S.R.L. 37,566,242 38,576,294 -2.6% 44,456 1255 Bucuresti, Sector 3
10 GI GROUP STAFFING COMPANY S.R.L. 24,793,019 10,130,621 144.7% -746,696 1025 Bucuresti, Sector 1
11 SMARTREE ROMANIA S.R.L. 18,809,076 10,325,149 82.2% -1,242,400 439 Bucuresti, sector 1
12 INTERIM PLUS S.R.L. 17,511,183 5,659,555 209.4% 3,361,448 17 Bucuresti, Sector 5
13 AIMS HUMAN CAPITAL ROMANIA S.R.L. 12,047,510 13,112,110 -8.1% 193,317 140 Bucuresti, Sector 2
14 BARNETT MCCALL RECRUITMENT S.R.L. 5,049,637 5,173,171 -2.4% -925,430 91 Bucuresti, Sector 1
15 PEDERSEN & PARTNERS CONSULTING S.R.L. 4,548,921 3,473,545 31.0% 1,077,720 8 Bucuresti, Sector 2
16 HILL INTERNATIONAL HUMAN RESOURCES CONSULTING ROMANIA LIMITED S.R.L.
3,316,663 2,225,788 49.0% 424,188 17 Bucuresti, Sector 1
17 CONSULTEAM RECRUTARE SI SELECTIE S.R.L. 2,091,799 1,569,913 33.2% 157,002 0 Bucuresti, Sector 2
18 E-FINANTE MANAGEMENT GRUP S.R.L. 1,777,806 1,737,273 2.3% 175,737 7 Bucuresti, Sector 5
19 LEADERSHIP DEVELOPMENT SOLUTIONS S.R.L. 1,748,351 2,557,330 -31.6% -195,488 12 Bucuresti, Sector 1
20 BIA HUMAN RESOURCE MANAGEMENT SERVICES S.R.L.
1,601,638 1,820,316 -12.0% 211,000 16 Bucuresti, Sector 5
MCR PROFESSIONAL SERVICES


TRAINING COMPANIESRANK COMPANY NAME
ANNUAL TURNOVER ( 2011 RON)
ANNUAL TURNOVER
(2010 RON)
ANNUAL TURNOVER GROWTH %
PROFIT/LOSS (2011 RON)
NO OF EMPLOYEES CONTACT
1 ASCENDIS CONSULTING S.R.L. 14,155,755 10,997,109 28.7% 3,030,204 27 Bucuresti, Sector 1
2 IFPTR SRL 12,827,938 12,468,452 2.9% 64,930 65Miercurea Ciuc,
HARGHITA
3 INSTITUTUL ROMAN DE CERCETARI ECO-NOMICO-SOCIALE SI SONDAJE - IRECSON S.R.L
9,423,723 4,693,865 100.8% 729,227 45 Bucuresti, Sector 3
4 ECDL ROMANIA SA 8,960,212 5,145,245 74.1% 3,406,934 28 Bucuresti, Sector 1
5 EUROCOR - INSTITUTUL EUROPEAN DE CURSURI PRIN CORESPONDENTA SRL
7,241,527 6,783,174 6.8% 1,001,076 66 Bucuresti, Sector 4
6 UNITED BUSINESS DEVELOPMENT S.R.L. 6,217,746 - 57,173 13 Bucuresti, Sector 4
7 CODECS S.A. 5,341,675 5,920,037 -9.8% -1,711,285 29 Bucuresti, Sector 2
8 LEXIS SRL 5,177,445 5,586,857 -7.3% 170,752 73 Bucuresti, Sector 2
9 TMI TRAINING & CONSULTING S.R.L. 4,241,709 4,579,955 -7.4% 860,577 4 Bucuresti, Sector 1
10 TREND CONSULT S.R.L. 4,137,798 - 145,949 14 Bucuresti, Sector 2
11 SANIOMALIONA SRL 3,790,735 5,621,358 -32.6% 222,221 9 Branesti, ILFOV
12 COMPETITIVE IN BUSINESS & CONSULTING SRL 3,722,811 2,284,012 63.0% 1,983,363 8 Bucuresti, Sector 3
13 IHB LANGUAGE TRAINING CENTER 3,609,838 3,184,059 13.4% 192,478 15 Bucuresti, Sector 4
14 INTERACT BUSINESS COMMUNICATIONS S.R.L. 3,407,011 3,329,904 2.3% 77,797 15 Bucuresti, Sector 3
15 ROLAND GAREIS CONSULTING S.R.L. 3,260,017 2,898,105 12.5% 162,603 4 Bucuresti, Sector 5
16 BUSINESS TRAINING ROMANIA S.R.L. 2,769,949 3,228,311 -14.2% -500,396 9 Bucuresti, Sector 6
17 HUMAN INVEST S.R.L. 2,361,636 3,143,244 -24.9% 55,662 9 Bucuresti, Sector 2
18 EURODEZVOLTARE SRL 1,405,539 5,500,480 -74.4% 13,139 36 Bucuresti, Sector 3
19 THE TRAINING BOUTIQUE S.R.L. 1,208,792 1,014,066 19.2% 364,523 4Ostratu, Cor-
beanca, ILFOV
MCR PROFESSIONAL SERVICES

2012012 EDITION Major Companies in Romania
MARKET RESEARCH COMPANIESRANK COMPANY NAME
ANNUAL TURNOVER ( 2011 RON)
ANNUAL TURNOVER
(2010 RON)
ANNUAL TURNOVER GROWTH %
PROFIT/LOSS (2011 RON)
NO OF EMPLOYEES CONTACT
1 IPSOS INTERACTIVE SERVICES S.R.L. 163,785,900 144,507,591 13.3% 40,236,030 596 Bucuresti, Sector 6
2 GFK ROMANIA - INSTITUT DE CERCETARE DE PIATA S.R.L.
46,790,636 39,922,177 17.2% -4,960,897 199 Bucuresti, Sector 2
3 CEGEDIM ROMANIA S.R.L. 23,178,549 24,014,535 -3.5% 1,772,917 70 Bucuresti, Sector 1
4 ACNIELSEN ROMANIA S.R.L. 20,445,059 17,994,496 13.6% -3,046,218 273 Bucuresti, Sector 1
5 MARKETING CLAN SRL 17,168,705 15,352,501 11.8% -314,362 0 Corbeanca, ILFOV
6 DAEDALUS CONSULTING S.R.L. 15,158,175 14,256,156 6.3% 1,568,445 48 Bucuresti, Sector 1
7 ARMADATA SRL 12,624,973 11,246,779 12.3% 200,140 1 Bucuresti, Sector 1
8 EURODATA MANAGEMENT S.R.L. 8,893,836 8,155,706 9.1% 882,822 137 Bucuresti, Sector 2
9 MEMRB ROMANIA RETAIL TRACKING SERVICES SRL
8,266,317 15,772,589 -47.6% -3,764,228 250 Bucuresti, Sector 6
10 IPSOS RESEARCH SRL 7,905,080 9,535,872 -17.1% -559,568 38 Bucuresti, Sector 1
11 EVALUESERVE SRL 7,887,623 5,188,755 52.0% 518,841 55 Cluj-Napoca, CLUJ
12 CENTRUL PENTRU STUDIEREA OPINIEI SI PIETII (CSOP) S.R.L.
7,579,228 7,021,745 7.9% 304,265 47 Bucuresti, Sector 1
13 MERCURY RESEARCH S.R.L. 6,470,354 7,458,629 -13.3% 669,193 75 Bucuresti, Sector 1
14 ISRA CENTER MARKETING RESEARCH S.R.L. 5,826,435 5,612,393 3.8% 243,799 61 Bucuresti, Sector 2
15 IMAS-MARKETING SI SONDAJE S.A. 5,813,937 5,071,904 14.6% 407,055 53 Bucuresti, Sector 5
16 THE GALLUP ORGANIZATION - ROMANIA S.R.L. 4,083,383 5,476,389 -25.4% -1,020,633 52 Bucuresti, Sector 1
17 CENTRUL DE SOCIOLOGIE URBANA SI REGIONALA - CURS SRL
2,563,827 2,290,320 11.9% 137,411 8 Bucuresti, Sector 2
18 IRSOP MARKET RESEARCH & CONSULTING S.R.L.
1,549,756 2,406,024 -35.6% -405,298 21 Bucuresti, Sector 1
19 METRO MEDIA TRANSILVANIA STUDII SOCIALE SONDAJE MARKETING SI PUBLICITATE S.R.L.
1,345,770 2,039,313 -34.0% 35,080 21 Cluj-Napoca, CLUJ


Business Services HOTELS AND SIMILAR ACCOMMODATION TRAVEL AGENCIES SECURITY COMPANIES PRINTING SERVICES
2032012 EDITION Major Companies in Romania
6billion EUR is the value of tourism industry in Romania, accounting for 1.4 percent of GDP

Increased operational costs, lower budgets for travel and corporate events, the endless lack of local infrastructure and overall, a diminished business activity are only several features that shape the scene of local hospitality industry this year in Romania.
However the potential, the tourism industry accounted for an average 1.4 percent of the GDP in the last four years, representing some EUR 6 billion, the amount pales in comparison with countries as Bulgaria, where the tourism accounts for 3.6 percent of GDP, or, in Hungary where the
tourism stands for 4 percent of the country’s GDP. According to specialized consultants, tourism in Romania is not to see any soon large investments due to the lack of predictability in economy reforms and fiscal frame.
Consulting and management company Trend Consulting issues a yearly report on the hospitality industry of Romania
that previews some positive variations in numbers, especially turnovers, occupancy rates and number of clients. However, the study warns that bigger numbers (in turnovers) don’t necessary mean larger profits for a hotel company and sometimes, it may even result in smaller performances, even in the presence of larger sale volumes. It all depends on the average occupancy rate, average room rate and other specific indicators in this industry. “Tourism should not be analyzed out of the global economy,” states the latest report of Trend Hospitality. That is obvious, as the traveling rates and the demand for tourism services are strictly determined by the economic state of three very important markets: Europe, USA and Japan.
A GLASS HALF FULL OR HALF EMPTY? The current economic turmoil stated by all the markets, European or more remote, only affected the financial clients’ capacity to travel. In the past 20 years, there were other crisis that directly compromised the willing of clients to travel, due to safety reasons (wars, social conflicts, calamities, epidemics). This time, the affordability is the main factor that decides if travelling will happen in the case of leisure travelers. In the case of corporate travels, it sometimes may also have an impact but more seldom.
For this year, at European level, the report of Trend Consulting estimates based on the World Travel and Tourism Council that tourism industry is expected to register an increase of 4.2 percent for 2010- 2020. Regarding the operational indicators, such as average occupancy rate and average room rate, all European regions showed increases so far. But even if these numbers are positive, the profits and revenues resulting from
MCR BUSINESS SERVICES
Tourism, not a walk in the park
Magda Purice, Journalist
Evolution of domestic / international incomings
Contribution to GDP Contribution to employment
Source: Trend Hospitality
Source: Romanian National Institute of Statistics (INSSE)
-20.0%
-10.0%
0.0%
10.0%
20.0%
2007 2008 2009 2010 2011
Domestic International
0.0%
5.0%
10.0%
15.0%
20.0%
25.0%
30.0%
Bulgaria Croatia Czech Republic
Poland Hungary Romania Slovakia 0.0%
5.0%
10.0%
15.0%
20.0%
25.0%
30.0%
Bulgaria Croatia Czech Republic
Poland Hungary Romania Slovakia

the tourism operations decreased. A mid-year PwC Romania’s study states that revenues of Romanian leisure and hospitality industry declined by 16 percent over the past four years reaching approximately 1.5 billion EUR in 2011. The drop was caused mainly by the diminished number of foreign visitors, who reduced their spending in Romania from over 750 million EUR in 2008 to less than 600 million EUR in 2011. Domestic tourists also reduced their expenses, but the decline was less severe, just 11 percent, from 1.01 billion EUR to 900 million EUR.
LARGE POTENTIAL, SMALL CONTRIBUTION Romanian leisure and hospitality industry accounted for an average of 1.4 percent of the GDP in the last four years, but adding to that the indirect and induced contributions of adjacent services and related industries , tourism brings almost 6 billion EUR to Romania’s GDP. Even so, Romanian tourism has a low contribution to the GDP, compared with other countries in the region (in Bulgaria tourism accounts for 3.6 percent of the GDP, in Hungary 4 percent, while in the Czech Republic 2.8 percent). Following WTTC data on 2011, Romania ranks on the 67th position from 18 countries as tourism contribution to national economy. The WTTC estimations state that this amount will state an yearly growth of 6.6 percent by 2021, to reach 42.8 million lei. The estimated value for 2011 of leisure industry is 17.3 billion lei, with a growth of 8.8 percent, while business segment (within hospitality industry) is estimated to reach 11.2 billion lei and yearly growth of 3.7 percent. Furthermore, the report reveals that Romania has one of the lowest occupancy rates in Europe, of an average of only 26 percent, with Bucharest hotels having a more than double
occupancy rate (62 percent), compared with the rest of the country. However, revenues for available room decreased even in Bucharest during the past four years. Besides the downturn, the increase of the hotels offer in Bucharest is also responsible for the decrease in the RevPAR (revenues per available room) indicator.
WHAT TO EXPECT?The hotelier estimations included in the report published by Hotel Invest show that the growth of hotelier market this year is half from the value stated last year. Still, they estimate an advance, with 20 new hotelier units opened this year, totaling an approximate investment value of EUR 130 million, compared with 2011, when only 12 openings worth EUR 89 million have been recorded. In 2010, only 6 new hotelier units have been opened, according to Trend Hospitality report. Last year though, brought some significant transactions on the hotelier market, the largest being represented by the acquisition of 30 percent of Continental Hotels company by private equity fund GED. The share package has been sold by venture capital fund PPF Partners. Also at the end of 2011, hotelier chain Hilton opened its first unit DoubleTree by Hilton Bucuresti. This year was silent from this point of view, as no major transaction is expected to be inked, due to the low investment appetite.
2011 IN THE EYES OF TRAVEL AGENCIES According to statistics and financial data, last year brought improved financial results compared with last year. The top of the “wealthiest” agencies is occupied by Happy Tour, controlled by investment fund GED and reporting a turnover of approximate EUR 51 million, after it attained EUR 43.3 million in 2010. The second agency to report positive results is Eximtur, owned by a Romanian family, reporting a turnover of almost EUR 32 million in 2011, compared with EUR 27.5 million in 2010. The third place of the ranking is occupied by tour-operator Paralela 45, owned by Romanian businessman Alin Burcea, with turnover of EUR 6.47 million attained in 2011. Also, the raking after turnover comprises travel agencies as: Olimpic International Turism, Accent Travel & Events, Aerotravel, Perfect Tour, Marshal Turism, J`Info Tours and Transilvania Travel.
2052012 EDITION Major Companies in Romania
14.0%
39.5% 34.1%
10.8% 1.6%
1-star 2-stars 3-stars 4-stars 5-stars
3-stars19%
0%
4-stars50%
5-stars31%
0 200 400 600 800 1000 1200 1400
2006
2007
2008
2009
2010f
2011f
1-star 2-stars 3-stars 4-stars 5-stars
Evolution of number of hotels Hotels by classification
Source: Trend Hospitality
Branded hotels in Romania, per hotel segment
Source: Trend Hospitality

MCR BUSINESS SERVICES
TRAVEL AGENCIESRANK COMPANY NAME MCR SCORING ANNUAL TURNOVER
( 2011 RON)TURNOVER
RANKINGPROFIT/LOSS
(2011 RON)NO OF
EMPLOYEES CONTACT
1 PERFECT TOUR SRL 2.188 94,274,822 3 451,794 145 Bucuresti, Sector 1
2 EXIMTUR SRL 2.088 135,400,285 2 1,753,350 132 Cluj-Napoca, CLUJ
3 HOTELAIR SRL 1.900 57,065,967 7 899,295 9 Bucuresti, Sector 5
4 OLIMPIC INTERNATIONAL TURISM SRL 1.850 47,926,227 12 1,410,008 27 Bucuresti, Sector 4
5 DANCO PRO COMMUNICATION SRL 1.850 44,071,161 13 640,783 24 Bucuresti, Sector 2
6 HAPPY TOUR SRL 1.838 165,426,685 1 910,062 100 Bucuresti, Sector 1
7 ACCENT TRAVEL & EVENTS SRL 1.800 71,025,824 4 1,037,538 47 Bucuresti, Sector 2
8 BUSINESS TRAVEL TURISM SRL 1.800 56,085,134 8 2,772,565 35 Bucuresti, Sector 1
9 MARSHAL TURISM SRL 1.788 55,151,889 9 357,291 86 Bucuresti, Sector 4
10 AEROTRAVEL SRL 1.788 20,632,618 21 649,731 117 Bucuresti, Sector 2
11 PRESTIGE TOURS INTERNATIONAL SRL 1.750 50,967,752 10 1,542,759 20 Bucuresti, Sector 1
12 GAMA PROCONSULT SRL 1.750 24,048,981 19 796,159 15 Bucuresti, Sector 2
13 SUNMEDAIR TRAVEL & TOURISM SERVICES SRL 1.738 61,162,385 5 577,474 57 Bucuresti, Sector 2
14 PROMPT SERVICE TRAVEL COMPANY SRL 1.700 50,756,551 11 359,906 21 Bucuresti, Sector 1
15 ROMANIA TRAVEL PLUS SRL 1.550 58,192,394 6 356,740 31 Bucuresti, Sector 1
16 MAREEA COMTUR SRL 1.550 43,511,242 14 26,381 0 Deva, HUNEDOARA
17 J’INFO TOURS SRL 1.550 37,844,965 16 304,170 40 Bucuresti, Sector 1
18 CMB INTERNATIONAL EXIMP SRL 1.500 15,837,965 22 61,166 30 Bucuresti, Sector 1
19 PARALELA 45 TURISM SRL 1.488 27,446,458 18 1,751,609 191 Bucuresti, Sector 5
20 WECO TMC SRL 1.400 41,179,446 15 421,067 18 Bucuresti, Sector 2
21 TRANSILVANIA TRAVEL SA 1.300 33,894,589 17 287,464 42 Bucuresti, Sector 2
22 TRAVEL HOUSE INTERNATIONAL SRL 1.300 22,078,908 20 -272,295 28 Bucuresti, Sector 1
SECURITY COMPANIESRANK COMPANY NAME MCR SCORING ANNUAL TURNOVER
( 2011 RON)TURNOVER
RANKINGPROFIT/LOSS
(2011 RON)NO OF
EMPLOYEES CONTACT
1 TIGER PROTECTOR COMPANY SRL 2.163 23,152,712 13 172,143 1,122 Bucuresti, Sector 1
2 SCORSEZE SECURITY INTERNATIONAL SRL 2.113 74,762,884 6 3,334,380 3,043 Bucuresti, Sector 2
3 CASSIDIAN ROMANIA SRL 2.088 151,679,305 1 5,280,617 120 Bucuresti, Sector 1
4 NOVA FORCE SRL 2.063 37,505,002 9 813,738 1,600 Giurgiu, GIURGIU
5 SECURIT FORCE SRL 2.025 28,032,754 12 3,543,193 620 Bucuresti, Sector 1
6 BGS DIVIZIA DE SECURITATE SRL 2.013 109,644,577 4 9,950,167 2,966 Bucuresti, Sector 4
7 SECURITAS SERVICES ROMANIA SRL 2.013 91,182,760 5 4,073,593 3,037 Bucuresti, Sector 2
8 HELINICK SRL 1.938 68,056,807 7 8,841,455 117 Bucuresti, Sector 1
9 CONCEPT CONSULT & PROSPECT SRL 1.850 127,613,574 2 7,091,887 48 Bucuresti, Sector 2
10 GLOBAL SECURITY SISTEM SA 1.825 30,031,429 11 311,156 890 Bucuresti, Sector 5
11 RASIROM RA 1.738 30,482,828 10 2,253,071 168 Bucuresti, Sector 2
12 ROSEGUR SA 1.663 65,364,830 8 -5,709,599 2,645 Bucuresti, Sector 2
13 G4S SECURE SOLUTIONS SRL 1.513 115,785,472 3 -2,711,152 3,277 Bucuresti, Sector 2
14 GUARD ONE ALARM SYSTEMS SRL 1.475 20,640,142 14 -718,134 703 Bucuresti, Sector 4

HOTELS AND SIMILAR ACCOMMODATIONRANK COMPANY NAME MCR SCORING ANNUAL TURNOVER
( 2011 RON)TURNOVER
RANKINGPROFIT/LOSS
(2011 RON)NO OF
EMPLOYEES CONTACT
1 COMPANIA HOTELIERA INTERCONTINENTAL ROMANIA SA
2.225 47,449,554 7 1,187,956 268 Bucuresti, Sector 1
2 ANA HOTELS SA 1.875 105,581,471 2 257,164 588 Bucuresti, Sector 1
3 ACCOR HOTELS ROMANIA SRL 1.738 32,350,814 9 3,816,458 159 Bucuresti, Sector 1
4 ALPIN 2003 SRL 1.738 22,424,234 11 2,721,459 203 Poiana Brasov, BRASOV
5SOCIETATEA COMERCIALA DE TRATAMENT BALNEAR SI RECUPERARE A CAPACITATII DE MUNCA & AMP; TBRCM& SA
1.725 75,226,803 5 10,899,016 640 Bucuresti, Sector 3
6 ARO-PALACE SA 1.725 21,597,157 13 116,544 418 Brasov, BRASOV
7 BUCURESTI TURISM SA 1.700 109,180,960 1 -17,952,159 19 Bucuresti, Sector 1
8 SOCIETATEA COMPANIILOR HOTELIERE GRAND SRL
1.675 103,762,136 3 -9,433,989 362 Bucuresti, Sector 5
9 CONTINENTAL HOTELS SA 1.675 85,300,652 4 -43,142,300 796 Bucuresti, Sector 1
10 PARC HOTELS SA 1.675 26,517,389 10 2,982,290 256 Bucuresti, Sector 1
11 GRAND PLAZA HOTEL SA 1.638 37,844,036 8 1,168,472 228 Bucuresti, Sector 1
12 DE SILVA RTH SRL 1.438 22,125,391 12 64,868 127 Bucuresti, Sector 1
13 BUCHAREST FINANCIAL PLAZZA SRL 1.300 66,246,941 6 8,061,861 3 Bucuresti, Sector 3
PRINTING SERVICESRANK COMPANY NAME MCR SCORING ANNUAL TURNOVER
( 2011 RON)TURNOVER
RANKINGPROFIT/LOSS
(2011 RON)NO OF
EMPLOYEES CONTACT
1 COMPANIA NATIONALA IMPRIMERIA NATIONALA SA
2.675 342,553,292 1 32,645,355 474 Bucuresti, Sector 1
2 SOTHIS PRINT SRL 2.088 17,342,611 19 1,798,983 72 Bucuresti, Sector 6
3 ROTTAPRINT SRL 1.738 40,989,256 9 109,472 122 Apahida, CLUJ
4 RODATA SRL 1.738 28,972,243 12 2,367,198 95 Bucuresti, Sector 2
5 ART GROUP INT SRL 1.688 26,715,396 15 731,839 154 Bucuresti, Sector 1
6 BEST PRINT SERVICES SRL 1.638 34,360,700 10 42,105 161 Bucuresti, Sector 6
7 PRINT PACK PROD SRL 1.550 18,048,623 18 285,558 46 Bucuresti, Sector 4
8 MONITORUL OFICIAL RA 1.525 55,600,569 6 16,082,596 358 Bucuresti, Sector 1
9 INFORM LYKOS SA 1.475 91,519,957 3 -7,446,035 252 Bucuresti, Sector 1
10 INFORM MEDIA SRL 1.475 26,876,253 14 -4,740,913 262 Timisoara, TIMIS
11 EDS ROMANIA SRL 1.388 89,614,003 4 -37,754,533 98 Bucuresti, Sector 1
12 TIPOMEDIA PROD SRL 1.388 29,505,185 11 -12,750,735 54 Bucuresti, Sector 2
13 FED PRINT SA 1.388 25,669,325 16 -4,803,947 192 Bucuresti, Sector 5
14 VISUAL PROMOTION SRL 1.388 22,202,998 17 -482,584 121 Bucuresti, Sector 2
15 G CANALE &C SRL 1.338 80,125,608 5 -6,412,938 173 Pantelimon, ILFOV
16 ASA (ROMANIA) SRL 1.300 49,096,350 7 -2,128,861 49Sat Buciumeni,
CALARASI
17 COMPANIA DE PRODUCTIE INTERTAINMENT SA 1.288 28,470,805 13 -8,183,877 138 Buftea, ILFOV
18 INFOPRESS GROUP SA 1.275 164,738,245 2 -12,247,886 358Odorheiu - Secuiesc,
HARGHITA
19 MEGA PRESS HOLDINGS SA 1.250 48,959,135 8 -3,653,366 34 Bucuresti, Sector 4
2072012 EDITION Major Companies in Romania

Media & Advertising ADVERTISING AGENCIES MEDIA AGENCIES PR AGENCIES
2092012 EDITION Major Companies in Romania
309million EUR is the local media market value in 2011, 42.7 percent down compared with the peak of EUR 540 million registered in 2008

Economic crisis or just strategy reorientation?
Whether 2011 was the year in which local advertising agencies took over European creativity festivals, locally, market players had to deal with budgets reshuffling and decreases in prices on the suppliers’ side, as well as a redefining of strategies by media agencies.
The 2011 Cannes Festival of Creativity was a Romanian affair, with the local office of BV McCann Erickson winning the first two Grand Prix of the 2011 Cannes Lions Festival of Creativity—in the Promo & Activation and Direct contests—for a sneaky campaign in which it replaced the familiar Romanian flag on the local ROM candy bar with an American flag, sending a country into panic.
With a total of nine ‘lions’ the last two of which were a Titanium – an award given for the best and most innovative idea in the entire festival – and a Gold Lion in the Integrated category, McCann last year set the bar high for any Romanian agency that wanted to impress international audiences.
Later in the year, the same agency scored the Golden Rose – Agency of the Year at the Golden Drum international advertising festival in Portoroz, Slovenia. McCann was awarded for the campaigns it ran for Vodafone (The Wedding, Vodafone Cerebel and Vodafone Chivu) and Kandia Dulce (American Rom).
Creativity was not McCann’s only trump card last year, however, as Universal McCann, the media arm of the advertising group, has regained one of the most coveted after media accounts in Romania: Vodafone.
Estimated at 15 million Euro, the media account for Vodafone, the second telecom operator on the Romanian market and one of the main advertisers in Romania, was handled, from February 2010 until July 2011, by OMD Romania, part of Omnicom, following an international pitch.
The change from McCann to Omnicom was coming after more than ten years in which Vodafone’s media account in Romania (initially Connex on the Romanian market) was handled by Universal McCann.
Omnicom made headlines at the beginning of this year in Romania, as OMD and PHD, part of Omnicom Media Group, and The Group, Romanian communication holding led by Zoltan Szigeti and Mihaela Nicola, forged a partnership through which The Group becomes shareholder in OMD and PHD in Romania.
Given all these changes, how do market players adapt?
An analysis at the beginning of the year by the Romanian Association for Audiences Measurement (ARMA) compared the first nine months of 2011 to the decrease witnessed in the same period of 2010. ARMA experts estimated that by the end of 2011, media investments would only reach half of the value registered in 2008, which was the peak year in Romanian advertising.
According to ARMA, despite the forecast growth for 2012, most market players think this is not the moment to come out with optimistic scenarios. A recovery in the advertising market should come as a direct consequence of improvement in the economic climate, which, at the time did not hint to values close to those registered in 2008. In regards to Romania’s economic situation, forecasts were made based on an official GDP growth of 3.5 per cent, however, should 2012 not bring any improvements to this end, ARMA was still reserved with regards to a favorable prognosis for the advertising market. There were some views about 2012 being a crisis-free year because it is an election year, which could lead to a possible economic recovery, but with the political tumult Romania has witnessed this summer, all bets are off.
On this background, data offered by the Media Fact Book 2012, a product of Initiative Media, put the total media market value at about 309 million Euro, way down from the 2008 peak of 540 million Euro. The Media fact Book shows a media market contraction that marginally continued in 2011, with a decrease of two per cent over the previous year. All media was impacted, except for the online environment, which grew by 30 per cent and is expected to follow the same trend in 2012 as well.
Print was the most affected medium, dropping eight per cent over 2010, followed by OOH (out of home advertising) –
MCR MEDIA & ADVERTISING
How to survive on a shrinking market
Corina Mica - Freelance Journalist

211
minus seven per cent, radio (-five per cent) and TV (- four per cent).
The TV market was the most stable one in 2011, as top media groups hold 70 per cent of the total net market. TV stations organized their sales policies to sell more inventories at a lower price.
In 2011, the dynamic growth of Internet advertising continued and it is expected to keep the same trend in 2012 as well. Social networking sites continue to develop, attracting more and more users, hence a heftier slice of advertising budgets.
As media habits are changing, especially for urban young adults, digital has become the second most important medium for many brands and their preference for online and social media is reflected in their media strategies.
The Media Fact Book says that, being used mostly as a tactical support, Radio has dropped marginally in 2011, losing ad revenue in favor of online and social platforms, which are more engaging and offer a higher flexibility for creative communication. Last but not least, the print market continued its decreasing trend in 2011 but less dramatically than in previous years. Despite innovative projects created by publishers in an attempt to rejuvenate the print market, circulation and readership fell for almost all publications, several titles moving exclusively online, while others were closed or restructured.
With no audited figures in place at the time the Media Fact Book was printed, the OOH market registered a decline of seven per cent in 2011, with a total spent of 31 million Euro. At the same time, the Cinema market in Romania is defined especially by the number of multiplexes launched along with
new shopping malls in Bucharest and other big cities, and where new technologies like digital, 3D and 6D generated an increase in audiences.
The Media Fact Book divides the local media market in 2011 as follows: TV: 64.7 per cent Internet: 11 per cent OOH: 10 per cent Radio: 6.5 per cent Print: 7.8 per cent
2012 EDITION Major Companies in Romania

MCR MEDIA & ADVERTISING
ADVERTISING AGENCIESRANK COMPANY NAME MCR SCORING ANNUAL TURNOVER
( 2011 RON)TURNOVER
RANKINGPROFIT/LOSS
(2011 RON)NO OF
EMPLOYEES CONTACT
1 BV MCCANN ERICKSON SRL 2.638 201,713,544 1 7,577,453 92 Bucuresti, Sector 1
2 GRAFFITI/BBDO SA 2.088 48,696,090 4 437,401 100 Bucuresti, Sector 1
3 LOWE &PARTNERS SA 2.000 24,204,728 10 260,311 42 Bucuresti, Sector 1
4 SAATCHI &SAATCHI SRL 2.000 23,487,809 11 1,252,115 42 Bucuresti, Sector 3
5 VITRINA FELIX MEDIA SA 2.000 10,813,334 14 703,118 48 Cluj-Napoca, CLUJ
6 GREY WORLDWIDE ROMANIA SRL 1.938 38,449,263 7 2,589,350 85 Bucuresti, Sector 1
7 NEXT ADVERTISING SRL 1.850 45,983,105 5 1,763,451 48 Bucuresti, Sector 1
8 AGENTIA DE PUBLICITATE MEDIA CENTER SRL 1.800 26,148,460 9 813,545 14 Bucuresti, Sector 6
9 TEMPO ADVERTISING SRL 1.800 14,054,610 13 330,853 25 Bucuresti, Sector 1
10 FRONT LINE MARKETING SRL 1.738 8,050,489 18 364,954 84 Bucuresti, Sector 2
11 GREATER AD SRL 1.650 8,184,022 17 641,730 39 Bucuresti, Sector 4
12 LEO BURNETT &TARGET SA 1.600 81,198,941 2 876,270 43 Bucuresti, Sector 1
13 DDB BUCURESTI SRL 1.600 9,119,517 16 -846,319 22 Bucuresti, Sector 5
14 FCB BUCHAREST SRL 1.588 30,192,486 8 2,068,474 57 Bucuresti, Sector 2
15 MGA METRO GROUP ADVERTISING ROMANIA SRL
1.500 76,798,669 3 56,035 7 Bucuresti, Sector 3
16 ODYSSEY COMMUNICATION SRL 1.488 39,108,178 6 -6,521,282 57 Bucuresti, Sector 1
17 OGILVY &MATHER ADVERTISING SRL 1.488 21,660,807 12 446,621 58 Bucuresti, Sector 1
18 BRANDS TALK ADVERTISING SRL 1.450 9,446,802 15 440,264 28 Bucuresti, Sector 2
MEDIA AGENCIESRANK COMPANY NAME MCR SCORING ANNUAL TURNOVER
( 2011 RON)TURNOVER
RANKINGPROFIT/LOSS
(2011 RON)NO OF
EMPLOYEES CONTACT
1 MEDIA INVESTMENT COMMUNICATION SRL 2.500 200,435,239 1 8,166,672 48 Bucuresti, Sector 1
2 INITIATIVE MEDIA SA 2.200 171,288,174 2 2,431,954 43 Bucuresti, Sector 1
3 BABEL COMMUNICATIONS SRL 2.150 9,705,998 32 876,533 28 Bucuresti, Sector 1
4 STARCOM MEDIAVEST GROUP SRL 2.100 134,156,639 4 6,313,019 34 Bucuresti, Sector 1
5 OPTIMEDIA SRL 2.100 44,040,653 14 1,710,477 13 Bucuresti, Sector 2
6 ZENITH MEDIA SRL 1.950 101,888,476 6 4,506,153 29 Bucuresti, Sector 4
7 MEDIA SERVICE ZAWADA SRL 1.900 71,809,010 8 1,398,760 11 Bucuresti, Sector 5
8 CLEAR CHANNEL ROMANIA SRL 1.850 10,268,486 31 347,501 17 Bucuresti, Sector 3
9 MEDIACOM ROMANIA SRL 1.800 87,587,372 7 2,426,551 30 Bucuresti, Sector 1
10 MEDIA LINK COMMUNICATION SRL 1.800 58,733,851 10 541,251 11 Bucuresti, Sector 2
11 MINDSHARE MEDIA SRL 1.700 67,752,600 9 1,115,699 19 Bucuresti, Sector 1
12 HOUSE OF MEDIA SRL 1.700 25,292,321 20 5,109,010 6 Bucuresti, Sector 2
13 SPOON MEDIA SRL 1.700 14,898,757 25 412,095 10 Bucuresti, Sector 1
14 NETBRIDGE SERVICES SRL 1.688 12,334,309 26 -147,426 74 Bucuresti, Sector 2
15 MERCURY360 COMMUNICATIONS SRL 1.675 55,567,791 11 361,854 363 Bucuresti, Sector 2
16 MEDIA PLANNING GROUP (MPG) ROMANIA SA 1.650 32,288,131 18 640,215 26 Bucuresti, Sector 1
17 MEDIA-TIQUE SRL 1.650 25,400,460 19 2,899,613 8 Bucuresti, Sector 1
18 MEDIAEDGECIA ROMANIA SRL 1.600 132,044,263 5 2,382,899 37 Bucuresti, Sector 1
19 UNITED MEDIA SERVICES SRL 1.600 51,329,749 13 152,041 8 Bucuresti, Sector 1
20 NEW AGE ADVERTISING AGENCY SRL 1.600 10,793,953 27 164,650 24 Craiova, DOLJ
21 NEW MEDIA AGENCY SRL 1.600 10,769,950 28 311,478 0 Bucuresti, Sector 1
22 THE MEDIA PARTNERSHIP SRL 1.550 156,067,883 3 175,891 5 Bucuresti, Sector 1
23 DBV MEDIA HOUSE SRL 1.550 10,366,349 29 251,066 25 Bucuresti, Sector 1
24 CARAT ROMANIA SRL 1.500 42,666,516 15 385,965 10 Bucuresti, Sector 1
25 BRAND CONNECTION SA 1.500 19,671,617 22 132,946 14 Bucuresti, Sector 1
26 NEWS OUTDOOR ROMANIA SRL 1.488 18,493,987 24 -2,788,100 76 Bucuresti, Sector 2
27 CLIR MEDIA GROUP SRL 1.400 19,225,406 23 -235,008 12 Bucuresti, Sector 2
28 CABLE DIRECT SRL 1.400 10,334,411 30 -545,845 13 Bucuresti, Sector 4
29 CONPRESS GROUP SRL 1.388 53,747,836 12 -179,253 203 Constanta, CONSTANTA
30 APROPO MEDIA SRL 1.388 8,101,753 33 -2,385,021 126 Bucuresti, Sector 2
31 SPLENDID MEDIA SA 1.300 19,830,786 21 -13,071,335 15 Bucuresti, Sector 1
32 MEDIA DIRECTION SRL 1.200 39,044,794 16 -169,641 26 Bucuresti, Sector 1
33 ARM PUBLICITATE & COMUNICARE SRL 1.200 32,537,508 17 -16,041,835 0 Bucuresti, Sector 1
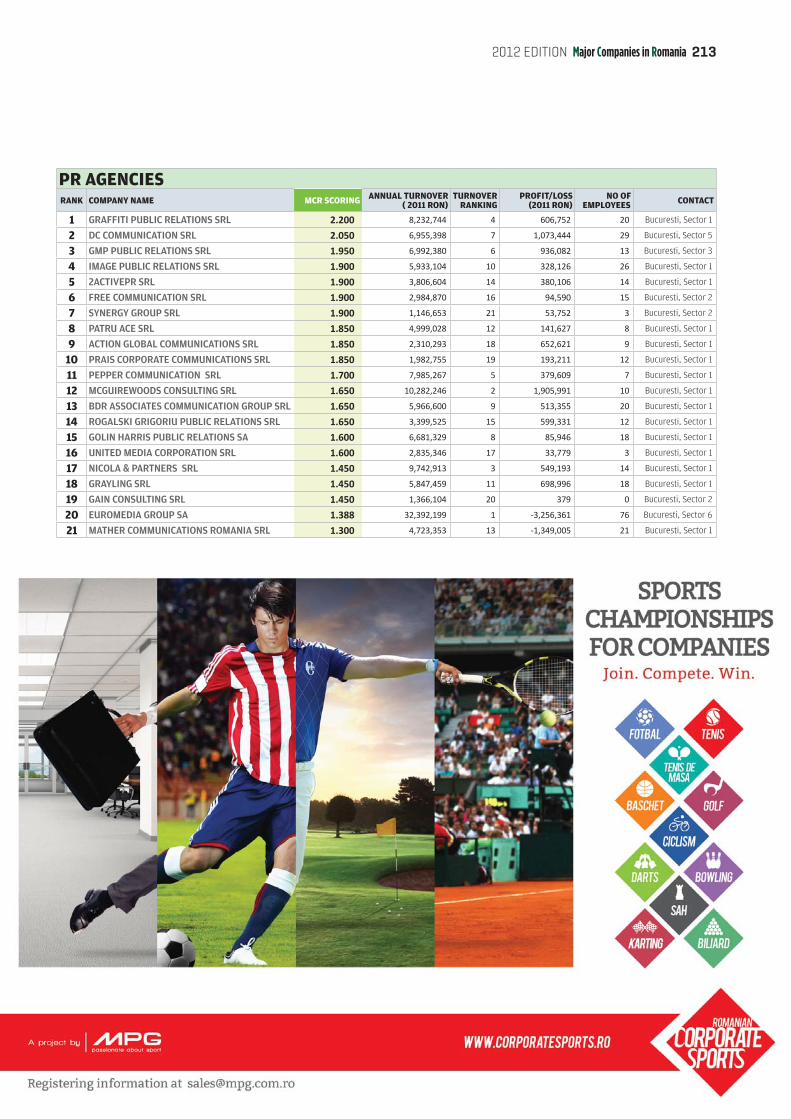
213
2012 EDITION Major Companies in Romania
PR AGENCIESRANK COMPANY NAME MCR SCORING ANNUAL TURNOVER
( 2011 RON)TURNOVER
RANKINGPROFIT/LOSS
(2011 RON)NO OF
EMPLOYEES CONTACT
1 GRAFFITI PUBLIC RELATIONS SRL 2.200 8,232,744 4 606,752 20 Bucuresti, Sector 1
2 DC COMMUNICATION SRL 2.050 6,955,398 7 1,073,444 29 Bucuresti, Sector 5
3 GMP PUBLIC RELATIONS SRL 1.950 6,992,380 6 936,082 13 Bucuresti, Sector 3
4 IMAGE PUBLIC RELATIONS SRL 1.900 5,933,104 10 328,126 26 Bucuresti, Sector 1
5 2ACTIVEPR SRL 1.900 3,806,604 14 380,106 14 Bucuresti, Sector 1
6 FREE COMMUNICATION SRL 1.900 2,984,870 16 94,590 15 Bucuresti, Sector 2
7 SYNERGY GROUP SRL 1.900 1,146,653 21 53,752 3 Bucuresti, Sector 2
8 PATRU ACE SRL 1.850 4,999,028 12 141,627 8 Bucuresti, Sector 1
9 ACTION GLOBAL COMMUNICATIONS SRL 1.850 2,310,293 18 652,621 9 Bucuresti, Sector 1
10 PRAIS CORPORATE COMMUNICATIONS SRL 1.850 1,982,755 19 193,211 12 Bucuresti, Sector 1
11 PEPPER COMMUNICATION SRL 1.700 7,985,267 5 379,609 7 Bucuresti, Sector 1
12 MCGUIREWOODS CONSULTING SRL 1.650 10,282,246 2 1,905,991 10 Bucuresti, Sector 1
13 BDR ASSOCIATES COMMUNICATION GROUP SRL 1.650 5,966,600 9 513,355 20 Bucuresti, Sector 1
14 ROGALSKI GRIGORIU PUBLIC RELATIONS SRL 1.650 3,399,525 15 599,331 12 Bucuresti, Sector 1
15 GOLIN HARRIS PUBLIC RELATIONS SA 1.600 6,681,329 8 85,946 18 Bucuresti, Sector 1
16 UNITED MEDIA CORPORATION SRL 1.600 2,835,346 17 33,779 3 Bucuresti, Sector 1
17 NICOLA & PARTNERS SRL 1.450 9,742,913 3 549,193 14 Bucuresti, Sector 1
18 GRAYLING SRL 1.450 5,847,459 11 698,996 18 Bucuresti, Sector 1
19 GAIN CONSULTING SRL 1.450 1,366,104 20 379 0 Bucuresti, Sector 2
20 EUROMEDIA GROUP SA 1.388 32,392,199 1 -3,256,361 76 Bucuresti, Sector 6
21 MATHER COMMUNICATIONS ROMANIA SRL 1.300 4,723,353 13 -1,349,005 21 Bucuresti, Sector 1


Healthcare MEDICAL CENTERS DENTAL CENTERS
2152012 EDITION Major Companies in Romania
5%of GDP represents the budget assigned for healthcare system in 2011 while for 2012 it decreased to 4 percent

The healthcare system in Romania is dominated by the public sector, through an array of hospitals covering the entire country. Nevertheless, in the recent years, its influence has significantly decreased due to both closing of a number of hospitals, process set to continue under IMF protocols, and with a rapid growth of the private players.
The private healthcare system has steadily increased the number of units in the past decade. Initially, it started with single clinics and laboratories, it has later constructed chains of both, while recently it has boomed in hospital-type units – a trend which is expected to continue at a high speed for at least two more years.
Much of 2012 has been plagued with mostly one-way discussions on how to create revenues and control expenses within the public healthcare system. Debates have included the budget allocations, public services rendered free of charge, but also the co-payment of a series of services.
In respect of the co-payment of a selected list of health services, the entire process of assigning costs for the patients has been placed under review at the end of the summer, with more decision making being expected in the first half of 2013. Under the current IMF mandate, there is no set out date for the conclusion of the co-payment, creating possibilities for the deadline to further slide.
2012 – THE YEAR OF DEEPER CUTSThe healthcare sector in 2012 has continued the trends constituted since 2008, with its most important ones proving to be:
healthcare – 4% of GDP in 2012 , against 5% in 2011
number of hospitals or turning them into nursing houses (67 hospitals were closed in 2011), limiting the free of charge access to services to a few social classes and introducing co-payment for the rest of the population
of the public insurance, therefore further limiting the effects of public insurance in expanding capacities and adding investments
clinics and adding hospital capacities – 54 private hospitals currently offer more than 3,000 beds, mostly in generalist units
clinic chains, with significant potential for restructuring – top 5 players have posted decreasing margins in 2011 versus 2009
with a significant number leaving for Western Europe
2013 – 2014 – THE YEARS TO DECIDE THE DECADEThe following couple of years have the potential to be decisive in how the healthcare sector will shape for the upcoming decades.
A number of crucial elements for the industry will have to be finally defined, such as the business models for private clinics, for private insurance and for private generalist hospitals. At the same time, the public sector covering all these markets will need to reshuffle, along with specialist hospitals and the emergency hospitals.
On the business model side, it is important for most players torealize that the risks posed by increased reliance on the state budget’s reimbursement of services is probably too high
the models which work are based on private subscription and payment for service.
Given the increasing importance of the private actors in all of these markets, the influence they will have over the state-run system is set to increase. Trends like increasing revenue per customer, additional investments in specialty hospitals (pediatrics, orthopedics, urology, obstetrics, cardiovascular
MCR HEALTHCARE
The two-headed healthcare system
Mihai A. Pop, MBA, Manager, Transaction Advisory Services, Ernst & Young
– the dinosaur and the phoenix.Expected trends for the coming years

217
and oncology), opening new major hospitals also outside Bucharest and second tier cities will exert direct changes in the public sector’s services.
Significant changes are expected in the private insurance, now the market presenting only a few accepted products – life insurance with medical coverage and check-up insurance, but little plain vanilla health insurance. In 2013-2014, with the opening of 18 more privately operated hospitals, the stock of beds should surpass the 4,500 threshold, which in turn would enable a better national coverage for medical insurance services.
Regarding individual players, the consolidation will continue, fueled by finance from private equity and banks, and sustained by the profits of the entities with critical mass. The margins of the smaller players will narrow in the competitive market. The current consolidation trend has included mostly the clinics and laboratories markets, with signs of interest extending to general hospitals and specialty hospitals, but the market is still largely fragmented. Out of the total 59 companies operating 186 clinics nation-wide, only the largest six chains account for 83 clinics – operated under the brands Regina Maria, Romar, Medlife, Medcenter, Medicover and Hiperdia.
It is worth a mention, that there is a concentration for the medical services in Bucharest.A valid example is that of the clinics which in Bucharest and surroundings number 92 units, whilst the rest of the country accounts for another 94 units. This also applies for private investments in hospitals, with only 4 located out of Bucharest from the proposed 18 hospitals to open in the next couple for years.
We should conclude that, in the healthcare markets, where significant private players are actors or influencers, both growth and maturity are expected for the coming years, while top actors have the prerequisite to deliver results for the long term.
When looking at the public sector, the facts are less positive, with an expected decrease of available funding for the maintenance and investment in the health sector, and a decrease of public insurance funds as a percentage of the overall market size. The realities in this market will continue to offer a dim perspective, probably of further cuts and reductions, in a way keeping pace with the development of private operators.
This view is supported by the long term decrease of contributors to the public insurance budget, at the same time with increasing number of covered individuals.
The “brain drain” effect of medical specialists is expected to take a change in the following decade with creating more local financial support for the newer generation. The first signs of improvement come from the increasing salary levels offered by private operators. Nevertheless, the drainage phenomenon is expected to continue, but the actual rates to decrease significantly. Later in the decade, with the appropriate support in place, healthcare specialists will return from more developed Western markets, directly into, by then, the competitive private system.
On the short term, an array of issues seek urgent resolution and most of these need a swift decision to deeply restructure the system. As there are three main targets, the most important is to control, decrease and eliminate a number of costs – close a number of hospitals, decrease the services offered free of charge, decrease the number of fixed points for emergency relief etc., as per IMF negotiations. The other targets are to create additional revenues – the co-payment scheme, and concentrate spending in critical points – and more mobile services with wider coverage, to create excellence centers and link them with rapid ambulance logistics, and to enable better schooling and early development programs.
Regarding the notable individuals which stood out in the past year, Dr. Raed Arafat emerged as a major influencer in regards to the direction the public system restructuring.In October, he was assigned to a position where he will directly oversee the financing of the health budget for 2013.
Trusting that the short term financing will be agreed, the Ministry should use the opportunity to lay out a medium term perspective for the sector. This will insure visibility for the private players, will encourage investments and comfort external financiers backing the investments.
In conclusion, the apparent benefits of a state-run healthcare system have been abused, thus pushing the system into a state of obsolesce. In turn, this has created opportunities for private players, at first to occupy niches, and then to consolidate with similar, or sometimes better services to those offered by the state entities.
For the past 15 years, the evolution driver in the entire health environment has been the misgivings of the centralized system. However, with private actors having more influence, interest and entrepreneurial vision, this is about to change. The lack of clear roadmap from the Ministry might nevertheless hamper the efforts to make the change a significant and rapid one.
2012 EDITION Major Companies in Romania


INTEGRATED MEDICAL SERVICES – THE NEED, THE WILL AND THE SOLUTION A phenomenon that has to be underlined in the current background of healthcare landscape in Romania is the lack of a larger infrastructure of multifunctional
six hospitals in Bucharest and another seven county hospitals that are able to deliver the capacity of multi-specialty sections. Now, in Romania, more than half of the country hospitals are sending their patients with multiple injuries or more complex illnesses to the main counties. These things are happening because only large hospitals can handle the needs of more complex cases and their number can be counted on a hand’s fingers in Romania. I consider the measure of closing the 150 hospitals was a right one, as they were only functioning as first-aid n units. It is fair to search for a solution in order to vitalize a system.
On the other hand, let’s not forget that Romania assigns the lowest budget in Europe for the healthcare system. Just to compare: A Romanian patient benefits from an amount of 325 Euro yearly, while a patient living in a western country, is assigned several thousand Euros. Everything in this segment depends on the political will. The health, as a vital system in the Romanian economy is assigned the smallest share of GDP in Europe. In 2012, health sector has been budgeted with only 3.7 percent from the GDP, while in 2009, it had 5.6 percent. The European average is 9.9 percent from the countries’ GDP assigned to healthcare.
VAGUE LAW CAUSES VAGUE IMPLEMENTATION The reforming of medical system is a good idea, as it is a welcoming idea to change in better what it is malfunctioning. But this should happen only under the condition of a blunt clarity. I fear that my only expectation to this reform is another delay as it happened before in the case of pensions, where three years were needed in order to see a final form and to be implemented. I think that a detailed yet solid law is the best solution for the healthcare system. The major outcome of such a law is that would leave less to no space to second guesses and questionable implementation. Otherwise, we currently end up with an unclear law, vague, with too general regulatory statements and, as practice proved it, a vague law results in vague implementations.
The private system will strongly depend on the new health law. We are talking currently of a private market worth an approximate 500 million Euros and that is estimated to evolve in the next years with a double digit growth. However, the corporate market is declining, and the word “cannibalized” fits to the context. The present estimations state that the spending of a patient in private clinics decreased by 10-15 percent. Even if the number of patients increased in the last years, they spent less in the clinics.
THE CALL OF PRIVATE The investments in the private system are still attractive, considering that 30
Opinion
The urge of treating with good will MIHAI MARCU,
President of Medlife
percent of Romanian that would sign a health insurance only if there is a solid infrastructure of private hospitals. We are spending a lot of time talking about how much is the state spending for the health in Romania and how much is the private medical system injecting in the field. But I have to add that approximate half of private companies receive money from the state, for instance, dialysis companies, some laboratories. At this moment, physicians and even academicians wish to work in the medical private system.
In Eastern European countries, the private health policies just don’t work. Following the studies, 70 percent from the citizens said they would not apply for a health insurance. Also, the negotiations regarding the market of private insurance policies worth now near 10 million Euro has been resumed in the beginning of this year when the new health law has been drafted.
“PRIVATE MEDICAL MARKET IS WORTH AN APPROXIMATE 500 MILLION EURO AND A DOUBLE DIGIT GROWTH IS ESTIMATED FOR THE NEXT YEARS.”
MCR

MEDICAL CENTERSRANK COMPANY NAME MCR SCORING ANNUAL TURNOVER
( 2011 RON)TURNOVER
RANKINGPROFIT/LOSS
(2011 RON)NO OF
EMPLOYEES CONTACT
1 CLINICA SANTE SRL 2.088 17,273,721 21 5,702,974 161 Buzau, Buzau
2 BIOCLINICA SA 2.038 32,978,063 12 1,274,759 135 Timisoara, Timis
3 AMBULANTA BGS MEDICAL UNIT SRL 2.025 19,963,463 19 6,058,131 310 Bucuresti, sector 4
4 RENAMED MEDICAL SERVICE II SRL 2.000 11,588,078 29 1,251,678 50 Craiova, Dolj
5 CLINICA MEDICALA HIPOCRAT 2000 SRL 1.988 14,943,226 24 4,148,370 193 Bucuresti, Sector 2
6 RENAMED DIALCARE SRL 1.988 12,064,672 28 1,433,250 55 Craiova, Dolj
7 NEFRO CLINIC SRL 1.938 13,959,821 25 1,346,425 68 Ploiesti, Prahova
8 RENAMED NEFRODIAL SRL 1.938 11,156,529 30 970,620 52 Craiova, Dolj
9 CENTRUL MEDICAL MED-AS 2003 SRL 1.925 34,525,641 11 1,848,319 374 Bucuresti, Sector 5
10 SYNEVO ROMANIA SRL 1.875 99,965,044 3 9,188,228 561 Chiajna, Ilfov
11 CBC LABORATORIES SA 1.850 17,585,123 20 8,138,287 31 Cluj-Napoca, Cluj
12 OCULUS SRL 1.850 13,587,330 27 1,416,338 48 Bucuresti, Sector 1
13 NEFROMED SRL 1.788 13,635,040 26 2,094,332 61 TIMISOARA, TIMIS
14 GRAL MEDICAL SRL 1.775 60,136,754 7 1,174,633 416 Bucuresti, Sector 3
15 NEFROMED DIALYSIS CENTERS SRL 1.775 58,260,193 8 1,590,838 278 Bucuresti, Sector 1
16 CLINICA POLISANO SRL 1.775 29,805,504 15 789,758 282 Sibiu, Sibiu
17 CLINICA ROMGERMED SRL 1.738 22,438,880 17 1,268,648 158 Bucuresti, Sector 6
18 INTERNATIONAL HEALTHCARE SYSTEMS SA 1.725 85,327,992 5 2,170,643 427 Bucuresti, Sector 1
19 MEDSANA BUCHAREST MEDICAL CENTER SRL 1.688 20,216,151 18 -1,556,727 121 Bucuresti, Sector 5
20 MED LIFE SA 1.663 166,457,784 1 -3,733,100 1162 Bucuresti, Sector 1
21 PETROMED SOLUTIONS SRL 1.588 24,562,698 16 345,082 145 Bucuresti, Sector 1
22 EUROMATERNA SA 1.588 16,852,201 22 2,804,604 101 Constanta, Constanta
23 CENTRUL MEDICAL UNIREA SRL 1.575 92,746,376 4 -16,326,040 503 Bucuresti, Sector 1
24 SANADOR SRL 1.575 68,577,456 6 -15,008,842 476 Bucuresti, Sector 1
25 MEDICOVER SRL 1.575 46,067,848 10 -9,746,532 433 Bucuresti, Sector 1
26 ATHENA HOSPITAL SRL 1.488 16,635,179 23 282,287 81 Timisoara, Timis
27 FRESENIUS NEPHROCARE ROMANIA SRL 1.475 129,838,182 2 1,319,202 532 Bucuresti, Sector 1
28 HIPERDIA SA 1.475 50,465,154 9 -5,283,366 325 Brasov, Brasov
29 MEDCENTER SRL 1.475 31,026,088 13 -8,344,865 404 Bucuresti, Sector 2
30 PELICAN IMPEX SRL 1.438 30,110,241 14 1,273,420 241 Oradea, Bihor
DENTAL CENTERSRANK COMPANY NAME MCR SCORING ANNUAL TURNOVER
( 2011 RON)TURNOVER
RANKINGPROFIT/LOSS
(2011 RON)NO OF
EMPLOYEES CONTACT
1 BIOSTOM SRL 1.900 1,366,134 10 45,383 16 Bucuresti, Sector 4
2 DENT ESTET CLINIC SRL 1.850 9,907,901 1 500,171 44 Bucuresti, Sector 1
3 MEDICAL TOURS COMPANY SRL 1.850 6,875,374 2 447,337 30 Pitesti, Arges
4 MAIODENT SRL 1.850 3,839,188 4 518,020 15 Bucuresti, Sector 2
5 M.G. MEDICAL SRL 1.700 2,131,509 7 107,050 14 Bucuresti, Sector 2
6 CLINICA MEDICALA DENTIRAD SRL 1.700 2,053,948 8 133,167 38 Plopeni, Prahova
7 DENTAL-ALEX SRL 1.700 1,578,058 9 218,227 10 Brasov, Brasov
8 CITY DENT SRL 1.650 3,504,212 5 122,812 21 Bucuresti, Sector 2
9 DENTALMED COM SRL 1.550 2,991,224 6 143,541 47 Brasov, Brasov
10 DENTAL MED - CLINICA STOMATOLOGICA SRL 1.500 6,127,873 3 222,788 27 Bucuresti, Sector 5
221
2012 EDITION Major Companies in Romania

MCR

2232012 EDITION Major Companies in Romania

MCR


