MCLEOD COUNTY BOARD OF COMMISSIONER'S 2013 BUDGET …
42
MCLEOD COUNTY BOARD OF COMMISSIONER'S Bev Wangerin - Chairperson Ray Bayerl - Vice Chairperson Kermit Terlinden Paul Wright Sheldon Nies Commissioners' Room 830 11th Street East Glencoe, MN 55336 2013 BUDGET HEARING Thursday, November 29, 2012 6:00 p.m. McLeod County Courthouse
Transcript of MCLEOD COUNTY BOARD OF COMMISSIONER'S 2013 BUDGET …
MCLEOD COUNTY
BOARD OF COMMISSIONER'S
Bev Wangerin - Chairperson
Ray Bayerl - Vice Chairperson
Kermit Terlinden
Paul Wright
Sheldon Nies
Commissioners' Room
830 11th Street East
Glencoe, MN 55336
2013 BUDGET HEARING
Thursday, November 29, 2012
6:00 p.m.
McLeod County Courthouse
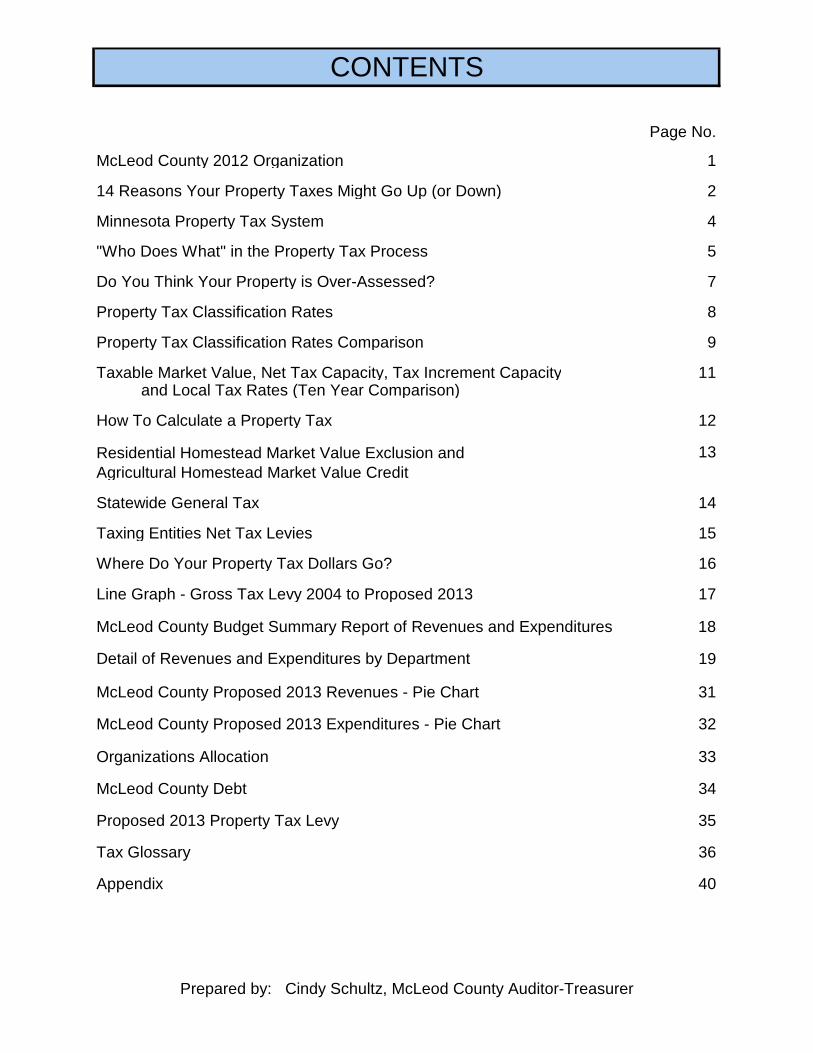
Page No.
McLeod County 2012 Organization 1
14 Reasons Your Property Taxes Might Go Up (or Down) 2
Minnesota Property Tax System 4
"Who Does What" in the Property Tax Process 5
Do You Think Your Property is Over-Assessed? 7
Property Tax Classification Rates 8
Property Tax Classification Rates Comparison 9
Taxable Market Value, Net Tax Capacity, Tax Increment Capacity 11 and Local Tax Rates (Ten Year Comparison)
How To Calculate a Property Tax 12
Residential Homestead Market Value Exclusion and Agricultural Homestead Market Value Credit
13
Statewide General Tax 14
Taxing Entities Net Tax Levies 15
Where Do Your Property Tax Dollars Go? 16
Line Graph - Gross Tax Levy 2004 to Proposed 2013 17
McLeod County Budget Summary Report of Revenues and Expenditures 18
Detail of Revenues and Expenditures by Department 19
McLeod County Proposed 2013 Revenues - Pie Chart 31
McLeod County Proposed 2013 Expenditures - Pie Chart 32
Organizations Allocation 33
McLeod County Debt 34
Proposed 2013 Property Tax Levy 35
Tax Glossary 36
Appendix 40
CONTENTS
Prepared by: Cindy Schultz, McLeod County Auditor-Treasurer

County Commissioners: Term Expires1st District Ray Bayerl January 20132nd District Kermit Terlinden January 20153rd District Paul Wright January 20134th District Sheldon Nies January 20135th District Beverly Wangerin January 2013
Elected County Officers:County Attorney Michael K. Junge January 2015County Auditor-Treasurer Cindy Schultz January 2015County Recorder Lynn Ette Schrupp January 2015County Sheriff Scott Rehmann January 2015Judge of District Court - Seat 26 Michael R. Savre January 2013Judge of District Court - Seat 29 Terrence E. Conkel January 2013
Appointed Department Heads:County Administrator Pat MelvinCounty Assessor Sue SchulzCounty Environmentalist Roger BerggrenCounty Highway Engineer John BrunkhorstCounty Information Systems Manager Vincent TraverCounty Nursing Director Kathy NowakCounty Parks Superintendent Allan KoglinCounty Social Services Director Gary SprynczynatykCounty Solid Waste Administrator Edwin Homan Jr.County Zoning Administrator Larry GasowCounty Veterans Service Officer James LauerCourt Administrator Karen Messner
Appointed Positions:County Agricultural Inspector Allan KoglinCounty Building Services Wayne RosenfeldCounty Coroner Dr. Janis AmatuzioCounty Emergency Services Director Kevin MathewsCounty Extension Technical Advisor Nathan WinterCounty Extension 4-H Coordinator Jill GramsCounty Human Resources Mary Jo WieselerCounty Surveyor Jeff Rausch
McLeod County 2012 Organization
1

1. The market value of your property may change. Each parcel of property is assessed at least once every five years.
Each year a sales ratio study is done to determine if the property is assessed similarly to like properties.
You may make additions or improvements to your property which increases its market value.
2. If the market value of a property increases more or less than the average increase or decrease in
a taxing district, the taxes on that property will also change.
New construction in a taxing district increases the tax base and will affect the district's tax rate.
3. The State General Property Tax may change. The State Legislature directly applies a State General Property Tax to commercial/industrial and
seasonal/recreational property classes.
4. The County Budget and Levy may change. Each year a county reviews the needs and wants of their citizens and how to meet those
discretionary needs and wants. Also included in the county budget is non-discretionary spending which is required by state and federal mandates and court decisions and orders. As much as sixty to eighty-five percent of the county expenditures are used to deliver mandated services.
5. The City Budget and Levy may change. Each year cities review the needs and wants of their citizens and how to meet those needs and
wants. This is called "discretionary spending" in the city budget. Also included in the budget is non-discretionary spending which is required by state and federal mandates and court decisions and orders.
6. The Township Budget and Levy may change. Each year in March townships set the levy and budget for the next year.
7. The School District's Budget and Levy may change. The Legislature determines basic funding levels for K-12 education and mandates services that
schools must perform. On average, approximately seventy percent of school costs are paid by the state.
Local school districts set levies for many purposes including transportation, community education, safe schools, etc.
8. A Special Districts Budget and Levy may change. Special districts such as the hospital districts, watershed districts, libraries, etc. set levies to
balance their budgets.
14 Reasons Your Property Taxes Might Go Up (or Down)
Why Property Taxes Vary From Year to Year
The market value of other properties in your taxing district may change, shifting taxes from one property to another.
2

9. Voters may have approved a School, City, Town, or County Referendum. Local referendums may be held for local government construction projects, excess operating levies for
schools or many other purposes.
Referendum levies may be spread on the market value or the tax capacity of a property depending on process and type of referendum levy.
10. Federal or state mandates may have changed. Both the state and federal governments require local governments to provide certain services and
follow certain rules. These mandates often require an increase in the cost and level of service delivery.
11. Aid and Revenue from the State and Federal government may have changed. Each year the legislature reviews and adjusts the level of funding for a variety of aids provided to local
governments including Local Government Aid (LGA), Disparity Reduction Aid (DRA), and County Program Aid (CPA). The formulas for how aid is determined and distributed among local governments may have changed.
While direct aid and revenue from the federal government to local governments has declined greatly in recent years, federal revenue continues to be a key portion of the local government revenue stream and that revenue stream may have changed.
12. A change in class rates will require a change in the tax rate to raise the same amount of money.
13. Fiscal disparities, personal property taxes on utilities properties, limited market value, and tax
increment financing and the new homestead market value exclusion are examples of laws that affect property taxes.
14. Special assessments may have been added to your property tax bill. Water lines, curb and gutter, and street improvements that directly benefit your property may be
funded, in whole or in part, through a special assessment that is added to your property tax bill.
The state legislature may have changed class rates, shifting taxes in your area.
Other State Law changes may adjust the tax base.
3
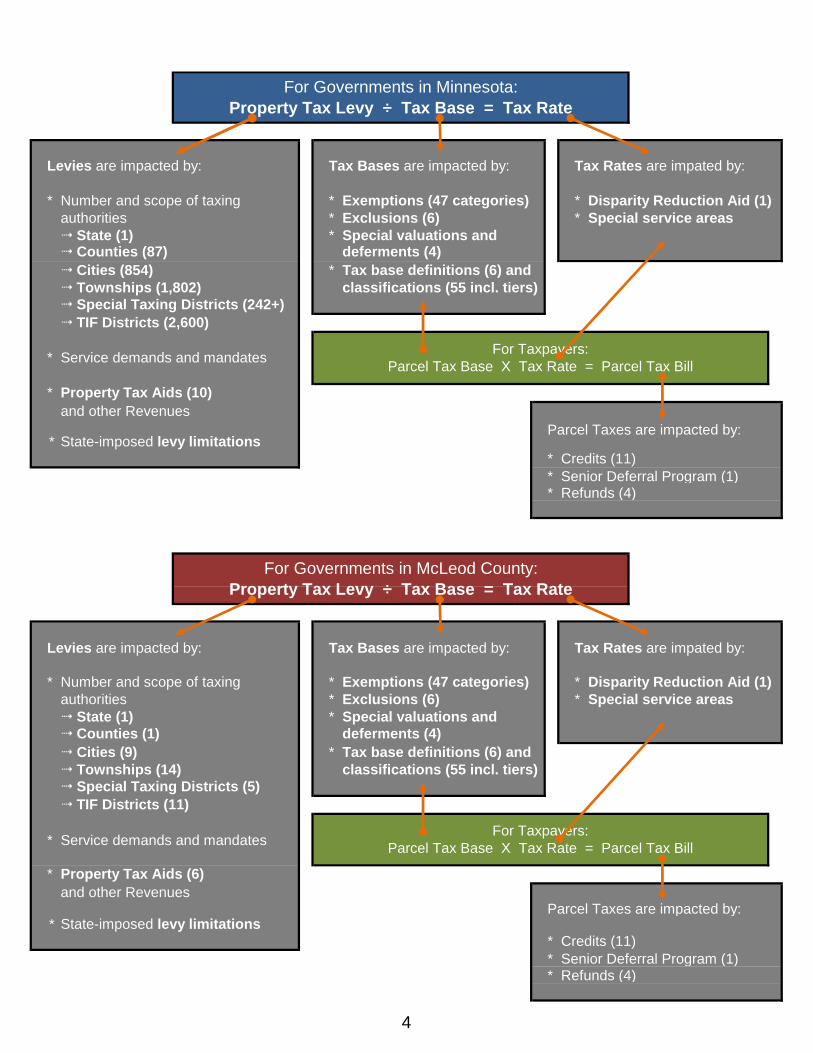
Levies are impacted by: Tax Bases are impacted by: Tax Rates are impated by:
* Number and scope of taxing * Exemptions (47 categories) * Disparity Reduction Aid (1)authorities * Exclusions (6) * Special service areas State (1) * Special valuations and Counties (87) deferments (4) Cities (854) * Tax base definitions (6) and Townships (1,802) classifications (55 incl. tiers) Special Taxing Districts (242+) TIF Districts (2,600)
* Service demands and mandates
* Property Tax Aids (10)and other Revenues
Parcel Taxes are impacted by:
* Credits (11)* Senior Deferral Program (1)* Refunds (4)
Levies are impacted by: Tax Bases are impacted by: Tax Rates are impated by:
* Number and scope of taxing * Exemptions (47 categories) * Disparity Reduction Aid (1)authorities * Exclusions (6) * Special service areas State (1) * Special valuations and Counties (1) deferments (4) Cities (9) * Tax base definitions (6) and Townships (14) classifications (55 incl. tiers) Special Taxing Districts (5) TIF Districts (11)
* Service demands and mandates
* Property Tax Aids (6)and other Revenues
Parcel Taxes are impacted by:
* Credits (11)* Senior Deferral Program (1)* Refunds (4)
For Governments in McLeod County: Property Tax Levy ÷ Tax Base = Tax Rate
For Taxpayers: Parcel Tax Base X Tax Rate = Parcel Tax Bill
* State-imposed levy limitations
For Governments in Minnesota: Property Tax Levy ÷ Tax Base = Tax Rate
For Taxpayers: Parcel Tax Base X Tax Rate = Parcel Tax Bill
State-imposed levy limitations*
4
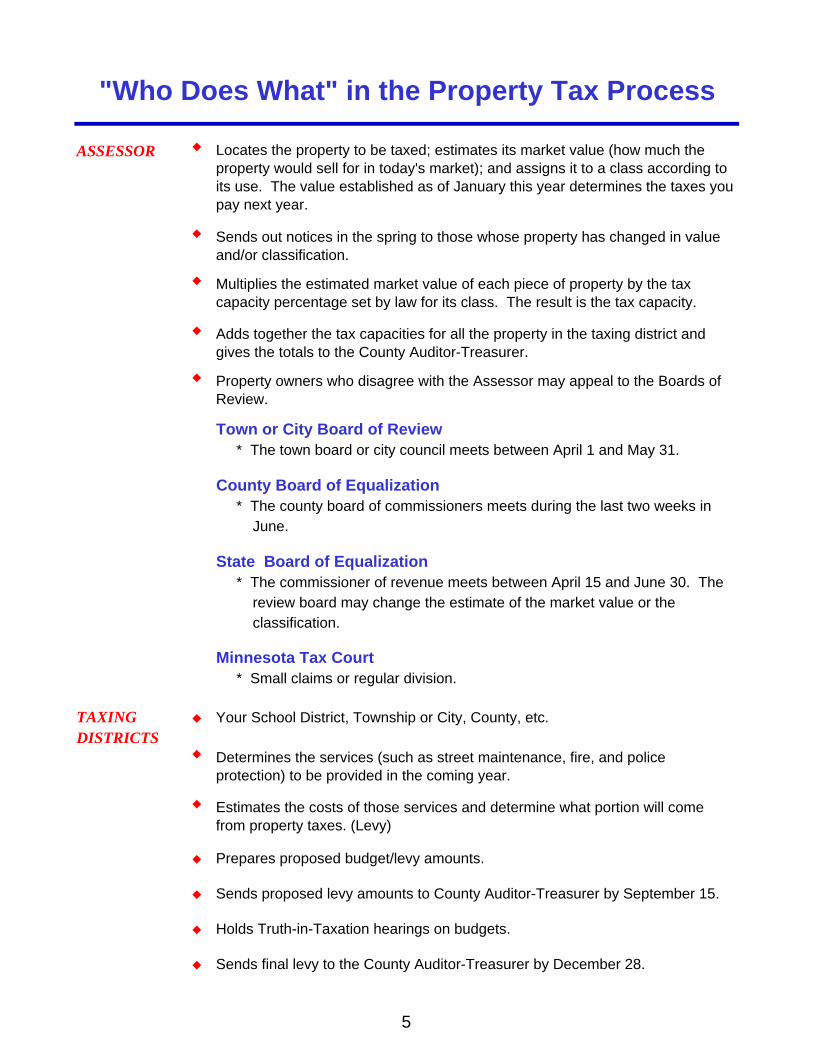
ASSESSOR
Town or City Board of Review * The town board or city council meets between April 1 and May 31.
County Board of Equalization * The county board of commissioners meets during the last two weeks in June.
State Board of Equalization * The commissioner of revenue meets between April 15 and June 30. The review board may change the estimate of the market value or the classification.
Minnesota Tax Court * Small claims or regular division.
TAXING Your School District, Township or City, County, etc.
DISTRICTS
Prepares proposed budget/levy amounts.
Sends proposed levy amounts to County Auditor-Treasurer by September 15.
Holds Truth-in-Taxation hearings on budgets.
Sends final levy to the County Auditor-Treasurer by December 28.
Estimates the costs of those services and determine what portion will come from property taxes. (Levy)
Adds together the tax capacities for all the property in the taxing district and gives the totals to the County Auditor-Treasurer.
Property owners who disagree with the Assessor may appeal to the Boards of Review.
Determines the services (such as street maintenance, fire, and police protection) to be provided in the coming year.
"Who Does What" in the Property Tax Process
Locates the property to be taxed; estimates its market value (how much the property would sell for in today's market); and assigns it to a class according to its use. The value established as of January this year determines the taxes you pay next year.
Sends out notices in the spring to those whose property has changed in value and/or classification.
Multiplies the estimated market value of each piece of property by the tax capacity percentage set by law for its class. The result is the tax capacity.
5
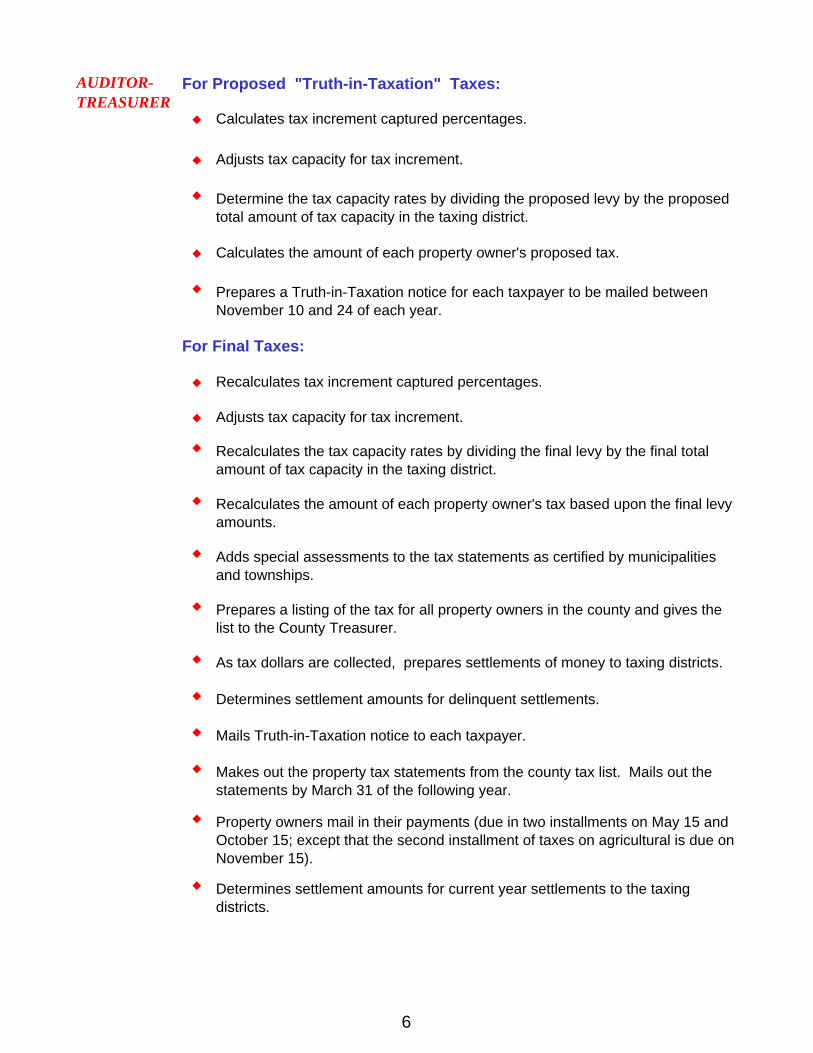
For Proposed "Truth-in-Taxation" Taxes:
Calculates tax increment captured percentages.
Adjusts tax capacity for tax increment.
Calculates the amount of each property owner's proposed tax.
For Final Taxes:
Recalculates tax increment captured percentages.
Adjusts tax capacity for tax increment.
Determines settlement amounts for delinquent settlements.
Mails Truth-in-Taxation notice to each taxpayer.
Determines settlement amounts for current year settlements to the taxing districts.
Adds special assessments to the tax statements as certified by municipalities and townships.
Prepares a listing of the tax for all property owners in the county and gives the list to the County Treasurer.
As tax dollars are collected, prepares settlements of money to taxing districts.
Makes out the property tax statements from the county tax list. Mails out the statements by March 31 of the following year.
Recalculates the amount of each property owner's tax based upon the final levy amounts.
Property owners mail in their payments (due in two installments on May 15 and October 15; except that the second installment of taxes on agricultural is due on November 15).
AUDITOR-TREASURER
Determine the tax capacity rates by dividing the proposed levy by the proposed total amount of tax capacity in the taxing district.
Prepares a Truth-in-Taxation notice for each taxpayer to be mailed between November 10 and 24 of each year.
Recalculates the tax capacity rates by dividing the final levy by the final total amount of tax capacity in the taxing district.
6

The diagram below shows the steps in contesting your property valuation:
Visit Your Local Assessor's Office
1-Step Appeal
Check the facts
Compare neighboring property values
Seek an adjustment
Appeal to City or Town "Board of Review"
2-Step Appeal Meets in April or May
Appeal in person or by letter
Call city or town clerk for appointment
Appeal to County "Board of Equalization"
3-Step Appeal Meets some time the last two weeks in June
Appeal in person or by letter
Call County Auditor or Assessor for appointment
4-Step Appeal Appeal to the Minnesota Tax Court
Appeal by April 30 of year following assessment
Regular Division Small Claims Division
Attorney recommended Attorney not necessary
Decisions appealable to Supreme Court Decisions final
Can be used for any property Use for your home, or any propertyassessed under $100,000
Must be used for property assessed over
$100,000
Do You Think Your Property is Over-Assessed?
7

Residential Homestead First $500,000 of market value 1.00% Yes No Value over $500,000 1.25% Yes No Residential Non-Homestead First $500,000 of market value 1.00% Yes No Value over $500,000 1.25% Yes No Commercial and Industrial First $150,000 of market value 1.50% Yes Yes Value over $150,000 2.00% Yes Yes Farm Homesteads House, garage, one acre First $500,000 of market value 1.00% Yes No Value over $500,000 1.25% Yes No Remainder of Farm: First $1,290,000 of market value 0.50% No No Value over $1,290,000 1.00% No No Farm Non-Homesteads House, garage, one acre First $500,000 of market value 1.00% Yes No Value over $500,000 1.25% Yes No Land 1.00% No No Residential Rental (Apartments) 2-3 units 1.25% Yes No 4 or more units 1.25% Yes No Seasonal Cabins (Non-Commercial) First $500,000 of market value 1.00% No Yes-40% Value over $500,000 1.25% No Yes
HOW TO USE THE CLASSIFICATION RATES:
Property Tax Classification RatesWhat They Are, How They Work
Determine the Taxable Market Value and Classification the Assessor's Office has assigned to the property.
Multiply the Market Value by the State Legislature mandated percentage (classification rate) based on the Classification of the Property (these percentages are uniform statewide). The result of this computation is called the Net Tax Capacity.
Payable 2013 Classification Rates range from .45% to 2.00%. Classification Rates for selected property classes are shown below:
Example: Suppose your home is valued at $100,000 Residential Homestead.
PROPERTY TYPE NTC CLASS RATE
SUBJECT TO RMV
TAX
SUBJECT TO STATE
TAX
Your Home's Tax Capacity Equals:($100,000 X 1%) = $1,000
8
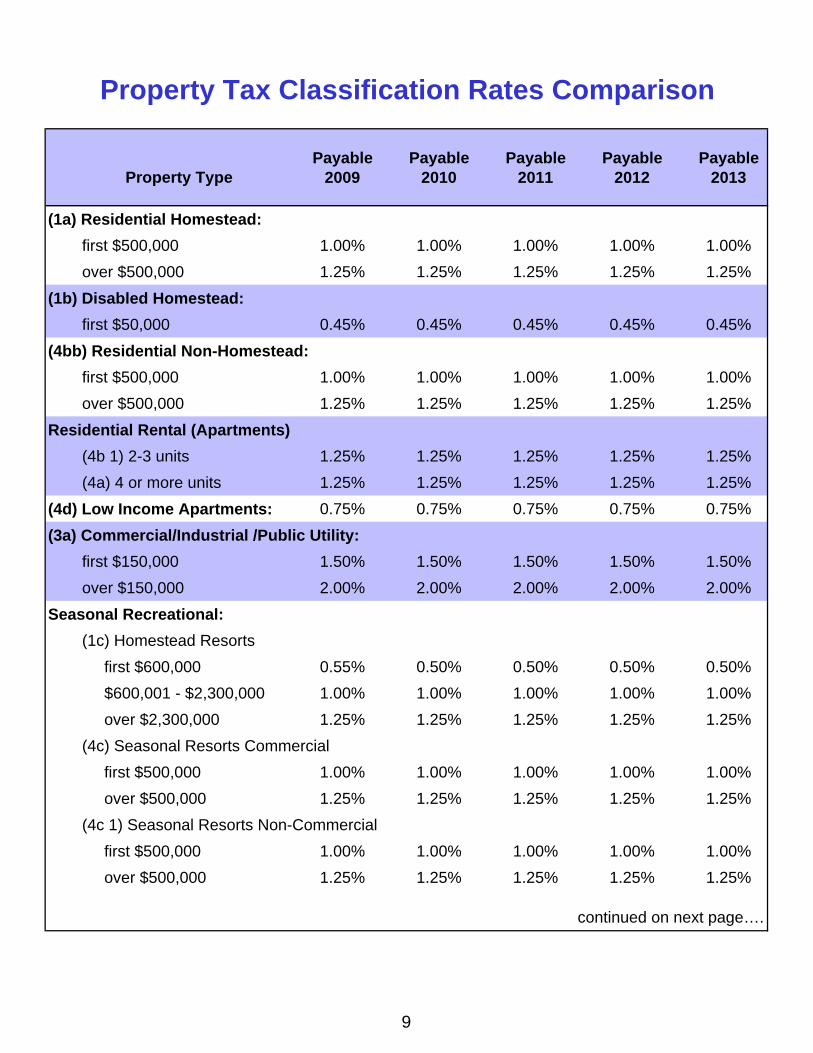
Payable Payable Payable Payable Payable2009 2010 2011 2012 2013
(1a) Residential Homestead:
first $500,000 1.00% 1.00% 1.00% 1.00% 1.00%
over $500,000 1.25% 1.25% 1.25% 1.25% 1.25%
(1b) Disabled Homestead:
first $50,000 0.45% 0.45% 0.45% 0.45% 0.45%
(4bb) Residential Non-Homestead:
first $500,000 1.00% 1.00% 1.00% 1.00% 1.00%
over $500,000 1.25% 1.25% 1.25% 1.25% 1.25%
Residential Rental (Apartments)
(4b 1) 2-3 units 1.25% 1.25% 1.25% 1.25% 1.25%
(4a) 4 or more units 1.25% 1.25% 1.25% 1.25% 1.25%
(4d) Low Income Apartments: 0.75% 0.75% 0.75% 0.75% 0.75%
(3a) Commercial/Industrial /Public Utility:
first $150,000 1.50% 1.50% 1.50% 1.50% 1.50%
over $150,000 2.00% 2.00% 2.00% 2.00% 2.00%
Seasonal Recreational:
(1c) Homestead Resorts
first $600,000 0.55% 0.50% 0.50% 0.50% 0.50%
$600,001 - $2,300,000 1.00% 1.00% 1.00% 1.00% 1.00%
over $2,300,000 1.25% 1.25% 1.25% 1.25% 1.25%
(4c) Seasonal Resorts Commercial
first $500,000 1.00% 1.00% 1.00% 1.00% 1.00%
over $500,000 1.25% 1.25% 1.25% 1.25% 1.25%
(4c 1) Seasonal Resorts Non-Commercial
first $500,000 1.00% 1.00% 1.00% 1.00% 1.00%
over $500,000 1.25% 1.25% 1.25% 1.25% 1.25%
Property Type
Property Tax Classification Rates Comparison
continued on next page….
9

Payable Payable Payable Payable Payable2009 2010 2011 2012 2013
Agricultural Homestead:
(2a) House, Garage, One Acre
first $500,000 1.00% 1.00% 1.00% 1.00% 1.00%
over $500,000 1.25% 1.25% 1.25% 1.25% 1.25%
(2a) Remainder of Farm
first $690,000 - - - - -
over $690,000 - - - - -
first $790,000 - - - - -
over $790,000 - - - - -
first $890,000 0.55% - - - -
over $890,000 1.00% - - - -
first $1,010,000 - 0.50% - - -
over $1,010,000 - 1.00% - - -
first $1,140,000 - - 0.50% - -
over $1,140,000 - - 1.00% - -
first $1,210,000 - - - 0.50% -
over $1,210,000 - - - 1.00% -
first $1,290,000 - - - - 0.50%
over $1,290,000 - - - - 1.00%
(2b) Non-Homestead 1.00% 1.00% 1.00% 1.00% 1.00%
Property Type
Property Tax Classification Rates Comparison
10
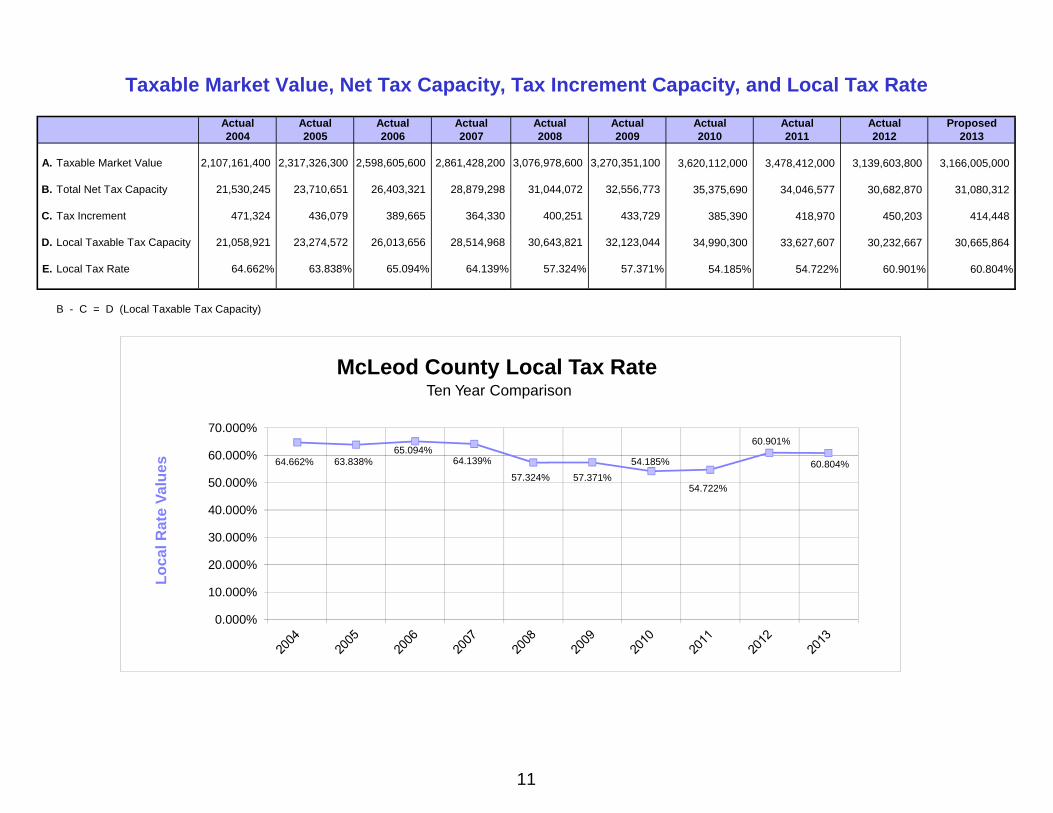
Actual Actual Actual Actual Actual Actual Actual Actual Actual Proposed2004 2005 2006 2007 2008 2009 2010 2011 2012 2013
A. Taxable Market Value 2,107,161,400 2,317,326,300 2,598,605,600 2,861,428,200 3,076,978,600 3,270,351,100 3,620,112,000 3,478,412,000 3,139,603,800 3,166,005,000
B. Total Net Tax Capacity 21,530,245 23,710,651 26,403,321 28,879,298 31,044,072 32,556,773 35,375,690 34,046,577 30,682,870 31,080,312
C. Tax Increment 471,324 436,079 389,665 364,330 400,251 433,729 385,390 418,970 450,203 414,448
D. Local Taxable Tax Capacity 21,058,921 23,274,572 26,013,656 28,514,968 30,643,821 32,123,044 34,990,300 33,627,607 30,232,667 30,665,864
E. Local Tax Rate 64.662% 63.838% 65.094% 64.139% 57.324% 57.371% 54.185% 54.722% 60.901% 60.804%
B - C = D (Local Taxable Tax Capacity)
Taxable Market Value, Net Tax Capacity, Tax Increment Capacity, and Local Tax Rate
64.662% 63.838%65.094%
64.139%
57.324% 57.371%
54.185%
54.722%
60.901%
60.804%
0.000%
10.000%
20.000%
30.000%
40.000%
50.000%
60.000%
70.000%
Lo
cal R
ate
Val
ues
McLeod County Local Tax RateTen Year Comparison
11

1. Market Value of $100,000 classified as Residential Homestead.
2. Calculate the Tax Capacity reducing it by the Market Value Exclusion:
The first 76,000 X 40% = 30,400 76,000 - 30,400 = 24,000 24,000 X 9% = 2,160 30,400 - 2,160 = 28,240 (Market Value Exclusion Amount)100,000 - 28,240 = 71,760 (Taxable Market Value)
71,760 x 1.00% = 718
3. Determine the Tax Rate:
4.
718 x 1.56829 = $1,126.03100,000 x 0.0018885 = 188.85
Total…………………… $1,314.88
How To Calculate A Property Tax
*** Example ***
(718 equals the net tax capacity)
Assume the property is located in the City of Glencoe, in School District #2859, and in Buffalo Creek Watershed (005). The payable 2013 local tax rate is 156.8290% and the payable 2013 market value referenda rate is 0.18885%.
Calculate the Gross Tax (excluding special assessments):
12
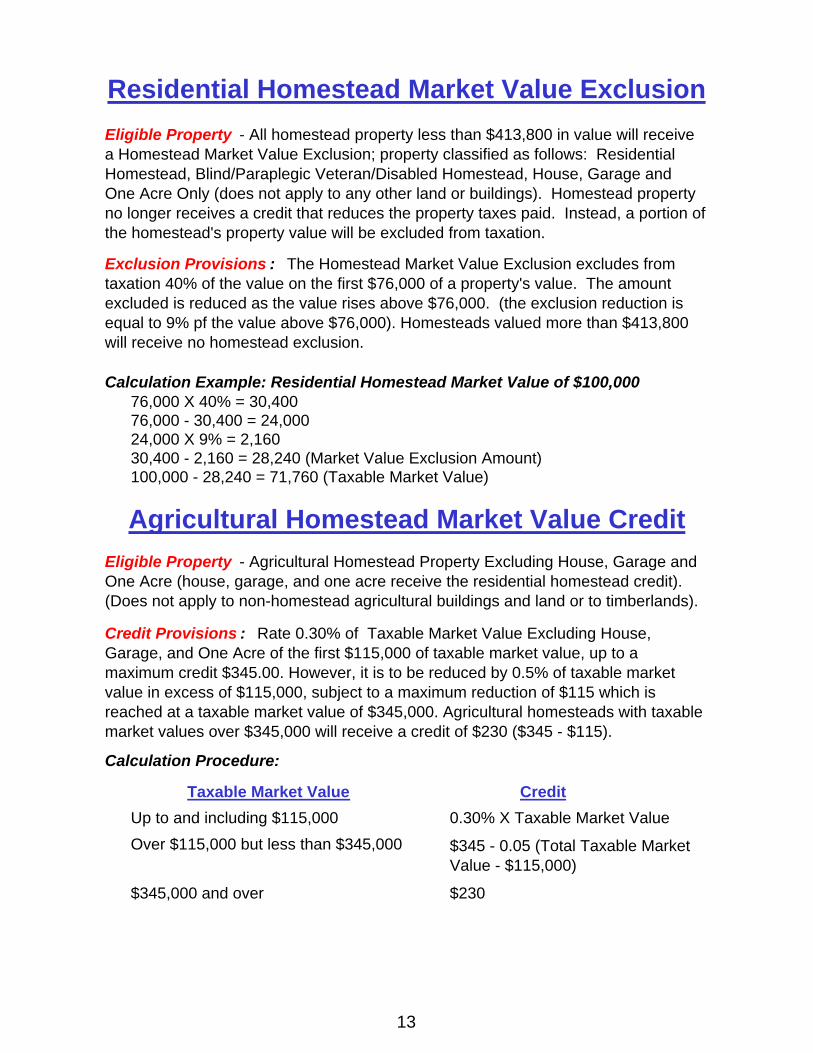
Calculation Example: Residential Homestead Market Value of $100,00076,000 X 40% = 30,40076,000 - 30,400 = 24,00024,000 X 9% = 2,16030,400 - 2,160 = 28,240 (Market Value Exclusion Amount)100,000 - 28,240 = 71,760 (Taxable Market Value)
Calculation Procedure:
Taxable Market Value Credit
Up to and including $115,000 0.30% X Taxable Market Value
Over $115,000 but less than $345,000
$345,000 and over $230
$345 - 0.05 (Total Taxable Market Value - $115,000)
Residential Homestead Market Value Exclusion
Eligible Property - All homestead property less than $413,800 in value will receive a Homestead Market Value Exclusion; property classified as follows: Residential Homestead, Blind/Paraplegic Veteran/Disabled Homestead, House, Garage and One Acre Only (does not apply to any other land or buildings). Homestead property no longer receives a credit that reduces the property taxes paid. Instead, a portion of the homestead's property value will be excluded from taxation.
Exclusion Provisions : The Homestead Market Value Exclusion excludes from taxation 40% of the value on the first $76,000 of a property's value. The amount excluded is reduced as the value rises above $76,000. (the exclusion reduction is equal to 9% pf the value above $76,000). Homesteads valued more than $413,800 will receive no homestead exclusion.
Agricultural Homestead Market Value Credit
Eligible Property - Agricultural Homestead Property Excluding House, Garage and One Acre (house, garage, and one acre receive the residential homestead credit). (Does not apply to non-homestead agricultural buildings and land or to timberlands).
Credit Provisions : Rate 0.30% of Taxable Market Value Excluding House, Garage, and One Acre of the first $115,000 of taxable market value, up to a maximum credit $345.00. However, it is to be reduced by 0.5% of taxable market value in excess of $115,000, subject to a maximum reduction of $115 which is reached at a taxable market value of $345,000. Agricultural homesteads with taxable market values over $345,000 will receive a credit of $230 ($345 - $115).
13

Statewide General TaxBackgroundDuring the 2001 legislative session, Minnesota enacted the first state property tax since taxes payable in 1967. The tax is only on certain properties and is part of a property tax reform law. Revenue from the new tax will be deposited in the state general fund with some of the money earmarked specifically for education funding.
Is my property affected by the state general tax?In general, there are three types of property that must pay the state general tax:
1. Commercial, industrial and public utility property exclusive of electric generating machinery.
2. Seasonal recreational property, including cabins.
3. Unmined iron ore property.
How much is the tax?There are various factors that will determine how much tax you pay. Some of the factors are the market value and type (class) of property you have and the state tax rate.
Generally speaking, the higher the value of your property, the greater that state tax. However, the taxes on a non-commercial cabin are calculated a little differently than taxes on other affected properties.
The first $76,000 in market value of a cabin will be taxed differently for state property tax purposes than it is for local property tax purposes. For example, if you have a cabin valued at $100,000, only 40% of the first $76,000 of market value would be subject to the new tax and the remaining $24,000 would be taxed at its full value.
The Minnesota Department of Revenue calculates the tax rate annually. Each year there will be different rates however, there are only one set of rates for the entire State of Minnesota. The rate will be set each year on November 1. For taxes payable 2013 the preliminary commercial-industrial state general levy property tax rate is 53.000% and the preliminary seasonal residential recreational state general levy property tax rate is 23.000%. This rate applies to the net tax capacity of the affected properties. Net tax capacity is a small percentage of a properties market value. The percentage varies by property class.
The rate is determined by the relative amount of statewide commercial/industrial, public utility, seasonal recreational, and unmined iron ore property value in relation to the expenditure needs that have been established.
For the first year in 2002, $592 million needs to be raised from the state tax. Under current law each subsequent year's amount will be increased from the previous year's amount by using the increase (if any) in the implicit price deflator for government consumption expenditures and gross investments published by the U.S. Bureau of Economic Analysis. This is basically an index of inflation.
What is the tax for?The state property tax will be paid to the County Treasurer at the same time that local property taxes are paid. The payment of state and local property taxes to the County Treasurer is to be a combined payment. Separate payments are not to be made. Unlike other property taxes, the money raised from the state general tax will not go directly to local governments (i.e. counties, cities, school districts, etc.) even though it will be collected with other property taxes.
Instead, money raised by the tax will be deposited in the state general fund. Beginning in 2004, the money raised beyond the 2004 tax amount will be deposited in an education reserve account. This is the money that was earmarked under the original law for funding education aid or higher education. The state legislature will decide specifically how this money will be spent.
14

Final Final Proposed Percent2011 2012 2013 of Increase
TOWNSHIPS AND CITIESAcoma Township 232,000 238,000 238,000 0.00%
Bergen Township 265,000 235,000 200,000 -14.89%
Collins Township 95,000 100,000 103,000 3.00%
Glencoe Township 65,000 75,000 75,000 0.00%
Hale Township 165,000 165,000 165,000 0.00%
Hassan Valley Township 143,000 143,000 150,000 4.90%
Helen Township 165,000 165,000 190,000 15.15%
Hutchinson Township 131,500 145,443 125,000 -14.06%
Lynn Township 94,500 110,000 110,000 0.00%
Penn Township 89,000 89,000 96,500 8.43%
Rich Valley Township 62,000 67,433 71,480 6.00%
Round Grove Township 100,000 95,000 95,000 0.00%
Sumter Township 95,000 95,000 95,000 0.00%
Winsted Township 193,000 208,000 207,000 -0.48%
Biscay City 16,628 17,126 17,640 3.00%
Brownton City 351,882 387,917 387,917 0.00%
Glencoe City 2,108,500 2,282,894 2,275,942 -0.30%
Hutchinson City 6,360,187 6,454,224 6,498,668 0.69%
Lester Prairie City 642,197 608,954 642,197 5.46%
Plato City 171,000 185,800 228,534 23.00%
Silver Lake City 481,137 490,136 505,898 3.22%
Stewart City 370,134 370,134 381,238 3.00%
Winsted City 1,117,629 1,117,629 1,117,629 0.00%SCHOOL DISTRICTS#0423-Hutchinson 2,580,254 2,456,380 2,480,459 0.98%
#0424-Lester Prairie 319,702 193,743 433,983 124.00%
#2159-Buffalo Lake Hector 572,168 567,448 582,435 2.64%
#2365-Gibbon Fairfax Winthrop 1,221,364 1,241,109 1,235,575 -0.45%
#2687-Howard Lake Waiverly Winsted 2,423,629 2,560,716 2,569,559 0.35%
#2859-Glencoe Silver Lake 954,585 912,525 989,887 8.48%COUNTYRevenue 9,127,032 9,627,032 9,627,032 0.00%
Road & Bridge 3,332,097 3,262,097 3,262,097 0.00%
Human Services 4,245,901 3,809,343 3,807,076 -0.06%
Trailblazer Transit 0 407,600 409,867 0.56%
Debt Service 285,815 0 0 0.00%
Pioneerland Library 187,513 187,513 187,513 0.00%
Capital Projects 0 1,000,000 1,000,000 0.00%
Capital Equipment Notes 1,115,227 0 0 0.00%
Total County 18,293,585 18,293,585 18,293,585 0.00%SPECIAL DISTRICTSBuffalo Creek Watershed 57,827 57,453 68,770 19.70%
High Island Watershed 21,255 29,786 29,160 -2.10%
Hutchinson EDA 159,985 154,174 150,218 -2.57%
Hutchinson HRA 130,000 140,000 150,000 7.14%
Region 6E 72,721 71,669 69,766 -2.66%
Total Tax Capacity Levies 40,321,369 40,524,278 41,030,040 1.25%MARKET VALUE LEVY SCHOOL DISTRICTS#423-Hutchinson 2,514,017 2,377,473 2,320,003 -2.42%
#424-Lester Prairie 498,911 453,602 450,977 -0.58%
#2159-Buffalo Lake Hector 486,520 554,713 430,604 -22.37%
#2365-Gibbon Fairfax Winthrop 365,484 719,129 695,930 -3.23%
#2687-Howard Lake Waverly Winsted 949,127 847,044 810,247 -4.34%
#2859-Glencoe Silver Lake 1,392,945 1,502,062 1,333,776 -11.20%
Total Market Value Levies 6,207,004 6,454,023 6,041,537 -6.39%
Grand Total Levies 46,528,373 46,978,301 47,071,577 0.20%
Taxing Entities Net Tax Levies
15
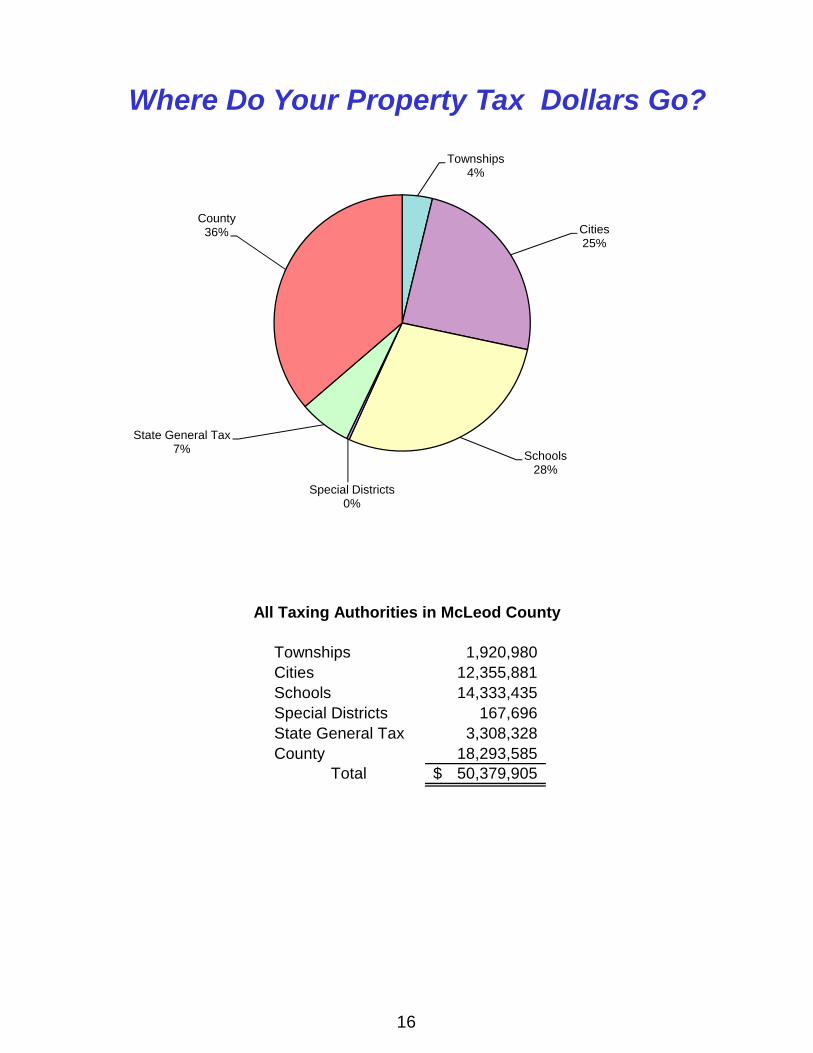
Townships 1,920,980Cities 12,355,881Schools 14,333,435Special Districts 167,696State General Tax 3,308,328County 18,293,585
Total 50,379,905$
All Taxing Authorities in McLeod County
Townships4%
Cities25%
Schools28%
Special Districts0%
State General Tax7%
County36%
Where Do Your Property Tax Dollars Go?
16

Fund 2004 2005 2006 2007 2008 2009 2010 2011 2012 2013
Revenue 7,895,100 7,439,451 8,665,179 8,683,679 8,970,945 9,255,727 9,686,526 9,127,032 9,627,032 9,627,032
Road & Bridge 1,195,812 1,828,754 2,308,754 2,546,085 3,041,515 3,332,097 3,332,097 3,332,097 3,262,097 3,262,097
Human Services 3,253,359 3,756,839 3,756,839 3,955,319 3,955,319 4,245,901 4,245,901 4,245,901 4,216,943 4,216,943
Debt Service 2,171,874 1,584,904 1,257,243 280,351 294,418 293,105 1,393,835 1,401,042 0 0
Pioneerland Library 128,700 130,000 145,919 160,000 172,734 179,848 187,513 187,513 187,513 187,513
Capital Projects 0 0 635,232 2,495,430 1,000,000 1,000,000 0 0 1,000,000 1,000,000
Total 14,644,845 14,739,948 16,769,166 18,120,864 17,434,931 18,306,678 18,845,872 18,293,585 18,293,585 18,293,585
Percent of Increaseor Decrease over 7.7% 0.6% 13.8% 8.1% -3.8% 5.0% 2.95% -2.93% 0.00% 0.00%Previous Year
McLeod County Gross Tax Levy Comparison - Payable 2004 to Proposed 2013
0
1,000,000
2,000,000
3,000,000
4,000,000
5,000,000
6,000,000
7,000,000
8,000,000
9,000,000
10,000,000
McLeod County Gross Tax LevyPayable 2004 to Proposed 2013
Revenue Road & Bridge Human Services Capital Projects Debt Service
17
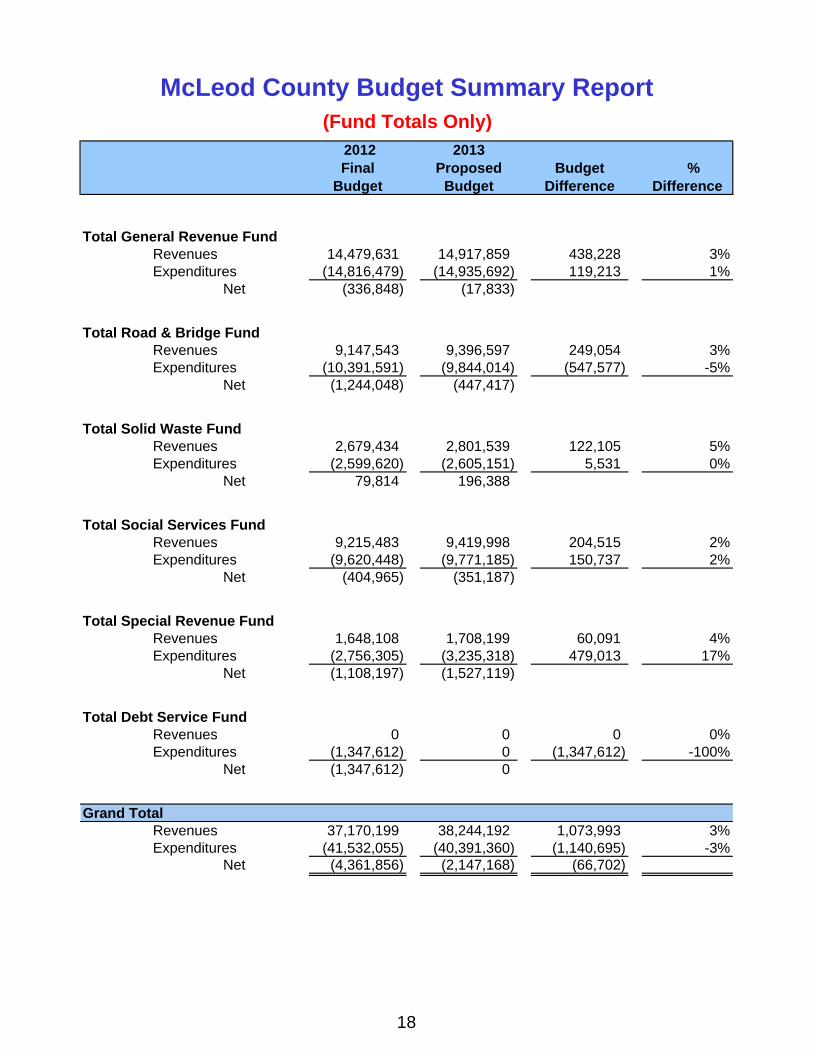
2012 Final
Budget
2013 Proposed
BudgetBudget
Difference %
Difference
Total General Revenue FundRevenues 14,479,631 14,917,859 438,228 3%Expenditures (14,816,479) (14,935,692) 119,213 1%
Net (336,848) (17,833)
Total Road & Bridge FundRevenues 9,147,543 9,396,597 249,054 3%Expenditures (10,391,591) (9,844,014) (547,577) -5%
Net (1,244,048) (447,417)
Total Solid Waste FundRevenues 2,679,434 2,801,539 122,105 5%Expenditures (2,599,620) (2,605,151) 5,531 0%
Net 79,814 196,388
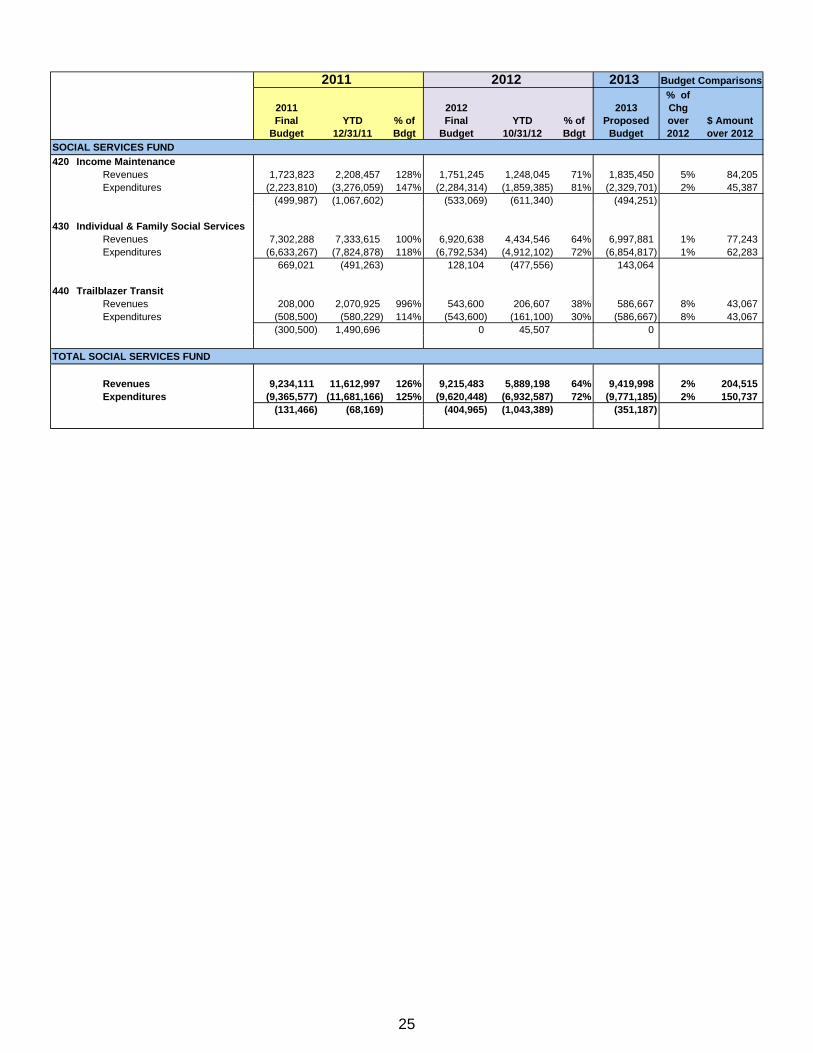
Total Social Services FundRevenues 9,215,483 9,419,998 204,515 2%Expenditures (9,620,448) (9,771,185) 150,737 2%
Net (404,965) (351,187)
Total Special Revenue FundRevenues 1,648,108 1,708,199 60,091 4%Expenditures (2,756,305) (3,235,318) 479,013 17%
Net (1,108,197) (1,527,119)
Total Debt Service FundRevenues 0 0 0 0%Expenditures (1,347,612) 0 (1,347,612) -100%
Net (1,347,612) 0
Grand TotalRevenues 37,170,199 38,244,192 1,073,993 3%Expenditures (41,532,055) (40,391,360) (1,140,695) -3%
Net (4,361,856) (2,147,168) (66,702)
McLeod County Budget Summary Report(Fund Totals Only)
18
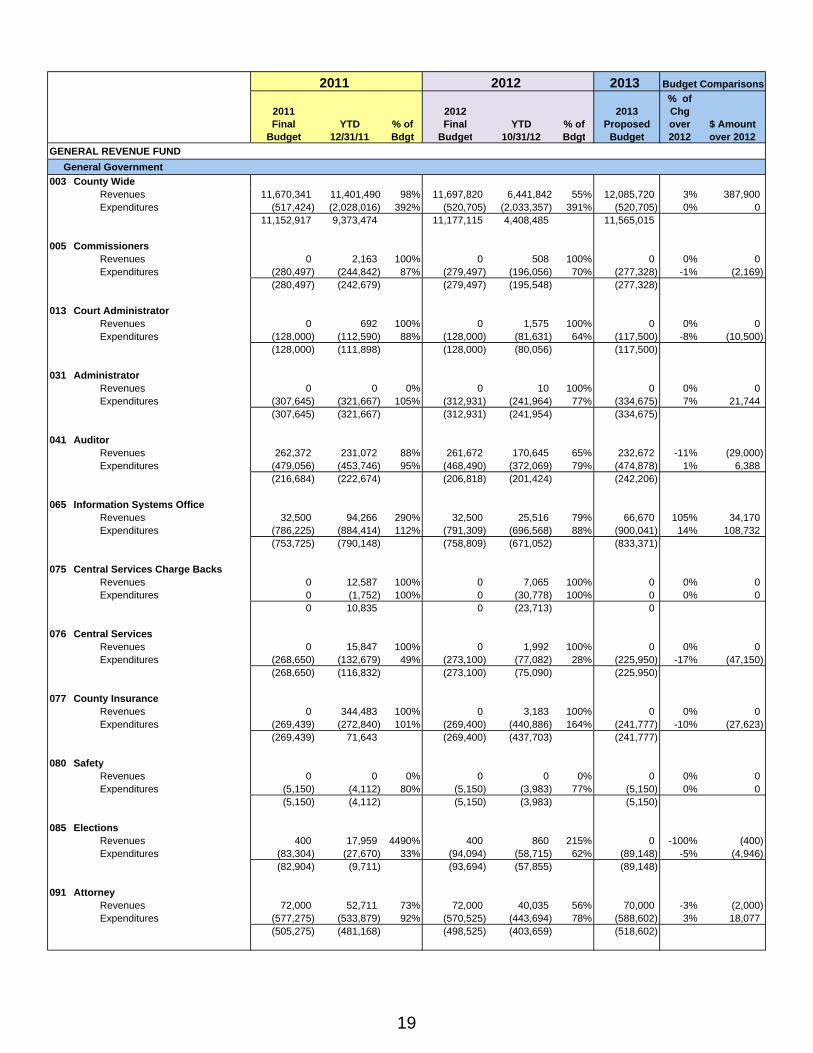
2013
2011 Final
BudgetYTD
12/31/11% of Bdgt
2012 Final
BudgetYTD
10/31/12% of Bdgt
2013 Proposed
Budget
% of Chg over 2012
$ Amount over 2012
GENERAL REVENUE FUND
General Government
003 County WideRevenues 11,670,341 11,401,490 98% 11,697,820 6,441,842 55% 12,085,720 3% 387,900Expenditures (517,424) (2,028,016) 392% (520,705) (2,033,357) 391% (520,705) 0% 0
11,152,917 9,373,474 11,177,115 4,408,485 11,565,015
005 CommissionersRevenues 0 2,163 100% 0 508 100% 0 0% 0Expenditures (280,497) (244,842) 87% (279,497) (196,056) 70% (277,328) -1% (2,169)
(280,497) (242,679) (279,497) (195,548) (277,328)
013 Court AdministratorRevenues 0 692 100% 0 1,575 100% 0 0% 0Expenditures (128,000) (112,590) 88% (128,000) (81,631) 64% (117,500) -8% (10,500)
(128,000) (111,898) (128,000) (80,056) (117,500)
031 AdministratorRevenues 0 0 0% 0 10 100% 0 0% 0Expenditures (307,645) (321,667) 105% (312,931) (241,964) 77% (334,675) 7% 21,744
(307,645) (321,667) (312,931) (241,954) (334,675)
041 AuditorRevenues 262,372 231,072 88% 261,672 170,645 65% 232,672 -11% (29,000)Expenditures (479,056) (453,746) 95% (468,490) (372,069) 79% (474,878) 1% 6,388
(216,684) (222,674) (206,818) (201,424) (242,206)
065 Information Systems OfficeRevenues 32,500 94,266 290% 32,500 25,516 79% 66,670 105% 34,170Expenditures (786,225) (884,414) 112% (791,309) (696,568) 88% (900,041) 14% 108,732
(753,725) (790,148) (758,809) (671,052) (833,371)
075 Central Services Charge BacksRevenues 0 12,587 100% 0 7,065 100% 0 0% 0Expenditures 0 (1,752) 100% 0 (30,778) 100% 0 0% 0
0 10,835 0 (23,713) 0
076 Central ServicesRevenues 0 15,847 100% 0 1,992 100% 0 0% 0Expenditures (268,650) (132,679) 49% (273,100) (77,082) 28% (225,950) -17% (47,150)
(268,650) (116,832) (273,100) (75,090) (225,950)
077 County InsuranceRevenues 0 344,483 100% 0 3,183 100% 0 0% 0Expenditures (269,439) (272,840) 101% (269,400) (440,886) 164% (241,777) -10% (27,623)
(269,439) 71,643 (269,400) (437,703) (241,777)
080 SafetyRevenues 0 0 0% 0 0 0% 0 0% 0Expenditures (5,150) (4,112) 80% (5,150) (3,983) 77% (5,150) 0% 0
(5,150) (4,112) (5,150) (3,983) (5,150)
085 ElectionsRevenues 400 17,959 4490% 400 860 215% 0 -100% (400)Expenditures (83,304) (27,670) 33% (94,094) (58,715) 62% (89,148) -5% (4,946)
(82,904) (9,711) (93,694) (57,855) (89,148)
091 AttorneyRevenues 72,000 52,711 73% 72,000 40,035 56% 70,000 -3% (2,000)Expenditures (577,275) (533,879) 92% (570,525) (443,694) 78% (588,602) 3% 18,077
(505,275) (481,168) (498,525) (403,659) (518,602)
2011 Budget Comparisons2012
19

2013
2011 Final
BudgetYTD
12/31/11% of Bdgt
2012 Final
BudgetYTD
10/31/12% of Bdgt
2013 Proposed
Budget
% of Chg over 2012
$ Amount over 2012
GENERAL REVENUE FUND
General Government (continued)
093 Attorney ContingentRevenues 0 0 0% 0 0 0% 0 0% 0Expenditures (4,000) (3,324) 83% (4,000) (3,215) 80% (4,000) 0% 0
(4,000) (3,324) (4,000) (3,215) (4,000)
101 RecorderRevenues 178,000 190,958 107% 178,000 168,580 95% 185,000 4% 7,000Expenditures (277,647) (285,162) 103% (277,647) (222,137) 80% (281,721) 1% 4,074
(99,647) (94,204) (99,647) (53,557) (96,721)
103 AssessorRevenues 154,402 165,186 107% 154,402 166,170 108% 171,381 11% 16,979Expenditures (418,688) (419,648) 100% (418,388) (296,537) 71% (394,354) -6% (24,034)
(264,286) (254,462) (263,986) (130,367) (222,973)
107 ZoningRevenues 32,745 45,076 138% 32,715 27,347 84% 35,625 9% 2,910Expenditures (211,145) (210,706) 100% (210,625) (179,474) 85% (234,553) 11% 23,928
(178,400) (165,630) (177,910) (152,127) (198,928)
111 CourthouseRevenues 1,000 2,245 225% 1,000 56 6% 0 -100% (1,000)Expenditures (380,759) (440,634) 116% (405,459) (311,676) 77% (387,760) -4% (17,699)
(379,759) (438,389) (404,459) (311,620) (387,760)
112 North ComplexRevenues 0 0 0% 0 780 100% 1,000 100% 1,000Expenditures (43,000) (60,527) 141% (55,000) (44,554) 81% (56,400) 3% 1,400
(43,000) (60,527) (55,000) (43,774) (55,400)
115 County Building Major RepairsRevenues 0 0 0% 0 0 0% 0 0% 0Expenditures (72,360) (108,022) 149% (94,400) (60,206) 64% (94,400) 0% 0
(72,360) (108,022) (94,400) (60,206) (94,400)
116 Health & Human ServicesRevenues 138,000 138,000 100% 138,000 115,000 83% 138,000 0% 0Expenditures (105,646) (109,086) 103% (129,646) (99,947) 77% (138,000) 6% 8,354
32,354 28,914 8,354 15,053 0
117 FairgroundsRevenues 86,000 97,180 113% 86,000 81,306 95% 90,000 5% 4,000Expenditures (256,359) (248,237) 97% (256,578) (174,645) 68% (257,428) 0% 850
(170,359) (151,057) (170,578) (93,339) (167,428)
121 Veterans ServiceRevenues 0 1,783 100% 0 0 0% 0 0% 0Expenditures (154,886) (161,421) 104% (154,286) (118,533) 77% (154,286) 0% 0
(154,886) (159,638) (154,286) (118,533) (154,286)
143 License BureauRevenues 153,100 162,479 106% 153,100 156,125 102% 162,600 6% 9,500Expenditures (162,490) (153,399) 94% (159,818) (126,144) 102% (161,581) 1% 1,763
(9,390) 9,080 (6,718) 29,981 1,019
2011 Budget Comparisons2012
20

2013
2011 Final
BudgetYTD
12/31/11% of Bdgt
2012 Final
BudgetYTD
10/31/12% of Bdgt
2013 Proposed
Budget
% of Chg over 2012
$ Amount over 2012
GENERAL REVENUE FUND
Public Safety
201 SheriffRevenues 283,200 467,951 165% 310,441 336,882 109% 300,700 -3% (9,741)Expenditures (3,566,474) (3,515,597) 99% (3,576,296) (2,730,774) 76% (3,601,136) 1% 24,840
(3,283,274) (3,047,646) (3,265,855) (2,393,892) (3,300,436)
251 JailRevenues 55,500 65,579 118% 54,750 46,323 85% 54,750 0% 0Expenditures (1,908,265) (1,731,594) 91% (1,848,371) (1,285,252) 70% (1,829,728) -1% (18,643)
(1,852,765) (1,666,015) (1,793,621) (1,238,929) (1,774,978)
255 County Court ServicesRevenues 85,000 88,557 104% 85,000 0 0% 85,000 0% 0Expenditures (323,389) (349,030) 108% (338,490) (189,895) 56% (353,363) 4% 14,873
(238,389) (260,473) (253,490) (189,895) (268,363)
281 Emergency ServicesRevenues 4,000 30,120 753% 4,000 323 8% 4,000 0% 0Expenditures (106,986) (108,172) 101% (112,011) (74,111) 66% (139,505) 25% 27,494
(102,986) (78,052) (108,011) (73,788) (135,505)
Public Health
485 Public Health ServicesRevenues 1,126,964 1,414,747 126% 1,084,000 1,150,815 106% 1,086,950 0% 2,950Expenditures (2,051,283) (2,461,750) 120% (2,024,309) (1,842,923) 91% (2,031,408) 0% 7,099
(924,319) (1,047,003) (940,309) (692,108) (944,458)
Culture, Parks and Recreation
501 Culture & RecreationRevenues 0 0 0% 0 0 0% 0 0% 0Expenditures (257,449) (256,743) 100% (257,449) (209,133) 81% (257,449) 0% 0
(257,449) (256,743) (257,449) (209,133) (257,449)
520 ParksRevenues 86,950 88,934 102% 86,950 101,158 116% 90,800 4% 3,850Expenditures (321,093) (339,741) 106% (319,318) (260,672) 82% (320,793) 0% 1,475
(234,143) (250,807) (232,368) (159,514) (229,993)
Conservation & Natural Resources
601 Conserv. of Nat. ResourcesRevenues 0 0 0% 0 0 0% 0 0% 0Expenditures (61,000) (61,000) 100% (61,000) (60,000) 98% (61,000) 0% 0
(61,000) (61,000) (61,000) (60,000) (61,000)
603 ExtensionRevenues 1,250 573 46% 800 1,247 156% 800 0% 0Expenditures (224,249) (218,303) 97% (222,779) (157,167) 71% (224,404) 1% 1,625
(222,999) (217,730) (221,979) (155,920) (223,604)
604 Agricultural InspectorRevenues 0 0 0% 0 0 0% 0 0% 0Expenditures (19,700) (14,440) 73% (19,700) (10,689) 54% (19,820) 1% 120
(19,700) (14,440) (19,700) (10,689) (19,820)
609 County Environmental ServicesRevenues 33,500 39,278 117% 36,150 36,315 100% 37,250 3% 1,100Expenditures (141,324) (96,194) 68% (145,301) (127,846) 88% (135,432) -7% (9,869)
(107,824) (56,916) (109,151) (91,531) (98,182)
2011 Budget Comparisons2012
21
2013
2011 Final
BudgetYTD
12/31/11% of Bdgt
2012 Final
BudgetYTD
10/31/12% of Bdgt
2013 Proposed
Budget
% of Chg over 2012
$ Amount over 2012
GENERAL REVENUE FUND
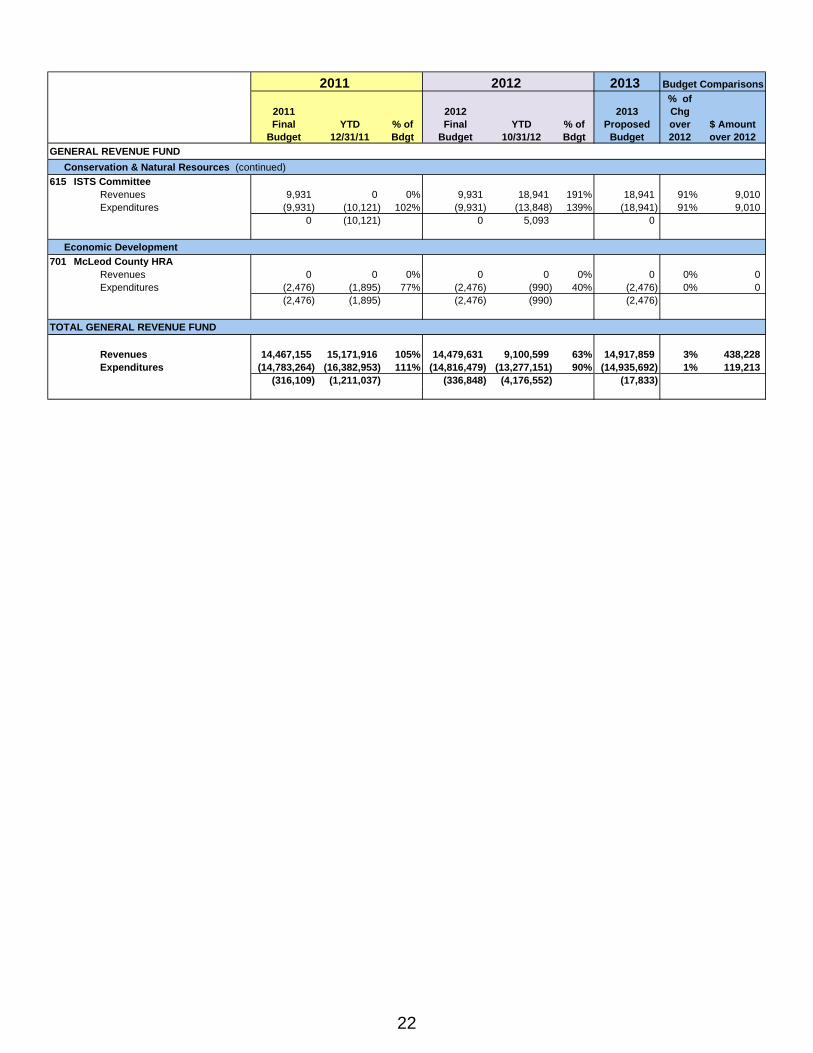
Conservation & Natural Resources (continued)
615 ISTS CommitteeRevenues 9,931 0 0% 9,931 18,941 191% 18,941 91% 9,010Expenditures (9,931) (10,121) 102% (9,931) (13,848) 139% (18,941) 91% 9,010
0 (10,121) 0 5,093 0
Economic Development
701 McLeod County HRARevenues 0 0 0% 0 0 0% 0 0% 0Expenditures (2,476) (1,895) 77% (2,476) (990) 40% (2,476) 0% 0
(2,476) (1,895) (2,476) (990) (2,476)
TOTAL GENERAL REVENUE FUND
Revenues 14,467,155 15,171,916 105% 14,479,631 9,100,599 63% 14,917,859 3% 438,228Expenditures (14,783,264) (16,382,953) 111% (14,816,479) (13,277,151) 90% (14,935,692) 1% 119,213
(316,109) (1,211,037) (336,848) (4,176,552) (17,833)
2011 2012 Budget Comparisons
22

2013
2011 Final
BudgetYTD
12/31/11% of Bdgt
2012 Final
BudgetYTD
10/31/12% of Bdgt
2013 Proposed
Budget
% of Chg over 2012
$ Amount over 2012
ROAD & BRIDGE FUND
105 SurveyorRevenues 0 0 0% 0 0 0% 0 0% 0Expenditures (140,863) (127,172) 90% (133,403) (87,664) 66% (128,906) -3% (4,497)
(140,863) (127,172) (133,403) (87,664) (128,906)
300 Road & BridgeRevenues 7,527,544 9,705,014 129% 9,147,543 7,505,462 82% 9,396,597 3% 249,054Expenditures 0 0 0% 0 0 0% 0 0% 0
7,527,544 9,705,014 9,147,543 7,505,462 9,396,597
310 MaintenanceRevenues 0 0 0% 0 0 0% 0 0% 0Expenditures (2,097,723) (2,612,036) 125% (2,143,753) (1,837,312) 86% (2,223,703) 4% 79,950
(2,097,723) (2,612,036) (2,143,753) (1,837,312) (2,223,703)
320 ConstructionRevenues 0 0 0% 0 0 0% 0 0% 0Expenditures (2,939,447) (5,339,835) 182% (6,365,146) (3,167,423) 50% (5,748,000) -10% (617,146)
(2,939,447) (5,339,835) (6,365,146) (3,167,423) (5,748,000)
330 AdministrationRevenues 0 0 0% 0 0 0% 0 0% 0Expenditures (873,421) (802,613) 92% (747,635) (481,047) 64% (737,544) -1% (10,091)
(873,421) (802,613) (747,635) (481,047) (737,544)
340 Equipment MaintenanceRevenues 0 0 0% 0 0 0% 0 0% 0Expenditures (718,199) (1,127,231) 157% (1,001,654) (540,027) 54% (1,005,861) 0% 4,207
(718,199) (1,127,231) (1,001,654) (540,027) (1,005,861)
TOTAL ROAD & BRIDGE FUND
Revenues 7,527,544 9,705,014 129% 9,147,543 7,505,462 82% 9,396,597 3% 249,054Expenditures (6,769,653) (10,008,887) 148% (10,391,591) (6,113,473) 59% (9,844,014) -5% (547,577)
757,891 (303,873) (1,244,048) 1,391,989 (447,417)
2011 Budget Comparisons2012
23
2013
2011 Final
BudgetYTD
12/31/11% of Bdgt
2012 Final
BudgetYTD
10/31/12% of Bdgt
2013 Proposed
Budget
% of Chg over 2012
$ Amount over 2012
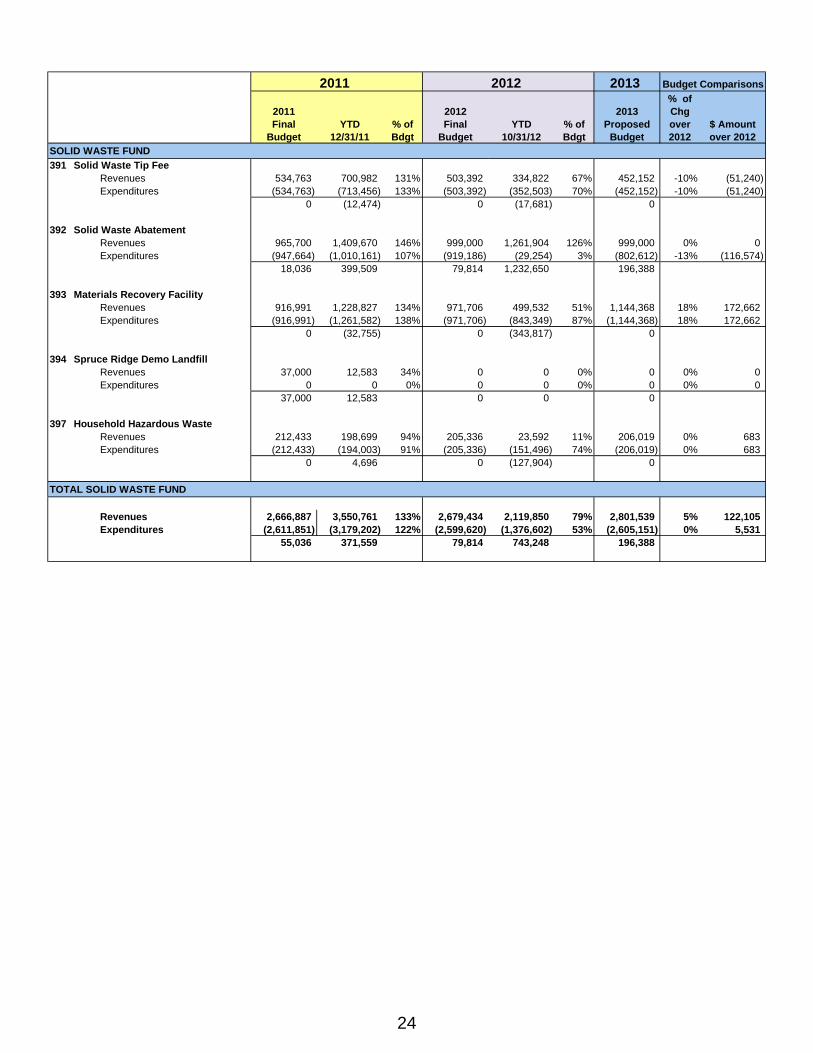
SOLID WASTE FUND
391 Solid Waste Tip FeeRevenues 534,763 700,982 131% 503,392 334,822 67% 452,152 -10% (51,240)Expenditures (534,763) (713,456) 133% (503,392) (352,503) 70% (452,152) -10% (51,240)
0 (12,474) 0 (17,681) 0
392 Solid Waste AbatementRevenues 965,700 1,409,670 146% 999,000 1,261,904 126% 999,000 0% 0Expenditures (947,664) (1,010,161) 107% (919,186) (29,254) 3% (802,612) -13% (116,574)
18,036 399,509 79,814 1,232,650 196,388
393 Materials Recovery FacilityRevenues 916,991 1,228,827 134% 971,706 499,532 51% 1,144,368 18% 172,662Expenditures (916,991) (1,261,582) 138% (971,706) (843,349) 87% (1,144,368) 18% 172,662
0 (32,755) 0 (343,817) 0
394 Spruce Ridge Demo LandfillRevenues 37,000 12,583 34% 0 0 0% 0 0% 0Expenditures 0 0 0% 0 0 0% 0 0% 0
37,000 12,583 0 0 0
397 Household Hazardous WasteRevenues 212,433 198,699 94% 205,336 23,592 11% 206,019 0% 683Expenditures (212,433) (194,003) 91% (205,336) (151,496) 74% (206,019) 0% 683
0 4,696 0 (127,904) 0
TOTAL SOLID WASTE FUND
Revenues 2,666,887 3,550,761 133% 2,679,434 2,119,850 79% 2,801,539 5% 122,105Expenditures (2,611,851) (3,179,202) 122% (2,599,620) (1,376,602) 53% (2,605,151) 0% 5,531
55,036 371,559 79,814 743,248 196,388
2011 2012 Budget Comparisons
24
2013
2011 Final
BudgetYTD
12/31/11% of Bdgt
2012 Final
BudgetYTD
10/31/12% of Bdgt
2013 Proposed
Budget
% of Chg over 2012
$ Amount over 2012
SOCIAL SERVICES FUND
420 Income MaintenanceRevenues 1,723,823 2,208,457 128% 1,751,245 1,248,045 71% 1,835,450 5% 84,205Expenditures (2,223,810) (3,276,059) 147% (2,284,314) (1,859,385) 81% (2,329,701) 2% 45,387
(499,987) (1,067,602) (533,069) (611,340) (494,251)
430 Individual & Family Social ServicesRevenues 7,302,288 7,333,615 100% 6,920,638 4,434,546 64% 6,997,881 1% 77,243Expenditures (6,633,267) (7,824,878) 118% (6,792,534) (4,912,102) 72% (6,854,817) 1% 62,283
669,021 (491,263) 128,104 (477,556) 143,064
440 Trailblazer TransitRevenues 208,000 2,070,925 996% 543,600 206,607 38% 586,667 8% 43,067Expenditures (508,500) (580,229) 114% (543,600) (161,100) 30% (586,667) 8% 43,067
(300,500) 1,490,696 0 45,507 0
TOTAL SOCIAL SERVICES FUND
Revenues 9,234,111 11,612,997 126% 9,215,483 5,889,198 64% 9,419,998 2% 204,515Expenditures (9,365,577) (11,681,166) 125% (9,620,448) (6,932,587) 72% (9,771,185) 2% 150,737
(131,466) (68,169) (404,965) (1,043,389) (351,187)
2011 2012 Budget Comparisons
25

2013
2011 Final
BudgetYTD
12/31/11% of Bdgt
2012 Final
BudgetYTD
10/31/12% of Bdgt
2013 Proposed
Budget
% of Chg over 2012
$ Amount over 2012
SPECIAL REVENUE FUND
015 Law LibraryRevenues 60,000 35,869 60% 50,000 39,173 78% 45,000 -10% (5,000)Expenditures (45,000) (103,608) 230% (45,000) (35,628) 79% (42,000) -7% (3,000)
15,000 (67,739) 5,000 3,545 3,000
032 McLeod For TomorrowRevenues 12,475 15,650 125% 12,100 14,300 118% 15,000 24% 2,900Expenditures (12,100) (14,431) 119% (12,100) (8,999) 74% (15,000) 24% 2,900
375 1,219 0 5,301 0
041 County Auditor's OfficeRevenues 100 10 10% 100 20 20% 100 0% 0Expenditures (100) 0 0% (100) (1,439) 1439% (100) 0% 0
0 10 0 (1,419) 0
085 ElectionsRevenues 100 44 44% 100 14 14% 0 -100% (100)Expenditures (11,000) (5,405) 49% (11,000) (6,817) 62% (11,000) 0% 0
(10,900) (5,361) (10,900) (6,803) (11,000)
101 County Recorder's OfficeRevenues 75,000 72,569 97% 75,000 67,640 90% 75,000 0% 0Expenditures (75,000) (82,753) 110% (105,000) (87,603) 83% (105,000) 0% 0
0 (10,184) (30,000) (19,963) (30,000)
102 County Recorder's Compliance FundRevenues 80,000 80,399 100% 80,700 74,588 92% 80,200 -1% (500)Expenditures (136,000) (11) 0% 0 0 0% 0 0% 0
(56,000) 80,388 80,700 74,588 80,200
104 County Recorder's Modernization Revenues 0 384 100% 1,000 160 16% 150 -85% (850)
Expenditures 0 (12,947) 100% (10,000) 0 0% (10,000) 0% 00 (12,563) (9,000) 160 (9,850)
105 County Surveying & GIS Revenues 0 100 100% 0 100 100% 0 0% 0
Expenditures 0 0 0% 0 0 0% 0 0% 00 100 0 100 0
106 County Recorder's Escrow Deposits Revenues 0 (12) 100% 0 9,099 100% 0 0% 0
Expenditures 0 (25) 100% 0 (46) 100% 0 0% 00 (37) 0 9,053 0
109 GIS Aerial PhotosRevenues 0 0 0% 0 10,000 100% 10,000 100% 10,000Expenditures 0 0 0% 0 0 0% 0 0% 0
0 0 0 10,000 10,000
121 Veterans Service Office Revenues 17,950 11,496 64% 12,800 7,249 57% 8,500 -34% (4,300)
Expenditures (65,000) (39,498) 61% 0 0 0% 0 0% 0(47,050) (28,002) 12,800 7,249 8,500
122 Veterans Service Grants Revenues 0 0 0% 0 0 0% 4,200 100% 4,200
Expenditures 0 (212) 100% 0 0 0% (4,200) 100% 4,2000 (212) 0 0 0
205 Carry Conceal Permit Revenues 3,000 10,970 366% 7,000 14,580 208% 7,000 0% 0
Expenditures (24,500) (18,405) 75% (500) (625) 125% (2,500) 400% 2,000(21,500) (7,435) 6,500 13,955 4,500
2011 2012 Budget Comparisons
26
2013
2011 Final
BudgetYTD
12/31/11% of Bdgt
2012 Final
BudgetYTD
10/31/12% of Bdgt
2013 Proposed
Budget
% of Chg over 2012
$ Amount over 2012
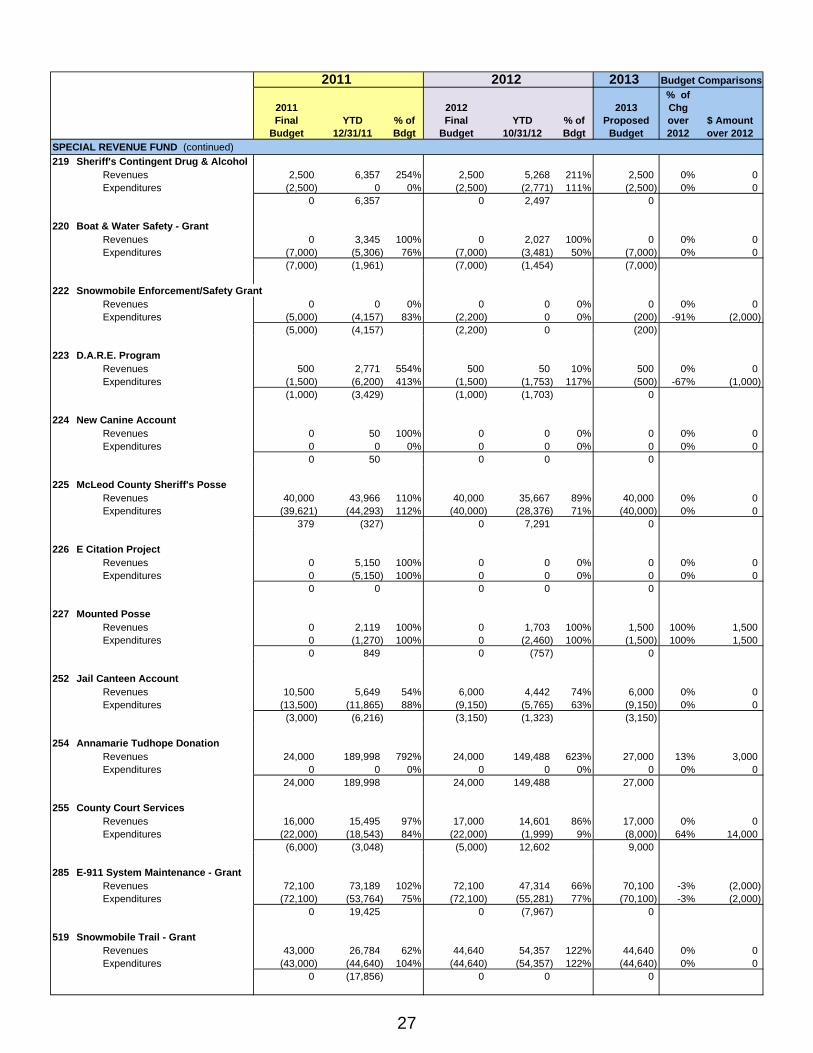
SPECIAL REVENUE FUND (continued)
219 Sheriff's Contingent Drug & Alcohol Revenues 2,500 6,357 254% 2,500 5,268 211% 2,500 0% 0
Expenditures (2,500) 0 0% (2,500) (2,771) 111% (2,500) 0% 00 6,357 0 2,497 0
220 Boat & Water Safety - Grant Revenues 0 3,345 100% 0 2,027 100% 0 0% 0
Expenditures (7,000) (5,306) 76% (7,000) (3,481) 50% (7,000) 0% 0(7,000) (1,961) (7,000) (1,454) (7,000)
222 Snowmobile Enforcement/Safety Grant Revenues 0 0 0% 0 0 0% 0 0% 0
Expenditures (5,000) (4,157) 83% (2,200) 0 0% (200) -91% (2,000)(5,000) (4,157) (2,200) 0 (200)
223 D.A.R.E. Program Revenues 500 2,771 554% 500 50 10% 500 0% 0
Expenditures (1,500) (6,200) 413% (1,500) (1,753) 117% (500) -67% (1,000)(1,000) (3,429) (1,000) (1,703) 0
224 New Canine Account Revenues 0 50 100% 0 0 0% 0 0% 0
Expenditures 0 0 0% 0 0 0% 0 0% 00 50 0 0 0
225 McLeod County Sheriff's Posse Revenues 40,000 43,966 110% 40,000 35,667 89% 40,000 0% 0
Expenditures (39,621) (44,293) 112% (40,000) (28,376) 71% (40,000) 0% 0379 (327) 0 7,291 0
226 E Citation Project Revenues 0 5,150 100% 0 0 0% 0 0% 0
Expenditures 0 (5,150) 100% 0 0 0% 0 0% 00 0 0 0 0
227 Mounted Posse Revenues 0 2,119 100% 0 1,703 100% 1,500 100% 1,500
Expenditures 0 (1,270) 100% 0 (2,460) 100% (1,500) 100% 1,5000 849 0 (757) 0
252 Jail Canteen Account Revenues 10,500 5,649 54% 6,000 4,442 74% 6,000 0% 0
Expenditures (13,500) (11,865) 88% (9,150) (5,765) 63% (9,150) 0% 0(3,000) (6,216) (3,150) (1,323) (3,150)
254 Annamarie Tudhope Donation Revenues 24,000 189,998 792% 24,000 149,488 623% 27,000 13% 3,000
Expenditures 0 0 0% 0 0 0% 0 0% 024,000 189,998 24,000 149,488 27,000
255 County Court Services Revenues 16,000 15,495 97% 17,000 14,601 86% 17,000 0% 0
Expenditures (22,000) (18,543) 84% (22,000) (1,999) 9% (8,000) 64% 14,000(6,000) (3,048) (5,000) 12,602 9,000
285 E-911 System Maintenance - Grant Revenues 72,100 73,189 102% 72,100 47,314 66% 70,100 -3% (2,000)
Expenditures (72,100) (53,764) 75% (72,100) (55,281) 77% (70,100) -3% (2,000)0 19,425 0 (7,967) 0
519 Snowmobile Trail - Grant Revenues 43,000 26,784 62% 44,640 54,357 122% 44,640 0% 0
Expenditures (43,000) (44,640) 104% (44,640) (54,357) 122% (44,640) 0% 00 (17,856) 0 0 0
2011 2012 Budget Comparisons
27

2013
2011 Final
BudgetYTD
12/31/11% of Bdgt
2012 Final
BudgetYTD
10/31/12% of Bdgt
2013 Proposed
Budget
% of Chg over 2012
$ Amount over 2012
SPECIAL REVENUE FUND (continued)
602 SSTS BiscayRevenues 0 0 0% 0 178,950 100% 0 0% 0Expenditures 0 0 0% 0 0 0% 0 0% 0
0 0 0 178,950 0
603 County Extension Revenues 1,000 2,405 241% 1,000 3,162 316% 1,000 0% 0
Expenditures (1,000) (2,860) 286% (1,000) (4,127) 413% (1,000) 0% 00 (455) 0 (965) 0
611 HI Creek Watershed Septic System Loan Revenues 50,205 36,068 72% 25,308 13,761 54% 19,025 -25% (6,283)
Expenditures (44,071) (24,681) 56% (24,682) (12,341) 50% (24,682) 0% 06,134 11,387 626 1,420 (5,657)
612 Shoreland - Grant Revenues 5,876 2,938 50% 5,876 5,976 102% 5,976 2% 100
Expenditures (5,876) (5,899) 100% (5,876) (4,406) 75% (5,976) 2% 1000 (2,961) 0 1,570 0
613 Water Resource Management - Grant Revenues 20,886 8,456 40% 20,886 20,746 99% 20,746 -1% (140)
Expenditures (20,886) (31,428) 150% (20,886) (24,941) 119% (20,746) -1% (140)0 (22,972) 0 (4,195) 0
614 Wetlands Administration - Grant Revenues 27,340 11,170 41% 27,340 32,894 120% 27,892 2% 552
Expenditures (27,340) (27,898) 102% (27,340) (27,021) 99% (27,892) 2% 5520 (16,728) 0 5,873 0
616 BC Watershed Septic System Loan Revenues 23,662 196,310 830% 23,075 24,295 105% 55,636 141% 32,561
Expenditures (25,483) (207,671) 815% (25,484) (30,048) 118% (25,483) 0% (1)(1,821) (11,361) (2,409) (5,753) 30,153
617 Ag Programming Revenues 3,000 3,270 109% 3,000 403 13% 3,000 0% 0
Expenditures (3,000) (3,510) 117% (3,000) (602) 20% (3,000) 0% 00 (240) 0 (199) 0
618 SSTS Grant Revenues 0 43,800 100% 0 0 0% 0 0% 0
Expenditures 0 (28,697) 100% 0 (2,400) 100% 0 0% 00 15,103 0 (2,400) 0
619 Crow River Septic System Loans Revenues 30,883 156,252 506% 30,139 33,113 110% 56,090 86% 25,951
Expenditures (14,293) (114,377) 800% (33,553) (28,235) 84% (34,580) 3% 1,02716,590 41,875 (3,414) 4,878 21,510
807 Designated for Capital Assets Revenues 0 2,001,042 100% 1,000,000 2,520,037 100% 1,000,000 0% 0
Expenditures (1,068,750) (4,381) 0% (2,168,750) (2,346,039) 108% (2,657,625) 23% 488,875(1,068,750) 1,996,661 (1,168,750) 173,998 (1,657,625)
840 Juvenile Restitution Fund Revenues 6,000 3,570 60% 6,000 1,630 27% 6,000 0% 0
Expenditures (6,000) (1,764) 29% (6,000) (4,273) 71% (6,000) 0% 00 1,806 0 (2,643) 0
864 Tobacco License Revenues 900 1,125 125% 900 700 78% 900 0% 0
Expenditures (900) (1,275) 142% (900) 0 0% (900) 0% 00 (150) 0 700 0
2011 2012 Budget Comparisons
28
2013
2011 Final
BudgetYTD
12/31/11% of Bdgt
2012 Final
BudgetYTD
10/31/12% of Bdgt
2013 Proposed
Budget
% of Chg over 2012
$ Amount over 2012
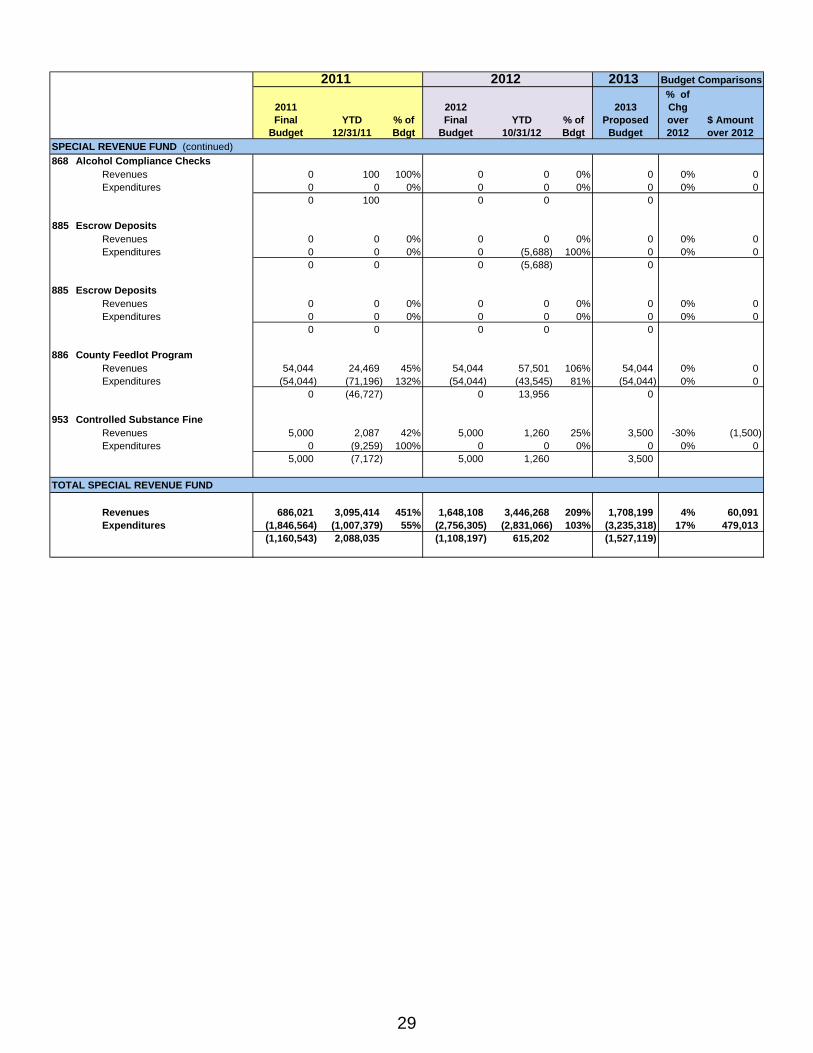
SPECIAL REVENUE FUND (continued)
868 Alcohol Compliance Checks Revenues 0 100 100% 0 0 0% 0 0% 0
Expenditures 0 0 0% 0 0 0% 0 0% 00 100 0 0 0
885 Escrow DepositsRevenues 0 0 0% 0 0 0% 0 0% 0Expenditures 0 0 0% 0 (5,688) 100% 0 0% 0
0 0 0 (5,688) 0
885 Escrow Deposits Revenues 0 0 0% 0 0 0% 0 0% 0
Expenditures 0 0 0% 0 0 0% 0 0% 00 0 0 0 0
886 County Feedlot Program Revenues 54,044 24,469 45% 54,044 57,501 106% 54,044 0% 0
Expenditures (54,044) (71,196) 132% (54,044) (43,545) 81% (54,044) 0% 00 (46,727) 0 13,956 0
953 Controlled Substance Fine Revenues 5,000 2,087 42% 5,000 1,260 25% 3,500 -30% (1,500)
Expenditures 0 (9,259) 100% 0 0 0% 0 0% 05,000 (7,172) 5,000 1,260 3,500
TOTAL SPECIAL REVENUE FUND
Revenues 686,021 3,095,414 451% 1,648,108 3,446,268 209% 1,708,199 4% 60,091Expenditures (1,846,564) (1,007,379) 55% (2,756,305) (2,831,066) 103% (3,235,318) 17% 479,013
(1,160,543) 2,088,035 (1,108,197) 615,202 (1,527,119)
2011 2012 Budget Comparisons
29
2013
2011 Final
BudgetYTD
12/31/11% of Bdgt
2012 Final
BudgetYTD
10/31/12% of Bdgt
2013 Proposed
Budget
% of Chg over 2012
$ Amount over 2012
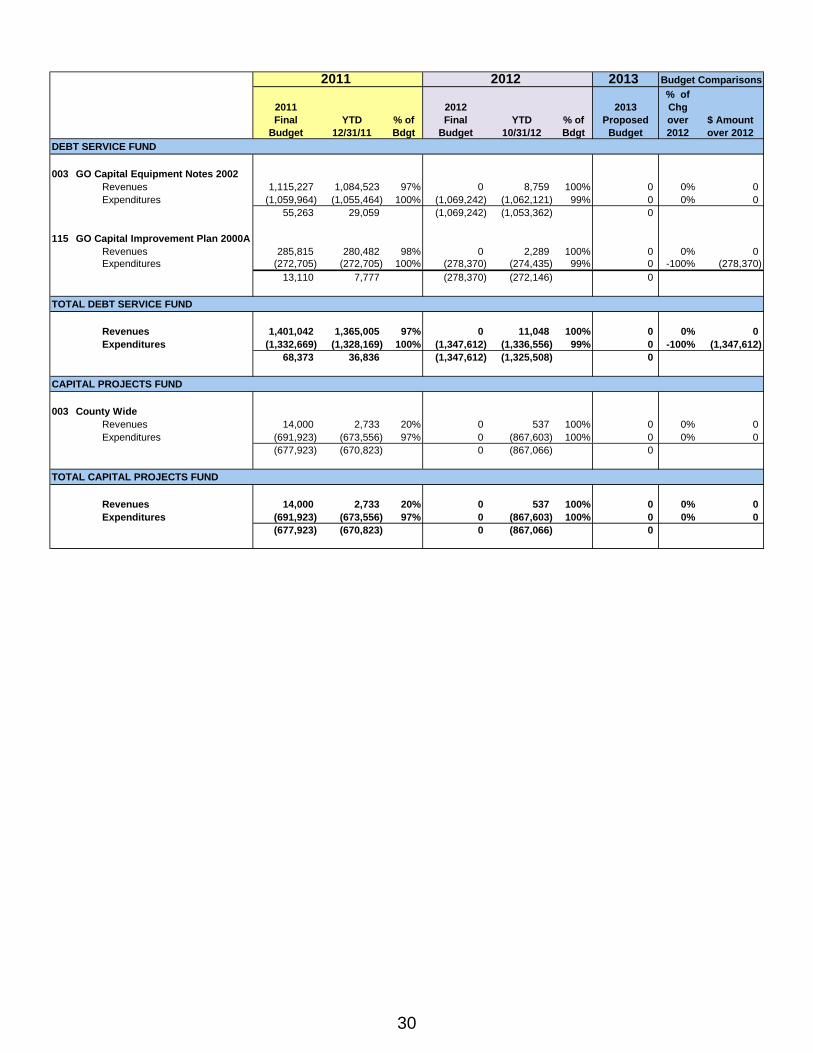
DEBT SERVICE FUND
003 GO Capital Equipment Notes 2002Revenues 1,115,227 1,084,523 97% 0 8,759 100% 0 0% 0Expenditures (1,059,964) (1,055,464) 100% (1,069,242) (1,062,121) 99% 0 0% 0
55,263 29,059 (1,069,242) (1,053,362) 0
115 GO Capital Improvement Plan 2000ARevenues 285,815 280,482 98% 0 2,289 100% 0 0% 0Expenditures (272,705) (272,705) 100% (278,370) (274,435) 99% 0 -100% (278,370)
13,110 7,777 (278,370) (272,146) 0
TOTAL DEBT SERVICE FUND
Revenues 1,401,042 1,365,005 97% 0 11,048 100% 0 0% 0Expenditures (1,332,669) (1,328,169) 100% (1,347,612) (1,336,556) 99% 0 -100% (1,347,612)
68,373 36,836 (1,347,612) (1,325,508) 0
CAPITAL PROJECTS FUND
003 County WideRevenues 14,000 2,733 20% 0 537 100% 0 0% 0Expenditures (691,923) (673,556) 97% 0 (867,603) 100% 0 0% 0
(677,923) (670,823) 0 (867,066) 0
TOTAL CAPITAL PROJECTS FUND
Revenues 14,000 2,733 20% 0 537 100% 0 0% 0Expenditures (691,923) (673,556) 97% 0 (867,603) 100% 0 0% 0
(677,923) (670,823) 0 (867,066) 0
2011 2012 Budget Comparisons
30

Revenue 14,917,859$ Road & Bridge 9,396,597Solid Waste 2,801,539Special Revenue 1,708,199Human Services 9,419,998
38,244,192$
Proposed 2013 - Revenues
McLeod County Proposed 2013 - Revenue(Income Generated By Fund)
Revenue39.1%
Road & Bridge24.5%
Solid Waste7.3%
Special Revenue4.5%
Human Services24.6%
31
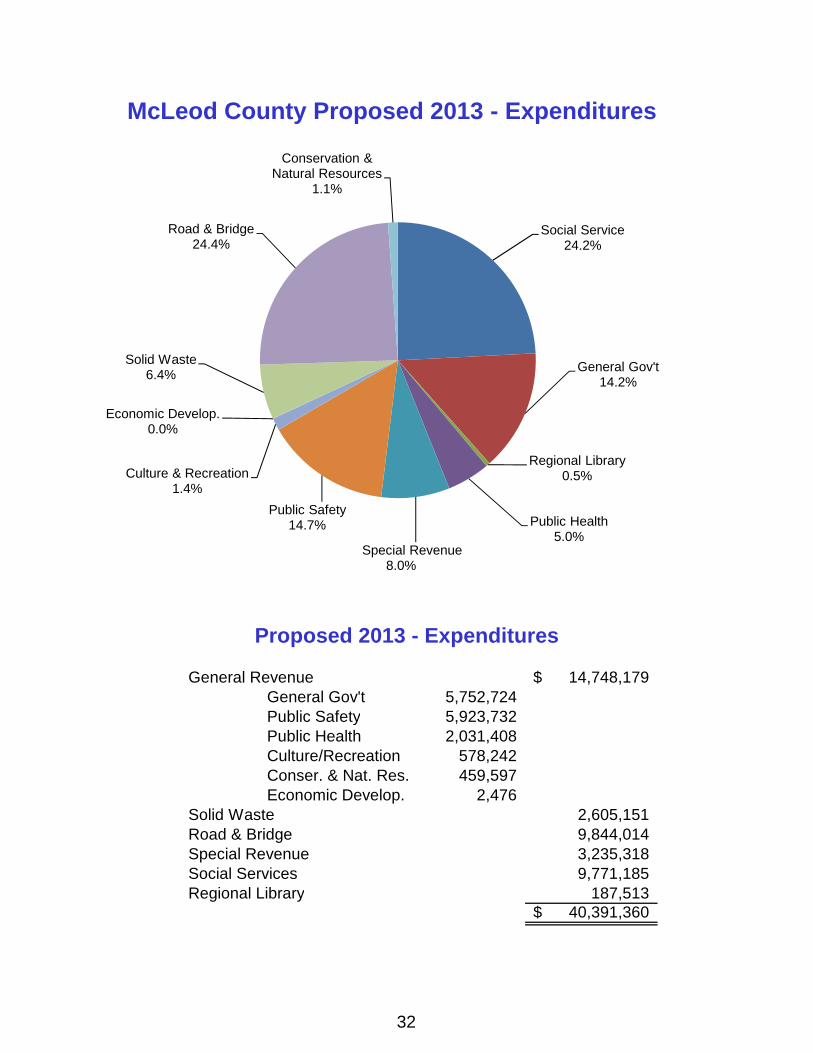
General Revenue 14,748,179$ General Gov't 5,752,724Public Safety 5,923,732Public Health 2,031,408Culture/Recreation 578,242Conser. & Nat. Res. 459,597Economic Develop. 2,476
Solid Waste 2,605,151Road & Bridge 9,844,014Special Revenue 3,235,318Social Services 9,771,185Regional Library 187,513
40,391,360$
Proposed 2013 - Expenditures
Social Service24.2%
General Gov't14.2%
Regional Library0.5%
Public Health5.0%
Special Revenue8.0%
Public Safety14.7%
Culture & Recreation1.4%
Economic Develop.0.0%
Solid Waste6.4%
Road & Bridge24.4%
Conservation & Natural Resources
1.1%
McLeod County Proposed 2013 - Expenditures
32
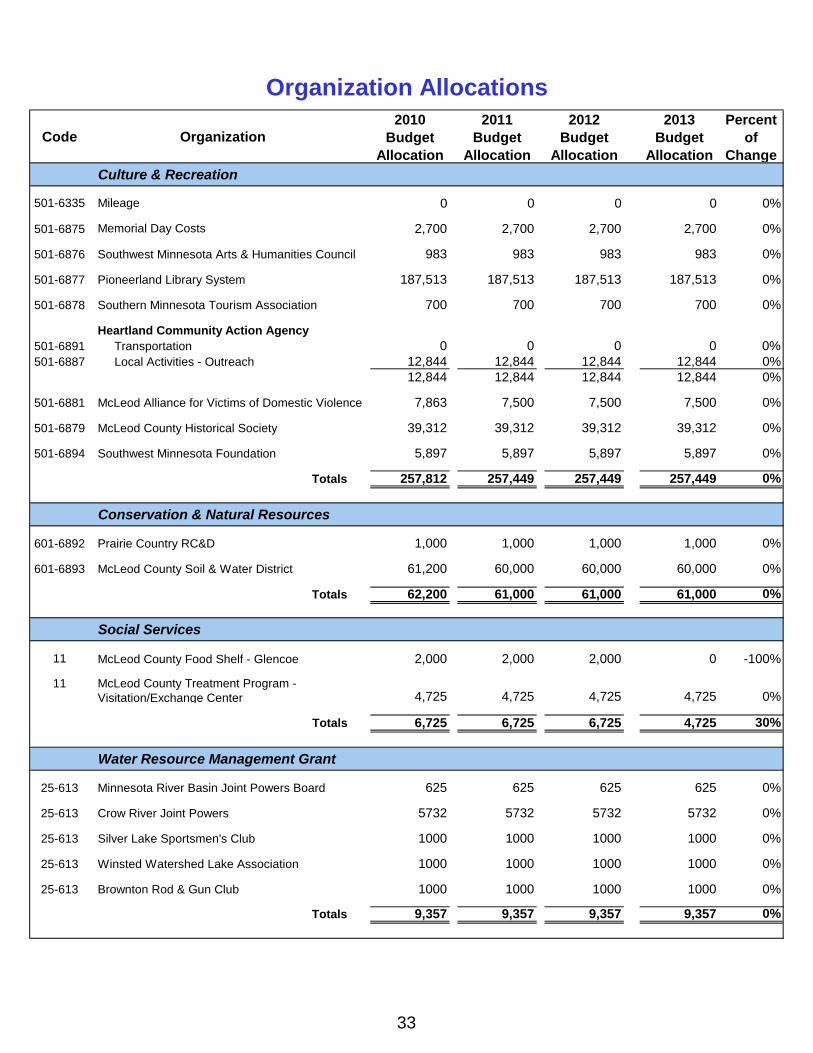
Code Organization2010
Budget Allocation
2011 Budget
Allocation
2012 Budget
Allocation
2013 Budget
Allocation
Percent of
ChangeCulture & Recreation
501-6335 Mileage 0 0 0 0 0%
501-6875 Memorial Day Costs 2,700 2,700 2,700 2,700 0%
501-6876 Southwest Minnesota Arts & Humanities Council 983 983 983 983 0%
501-6877 Pioneerland Library System 187,513 187,513 187,513 187,513 0%
501-6878 Southern Minnesota Tourism Association 700 700 700 700 0%
Heartland Community Action Agency501-6891 Transportation 0 0 0 0 0%501-6887 Local Activities - Outreach 12,844 12,844 12,844 12,844 0%
12,844 12,844 12,844 12,844 0%
501-6881 McLeod Alliance for Victims of Domestic Violence 7,863 7,500 7,500 7,500 0%
501-6879 McLeod County Historical Society 39,312 39,312 39,312 39,312 0%
501-6894 Southwest Minnesota Foundation 5,897 5,897 5,897 5,897 0%
Totals 257,812 257,449 257,449 257,449 0%
Conservation & Natural Resources
601-6892 Prairie Country RC&D 1,000 1,000 1,000 1,000 0%
601-6893 McLeod County Soil & Water District 61,200 60,000 60,000 60,000 0%
Totals 62,200 61,000 61,000 61,000 0%
Social Services
11 McLeod County Food Shelf - Glencoe 2,000 2,000 2,000 0 -100%
11 McLeod County Treatment Program - Visitation/Exchange Center 4,725 4,725 4,725 4,725 0%
Totals 6,725 6,725 6,725 4,725 30%
Water Resource Management Grant
25-613 Minnesota River Basin Joint Powers Board 625 625 625 625 0%
25-613 Crow River Joint Powers 5732 5732 5732 5732 0%
25-613 Silver Lake Sportsmen's Club 1000 1000 1000 1000 0%
25-613 Winsted Watershed Lake Association 1000 1000 1000 1000 0%
25-613 Brownton Rod & Gun Club 1000 1000 1000 1000 0%
Totals 9,357 9,357 9,357 9,357 0%
Organization Allocations
33
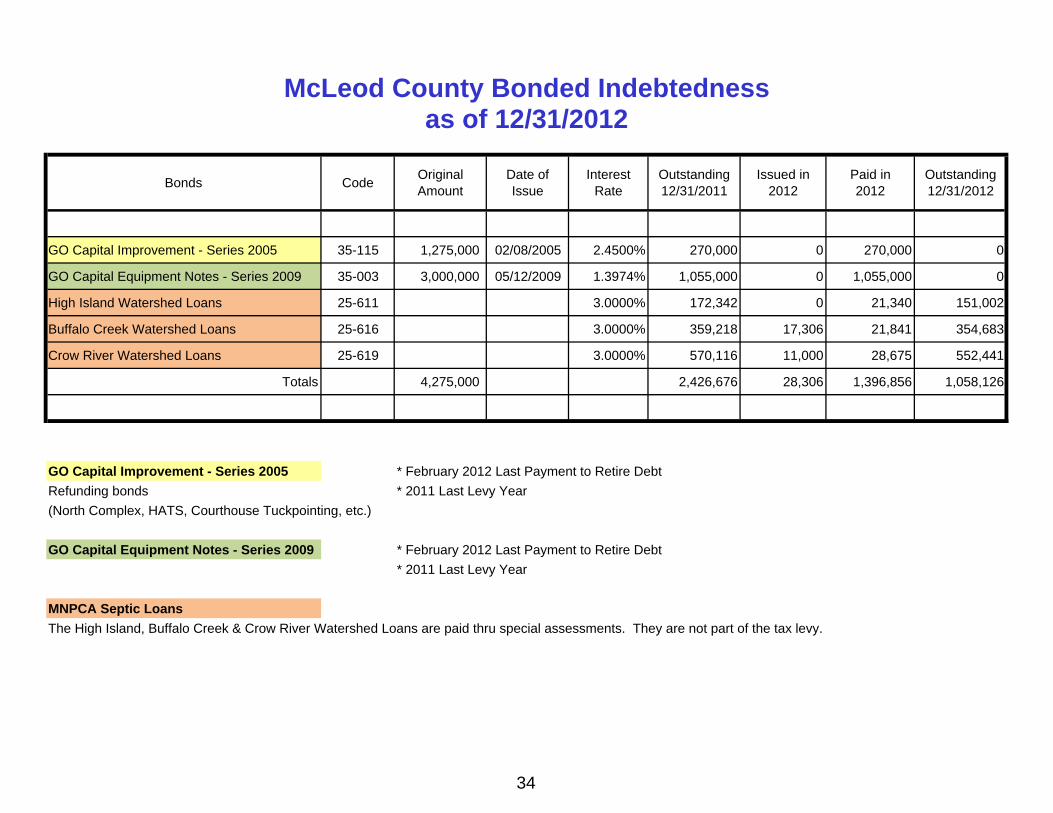
Bonds CodeOriginal Amount
Date of Issue
Interest Rate
Outstanding 12/31/2011
Issued in 2012
Paid in 2012
Outstanding 12/31/2012
GO Capital Improvement - Series 2005 35-115 1,275,000 02/08/2005 2.4500% 270,000 0 270,000 0
GO Capital Equipment Notes - Series 2009 35-003 3,000,000 05/12/2009 1.3974% 1,055,000 0 1,055,000 0
High Island Watershed Loans 25-611 3.0000% 172,342 0 21,340 151,002
Buffalo Creek Watershed Loans 25-616 3.0000% 359,218 17,306 21,841 354,683
Crow River Watershed Loans 25-619 3.0000% 570,116 11,000 28,675 552,441
Totals 4,275,000 2,426,676 28,306 1,396,856 1,058,126
GO Capital Improvement - Series 2005 * February 2012 Last Payment to Retire Debt
Refunding bonds * 2011 Last Levy Year
(North Complex, HATS, Courthouse Tuckpointing, etc.)
GO Capital Equipment Notes - Series 2009 * February 2012 Last Payment to Retire Debt
* 2011 Last Levy Year
MNPCA Septic Loans
The High Island, Buffalo Creek & Crow River Watershed Loans are paid thru special assessments. They are not part of the tax levy.
McLeod County Bonded Indebtednessas of 12/31/2012
34
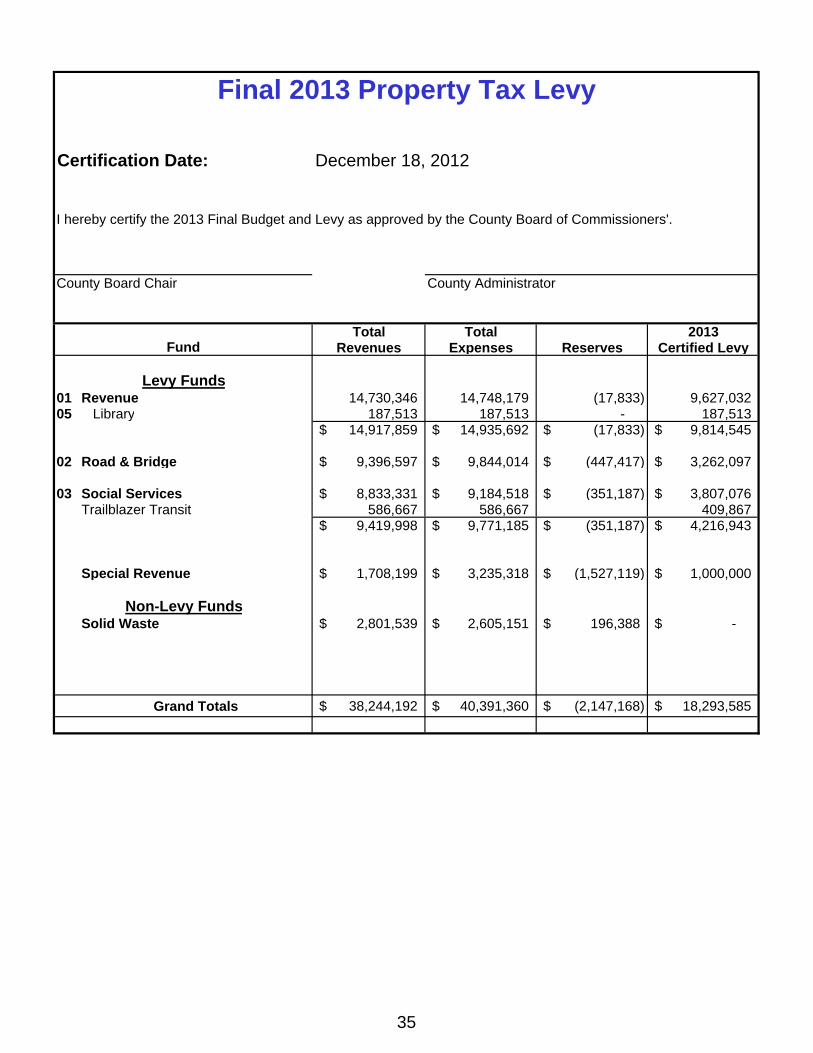
Certification Date:
I hereby certify the 2013 Final Budget and Levy as approved by the County Board of Commissioners'.
County Board Chair County Administrator
Total Total 2013Revenues Expenses Reserves Certified Levy
01 Revenue 14,730,346 14,748,179 (17,833) 9,627,03205 Library 187,513 187,513 - 187,513
14,917,859$ 14,935,692$ (17,833)$ 9,814,545$
02 Road & Bridge 9,396,597$ 9,844,014$ (447,417)$ 3,262,097$
03 Social Services 8,833,331$ 9,184,518$ (351,187)$ 3,807,076$ Trailblazer Transit 586,667 586,667 409,867
9,419,998$ 9,771,185$ (351,187)$ 4,216,943$
Special Revenue 1,708,199$ 3,235,318$ (1,527,119)$ 1,000,000$
Solid Waste 2,801,539$ 2,605,151$ 196,388$ -$
Grand Totals 38,244,192$ 40,391,360$ (2,147,168)$ 18,293,585$
Levy Funds
Non-Levy Funds
Final 2013 Property Tax Levy
December 18, 2012
Fund
35

TAX GLOSSARYABATEMENT - A reduction or decrease in taxable value that results in a reduction of taxes after and assessment and levy.
ACRE - A measure of land, equal to 160 square rods (43,560 square feet) in any shape.
AD VALOREM TAX - Tax are determined based on the value of a property.
ASSESSMENT YEAR - The year as of which the assessments are based. The valuation and classification of a property is based upon it's status on January 2, for taxes payable in the following year for Real Estate and Personal Property. Taxes payable on Manufactured Homes are based on the assessment on January 2, of the payable year.
BUDGET YEAR - Same as payable year except for school districts. School districts budget using a fiscal year that begins July 1st. The tax levied by a school district in 2011 for taxes payable in 2012 is for the 2012/2013 school year.
CLASS RATE - The percentage by which a property's market value is multiplied to arrive at its "net tax capacity" or taxable value, subject to the local tax rate. Classification, with its set of class rates, redefines the tax base and results in a redistribution of taxes among different kinds of properties.
CLASSIFICATION OF PROPERTY - Identifies the type of property, such as residential, agricultural, commercial, etc. based upon the use of the property.
DEBT SERVICE FUNDS - A fund to account for the collection of resources and payment of long-term debt principal and interest.
DISPARITY REDUCTION AID - A general purpose aid program designed to assist in the equalization of local tax rates.
ECONOMIC DEVELOPMENT - Expenditures related to providing financed and operated in a manner similar to private business, e.g., hospitals and nursing homes. The expenses of providing services are primarily financed by user charges.
EDUCATION AID - The total amount of state dollars paid for K-12 education. This aid is paid to the school districts.
EDUCATION HOMESTEAD CREDIT - A state-paid credit to reduce the school districts tax paid by homestead. First available for taxes payable in 1998. Repealed in the 2001 tax bill.
ESTIMATED MARKET VALUE (EMV) - Represents the assessor's estimate of the property's actual market value. Market value is defined as the most probable price that a well-informed buyer would pay a well-informed seller for a property without either party being unduly forced to buy or sell. All properties must be physically inspected in person at least once every four years.
FISCAL DISPARITY - Program (M.S. 473F) which provides for tax base sharing within the seven county metro area. Each municipality contributes 40% of the growth of its commercial/industrial tax base since 1971 to the seven county pool. This pool is then redistributed based on relative fiscal capacity. A percentage of the property tax on each commercial/industrial parcel is based on the seven county area wide rate.
36

GENERAL FUND (also known as the Revenue Fund) -The fund used to account for all financial resources not required to be accounted for in another fund. This fund is the main operating fund.
GREEN ACRES - A real estate parcel of a least 10 acres, the owner of which is engaged in agricultural pursuits and otherwise qualifies for a deferment of assessment and taxes payable; intended to preserve farmland from the pressures of development.
HOMESTEAD - For property tax purposes, homestead is a tax benefit granted to property owners (or qualifying relatives) who are Minnesota residents and who own and occupy their homes as their primary place of residence.
HOMESTEAD AND AGRICULTURAL CREDIT AID (HACA) - A state program that replaces the former homestead credit programs and the agricultural credit program starting in 1990. It is a property tax relief program determined by formula and paid to local governments before taxes are levied. Effective for payable in 2002 and future years HACA was eliminated for cities, townships, school districts, and special taxing districts.
HUMAN SERVICES - Human services expenditures are designed to provide public assistance and institutional care for individuals economically unable to provide for their own essential needs. Typical expenditures include social services and income maintenance.
LEVY - The amount of money that a taxing district needs to raise through property taxes.
LEVY LIMITS - State-imposed limits on the dollar amounts that can be levied by counties and cities and townships over 2,500 population.
LEVYING UNITS - In Minnesota, property taxes are levied by counties, cities, townships, school districts and special districts, which may included metro government agencies, hospital boards, watershed districts, transit authorities, park boards, and housing and redevelopment authorities, etc.
LIBRARIES - Expenditures include the purchase of reference materials and books, reference services to patrons, cataloging of materials, and general administration of the library.
LOCAL GOVERNMENT AID (LGA) - Money (in the form of general distribution aid) provided to cities and townships for property tax relief. Effective payable year 2002 and future years townships and small cities lost their LGA.
LOCAL TAX RATE - The tax rate usually expressed as a percentage of tax capacity, used to determine the property tax due on a piece of property.
MARKET VALUE REFERENDA RATE - Rate applied to the taxable market value of a property to calculate the market value referenda tax, for certain referendum levies which are based on market value instead of tax capacity.
NET PROPERTY TAX - As opposed to "gross property tax" - property tax after accounting for state aids and tax credits.
37

NET TAX LEVY - The property taxes, net of state property tax relief aids or grants, required to be paid by the property owners of the county.
PAYABLE YEAR - Year in which tax statements are issued and taxes become payable on May 15 and October 15 for real estate. Agricultural property has until November 15.
PROPERTY TAX - Generally a tax levied on both real and personal property; the amount of the tax is dependent on the value of the property.
PROPERTY TAX REFUND - A partial property tax refund program for those who have property taxes out of proportion with their income. This program is available to homeowners and renters.
ROAD AND BRIDGE - Streets and highways current expenditures are for the maintenance and repair of local highways, street, bridges, and street equipment. Common expenditures include patching, seal coating, and snow removal. Streets and highways expenditures cover expenditures on all county highways, including county state aid highways. Streets and highways capital outlays include construction and equipment purchases.
SPECIAL ASSESSMENT - An amount for improvements (such as streets, etc.) as certified by each municipality, which directly benefit the property are shown as a separate item on the tax statement. A levy made against certain properties to defray all or part of the costs of a specific improvement, such as new sewer and water mains, deemed to benefit primarily those properties.
STATE AIDS - Aid given to a local unit of government to be used only for a specific purpose. The state contends that individual taxes would be higher than shown on tax statements if it were not for the LGA, HACA, and DRA. The presumed amount of aid is indicated for each parcel on line 4 of your property tax statement.
TAX BASE - Total value of taxable property within the community.
TAX CAPACITY - A parcel's taxable market value multiplied by the class rate for that type of property. Formerly known as assessed value.
TAX INCREMENT FINANCING (TIF) - Districts created by municipalities to create fund improvements which increase market values of the properties in the district. The taxes generated by the increased market value are "captured" by the TIF District to finance project development or redevelopment costs.
TAX RATE (INITIAL) - The percent of the total taxable value of property needed to achieve the dollar amounts levied by the respective local units (levy/tax capacity = tax rate)
TAX RATE (LOCAL) - Rate applied to the tax capacity of a property to calculate the tax. Formerly known as mill rate.
TAX RATE TOTAL - The rate arrived at by summing the tax rates of all the units in the area authorized to levy taxes on a particular parcel of property.
38
TAXABLE TAX CAPACITY - The tax capacity less the tax increment district value, less the fiscal disparities contribution value, plus the fiscal disparities distribution value.
THIS OLD HOUSE - An exemption from property tax for all or a portion of the value of improvements made to homes at least 45 years old, designed to provide owners of older and deteriorated homes with an incentive to restore or renovate their house.
TOWNSHIP - A territorial division of land established by federal survey that is six miles square and contains thirty-six sections, each one mile square.
TRUTH-IN-TAXATION - State law providing for notices of proposed taxes for the up coming year to taxpayers and for public budget hearings.
39
APPENDIXResources
Minnesota Taxpayers Association - Understanding Your Property Taxes "2012 Edition"Minnesota Taxpayers Association85 Seventh Place East, Suite 250
St. Paul, MN 55101Phone No. 651-224-747 or 800-322-8297
Website: http://www.mntax.org
Minnesota Department of RevenueMinnesota Department of Revenue
Property Tax DivisionMail Station 3340
St. Paul, MN 55146-3340Website: http://www.taxes.state.mn.us
University of Minnesota Extension ServicesWebsite: http://www.extension.umn.edu
40