MCLEAN COUNTY, ILLINOIS 2017 DEMOGRAPHIC … · McLean Village 830 806 Normal Town 52,497 54,264...
8
2017 DEMOGRAPHIC PROFILE MCLEAN COUNTY, ILLINOIS Chicago St. Louis Bloomington Normal 50 Mi 150 Mi 100 Mi 200 W. College Ave., Suite 402, Normal, IL 61761|309.452.8437 | www.bnbiz.org
Transcript of MCLEAN COUNTY, ILLINOIS 2017 DEMOGRAPHIC … · McLean Village 830 806 Normal Town 52,497 54,264...
2017 DEMOGRAPHIC PROFILEMCLEAN COUNTY, ILLINOIS
Chicago
St. Louis
Bloomington Normal
50 Mi
150 Mi
100 Mi
200 W. College Ave., Suite 402, Normal, IL 61761|309.452.8437 | www.bnbiz.org

MUNICIPAL POPULATION
Municipalities 2010 2016Anchor Village 146 144
Arrowsmith Village
294 291
Bellflower Village 357 346
Bloomington City 76,610 78,005
Carlock Village 552 553
Chenoa City 1,785 1,747
Colfax Village 1,061 1,036
Cooksville Village 182 183
Danvers Village 1,154 1,126
Downs Village 1,005 978
Ellsworth Village 195 197
El Paso City 2,810 2,778
Gridley Village 1,432 1,427
Heyworth Village 2,841 2,881
Hudson Village 1,838 1,837
Le Roy City 3,560 3,550
Lexington City 2,060 2,048
McLean Village 830 806
Normal Town 52,497 54,264
Saybrook Village 693 677
Stanford Village 596 580
Towanda Village 480 475
McLean County 169,572 172,418
State of Illinois 12,830,632 12,801,539
United States 308,745,538 323,127,513
Source: U.S. Census Bureau, 2010 Census and American Fact Finder Population Estimates Program.
POPULATION & PROJECTIONS - MCLEAN COUNTY, ILLINOIS
Census 2010 2016 Projected 2021
Total Population169,572 175,890 184,413
Population by RaceAsian 7,227 9,833 13,316
Black 12,426 13,674 14,834
Hispanic 7,434 8,813 10,335
Other 6,979 3,082 3,575
White 142,940 145,971 147,372
Population by Age Group0-4 10,650 10,313 10,550
5-9 10,914 10,545 10,381
10-14 10,421 11,057 10,870
15-19 14,903 15,002 15,535
20-24 20,902 22,499 22,247
25-34 23,471 23,918 25,041
35-44 20,945 21,465 22,358
45-54 22,608 21,514 20,734
55-64 17,418 19,976 20,732
65-74 9,015 12,365 15,494
75-84 5,666 6,005 7,271
85+ 2,659 2,998 3,200
Median Age32.1 33.0 34.0
Source: ESRI & US Census Bureau.
PEOPLE

MAJOR EMPLOYERS
Company Names 2016
State Farm Insurance Co. 14,532
Illinois State University 3,300
COUNTRY Financial 1,939
Unit 5 Schools 1,669
Advocate BroMenn Healthcare 1,271
OSF St. Joseph Medical Center 894
Heartland Bank & Trust 763
Afni, Inc. 760
McLean County, Government 713
City of Bloomington 691
District 87 Schools 594
Illinois Wesleyan University 507
Town of Normal 499
GROWMARK, Inc. 480
Heritage Enterprises 465
Nestle USA 415
Nussbaum Transportation 399
Bridgestone/Firestone Co. 381
Illinois Farm Bureau 338
Heartland Community College 288
Chestnut Health Systems 255
The Snyder Companies 253
The Baby Fold 242
STL Technology Partners 122Source: HR Representatives from each company/organization. Figures are self-reported and non-scientific and not intended to be used as a time series. Full-time equivalents (FTE).
COUNTY EMPLOYMENT AND LABOR FORCE
Year Labor Force Employment Unemployment Rate
2016 89,681 85,110 4,571 5.1%
2015 91,110 86,678 4,432 4.9%
2014 91,027 86,074 4,953 5.4%
2013 92,724 86,565 6,159 6.6%
2012 94,495 88,493 6,002 6.4%
2011 95,315 89,007 6,308 6.6%
2010 96,139 89,348 6,791 7.1%
2009 91,493 84,871 6,622 7.2%
2008 90,615 86,181 4,434 4.9%Source: Illinois Department of Employment Security, Annual Avgs.
BLOOMINGTON-NORMAL EMPLOYMENT BY INDUSTRY
2012 2013 2014 2015 2016
Total Non-farm 96,200 95,700 94,400 95,200 93,200
Mining, Logging & Construction 2,700 2,800 2,800 2,800 2,800
Manufacturing 4,800 4,900 4,900 4,700 3,400
Transportation and Utilities 3,100 3,100 3,200 3,200 3,000
Retail Trade 9,400 9,300 9,300 9,800 9,600
Information 800 800 700 800 700
Financial Activities 20,500 20,500 19,700 20,000 20,000
Professional & Business Services 11,100 10,700 10,000 10,000 9,700
Educational & Health Services 10,700 10,600 10,700 10,900 11,200
Leisure and Hospitality 10,600 11,000 11,200 11,400 11,400
Other Services 3,700 3,700 3,700 3,800 3,800
Government 16,400 16,100 16,000 15,800 15,600
Source: US Bureau of Labor Statistics, CES Series. Numbers may not sum due to categorical overlap or rounding.
WAGE RATES FOR SELECTED OCCUPATIONS Job Title
Median Hourly Wage
Nursing assistants $11.78
Food preparation & serving $9.22
Janitors & cleaners $11.50
Cashiers $9.40
Retail salespersons $10.12
Machinists $15.56
Bookkeepers & accounting $18.65
Customer service representative
$12.99
Administrative assistants (non-exec)
$15.87
Insurance claims & policy processing clerks
$17.42
Maintenance & repair workers
$17.38
Freight / stock laborers, hand
$13.00
Truck drivers, heavy $21.67
Sales representatives, wholesale
$26.70
Source: Bureau of Labor Statistics, May 2016 Wage Rates.
BUSINESS
HEADQUARTERS OF:

MEDIAN HOUSEHOLD INCOME
Champaign County $46,495
Cook County $55,251
McLean County $62,211
Peoria County $51,147
Sangamon County $56,167
Tazewell County $58,194
Winnebago County $48,225Source: American Community Survey 2011-2015, 5-Year Estimates.
BUILDING PERMITS
Permits 2016
Construction Cost Permits 2015
Construction Cost
BloomingtonSingle Family 83 $15,765,053 105 $17,369,894
Multi Family 6 $6,347,000 2 $3,875,775
Commercial 101 $57,403,000 84 $23,774,288
Total 190 $79,515,053 191 $45,019,957
NormalSingle Family 78 $7,967,000 68 $6,717,000
Multi Family 6 $18,701,703 4 $4,434,295
Commercial 85 $30,612,925 74 $16,434,238
Total 169 $57,281,628 146 $27,585,533
Source: City of Bloomington and Town of Normal. Total figures do not include remodels, additions or demolitions.
2015 GROSS METROPOLITAN PRODUCT
Metro AreaGMP
(in billions)
Bloomington-Normal MSA
$10.414
Champaign-Urbana MSA $10.935
Decatur MSA $6.186
Peoria MSA $20.336
Rockford MSA $14.410
Springfield MSA $9.940
Illinois $776.9
Source: Bureau of Economic Analysis.
BLOOMINGTON-NORMAL HOME SALES
Year Sales Volume Avg. Year Sales Volume Avg.2016 2,859 $485,630,234 $169,860 2010 2,052 $363,018,814 $176,909
2015 2,780 $475,099,235 $170,899 2009 2,272 $379,437,411 $166,533
2014 2,632 $445,643,739 $169,318 2008 2,253 $399,218,123 $177,194
2013 2,812 $487,991,844 $173,539 2007 2,663 $442,453,102 $171,859
2012 2,459 $422,926,867 $171,991 2006 2,918 $490,115,440 $167,963
2011 2,048 $347,573,557 $169,714 2005 2,932 $487,646,025 $166,274
Source: Bloomington-Normal Association of Realtors. Figures include both new and existing homes.
RETAIL SALES TAX RECEIPTS
2011 2012 2013 2014 2015 2016
Bloomington $12,826,993 $14,730,776 $13,711,182 $13,314,807 $13,778,281 $14,113,962
Normal $7,954,718 $8,412,916 $8,633,468 $8,801,559 $8,856,261 $8,646,028
Source: Illinois Department of Revenue.
LIFESTYLE

SCHOOL DISTRICTS
Public School Districts Enrollment
Bloomington Dist. 87 5,455
El Paso-Gridley CUSD 11 1,238
Heyworth CUSD 4 970
Le Roy CUSD 2 795
Lexington CUSD 7 486
McLean County Unit 5 13,751
Olympia CUSD 16 1,860
Prairie Central CUSD 8 2,050
Ridgeview CUSD 19 609
Tri-Valley CUSD 3 992
Illinois State University Laboratory Schools
University High School 611
Thomas Metcalf School 435
Private Schools Grades
Calvary Christian Academy Pre K - 12
Central Catholic High School 9 - 12
Cornerstone Christian Academy Pre K - 12
Corpus Christi Catholic School K - 8
Epiphany Catholic School K - 8
Hammitt School K - 12
Mulberry School Pre K - 3
St. Mary's Catholic School Pre K - 8
Trinity Lutheran School Pre K - 8Sources: State Board of Education K-12. Illinois District Report Card 2016. Note: Private school enrollment numbers are not publicly available.
EDUCATION
COLLEGES
Heartland Community College—Established in 1990 and
classes were first offered in the fall of 1991. Since then,
enrollment has grown to over 5,282 credit students and
13,092 non-credit students with campuses in Normal, Pontiac,
and Lincoln. HCC offers 26 degrees and 44 certifications in
58 different areas.
Illinois State University—Founded in 1857, ISU was the first
public university in Illinois. With a 2015 enrollment of 20,788
and faculty numbering 1,394, ISU has six colleges and 35
academic departments offering more than 160 fields of study.
More than 70% of students live off-campus; a 2015 economic
impact analysis estimates the university annually contributes
more than $833 million to the local economy.
Illinois Wesleyan University—A private university founded in
1850, IWU has a student enrollment of 2,000 undergraduates.
Recognized as one of the nation’s premier private residential
liberal arts universities, IWU offers 39 majors and three pre-
professional programs with 184 faculty members.
Lincoln College—Lincoln College’s Normal campus, a private
residential college, offers academic and vocational programs
to 500 students. Accredited by the North Central Association,
Lincoln offers associate degrees as well as bachelor’s degrees
in business management and liberal arts with a student/
faculty ratio of 15:1.
ARTS, ENTERTAINMENT & LEISURE IN MCLEAN COUNTY
There are 38 parks in Bloomington, 19 in Normal and over 2,500 acres of regional parks in McLean County. Bloomington-Normal also boasts numerous entertainment venues including Miller Park Zoo, The Coliseum, Bone/Braden Auditorium at ISU, Redbird Arena, the Bloomington Cultural District, the Bloomington Center for the Performing Arts and more. For a complete listing of venues, events and shopping information, please see the “Bloomington-Normal Area Visitor Guide” (www.visitbn.org) published by the Bloomington-Normal Area Convention and Visitor’s Bureau.

UTILITIES
Metro Area
ElectricityAmeren Illinois — ameren.com/illinois
Corn Belt Energy Cooperative — cornbeltenergy.com
Natural Gas Nicor Gas — nicorgas.com
WaterCity of Bloomington — cityblm.org
Town of Normal — normal.org
Wastewater BN Water Reclamation Dist. — (309) 827-4396
Internet/Fiber
CIRBN — www.cirbn.org
Comcast —business.comcast.com
Frontier — business.frontier.com
MetroNet — metronetinc.com/bloomington
Stratus Networks — stratusnet.com
AVERAGE LAND COSTS AND RENTAL RATES
Land Costs in $ / square foot Rental Rates in $ / sf per year
Low High Typical Low High Typical Lease Type
Retail $4.00 $20.00 $8.00 $7.00 $30.00 $15.00 NNN
Office $2.50 $7.00 $4.00 $7.00 $19.00 $12.00 Modified Gross
Commercial $1.25 $5.00 $3.50 $6.00 $10.00 $9.00 Modified Gross
Manufacturing $0.50 $1.75 $1.75 $2.00 $5.00 $3.50 Modified Gross
Agricultural $0.11 $0.28 $0.23
Development $0.23 $2.30 $1.15 Source: Coldwell Banker The Real Estate Group of America REALTORS® Figures are not binding.. Estimates are derived from local market data covering 2015-2016.
COSTS
PROPERTY TAX STRUCTURE
Tax rates can range between $7.62 and $9.18 per $100 of equalized assessed valuation in McLean County. Equalized assessed value is equal to one-third the market value of a property as determined by the township assessor. Below are examples of specific tax codes from Bloomington and Normal:
2016 % of Total 2016 % of
Total
Bloomington Code 4001 Normal Code 3001
McLean County 0.9140 10.9% McLean County 0.9140 10.7%
Bloomington Township 0.1217 1.4% Normal Township 0.2308 2.7%
City of Bloomington 1.0836 12.9% Town of Normal 0.9589 11.2%
BN Water Reclamation District 0.1793 2.1% BN Water Reclamation District 0.1793 2.1%
BN Airport Authority 0.1244 1.5% BN Airport Authority 0.1244 1.5%
SUSD District 87 5.1400 61.2% School District U5 5.0147 58.6%
Bloomington Public Library 0.2530 3.0% Normal Public Library 0.4526 5.3%
Heartland Community College 0.5884 7.0% Heartland Community College 0.5884 6.9%
Township Road District 0.0957 1.1%
Totals 8.4044 100.0% Totals 8.5588 100.0%
Source: McLean County Office of Assessments and Illinois Department of Revenue
STATE OF ILLINOIS TAXESCorporate Income Tax. Calculated from reported federal income. The rate is 7.75% based on a 5.25% income tax and 2.5% replacement tax.
Sales/Use Tax. Illinois retail sales are taxed at a rate of 6.25% with the exception of grocery (or unprepared food) and pharmaceutical sales, which are taxed at 1%. Local municipalities may approve an additional sales tax for certain items - excluding licensed vehicles, grocery, and pharmaceuticals.
Property Tax. The State of Illinois levies no property taxes. Counties and municipalities, however, do levy these taxes.
Unemployment Compensation. Maximum rate is 7.2%, standard rate is 3.55%. Contribution payments are subject to Taxable Wage Base of $12,960.Source: Illinois Dept. of Revenue, Illinois Dept. of Employment Security
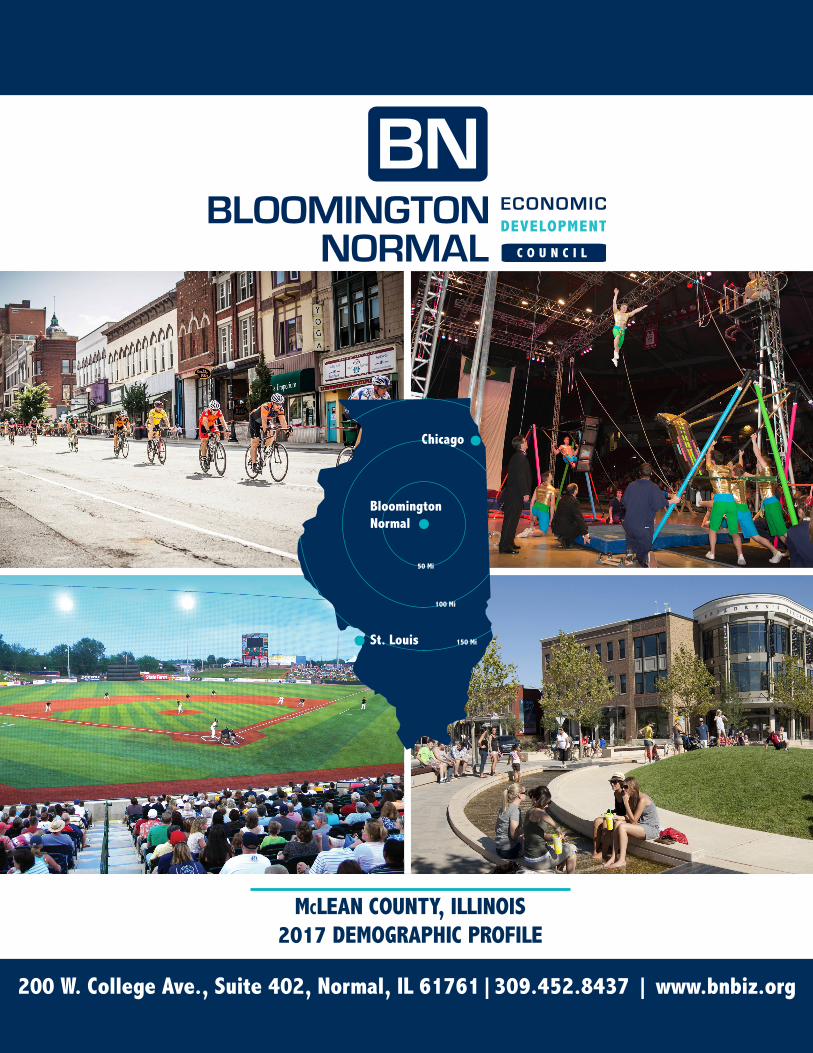
BLOOMINGTON-NORMAL AMTRAKThe Bloomington/Normal Amtrak Station is located in Uptown Normal and provides access to the Texas Eagle and Illinois Service Routes. Uptown Station is the second busiest Amtrak station in Illinois.
Amtrak Annual Ridership
Year Total Ons/Offs2016 226,2122015 254,3172014 261,6312013 263,2352012 239,9812011 244,5662010 192,682
Source: Amtrak, USDOT.
2016 Annual RidershipMetro AreaChicago 3,247,117Bloomington/Normal 226,212Springfield 165,484Champaign/Urbana 162,050Carbondale 101,845
Source: Amtrak, USDOT.
Connect Transit Annual Ridership
Year Riders2016 2,029,8712015 2,603,0292014 2,699,5282013 2,067,2762012 2,083,9472011 1,849,2342010 1,261,374
Source: Connect Transit.
CONNECT TRANSITConnect Transit is the primary public transit system servicing Bloomington-Normal. Eleven fixed routes provide access to the Bloomington-Normal community year round, and three additional routes are added during the academic year
CENTRAL ILLINOIS REGIONAL AIRPORTCentral Illinois Regional Airport (CIRA), also known by its three letter IATA identifier as BMI, is located in East Bloomington. Offering access to and from the world on three airlines - American, Delta and Allegiant - via daily jet service to airline hubs in Atlanta, Dallas-Ft. Worth, Minneapolis-St. Paul and Chicago and nonstop service to Florida destinations, CIRA supports the quality of life, business and institutional travel needs of the region. Geographically located in the center of the vibrant central Illinois region, CIRA serves as a convenient and efficient global portal for corporate activities and those with business and leisure travel interests.
With FedEx’s daily air cargo flight activity and a sorting and distribution facility, corporate and private based aircraft facilities and multiple aircraft maintenance, charter and fueling service providers, CIRA hosts a considerable amount of aviation activity generating significant economic impact to the community. Airfield capabilities include an 8,000 foot primary runway and a 6,500 foot crosswind runway with three Instrument Landing Systems including a CAT II, providing for reliable operations during inclement weather conditions.
Over 700 acres of shovel-ready airport property located within an Enterprise Zone and designated for a variety of commercial, manufacturing, hospitality and retail services are available for development. Find more information about Central Illinois Regional Airport at CIRA.com. Source and photo: Central Illinois Regional Airport.
TRANSIT
Annual Airport Usage
Year Passengers2016 192,1402015 186,6332014 204,5232013 211,9572012 240,1812011 284,8522010 274,677
Source: Federal Aviation Administration

MCLEAN COUNTY115 E. Washington St. Bloomington, IL 61701 (309) 888-5110 www.mcleancountyil.gov
TOWN OF NORMAL11 Uptown Circle Normal, IL 61761(309) 454-2444 www.normal.org
CITY OF BLOOMINGTON109 E. Olive St. Bloomington, IL 61701 (309) 434-2611 www.cityblm.org
MCLEAN COUNTY CHAMBER OF COMMERCE2203 E. Empire Street Bloomington, IL 61704 (309) 829-6344 www.mcleancochamber.org
CAREER LINK – MCLEAN COUNTY1500 W. Raab Rd. Suite 2400 Student Commons Building Normal, IL 61761 (309) 827-6237 www.careerlink16.com
CENTRAL ILLINOIS SCORE121 N. Main St., 2nd floor Bloomington, IL 61701 (309) 664-0549 centralillinois.score.org
MCLEAN COUNTY REGIONAL PLANNING COMMISSION 115 E. Washington St. Bloomington, IL 61701 (309) 828-4331 www.mcplan.org
BLOOMINGTON-NORMAL AREA CONVENTION AND VISITORS BUREAU3201 CIRA Dr. Suite #201 Bloomington, IL 61704 (309) 665-0033 www.visitbn.org
STEVENSON CENTER FOR COMMUNITY AND ECONOMIC DEVELOPMENTIllinois State University Campus Box 4200 Normal, IL 61790-4200 (309) 438-7090 www.stevensoncenter.org
MCLEAN COUNTY SMALL BUSINESS DEVELOPMENT CENTERIllinois Wesleyan University 1312 Park Street P.O. Box 2900 Bloomington, IL. 61701 www.iwu.edu/sbdc
BN Advantage is an economic development plan and implementation strategy
promoting collaboration by engaging all segments of the community to achieve
economic growth and diversification through entrepreneurship, expansion
of underrepresented employment sectors, and attraction of complementary
businesses while building upon the region’s superior quality of life.
DON’T SEE THE INFORMATION YOU NEED? CONTACT US AND WE CAN HELP?The EDC helps businesses in McLean County grow and attracts new businesses to our community. We are a leadership organization, investing our community’s assets to grow and improve our prosperity and quality of life.
200 W. College Ave., Suite 402, Normal, IL 61761 309.452.8437 | www.bnbiz.org
COMMUNITY CONTACTS
BNAdvantage.com