Everett & McKinsey Identity and Access Management 2009 Survey
Upload
zoe-schlangerCategory
view
16.840download
8
1
Please refer to the questionnaire (McKinsey & Company - Benefits Package Decision Makers Study) for the full description of each question and how it was presented to respondents. The descriptions provided in these data tables as titles are abbreviated and may not reflect what the respondents saw during the survey.

2
S1. What is your age? ______________________________________________________________________________ Proportions/Means: Columns Tested (10% risk level) - A/B/C - D/E - F/G/H - I/J/K * small base; ** very small base (under 30) ineligible for sig testing
Company Size Decision Maker Awareness Occupation
Total 2 to 49 50 to 499 500 + Primary Decision Maker
Influencer Low Medium High Manufacturing
Retail trade Finance/Insurance
A B C D E F G H I J K
Base: All Respondents 1329 336 458 535 672 657 758 384 187 321 329 250
Weighted 1329 508 426 395* 683 646 813 378* 138** 62 154 56
18-24 176 78 61 37 90 86 66 87 24 4 18 4 13.3% 15.3% 14.3% 9.5% 13.2% 13.4% 8.1% 23.0% 17.1% 6.5% 11.9% 8.0% F I
25-34 244 80 87 77 159 86 165 49 31 15 35 14 18.4% 15.8% 20.5% 19.4% 23.2% 13.3% 20.3% 12.9% 22.1% 24.3% 23.1% 24.8% E
35-44 260 87 84 89 135 125 144 76 40 16 21 12 19.6% 17.2% 19.7% 22.5% 19.7% 19.4% 17.7% 20.2% 28.8% 25.9% 13.4% 21.6% J J
45-54 331 110 96 125 170 161 218 88 25 15 36 15 24.9% 21.7% 22.4% 31.7% 24.9% 24.9% 26.9% 23.3% 17.9% 24.0% 23.4% 27.2% A
55 + 317 152 98 67 129 188 220 78 19 12 43 10 23.9% 29.9% 23.1% 17.0% 18.9% 29.1% 27.0% 20.7% 14.1% 19.3% 28.3% 18.4% C D IK
Summary
Mean 43.2 44.0 42.7 42.8 41.6 45.0 45.2 40.4 39.3 42.6 43.2 42.2 D G

3
S2. Are you male or female? ______________________________________________________________________________ Proportions/Means: Columns Tested (10% risk level) - A/B/C - D/E - F/G/H - I/J/K * small base; ** very small base (under 30) ineligible for sig testing
Company Size Decision Maker Awareness Occupation
Total 2 to 49 50 to 499 500 + Primary Decision Maker
Influencer Low Medium High Manufacturing
Retail trade Finance/Insurance
A B C D E F G H I J K
Base: All Respondents 1329 336 458 535 672 657 758 384 187 321 329 250
Weighted 1329 508 426 395* 683 646 813 378* 138** 62 154 56
Male 657 260 175 222 357 300 376 186 95 37 72 25 49.4% 51.2% 41.0% 56.1% 52.2% 46.4% 46.2% 49.1% 68.9% 59.2% 47.1% 45.2% B JK
Female 672 248 251 173 326 346 437 193 43 25 81 31 50.6% 48.8% 59.0% 43.9% 47.8% 53.6% 53.8% 50.9% 31.1% 40.8% 52.9% 54.8% C I I

4
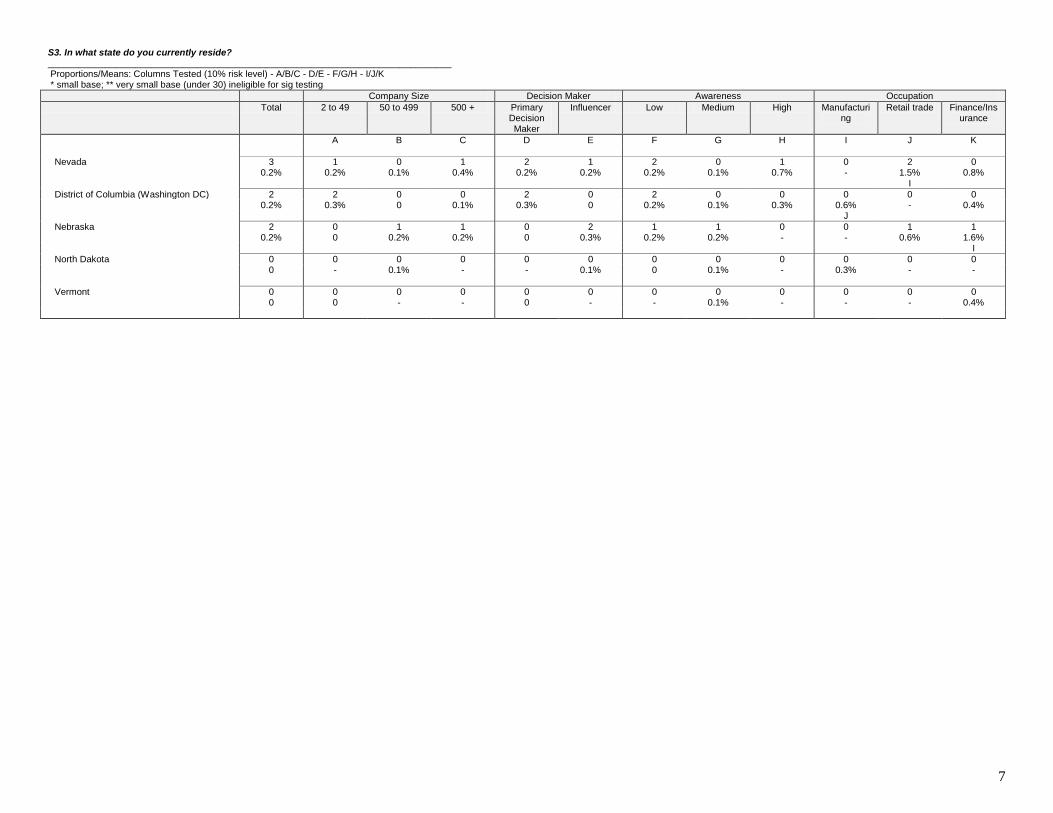
S3. In what state do you currently reside? ______________________________________________________________________________ Proportions/Means: Columns Tested (10% risk level) - A/B/C - D/E - F/G/H - I/J/K * small base; ** very small base (under 30) ineligible for sig testing
Company Size Decision Maker Awareness Occupation
Total 2 to 49 50 to 499 500 + Primary Decision Maker
Influencer Low Medium High Manufacturing
Retail trade Finance/Insurance
A B C D E F G H I J K
Base: All Respondents 1329 336 458 535 672 657 758 384 187 321 329 250
Weighted 1329 508 426 395* 683 646 813 378* 138** 62 154 56
California 188 61 65 61 110 78 79 68 40 7 17 7 14.1% 12.1% 15.4% 15.4% 16.1% 12.0% 9.8% 18.1% 28.9% 10.9% 11.2% 12.8% F
Texas 99 27 41 31 64 36 73 16 10 6 8 4 7.5% 5.4% 9.6% 8.0% 9.3% 5.5% 9.0% 4.2% 7.5% 9.0% 5.5% 6.4% J
New York 91 30 27 34 47 44 52 16 22 7 10 5 6.8% 5.9% 6.2% 8.6% 6.8% 6.8% 6.5% 4.2% 15.9% 11.2% 6.4% 8.4% J
Florida 62 35 23 4 24 37 38 18 6 4 9 3 4.6% 6.8% 5.3% 1.1% 3.5% 5.8% 4.7% 4.7% 4.2% 6.2% 5.8% 4.8% C C
Pennsylvania 55 24 14 17 32 22 34 12 9 2 7 4 4.1% 4.7% 3.3% 4.4% 4.7% 3.5% 4.2% 3.1% 6.5% 3.1% 4.3% 6.4% I
Illinois 55 20 17 17 30 25 29 12 13 5 10 3 4.1% 3.9% 4.1% 4.4% 4.4% 3.8% 3.6% 3.3% 9.4% 7.8% 6.4% 5.2%
Ohio 53 19 15 19 31 23 32 20 1 4 9 3 4.0% 3.7% 3.5% 4.9% 4.5% 3.5% 4.0% 5.2% 0.9% 6.2% 6.1% 4.8%
Georgia 45 14 12 18 25 20 26 16 3 1 4 1 3.4% 2.8% 2.9% 4.6% 3.7% 3.0% 3.2% 4.1% 2.1% 1.6% 2.7% 1.6%
New Jersey 41 12 13 16 23 18 26 10 5 2 8 5 3.1% 2.3% 3.1% 4.0% 3.4% 2.7% 3.2% 2.5% 3.7% 3.1% 5.5% 8.4% I
Maryland 40 5 7 29 32 8 28 11 1 0 2 1 3.0% 0.9% 1.5% 7.2% 4.7% 1.2% 3.4% 3.0% 0.5% - 1.2% 2.0% AB E I I
Missouri 36 23 8 5 8 28 22 11 4 1 3 1 2.7% 4.6% 2.0% 1.2% 1.2% 4.3% 2.7% 2.8% 2.6% 1.9% 2.1% 1.6% D
Michigan 35 12 11 12 12 23 26 8 1 2 3 1 2.6% 2.3% 2.6% 2.9% 1.7% 3.6% 3.2% 2.1% 0.6% 2.5% 2.1% 2.0%
Colorado 35 27 1 7 8 27 31 3 1 1 1 1 2.6% 5.3% 0.2% 1.8% 1.1% 4.2% 3.8% 0.8% 0.6% 1.6% 0.6% 1.2% B D
North Carolina 34 21 9 4 23 11 18 14 2 2 5 2 2.6% 4.2% 2.2% 0.9% 3.3% 1.8% 2.3% 3.6% 1.8% 3.1% 3.3% 3.2%

5
S3. In what state do you currently reside? ______________________________________________________________________________ Proportions/Means: Columns Tested (10% risk level) - A/B/C - D/E - F/G/H - I/J/K * small base; ** very small base (under 30) ineligible for sig testing
Company Size Decision Maker Awareness Occupation
Total 2 to 49 50 to 499 500 + Primary Decision Maker
Influencer Low Medium High Manufacturing
Retail trade Finance/Insurance
A B C D E F G H I J K
Virginia 33 23 3 6 17 16 20 12 1 1 2 2 2.5% 4.6% 0.8% 1.6% 2.4% 2.5% 2.5% 3.1% 0.6% 0.9% 1.2% 3.6% B IJ
Alabama 30 7 22 0 28 2 10 20 0 1 1 0 2.2% 1.4% 5.2% 0.1% 4.1% 0.3% 1.2% 5.2% 0.2% 1.2% 0.6% 0.8% C E F
Massachusetts 29 9 9 11 14 15 16 10 2 1 2 2 2.2% 1.9% 2.0% 2.8% 2.1% 2.3% 2.0% 2.7% 1.8% 0.9% 1.5% 4.4% IJ
Arizona 29 14 3 12 9 20 23 6 0 0 2 0 2.2% 2.7% 0.7% 3.1% 1.3% 3.1% 2.9% 1.5% - 0.6% 1.5% 0.8%
Minnesota 29 10 13 6 16 13 14 14 0 2 4 1 2.2% 2.0% 3.1% 1.5% 2.4% 2.0% 1.8% 3.8% 0.1% 3.4% 2.7% 2.4%
Wisconsin 28 13 8 6 11 16 22 4 1 3 5 1 2.1% 2.7% 1.9% 1.5% 1.7% 2.5% 2.7% 1.1% 0.8% 5.3% 3.0% 2.0% K
Washington 27 11 15 2 11 17 26 1 0 1 5 0 2.1% 2.1% 3.5% 0.5% 1.6% 2.6% 3.2% 0.3% 0.3% 1.6% 3.0% 0.4% K
Tennessee 27 6 12 10 5 22 15 11 1 1 3 1 2.0% 1.1% 2.7% 2.4% 0.7% 3.4% 1.9% 2.9% 0.4% 1.2% 2.1% 1.6% D
Connecticut 24 10 7 7 11 14 12 12 0 0 4 1 1.8% 2.0% 1.7% 1.8% 1.6% 2.1% 1.5% 3.2% - 0.6% 2.4% 2.0% I
Indiana 21 7 9 5 2 19 15 5 1 1 2 1 1.6% 1.4% 2.1% 1.3% 0.3% 3.0% 1.9% 1.4% 0.7% 1.6% 1.2% 2.4% D
Oregon 19 3 10 5 10 9 9 10 0 1 3 0 1.4% 0.6% 2.5% 1.4% 1.4% 1.4% 1.1% 2.6% - 1.6% 2.1% 0.4%
Arkansas 16 6 2 9 7 9 14 1 0 1 3 0 1.2% 1.1% 0.4% 2.2% 1.0% 1.4% 1.7% 0.3% 0.3% 1.2% 1.8% - K K
Kansas 14 7 2 5 7 6 12 1 0 0 1 1 1.0% 1.4% 0.4% 1.2% 1.0% 1.0% 1.5% 0.3% 0.2% 0.6% 0.9% 1.6%
Oklahoma 13 7 0 6 0 13 10 0 3 0 0 0 1.0% 1.3% 0.1% 1.6% 0.1% 2.0% 1.3% 0.1% 1.9% 0.6% 0.3% 0.8% D
Louisiana 13 7 4 1 8 5 8 5 0 1 1 0 1.0% 1.5% 1.0% 0.3% 1.2% 0.7% 1.0% 1.3% - 0.9% 0.9% 0.4%

6
S3. In what state do you currently reside? ______________________________________________________________________________ Proportions/Means: Columns Tested (10% risk level) - A/B/C - D/E - F/G/H - I/J/K * small base; ** very small base (under 30) ineligible for sig testing
Company Size Decision Maker Awareness Occupation
Total 2 to 49 50 to 499 500 + Primary Decision Maker
Influencer Low Medium High Manufacturing
Retail trade Finance/Insurance
A B C D E F G H I J K
Kentucky 11 2 8 1 4 7 2 9 0 1 3 0 0.8% 0.4% 2.0% 0.2% 0.6% 1.1% 0.3% 2.3% 0.1% 1.6% 1.8% - K K
Montana 10 3 5 2 3 7 7 3 0 0 1 0 0.8% 0.6% 1.1% 0.6% 0.4% 1.1% 0.9% 0.8% - - 0.6% -
West Virginia 9 0 8 1 6 3 4 0 6 0 1 0 0.7% 0 1.9% 0.3% 0.9% 0.5% 0.4% 0.1% 4.1% 0.6% 0.6% 0.4%
Utah 9 3 5 0 8 1 4 6 0 1 0 1 0.7% 0.7% 1.3% 0.1% 1.2% 0.1% 0.4% 1.5% 0.1% 1.2% - 1.2% J J
South Carolina 9 6 1 2 2 7 8 1 1 1 2 0 0.7% 1.2% 0.3% 0.5% 0.3% 1.1% 1.0% 0.2% 0.6% 1.9% 1.2% 0.8%
Idaho 8 0 5 2 8 0 5 3 0 0 0 0 0.6% 0.1% 1.3% 0.6% 1.2% 0 0.7% 0.7% 0.3% 0.3% 0.3% -
Iowa 8 5 1 2 5 3 3 5 0 1 2 0 0.6% 0.9% 0.2% 0.6% 0.8% 0.4% 0.4% 1.3% 0.1% 1.6% 1.5% 0.8%
New Mexico 8 4 1 3 5 3 7 0 0 0 1 0 0.6% 0.9% 0.2% 0.7% 0.7% 0.5% 0.9% 0.1% - - 0.6% 0.4%
South Dakota 7 0 2 5 5 2 5 3 0 0 0 0 0.6% - 0.5% 1.4% 0.7% 0.4% 0.6% 0.7% - - 0.3% -
Rhode Island 7 7 0 0 1 6 7 0 0 0 1 0 0.5% 1.3% 0 - 0.1% 1.0% 0.8% - - 0.3% 0.6% -
Maine 5 3 1 1 0 4 4 0 1 0 2 0 0.4% 0.6% 0.2% 0.3% 0.1% 0.7% 0.5% - 0.5% 0.3% 1.2% -
Mississippi 4 0 1 3 3 0 2 1 0 0 0 0 0.3% - 0.2% 0.7% 0.5% 0.1% 0.3% 0.3% 0.2% - - 0.4%
New Hampshire 3 0 3 0 0 3 3 0 0 0 0 0 0.2% - 0.6% 0.1% 0.1% 0.4% 0.3% 0.1% 0.2% 0.3% - 0.4%
Delaware 3 0 0 2 3 0 3 0 0 0 0 0 0.2% 0.1% - 0.6% 0.4% 0 0.3% 0.1% - 0.3% 0.3% -
7
S3. In what state do you currently reside? ______________________________________________________________________________ Proportions/Means: Columns Tested (10% risk level) - A/B/C - D/E - F/G/H - I/J/K * small base; ** very small base (under 30) ineligible for sig testing
Company Size Decision Maker Awareness Occupation
Total 2 to 49 50 to 499 500 + Primary Decision Maker
Influencer Low Medium High Manufacturing
Retail trade Finance/Insurance
A B C D E F G H I J K
Nevada 3 1 0 1 2 1 2 0 1 0 2 0 0.2% 0.2% 0.1% 0.4% 0.2% 0.2% 0.2% 0.1% 0.7% - 1.5% 0.8% I
District of Columbia (Washington DC) 2 2 0 0 2 0 2 0 0 0 0 0 0.2% 0.3% 0 0.1% 0.3% 0 0.2% 0.1% 0.3% 0.6% - 0.4% J
Nebraska 2 0 1 1 0 2 1 1 0 0 1 1 0.2% 0 0.2% 0.2% 0 0.3% 0.2% 0.2% - - 0.6% 1.6% I
North Dakota 0 0 0 0 0 0 0 0 0 0 0 0 0 - 0.1% - - 0.1% 0 0.1% - 0.3% - -
Vermont 0 0 0 0 0 0 0 0 0 0 0 0 0 0 - - 0 - - 0.1% - - - 0.4%

8
Decision Maker ______________________________________________________________________________ Proportions/Means: Columns Tested (10% risk level) - A/B/C - D/E - F/G/H - I/J/K * small base; ** very small base (under 30) ineligible for sig testing
Company Size Decision Maker Awareness Occupation
Total 2 to 49 50 to 499 500 + Primary Decision Maker
Influencer Low Medium High Manufacturing
Retail trade Finance/Insurance
A B C D E F G H I J K
Base: All Respondents 1329 336 458 535 672 657 758 384 187 321 329 250
Weighted 1329 508 426 395* 683 646 813 378* 138** 62 154 56
Primary Decision Maker 683 253 208 223 683 0 388 182 113 36 78 27 51.4% 49.8% 48.7% 56.4% 100.0% - 47.8% 48.2% 81.5% 57.0% 50.5% 47.6% E JK
Influencer 646 255 218 172 0 646 424 196 26 27 76 29 48.6% 50.2% 51.3% 43.6% - 100.0% 52.2% 51.8% 18.5% 43.0% 49.5% 52.4% D I I

9
Q1_01. [Medical benefits] This question refers to employee benefits and who has authority within your company to select what employee benefits to provide and which companies will provide them. In your job, do you play a role in choosing which benefits your company provides to employees? For each benefit, what role do you play? ... ______________________________________________________________________________ Proportions/Means: Columns Tested (10% risk level) - A/B/C - D/E - F/G/H - I/J/K * small base; ** very small base (under 30) ineligible for sig testing
Company Size Decision Maker Awareness Occupation
Total 2 to 49 50 to 499 500 + Primary Decision Maker
Influencer Low Medium High Manufacturing
Retail trade Finance/Insurance
A B C D E F G H I J K
Base: All Respondents 1329 336 458 535 672 657 758 384 187 321 329 250
Weighted 1329 508 426 395* 683 646 813 378* 138** 62 154 56
Medical benefits
Primary decision maker 683 253 208 223 683 0 388 182 113 36 78 27 51.4% 49.8% 48.7% 56.4% 100.0% - 47.8% 48.2% 81.5% 57.0% 50.5% 47.6% E JK
Have some influence in the decision-making process
479 202 169 109 0 479 304 154 21 19 57 22
36.1% 39.8% 39.6% 27.5% - 74.3% 37.5% 40.7% 15.4% 30.5% 37.1% 38.8% C C D I I
Do not play a role in this decision 163 52 48 63 0 163 118 41 4 8 17 7 12.3% 10.3% 11.3% 16.0% - 25.3% 14.6% 10.8% 2.9% 12.1% 11.2% 12.8% D
Not sure 3 1 2 0 0 3 1 1 0 0 2 0 0.2% 0.1% 0.4% 0.1% - 0.4% 0.2% 0.3% 0.2% 0.3% 1.2% 0.8%
Summary
Primary decision maker/ Have some influence in the decision-making process
1163 455 376 332 683 479 693 336 134 55 134 49
87.5% 89.6% 88.3% 83.9% 100.0% 74.3% 85.3% 88.9% 96.9% 87.5% 87.5% 86.4% E

10
Q1_02. [Other health and welfare benefits] This question refers to employee benefits and who has authority within your company to select what employee benefits to provide and which companies will provide them. In your job, do you play a role in choosing which benefits your company provides to employees? For each benefit, what role do you play? ... ______________________________________________________________________________ Proportions/Means: Columns Tested (10% risk level) - A/B/C - D/E - F/G/H - I/J/K * small base; ** very small base (under 30) ineligible for sig testing
Company Size Decision Maker Awareness Occupation
Total 2 to 49 50 to 499 500 + Primary Decision Maker
Influencer Low Medium High Manufacturing
Retail trade Finance/Insurance
A B C D E F G H I J K
Base: All Respondents 1329 336 458 535 672 657 758 384 187 321 329 250
Weighted 1329 508 426 395* 683 646 813 378* 138** 62 154 56
Other health and welfare benefits
Primary decision maker 665 250 189 225 625 40 377 168 120 36 79 27 50.0% 49.3% 44.5% 56.9% 91.4% 6.2% 46.4% 44.4% 86.8% 57.0% 51.7% 47.2% B E K
Have some influence in the decision-making process
507 210 183 114 44 462 316 173 17 20 57 21
38.1% 41.3% 43.0% 28.8% 6.5% 71.6% 38.9% 45.8% 12.3% 32.4% 36.8% 37.6% C C D
Do not play a role in this decision 145 38 52 55 10 135 112 32 1 6 15 8 10.9% 7.5% 12.3% 13.8% 1.4% 21.0% 13.8% 8.5% 0.8% 10.3% 10.0% 14.0% D
Not sure 13 10 1 2 5 8 8 5 0 0 2 1 1.0% 1.9% 0.3% 0.5% 0.7% 1.3% 0.9% 1.4% 0.2% 0.3% 1.5% 1.2%
Summary
Primary decision maker/ Have some influence in the decision-making process
1171 460 372 339 669 502 693 341 137 56 136 48
88.1% 90.6% 87.4% 85.7% 97.9% 77.8% 85.3% 90.2% 99.0% 89.4% 88.4% 84.8% E

11
Q1_03. [Wellness programs] This question refers to employee benefits and who has authority within your company to select what employee benefits to provide and which companies will provide them. In your job, do you play a role in choosing which benefits your company provides to employees? For each benefit, what role do you play? ... ______________________________________________________________________________ Proportions/Means: Columns Tested (10% risk level) - A/B/C - D/E - F/G/H - I/J/K * small base; ** very small base (under 30) ineligible for sig testing
Company Size Decision Maker Awareness Occupation
Total 2 to 49 50 to 499 500 + Primary Decision Maker
Influencer Low Medium High Manufacturing
Retail trade Finance/Insurance
A B C D E F G H I J K
Base: All Respondents 1329 336 458 535 672 657 758 384 187 321 329 250
Weighted 1329 508 426 395* 683 646 813 378* 138** 62 154 56
Wellness programs
Primary decision maker 615 223 183 208 582 34 349 152 115 34 75 25 46.3% 44.0% 43.1% 52.7% 85.1% 5.2% 42.9% 40.2% 82.9% 54.5% 48.9% 44.0% E K
Have some influence in the decision-making process
490 186 181 124 48 442 307 168 15 20 58 22
36.9% 36.6% 42.4% 31.3% 7.1% 68.5% 37.8% 44.5% 10.7% 32.7% 38.0% 39.6% C D I
Do not play a role in this decision 195 82 57 56 43 151 135 50 9 7 16 8 14.6% 16.1% 13.4% 14.2% 6.3% 23.4% 16.7% 13.3% 6.4% 11.5% 10.3% 14.4% D
Not sure 29 17 5 7 10 19 21 8 0 1 4 1 2.2% 3.3% 1.1% 1.9% 1.5% 2.9% 2.6% 2.0% - 1.2% 2.7% 2.0%
Summary
Primary decision maker/ Have some influence in the decision-making process
1105 409 364 332 630 476 656 320 129 54 134 47
83.2% 80.6% 85.5% 84.0% 92.2% 73.7% 80.7% 84.7% 93.6% 87.2% 86.9% 83.6% E

12
Q1_04. [Non-health benefit] This question refers to employee benefits and who has authority within your company to select what employee benefits to provide and which companies will provide them. In your job, do you play a role in choosing which benefits your company provides to employees? For each benefit, what role do you play? ... ______________________________________________________________________________ Proportions/Means: Columns Tested (10% risk level) - A/B/C - D/E - F/G/H - I/J/K * small base; ** very small base (under 30) ineligible for sig testing
Company Size Decision Maker Awareness Occupation
Total 2 to 49 50 to 499 500 + Primary Decision Maker
Influencer Low Medium High Manufacturing
Retail trade Finance/Insurance
A B C D E F G H I J K
Base: All Respondents 1329 336 458 535 672 657 758 384 187 321 329 250
Weighted 1329 508 426 395* 683 646 813 378* 138** 62 154 56
Non-health benefit
Primary decision maker 650 233 196 221 598 53 369 169 113 34 73 26 48.9% 46.0% 46.0% 56.0% 87.4% 8.2% 45.4% 44.6% 81.4% 54.2% 47.7% 46.4% E JK
Have some influence in the decision-making process
491 178 186 127 69 422 304 165 21 21 56 23
36.9% 35.0% 43.7% 32.2% 10.1% 65.4% 37.4% 43.7% 15.6% 33.0% 36.2% 41.2% C D I
Do not play a role in this decision 166 85 40 41 12 154 125 36 4 7 21 7 12.5% 16.6% 9.3% 10.5% 1.7% 23.9% 15.4% 9.5% 3.0% 11.8% 13.7% 11.6% D
Not sure 22 12 5 6 6 17 14 8 0 1 4 0 1.7% 2.4% 1.1% 1.4% 0.8% 2.6% 1.8% 2.1% - 0.9% 2.4% 0.8%
Summary
Primary decision maker/ Have some influence in the decision-making process
1141 411 382 348 666 475 673 334 134 54 129 49
85.9% 81.0% 89.6% 88.1% 97.5% 73.5% 82.8% 88.4% 97.0% 87.2% 83.9% 87.6% A E

13
Q2. What is your role? ______________________________________________________________________________ Proportions/Means: Columns Tested (10% risk level) - A/B/C - D/E - F/G/H - I/J/K * small base; ** very small base (under 30) ineligible for sig testing
Company Size Decision Maker Awareness Occupation
Total 2 to 49 50 to 499 500 + Primary Decision Maker
Influencer Low Medium High Manufacturing
Retail trade Finance/Insurance
A B C D E F G H I J K
Base: Primary decision maker/ Have some influence in the decision-making process
1329 336 458 535 672 657 758 384 187 321 329 250
Weighted 1329 508 426 395* 683 646 813 378* 138** 62 154 56
Owner 263 194 48 21 174 90 167 61 35 8 32 5 19.8% 38.3% 11.2% 5.3% 25.4% 13.9% 20.6% 16.2% 25.0% 13.4% 21.0% 9.2% BC E IK
Management / Director / Dept.Head 204 87 62 56 66 138 136 60 8 7 20 8 15.4% 17.1% 14.5% 14.2% 9.7% 21.4% 16.8% 15.9% 5.7% 10.6% 12.8% 14.8% D
Head of HR 135 47 69 19 69 66 47 73 16 8 16 4 10.2% 9.3% 16.2% 4.7% 10.1% 10.2% 5.7% 19.3% 11.4% 12.5% 10.6% 7.6% C F K
Head of Procurement 84 11 29 44 44 40 34 29 21 4 7 3 6.3% 2.1% 6.7% 11.2% 6.4% 6.2% 4.2% 7.6% 15.5% 6.9% 4.9% 6.0% A A
CEO or President 69 22 34 14 51 18 26 15 29 11 7 4 5.2% 4.4% 7.9% 3.5% 7.5% 2.9% 3.2% 3.9% 21.1% 17.8% 4.3% 7.6% E JK J
Comptroller/ Acctg/ Admin/ HR/ Legal 69 13 28 28 23 46 46 22 0 3 5 5 5.2% 2.6% 6.5% 7.2% 3.4% 7.1% 5.7% 5.9% 0.3% 5.0% 3.0% 9.6% IJ
VP of Compensation or Benefits Director/Manager
64 16 15 32 37 27 22 32 9 5 9 5
4.8% 3.2% 3.6% 8.1% 5.4% 4.1% 2.7% 8.5% 6.8% 8.4% 5.8% 9.2% F
CFO 57 31 19 7 30 27 25 19 13 2 5 4 4.3% 6.0% 4.5% 1.8% 4.3% 4.2% 3.1% 5.0% 9.1% 3.1% 3.0% 7.2% IJ
Advisor / Analyst / Sales Exec 41 12 10 19 22 19 33 4 3 1 6 2 3.1% 2.3% 2.4% 4.9% 3.1% 3.0% 4.1% 1.1% 2.4% 2.2% 4.0% 3.2%
Other 343 75 113 155 169 174 276 63 4 13 47 14 25.8% 14.7% 26.5% 39.2% 24.7% 26.9% 33.9% 16.7% 2.7% 20.2% 30.7% 25.6% A AB G I

14
Q24_01. [Medical benefits] For the benefits over which you do not have sole decision making authority, what other individuals have input into these decisions and how much authority do they have? What other individuals have input when it comes to ...? ______________________________________________________________________________ Proportions/Means: Columns Tested (10% risk level) - A/B/C - D/E - F/G/H - I/J/K * small base; ** very small base (under 30) ineligible for sig testing
Company Size Decision Maker Awareness Occupation
Total 2 to 49 50 to 499 500 + Primary Decision Maker
Influencer Low Medium High Manufacturing
Retail trade Finance/Insurance
A B C D E F G H I J K
Base: Medical benefits - Have some influence in the decision-making process OR Do not play a role in this decision
649 163 248 238 0 649 414 192 43 137 159 129
Weighted 643 254* 216* 172* -** 643 423 195* 25** 27 74 29
Medical benefits
Sole/Primary decision maker: Owner 193 107 69 16 0 193 113 72 8 8 23 6 30.0% 42.3% 32.0% 9.4% - 30.0% 26.6% 37.1% 32.4% 28.5% 31.4% 20.2% C C K
Sole/Primary decision maker: CEO or President
191 79 73 40 0 191 112 64 16 8 18 12
29.8% 31.0% 33.6% 23.1% - 29.8% 26.5% 32.8% 61.7% 28.5% 24.5% 40.3% IJ
Secondary decision maker: Head of HR 106 23 51 32 0 106 66 31 9 6 9 4 16.5% 9.0% 23.5% 18.8% - 16.5% 15.6% 16.0% 35.7% 21.2% 12.6% 14.7% A J
Secondary decision maker: Other 91 27 34 31 0 91 69 22 1 3 11 4 14.2% 10.5% 15.5% 18.0% - 14.2% 16.2% 11.2% 3.5% 12.4% 15.1% 14.7%
Secondary decision maker: HR : VP of Compensation or Benefits Director/Manager
90 11 48 31 0 90 51 36 2 4 11 4
14.0% 4.2% 22.3% 18.0% - 14.0% 12.2% 18.7% 7.6% 13.9% 14.5% 14.7% A A
Secondary decision maker: CEO or President
78 35 26 18 0 78 40 34 4 4 10 2
12.2% 13.6% 11.8% 10.5% - 12.2% 9.5% 17.5% 15.9% 14.6% 13.2% 8.5%
Sole/Primary decision maker: HR : VP of Compensation or Benefits Director/Manager
72 9 30 33 0 72 37 31 3 5 9 5
11.2% 3.6% 14.0% 19.0% - 11.2% 8.8% 16.2% 12.7% 19.7% 12.6% 16.3% A A J
Sole/Primary decision maker: Head of HR 69 7 39 24 0 69 31 35 3 5 11 7 10.7% 2.6% 17.8% 13.8% - 10.7% 7.3% 18.0% 13.3% 20.4% 15.1% 23.3% A A F J
Secondary decision maker: Owner 62 23 29 9 0 62 27 34 1 4 8 1 9.6% 9.2% 13.6% 5.3% - 9.6% 6.5% 17.4% 2.8% 13.1% 11.3% 4.7% F K K
Secondary decision maker: CFO 58 7 31 19 0 58 27 29 1 4 7 2 9.0% 2.8% 14.4% 11.3% - 9.0% 6.4% 15.0% 5.9% 13.1% 9.4% 7.8% A A F
Sole/Primary decision maker: CFO 53 11 30 11 0 53 18 30 5 5 9 3 8.2% 4.5% 13.8% 6.6% - 8.2% 4.3% 15.3% 19.1% 19.0% 11.9% 10.1% A F JK
Sole/Primary decision maker: Other (Please describe)
33 11 9 13 0 33 24 9 1 1 5 1
5.2% 4.5% 4.2% 7.5% - 5.2% 5.6% 4.4% 3.7% 3.6% 6.9% 4.7%
Secondary decision maker: Head of Procurement
33 9 13 11 0 33 16 16 0 1 2 1
5.1% 3.4% 6.0% 6.3% - 5.1% 3.8% 8.3% 0.8% 5.1% 2.5% 4.7%

15
Q24_01. [Medical benefits] For the benefits over which you do not have sole decision making authority, what other individuals have input into these decisions and how much authority do they have? What other individuals have input when it comes to ...? ______________________________________________________________________________ Proportions/Means: Columns Tested (10% risk level) - A/B/C - D/E - F/G/H - I/J/K * small base; ** very small base (under 30) ineligible for sig testing
Company Size Decision Maker Awareness Occupation
Total 2 to 49 50 to 499 500 + Primary Decision Maker
Influencer Low Medium High Manufacturing
Retail trade Finance/Insurance
A B C D E F G H I J K
Sole/Primary decision maker: Head of Procurement
14 3 6 4 0 14 4 9 0 1 4 1
2.1% 1.2% 2.9% 2.5% - 2.1% 0.9% 4.8% 1.8% 4.4% 5.7% 2.3%

16
Q24_02. [Other health and welfare benefits] For the benefits over which you do not have sole decision making authority, what other individuals have input into these decisions and how much authority do they have? What other individuals have input when it comes to ...? ______________________________________________________________________________ Proportions/Means: Columns Tested (10% risk level) - A/B/C - D/E - F/G/H - I/J/K * small base; ** very small base (under 30) ineligible for sig testing
Company Size Decision Maker Awareness Occupation
Total 2 to 49 50 to 499 500 + Primary Decision Maker
Influencer Low Medium High Manufacturing
Retail trade Finance/Insurance
A B C D E F G H I J K
Base: Other health and welfare benefits - Have some influence in the decision-making process OR Do not play a role in this decision
642 160 252 230 41 601 405 194 43 137 154 129
Weighted 652 248* 235* 168* 54** 597 428 205* 18** 27 72 29
Other health and welfare benefits
Sole/Primary decision maker: CEO or President
194 75 81 38 16 178 128 55 11 10 17 11
29.8% 30.4% 34.4% 22.3% 28.7% 29.8% 29.8% 26.9% 61.0% 38.0% 23.4% 36.4% J J
Sole/Primary decision maker: Owner 177 94 62 22 11 167 111 65 1 8 21 6 27.2% 37.8% 26.4% 13.0% 19.7% 27.9% 25.8% 31.8% 8.0% 31.4% 28.6% 19.4% C C K K
Secondary decision maker: CEO or President
112 57 31 25 4 108 55 53 4 4 9 3
17.2% 22.9% 13.0% 14.7% 8.1% 18.0% 12.9% 25.8% 21.8% 13.1% 13.0% 10.1% F
Secondary decision maker: Head of HR 103 21 52 30 6 97 60 39 4 6 8 4 15.8% 8.4% 22.2% 17.8% 10.6% 16.3% 13.9% 19.0% 24.1% 21.9% 11.0% 15.5% A J
Secondary decision maker: Other 92 18 32 42 1 91 70 21 1 3 13 4 14.2% 7.2% 13.7% 25.0% 2.2% 15.3% 16.4% 10.4% 4.9% 10.9% 18.2% 13.2% A I
Secondary decision maker: HR : VP of Compensation or Benefits Director/Manager
82 18 42 22 3 80 50 28 4 3 10 4
12.6% 7.3% 18.0% 12.9% 4.9% 13.3% 11.6% 13.7% 24.2% 10.9% 14.3% 14.0% A
Sole/Primary decision maker: Head of HR 73 10 36 28 1 72 34 36 3 7 8 8 11.3% 3.8% 15.2% 16.7% 2.7% 12.0% 7.9% 17.6% 18.4% 27.0% 11.0% 26.4% A A F J J
Sole/Primary decision maker: CFO 71 8 39 23 9 62 29 41 1 4 9 4 10.8% 3.4% 16.8% 13.5% 16.6% 10.3% 6.7% 20.0% 4.6% 15.3% 13.0% 13.2% A A F
Secondary decision maker: Owner 69 20 39 10 4 65 30 38 1 3 8 1 10.6% 8.2% 16.8% 5.7% 7.2% 10.9% 7.0% 18.4% 8.0% 10.9% 11.0% 3.9% C F K K
Sole/Primary decision maker: HR : VP of Compensation or Benefits Director/Manager
59 6 31 22 7 52 26 31 2 4 8 5
9.0% 2.5% 13.0% 12.9% 12.4% 8.7% 6.0% 15.2% 9.2% 16.8% 11.7% 18.6% A A F J
Secondary decision maker: CFO 46 7 25 13 3 43 25 20 1 3 4 2 7.0% 3.0% 10.8% 7.8% 5.4% 7.2% 5.7% 10.0% 5.1% 11.7% 5.8% 7.0% A J
Secondary decision maker: Head of Procurement
33 3 26 3 3 30 11 22 0 1 1 2
5.0% 1.3% 11.0% 2.0% 4.9% 5.0% 2.5% 10.5% 1.1% 4.4% 1.3% 5.4% AC F J J
Sole/Primary decision maker: Other (Please describe)
32 13 6 12 0 32 23 9 0 1 5 1
4.9% 5.3% 2.7% 7.4% 0.5% 5.3% 5.4% 4.2% 2.6% 2.9% 6.5% 3.9%

17
Q24_02. [Other health and welfare benefits] For the benefits over which you do not have sole decision making authority, what other individuals have input into these decisions and how much authority do they have? What other individuals have input when it comes to ...? ______________________________________________________________________________ Proportions/Means: Columns Tested (10% risk level) - A/B/C - D/E - F/G/H - I/J/K * small base; ** very small base (under 30) ineligible for sig testing
Company Size Decision Maker Awareness Occupation
Total 2 to 49 50 to 499 500 + Primary Decision Maker
Influencer Low Medium High Manufacturing
Retail trade Finance/Insurance
A B C D E F G H I J K
Sole/Primary decision maker: Head of Procurement
26 5 13 7 4 22 12 13 0 1 4 1
4.0% 2.2% 5.5% 4.4% 7.7% 3.6% 2.8% 6.5% 2.6% 4.4% 5.8% 2.3%

18
Q24_03. [Wellness programs] For the benefits over which you do not have sole decision making authority, what other individuals have input into these decisions and how much authority do they have? What other individuals have input when it comes to ...? ______________________________________________________________________________ Proportions/Means: Columns Tested (10% risk level) - A/B/C - D/E - F/G/H - I/J/K * small base; ** very small base (under 30) ineligible for sig testing
Company Size Decision Maker Awareness Occupation
Total 2 to 49 50 to 499 500 + Primary Decision Maker
Influencer Low Medium High Manufacturing
Retail trade Finance/Insurance
A B C D E F G H I J K
Base: Wellness programs - Have some influence in the decision-making process OR Do not play a role in this decision
667 170 254 243 74 593 421 203 43 142 159 135
Weighted 685 267* 238* 180* 92** 593 442 219* 24** 28 74 30
Wellness programs
Sole/Primary decision maker: CEO or President
200 78 86 37 31 170 125 66 10 7 14 11
29.3% 29.2% 36.2% 20.3% 33.7% 28.6% 28.2% 30.2% 41.2% 26.8% 18.2% 37.0%
C J IJ
Sole/Primary decision maker: Owner 175 110 48 17 16 159 106 68 1 7 21 6 25.5% 41.0% 20.4% 9.2% 17.2% 26.8% 23.9% 31.2% 2.8% 25.4% 28.3% 20.7% BC C
Secondary decision maker: Other 128 33 49 46 18 110 97 29 2 4 14 4 18.7% 12.4% 20.4% 25.6% 19.8% 18.5% 21.9% 13.3% 8.5% 14.8% 19.5% 13.3% A
Sole/Primary decision maker: Head of HR 88 9 44 34 13 75 45 41 2 7 11 8 12.8% 3.5% 18.5% 19.1% 14.0% 12.6% 10.1% 18.7% 9.3% 24.6% 14.5% 25.2% A A J J
Secondary decision maker: HR : VP of Compensation or Benefits Director/Manager
88 13 40 34 8 80 40 42 5 4 12 5
12.8% 4.9% 17.0% 19.0% 8.4% 13.5% 9.1% 19.4% 21.1% 12.7% 16.4% 17.8% A A F
Sole/Primary decision maker: HR : VP of Compensation or Benefits Director/Manager
86 6 44 36 11 75 35 49 2 5 12 5
12.5% 2.3% 18.3% 20.2% 11.7% 12.7% 8.0% 22.3% 7.6% 17.6% 15.7% 17.8% A A F
Secondary decision maker: Head of HR 81 16 39 25 10 70 50 23 7 6 9 4 11.8% 6.0% 16.5% 14.2% 11.3% 11.9% 11.3% 10.7% 30.4% 20.4% 12.6% 14.8% A J
Secondary decision maker: CEO or President
71 40 21 9 6 65 40 27 4 4 8 2
10.4% 15.1% 9.0% 5.2% 6.8% 10.9% 9.0% 12.4% 17.5% 12.7% 10.7% 8.1% C
Secondary decision maker: Owner 68 20 36 13 0 68 30 36 1 3 8 1 9.9% 7.4% 15.0% 7.0% 0.2% 11.4% 6.9% 16.5% 5.9% 10.6% 10.7% 3.7% F K K
Sole/Primary decision maker: CFO 58 11 27 20 4 54 20 37 1 4 8 4 8.5% 4.2% 11.5% 10.9% 4.2% 9.2% 4.5% 17.0% 5.5% 14.1% 11.3% 11.9% F
Secondary decision maker: CFO 46 4 21 20 4 42 17 28 1 3 4 2 6.6% 1.5% 8.9% 11.3% 4.1% 7.0% 3.9% 12.7% 2.7% 11.3% 5.0% 7.4% A A F J
Secondary decision maker: Head of Procurement
33 9 16 8 3 29 12 21 0 1 1 2
4.8% 3.2% 6.8% 4.5% 3.7% 5.0% 2.7% 9.4% 1.8% 3.5% 1.9% 5.9% F J
Sole/Primary decision maker: Other (Please describe)
32 10 12 10 1 31 20 11 0 1 6 1
4.6% 3.7% 4.9% 5.7% 0.7% 5.2% 4.5% 5.2% 2.0% 3.5% 7.5% 3.0%

19
Q24_03. [Wellness programs] For the benefits over which you do not have sole decision making authority, what other individuals have input into these decisions and how much authority do they have? What other individuals have input when it comes to ...? ______________________________________________________________________________ Proportions/Means: Columns Tested (10% risk level) - A/B/C - D/E - F/G/H - I/J/K * small base; ** very small base (under 30) ineligible for sig testing
Company Size Decision Maker Awareness Occupation
Total 2 to 49 50 to 499 500 + Primary Decision Maker
Influencer Low Medium High Manufacturing
Retail trade Finance/Insurance
A B C D E F G H I J K
Sole/Primary decision maker: Head of Procurement
24 2 14 8 1 23 3 21 0 1 3 1
3.5% 0.8% 6.0% 4.3% 0.7% 4.0% 0.6% 9.8% 0.8% 4.9% 3.8% 3.0% F

20
Q24_04. [Non-health benefit] For the benefits over which you do not have sole decision making authority, what other individuals have input into these decisions and how much authority do they have? What other individuals have input when it comes to ...? ______________________________________________________________________________ Proportions/Means: Columns Tested (10% risk level) - A/B/C - D/E - F/G/H - I/J/K * small base; ** very small base (under 30) ineligible for sig testing
Company Size Decision Maker Awareness Occupation
Total 2 to 49 50 to 499 500 + Primary Decision Maker
Influencer Low Medium High Manufacturing
Retail trade Finance/Insurance
A B C D E F G H I J K
Base: Non-health benefit - Have some influence in the decision-making process OR Do not play a role in this decision
670 174 254 242 88 582 413 205 52 144 164 132
Weighted 656 262* 226* 169* 80** 576 429 201* 26** 28 77 30
Non-health benefit
Sole/Primary decision maker: Owner 185 100 66 19 7 178 114 65 5 7 24 6 28.2% 38.1% 29.3% 11.3% 8.8% 30.9% 26.6% 32.5% 20.2% 26.4% 31.1% 19.7% C C K
Sole/Primary decision maker: CEO or President
179 71 69 39 19 160 105 58 16 9 20 12
27.2% 27.0% 30.4% 23.4% 23.3% 27.8% 24.4% 28.9% 62.3% 32.6% 26.2% 40.2% J
Secondary decision maker: Head of HR 97 10 57 30 7 90 54 40 3 6 9 5 14.8% 3.8% 25.1% 18.1% 8.5% 15.7% 12.5% 19.8% 12.7% 21.5% 12.2% 15.9% A A J
Secondary decision maker: HR : VP of Compensation or Benefits Director/Manager
97 17 41 39 3 94 53 38 6 3 11 4
14.7% 6.3% 18.2% 23.2% 3.8% 16.3% 12.2% 19.0% 23.6% 11.1% 14.6% 14.4% A A
Secondary decision maker: Other 96 32 33 30 13 82 73 19 4 2 13 5 14.6% 12.4% 14.7% 17.9% 16.6% 14.3% 17.1% 9.2% 15.9% 6.3% 16.5% 17.4% I I
Secondary decision maker: CEO or President
79 35 22 22 10 69 50 26 4 4 11 2
12.1% 13.5% 9.6% 13.1% 12.2% 12.1% 11.6% 12.7% 15.5% 14.6% 14.6% 7.6% K K
Sole/Primary decision maker: HR : VP of Compensation or Benefits Director/Manager
74 15 25 35 20 54 34 38 2 5 8 4
11.3% 5.6% 11.0% 20.8% 25.3% 9.4% 7.9% 18.8% 9.7% 18.8% 11.0% 15.2% A F J
Sole/Primary decision maker: Head of HR 62 2 37 22 3 59 22 37 2 6 9 7 9.4% 0.9% 16.5% 13.2% 3.3% 10.3% 5.2% 18.4% 8.7% 22.9% 11.6% 23.5% A A F J J
Sole/Primary decision maker: CFO 61 9 32 21 2 59 18 41 2 5 8 4 9.3% 3.3% 14.0% 12.5% 2.4% 10.3% 4.2% 20.5% 7.6% 17.4% 11.0% 13.6% A A F J
Secondary decision maker: Owner 60 20 29 10 9 51 28 30 2 3 9 1 9.1% 7.7% 13.0% 6.1% 11.2% 8.8% 6.5% 14.8% 8.0% 11.1% 12.2% 3.8% F K K
Secondary decision maker: CFO 48 4 32 12 3 45 19 27 2 4 5 2 7.4% 1.7% 14.1% 7.3% 4.0% 7.8% 4.5% 13.3% 9.7% 13.9% 6.7% 8.3% A F J
Sole/Primary decision maker: Other (Please describe)
41 9 19 13 1 39 33 6 1 1 6 1
6.2% 3.4% 8.4% 7.5% 1.4% 6.8% 7.7% 3.0% 5.5% 4.2% 7.3% 3.8%
Secondary decision maker: Head of Procurement
37 8 16 12 7 31 24 13 0 1 3 1
5.7% 3.2% 7.2% 7.4% 8.3% 5.3% 5.6% 6.3% 1.6% 4.2% 4.3% 4.5%

21
Q24_04. [Non-health benefit] For the benefits over which you do not have sole decision making authority, what other individuals have input into these decisions and how much authority do they have? What other individuals have input when it comes to ...? ______________________________________________________________________________ Proportions/Means: Columns Tested (10% risk level) - A/B/C - D/E - F/G/H - I/J/K * small base; ** very small base (under 30) ineligible for sig testing
Company Size Decision Maker Awareness Occupation
Total 2 to 49 50 to 499 500 + Primary Decision Maker
Influencer Low Medium High Manufacturing
Retail trade Finance/Insurance
A B C D E F G H I J K
Sole/Primary decision maker: Head of Procurement
19 5 6 7 1 18 4 14 1 1 3 1
2.8% 1.9% 2.8% 4.3% 0.7% 3.1% 0.9% 6.9% 3.1% 2.8% 4.3% 3.8% F
22
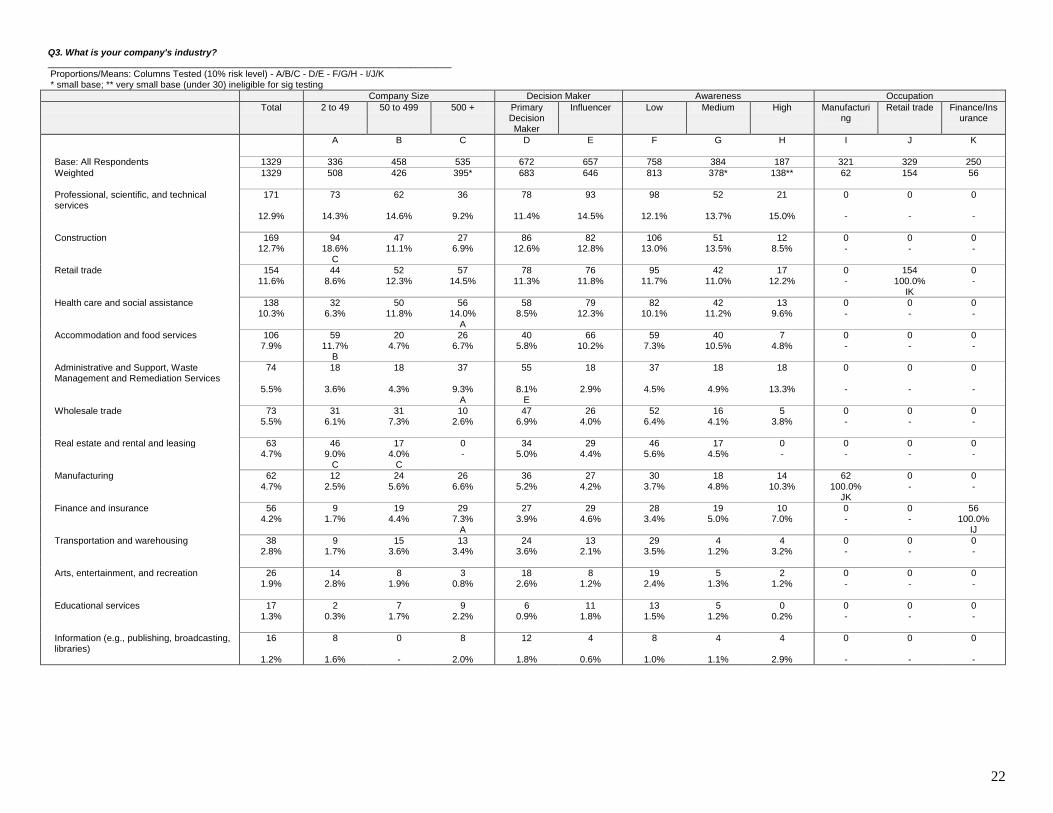
Q3. What is your company's industry? ______________________________________________________________________________ Proportions/Means: Columns Tested (10% risk level) - A/B/C - D/E - F/G/H - I/J/K * small base; ** very small base (under 30) ineligible for sig testing
Company Size Decision Maker Awareness Occupation
Total 2 to 49 50 to 499 500 + Primary Decision Maker
Influencer Low Medium High Manufacturing
Retail trade Finance/Insurance
A B C D E F G H I J K
Base: All Respondents 1329 336 458 535 672 657 758 384 187 321 329 250
Weighted 1329 508 426 395* 683 646 813 378* 138** 62 154 56
Professional, scientific, and technical services
171 73 62 36 78 93 98 52 21 0 0 0
12.9% 14.3% 14.6% 9.2% 11.4% 14.5% 12.1% 13.7% 15.0% - - -
Construction 169 94 47 27 86 82 106 51 12 0 0 0 12.7% 18.6% 11.1% 6.9% 12.6% 12.8% 13.0% 13.5% 8.5% - - - C
Retail trade 154 44 52 57 78 76 95 42 17 0 154 0 11.6% 8.6% 12.3% 14.5% 11.3% 11.8% 11.7% 11.0% 12.2% - 100.0% - IK
Health care and social assistance 138 32 50 56 58 79 82 42 13 0 0 0 10.3% 6.3% 11.8% 14.0% 8.5% 12.3% 10.1% 11.2% 9.6% - - - A
Accommodation and food services 106 59 20 26 40 66 59 40 7 0 0 0 7.9% 11.7% 4.7% 6.7% 5.8% 10.2% 7.3% 10.5% 4.8% - - - B
Administrative and Support, Waste Management and Remediation Services
74 18 18 37 55 18 37 18 18 0 0 0
5.5% 3.6% 4.3% 9.3% 8.1% 2.9% 4.5% 4.9% 13.3% - - - A E
Wholesale trade 73 31 31 10 47 26 52 16 5 0 0 0 5.5% 6.1% 7.3% 2.6% 6.9% 4.0% 6.4% 4.1% 3.8% - - -
Real estate and rental and leasing 63 46 17 0 34 29 46 17 0 0 0 0 4.7% 9.0% 4.0% - 5.0% 4.4% 5.6% 4.5% - - - - C C
Manufacturing 62 12 24 26 36 27 30 18 14 62 0 0 4.7% 2.5% 5.6% 6.6% 5.2% 4.2% 3.7% 4.8% 10.3% 100.0% - - JK
Finance and insurance 56 9 19 29 27 29 28 19 10 0 0 56 4.2% 1.7% 4.4% 7.3% 3.9% 4.6% 3.4% 5.0% 7.0% - - 100.0% A IJ
Transportation and warehousing 38 9 15 13 24 13 29 4 4 0 0 0 2.8% 1.7% 3.6% 3.4% 3.6% 2.1% 3.5% 1.2% 3.2% - - -
Arts, entertainment, and recreation 26 14 8 3 18 8 19 5 2 0 0 0 1.9% 2.8% 1.9% 0.8% 2.6% 1.2% 2.4% 1.3% 1.2% - - -
Educational services 17 2 7 9 6 11 13 5 0 0 0 0 1.3% 0.3% 1.7% 2.2% 0.9% 1.8% 1.5% 1.2% 0.2% - - -
Information (e.g., publishing, broadcasting, libraries)
16 8 0 8 12 4 8 4 4 0 0 0
1.2% 1.6% - 2.0% 1.8% 0.6% 1.0% 1.1% 2.9% - - -
23
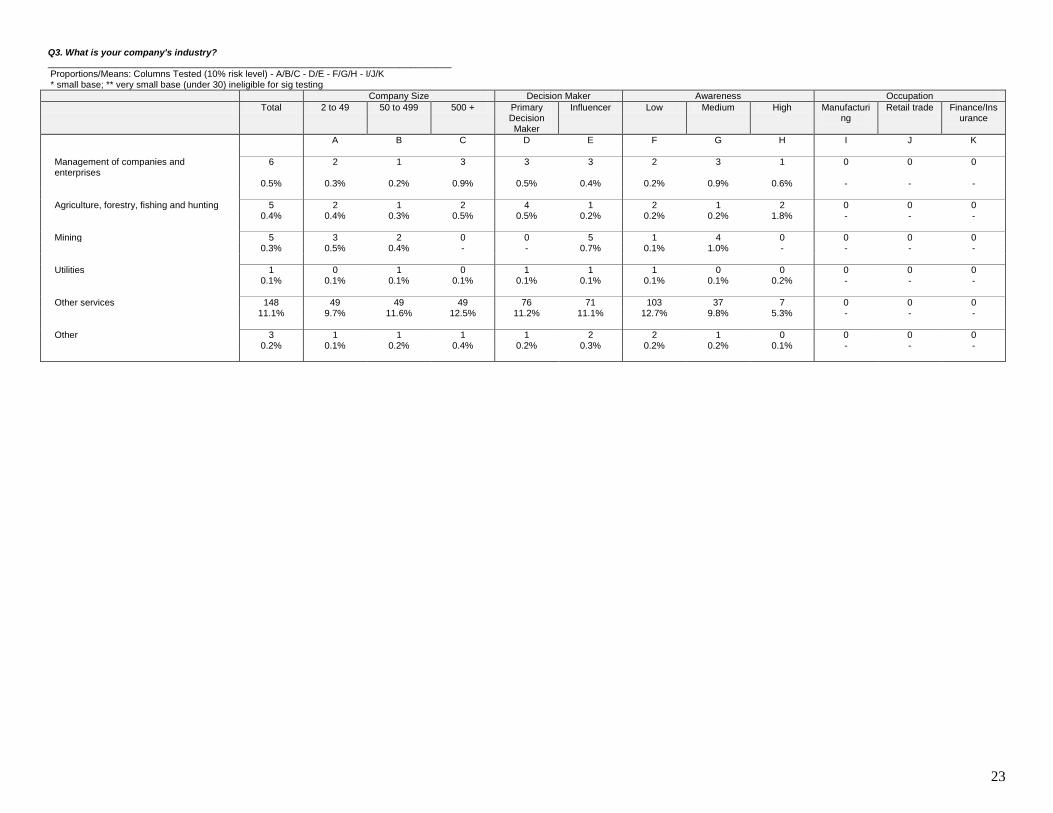
Q3. What is your company's industry? ______________________________________________________________________________ Proportions/Means: Columns Tested (10% risk level) - A/B/C - D/E - F/G/H - I/J/K * small base; ** very small base (under 30) ineligible for sig testing
Company Size Decision Maker Awareness Occupation
Total 2 to 49 50 to 499 500 + Primary Decision Maker
Influencer Low Medium High Manufacturing
Retail trade Finance/Insurance
A B C D E F G H I J K
Management of companies and enterprises
6 2 1 3 3 3 2 3 1 0 0 0
0.5% 0.3% 0.2% 0.9% 0.5% 0.4% 0.2% 0.9% 0.6% - - -
Agriculture, forestry, fishing and hunting 5 2 1 2 4 1 2 1 2 0 0 0 0.4% 0.4% 0.3% 0.5% 0.5% 0.2% 0.2% 0.2% 1.8% - - -
Mining 5 3 2 0 0 5 1 4 0 0 0 0 0.3% 0.5% 0.4% - - 0.7% 0.1% 1.0% - - - -
Utilities 1 0 1 0 1 1 1 0 0 0 0 0 0.1% 0.1% 0.1% 0.1% 0.1% 0.1% 0.1% 0.1% 0.2% - - -
Other services 148 49 49 49 76 71 103 37 7 0 0 0 11.1% 9.7% 11.6% 12.5% 11.2% 11.1% 12.7% 9.8% 5.3% - - -
Other 3 1 1 1 1 2 2 1 0 0 0 0 0.2% 0.1% 0.2% 0.4% 0.2% 0.3% 0.2% 0.2% 0.1% - - -

24
Q4. How many U.S.-based employees does your company have? ______________________________________________________________________________ Proportions/Means: Columns Tested (10% risk level) - A/B/C - D/E - F/G/H - I/J/K * small base; ** very small base (under 30) ineligible for sig testing
Company Size Decision Maker Awareness Occupation
Total 2 to 49 50 to 499 500 + Primary Decision Maker
Influencer Low Medium High Manufacturing
Retail trade Finance/Insurance
A B C D E F G H I J K
Base: All Respondents 1329 336 458 535 672 657 758 384 187 321 329 250
Weighted 1329 508 426 395* 683 646 813 378* 138** 62 154 56
2-4 154 154 0 0 75 79 124 26 4 2 14 2 11.6% 30.4% - - 10.9% 12.3% 15.3% 6.8% 3.2% 2.8% 9.1% 4.4% BC G IK
5-9 78 78 0 0 50 28 57 13 8 2 8 1 5.9% 15.3% - - 7.3% 4.3% 7.0% 3.5% 5.5% 2.8% 5.2% 2.0% BC K
10-19 53 53 0 0 29 23 39 10 4 3 5 1 4.0% 10.4% - - 4.3% 3.6% 4.8% 2.6% 2.9% 4.0% 3.0% 2.4% BC
20-49 223 223 0 0 99 124 130 67 26 6 17 4 16.8% 43.9% - - 14.4% 19.3% 16.1% 17.6% 18.9% 10.3% 11.2% 6.4% BC K K
50-99 190 0 190 0 101 89 92 91 7 9 25 6 14.3% - 44.6% - 14.8% 13.8% 11.3% 24.1% 5.3% 13.7% 16.1% 11.2% AC F
100-499 236 0 236 0 107 129 123 79 34 15 28 12 17.7% - 55.4% - 15.6% 20.0% 15.1% 20.9% 24.4% 24.3% 17.9% 22.0% AC J
500-999 159 0 0 159 85 74 80 44 35 11 13 9 12.0% - - 40.2% 12.4% 11.5% 9.8% 11.7% 25.1% 18.4% 8.2% 16.0% AB J J
1000-4999 103 0 0 103 58 46 83 17 3 7 9 5 7.8% - - 26.1% 8.4% 7.1% 10.2% 4.5% 2.4% 11.8% 6.1% 9.6% AB G J
5000-10,000 45 0 0 45 27 18 32 10 3 3 6 4 3.4% - - 11.4% 4.0% 2.8% 3.9% 2.7% 2.2% 5.3% 3.6% 6.4% AB
10,000-25,000 33 0 0 33 17 16 18 7 7 1 7 2 2.5% - - 8.3% 2.4% 2.5% 2.2% 1.9% 5.4% 1.6% 4.3% 4.4% AB I I
25,000-50,000 19 0 0 19 12 7 5 8 5 2 3 2 1.4% - - 4.7% 1.7% 1.1% 0.6% 2.2% 4.0% 2.5% 2.1% 3.2% AB
50,000+ 36 0 0 36 25 11 29 6 1 2 20 7 2.7% - - 9.2% 3.7% 1.8% 3.6% 1.6% 0.8% 2.5% 13.1% 12.0% AB I I
Summary
1000 or more 236 0 0 236 138 98 167 49 20 15 45 20 17.8% - - 59.8% 20.2% 15.2% 20.6% 12.9% 14.8% 23.7% 29.2% 35.6% AB IJ

25
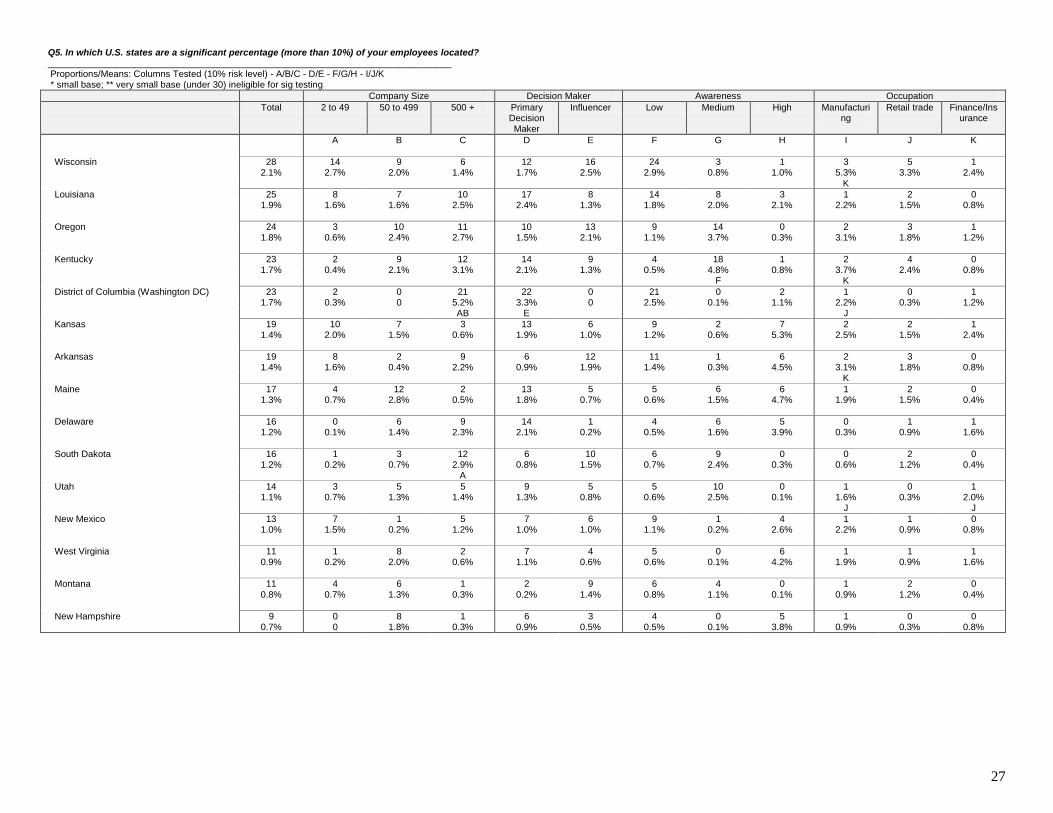
Q5. In which U.S. states are a significant percentage (more than 10%) of your employees located? ______________________________________________________________________________ Proportions/Means: Columns Tested (10% risk level) - A/B/C - D/E - F/G/H - I/J/K * small base; ** very small base (under 30) ineligible for sig testing
Company Size Decision Maker Awareness Occupation
Total 2 to 49 50 to 499 500 + Primary Decision Maker
Influencer Low Medium High Manufacturing
Retail trade Finance/Insurance
A B C D E F G H I J K
Base: All Respondents 1329 336 458 535 672 657 758 384 187 321 329 250
Weighted 1329 508 426 395* 683 646 813 378* 138** 62 154 56
California 211 61 73 77 117 94 98 69 44 11 19 8 15.9% 12.0% 17.2% 19.4% 17.1% 14.5% 12.0% 18.1% 32.1% 17.1% 12.5% 14.0% J
Texas 124 29 43 51 76 48 76 28 19 8 9 5 9.3% 5.7% 10.2% 12.9% 11.1% 7.4% 9.4% 7.5% 14.0% 13.1% 6.1% 8.8% A J
New York 120 32 40 48 64 56 52 44 24 10 16 9 9.0% 6.3% 9.3% 12.2% 9.3% 8.7% 6.4% 11.7% 17.2% 15.6% 10.3% 16.4% J J
Florida 105 35 30 40 40 65 44 44 17 7 14 4 7.9% 6.9% 7.1% 10.1% 5.9% 10.1% 5.5% 11.6% 12.5% 10.6% 9.1% 8.0% F
Illinois 88 24 25 39 46 42 41 29 18 5 11 4 6.6% 4.7% 5.8% 9.8% 6.7% 6.5% 5.0% 7.7% 12.7% 8.7% 7.3% 6.8%
Pennsylvania 78 26 23 28 43 35 44 21 13 3 8 5 5.9% 5.2% 5.4% 7.2% 6.2% 5.5% 5.4% 5.5% 9.3% 5.3% 5.2% 9.2% IJ
Ohio 68 20 10 38 44 24 32 28 8 6 9 2 5.1% 3.9% 2.4% 9.7% 6.5% 3.7% 4.0% 7.3% 5.5% 9.3% 6.1% 4.0% AB K
Georgia 58 11 23 24 32 26 31 22 4 2 7 2 4.3% 2.1% 5.3% 6.1% 4.7% 4.0% 3.8% 5.8% 3.2% 3.4% 4.3% 3.6%
Arizona 56 22 4 31 26 30 32 10 14 2 2 2 4.2% 4.3% 0.9% 7.8% 3.8% 4.7% 3.9% 2.7% 10.3% 2.5% 1.5% 2.8% B
We are a national employer with employees in most states
55 11 7 37 33 21 39 12 3 2 23 4
4.1% 2.1% 1.6% 9.4% 4.9% 3.3% 4.8% 3.3% 2.5% 2.8% 15.2% 8.0% AB IK I
Michigan 51 17 16 18 22 29 41 8 2 4 6 2 3.9% 3.3% 3.8% 4.7% 3.2% 4.5% 5.1% 2.2% 1.4% 5.6% 3.6% 2.8%

26
Q5. In which U.S. states are a significant percentage (more than 10%) of your employees located? ______________________________________________________________________________ Proportions/Means: Columns Tested (10% risk level) - A/B/C - D/E - F/G/H - I/J/K * small base; ** very small base (under 30) ineligible for sig testing
Company Size Decision Maker Awareness Occupation
Total 2 to 49 50 to 499 500 + Primary Decision Maker
Influencer Low Medium High Manufacturing
Retail trade Finance/Insurance
A B C D E F G H I J K
Colorado 51 27 3 20 15 36 34 15 2 3 3 1 3.8% 5.4% 0.8% 5.0% 2.2% 5.5% 4.2% 3.9% 1.6% 4.0% 2.1% 2.0% B B
Massachusetts 50 11 23 17 29 21 17 22 11 2 3 3 3.8% 2.1% 5.3% 4.3% 4.2% 3.3% 2.1% 5.9% 7.8% 3.7% 1.8% 5.2% F J
Missouri 48 26 16 6 13 35 27 10 11 2 3 1 3.6% 5.2% 3.8% 1.5% 2.0% 5.4% 3.3% 2.8% 8.0% 3.7% 2.1% 2.4% D
North Carolina 46 21 17 8 31 15 21 18 6 4 5 2 3.5% 4.1% 4.0% 2.0% 4.5% 2.4% 2.6% 4.9% 4.4% 5.9% 3.3% 4.4% J
Maryland 45 10 15 20 34 11 16 23 6 2 4 2 3.4% 1.9% 3.6% 5.1% 5.0% 1.7% 2.0% 6.0% 4.7% 2.5% 2.4% 3.2% F
Virginia 42 18 9 15 25 17 17 18 7 2 4 3 3.2% 3.6% 2.1% 3.9% 3.6% 2.7% 2.1% 4.8% 5.0% 2.5% 2.7% 4.8%
Alabama 42 7 28 7 29 13 16 25 0 2 1 0 3.1% 1.4% 6.5% 1.7% 4.3% 2.0% 2.0% 6.7% 0.2% 3.1% 0.9% 0.8% AC F JK
Tennessee 35 6 12 18 7 28 17 16 2 2 5 1 2.6% 1.1% 2.7% 4.5% 1.1% 4.3% 2.1% 4.3% 1.2% 3.4% 3.0% 2.4% D
New Jersey 35 10 13 12 20 15 24 5 5 4 10 4 2.6% 2.0% 3.0% 3.1% 2.9% 2.3% 3.0% 1.4% 3.9% 6.9% 6.7% 6.4%
Washington 35 11 18 6 16 19 30 2 3 3 6 1 2.6% 2.1% 4.3% 1.4% 2.3% 3.0% 3.7% 0.7% 1.9% 5.0% 4.0% 2.0% K
Connecticut 34 4 13 18 10 24 22 6 6 1 5 2 2.6% 0.7% 3.0% 4.5% 1.5% 3.7% 2.8% 1.6% 4.1% 1.9% 3.0% 2.8% A
Indiana 32 12 8 12 4 27 22 9 1 1 4 1 2.4% 2.3% 1.9% 3.0% 0.6% 4.2% 2.7% 2.4% 0.5% 1.9% 2.7% 2.0% D
Minnesota 31 10 14 8 18 13 15 16 1 4 4 2 2.4% 1.9% 3.2% 2.1% 2.7% 2.0% 1.8% 4.1% 0.8% 6.2% 2.7% 3.6% J
Oklahoma 28 7 6 16 15 13 11 6 11 1 1 1 2.1% 1.3% 1.4% 3.9% 2.2% 2.1% 1.4% 1.6% 8.0% 1.6% 0.6% 1.6%
South Carolina 28 11 8 9 19 9 10 11 7 2 3 1 2.1% 2.2% 1.8% 2.4% 2.8% 1.5% 1.2% 3.0% 5.2% 3.7% 2.1% 2.0%
27
Q5. In which U.S. states are a significant percentage (more than 10%) of your employees located? ______________________________________________________________________________ Proportions/Means: Columns Tested (10% risk level) - A/B/C - D/E - F/G/H - I/J/K * small base; ** very small base (under 30) ineligible for sig testing
Company Size Decision Maker Awareness Occupation
Total 2 to 49 50 to 499 500 + Primary Decision Maker
Influencer Low Medium High Manufacturing
Retail trade Finance/Insurance
A B C D E F G H I J K
Wisconsin 28 14 9 6 12 16 24 3 1 3 5 1 2.1% 2.7% 2.0% 1.4% 1.7% 2.5% 2.9% 0.8% 1.0% 5.3% 3.3% 2.4% K
Louisiana 25 8 7 10 17 8 14 8 3 1 2 0 1.9% 1.6% 1.6% 2.5% 2.4% 1.3% 1.8% 2.0% 2.1% 2.2% 1.5% 0.8%
Oregon 24 3 10 11 10 13 9 14 0 2 3 1 1.8% 0.6% 2.4% 2.7% 1.5% 2.1% 1.1% 3.7% 0.3% 3.1% 1.8% 1.2%
Kentucky 23 2 9 12 14 9 4 18 1 2 4 0 1.7% 0.4% 2.1% 3.1% 2.1% 1.3% 0.5% 4.8% 0.8% 3.7% 2.4% 0.8% F K
District of Columbia (Washington DC) 23 2 0 21 22 0 21 0 2 1 0 1 1.7% 0.3% 0 5.2% 3.3% 0 2.5% 0.1% 1.1% 2.2% 0.3% 1.2% AB E J
Kansas 19 10 7 3 13 6 9 2 7 2 2 1 1.4% 2.0% 1.5% 0.6% 1.9% 1.0% 1.2% 0.6% 5.3% 2.5% 1.5% 2.4%
Arkansas 19 8 2 9 6 12 11 1 6 2 3 0 1.4% 1.6% 0.4% 2.2% 0.9% 1.9% 1.4% 0.3% 4.5% 3.1% 1.8% 0.8% K
Maine 17 4 12 2 13 5 5 6 6 1 2 0 1.3% 0.7% 2.8% 0.5% 1.8% 0.7% 0.6% 1.5% 4.7% 1.9% 1.5% 0.4%
Delaware 16 0 6 9 14 1 4 6 5 0 1 1 1.2% 0.1% 1.4% 2.3% 2.1% 0.2% 0.5% 1.6% 3.9% 0.3% 0.9% 1.6%
South Dakota 16 1 3 12 6 10 6 9 0 0 2 0 1.2% 0.2% 0.7% 2.9% 0.8% 1.5% 0.7% 2.4% 0.3% 0.6% 1.2% 0.4% A
Utah 14 3 5 5 9 5 5 10 0 1 0 1 1.1% 0.7% 1.3% 1.4% 1.3% 0.8% 0.6% 2.5% 0.1% 1.6% 0.3% 2.0% J J
New Mexico 13 7 1 5 7 6 9 1 4 1 1 0 1.0% 1.5% 0.2% 1.2% 1.0% 1.0% 1.1% 0.2% 2.6% 2.2% 0.9% 0.8%
West Virginia 11 1 8 2 7 4 5 0 6 1 1 1 0.9% 0.2% 2.0% 0.6% 1.1% 0.6% 0.6% 0.1% 4.2% 1.9% 0.9% 1.6%
Montana 11 4 6 1 2 9 6 4 0 1 2 0 0.8% 0.7% 1.3% 0.3% 0.2% 1.4% 0.8% 1.1% 0.1% 0.9% 1.2% 0.4%
New Hampshire 9 0 8 1 6 3 4 0 5 1 0 0 0.7% 0 1.8% 0.3% 0.9% 0.5% 0.5% 0.1% 3.8% 0.9% 0.3% 0.8%

28
Q5. In which U.S. states are a significant percentage (more than 10%) of your employees located? ______________________________________________________________________________ Proportions/Means: Columns Tested (10% risk level) - A/B/C - D/E - F/G/H - I/J/K * small base; ** very small base (under 30) ineligible for sig testing
Company Size Decision Maker Awareness Occupation
Total 2 to 49 50 to 499 500 + Primary Decision Maker
Influencer Low Medium High Manufacturing
Retail trade Finance/Insurance
A B C D E F G H I J K
Rhode Island 9 7 0 2 2 7 9 0 0 1 1 1 0.7% 1.3% 0.1% 0.5% 0.3% 1.1% 1.1% 0.1% - 1.2% 0.9% 2.0%
Nebraska 8 4 2 2 1 6 2 1 4 0 2 1 0.6% 0.8% 0.4% 0.5% 0.2% 1.0% 0.3% 0.3% 3.2% 0.6% 1.2% 2.0%
Nevada 7 1 0 6 3 4 1 5 1 1 2 1 0.5% 0.3% - 1.5% 0.4% 0.7% 0.2% 1.2% 0.9% 0.9% 1.2% 1.2%
Iowa 7 4 1 2 5 2 2 5 0 1 1 1 0.5% 0.8% 0.2% 0.5% 0.7% 0.3% 0.3% 1.2% 0.1% 1.2% 0.6% 1.6%
Vermont 7 0 5 1 6 0 1 0 5 0 0 0 0.5% 0 1.2% 0.3% 0.9% 0.1% 0.1% 0.1% 3.9% 0.6% 0.3% 0.8%
Idaho 5 0 3 1 4 1 2 3 0 0 2 0 0.4% 0.1% 0.8% 0.3% 0.6% 0.1% 0.2% 0.7% 0.3% 0.6% 1.2% 0.4%
Mississippi 3 1 0 2 1 2 1 2 1 1 0 1 0.3% 0.2% 0 0.5% 0.2% 0.3% 0.2% 0.4% 0.4% 1.9% 0.3% 1.6% J J
Hawaii 2 0 0 2 1 1 2 0 1 0 1 0 0.2% 0 0 0.5% 0.2% 0.1% 0.2% - 0.5% 0.6% 0.9% 0.4%
Alaska 2 1 0 1 1 1 2 0 0 1 1 0 0.2% 0.2% 0 0.3% 0.1% 0.2% 0.2% 0.1% 0.3% 1.2% 0.6% 0.4%
Wyoming 2 1 0 0 0 1 2 0 0 0 1 0 0.1% 0.1% 0.1% 0.1% 0.1% 0.2% 0.2% - - - 0.6% -
North Dakota 1 0 0 1 1 1 1 0 0 0 0 0 0.1% - 0.1% 0.2% 0.1% 0.1% 0.1% 0.1% - 0.6% 0.3% 0.4%

29
Q6. Approximately what percentage of your employees are part-time (i.e., work less than 30 hours per week)? ______________________________________________________________________________ Proportions/Means: Columns Tested (10% risk level) - A/B/C - D/E - F/G/H - I/J/K * small base; ** very small base (under 30) ineligible for sig testing
Company Size Decision Maker Awareness Occupation
Total 2 to 49 50 to 499 500 + Primary Decision Maker
Influencer Low Medium High Manufacturing
Retail trade Finance/Insurance
A B C D E F G H I J K
Base: All Respondents 1329 336 458 535 672 657 758 384 187 321 329 250
Weighted 1329 508 426 395* 683 646 813 378* 138** 62 154 56
0% 250 175 62 12 125 125 166 61 23 13 14 7 18.8% 34.6% 14.7% 2.9% 18.3% 19.3% 20.4% 16.1% 16.4% 21.5% 8.8% 12.8% BC C JK
1% to 25% 492 143 202 148 260 232 262 168 63 28 50 28 37.0% 28.1% 47.4% 37.3% 38.1% 35.9% 32.2% 44.4% 45.6% 44.5% 32.5% 49.2% A F J J
26% to 50% 202 81 65 56 107 94 94 65 42 7 27 6 15.2% 15.9% 15.3% 14.1% 15.7% 14.6% 11.6% 17.2% 30.6% 11.8% 17.6% 10.8% IK
51% to 75% 66 20 14 32 44 22 35 24 7 2 20 1 5.0% 4.0% 3.2% 8.2% 6.4% 3.4% 4.3% 6.2% 5.3% 2.5% 13.1% 2.0% IK
76% to 99% 42 24 5 13 18 24 30 10 1 2 9 1 3.1% 4.7% 1.1% 3.3% 2.6% 3.7% 3.8% 2.7% 0.9% 3.4% 5.8% 2.4% K
100% 43 39 3 0 12 31 39 3 1 0 3 0 3.2% 7.8% 0.7% 0.1% 1.7% 4.8% 4.8% 0.8% 0.4% 0.6% 2.1% 0.8% BC G
I Don't Know 235 25 75 134 117 117 186 48 1 10 31 12 17.7% 5.0% 17.6% 34.0% 17.2% 18.2% 22.9% 12.6% 0.7% 15.6% 20.1% 22.0% A AB G I
Summary
Mean (Incl. 0) 23.7 25.9 17.2 28.6 22.8 24.7 24.7 22.2 23.0 17.3 35.1 18.0 B B IK
Std. Dev. 28.2 34.0 19.9 24.1 26.5 29.9 31.2 24.3 22.0 22.4 28.4 21.9
Std. Err. 0.9 1.9 1.0 1.3 1.1 1.3 1.3 1.3 1.6 1.4 1.8 1.6
Mean (Excl. 0) 30.8 40.7 20.9 29.9 29.3 32.3 33.6 27.3 27.6 23.2 39.4 21.5 BC B IK
Std. Dev. 28.6 34.9 20.1 23.9 26.7 30.4 32.0 24.2 21.3 23.1 27.2 22.4
Std. Err. 1.0 2.4 1.1 1.3 1.3 1.5 1.6 1.5 1.7 1.6 1.8 1.8
Median 9.9 8.3 9.4 19.7 9.9 9.8 8.9 11.7 18.0 9.5 24.8 9.3

30
Q7_1. [Under $15,000] Approximately what percentage of your full-time employees fall into each of the following annual salary/wage bands? ______________________________________________________________________________ Proportions/Means: Columns Tested (10% risk level) - A/B/C - D/E - F/G/H - I/J/K * small base; ** very small base (under 30) ineligible for sig testing
Company Size Decision Maker Awareness Occupation
Total 2 to 49 50 to 499 500 + Primary Decision Maker
Influencer Low Medium High Manufacturing
Retail trade Finance/Insurance
A B C D E F G H I J K
Base: All Respondents 1329 336 458 535 672 657 758 384 187 321 329 250
Weighted 1329 508 426 395* 683 646 813 378* 138** 62 154 56
Under $15,000
0% 520 256 171 93 266 254 300 161 59 28 47 24 39.1% 50.5% 40.2% 23.5% 38.9% 39.4% 36.9% 42.7% 42.9% 45.5% 30.4% 42.0% C C J J
1% to 25% 339 76 130 133 192 147 155 123 61 19 36 13 25.5% 15.0% 30.6% 33.5% 28.1% 22.8% 19.1% 32.4% 44.2% 30.5% 23.7% 23.6% A A F JK
26% to 50% 57 35 12 10 32 25 31 18 8 3 14 2 4.3% 6.9% 2.7% 2.5% 4.7% 3.8% 3.8% 4.6% 5.9% 4.4% 9.1% 3.6% IK
51% to 75% 23 9 8 6 15 8 13 9 1 1 7 1 1.7% 1.7% 2.0% 1.5% 2.2% 1.3% 1.6% 2.3% 0.5% 1.6% 4.6% 1.2% IK
76% to 99% 11 6 5 0 7 4 9 2 0 1 1 0 0.8% 1.1% 1.2% 0.1% 1.0% 0.7% 1.1% 0.5% 0.1% 0.9% 0.9% 0.8%
100% 33 27 0 6 15 18 31 1 0 1 5 0 2.5% 5.2% 0 1.5% 2.2% 2.8% 3.8% 0.4% 0.3% 1.2% 3.3% 0.8% B G K
I Don't Know 346 99 99 148 158 189 273 65 8 10 43 16 26.1% 19.5% 23.3% 37.4% 23.1% 29.2% 33.6% 17.1% 6.0% 15.9% 28.0% 28.0% AB G I I
Summary
Mean (Incl. 0) 12.5 15.2 9.3 12.4 13.2 11.7 14.6 9.7 10.6 10.6 19.6 8.6 B IK
Std. Dev. 23.4 28.7 17.2 20.1 23.3 23.5 27.7 17.4 13.5 19.3 27.9 18.3
Std. Err. 0.7 1.7 0.9 1.1 1.0 1.1 1.3 1.0 1.0 1.2 1.8 1.4
Mean (Excl. 0) 26.6 40.7 19.6 19.8 26.7 26.5 32.8 20.1 19.6 23.2 33.9 20.6 BC G IK
Std. Dev. 28.1 34.2 20.6 22.4 27.1 29.3 33.7 20.5 12.7 22.9 29.4 23.8
Std. Err. 1.3 3.2 1.6 1.6 1.6 2.2 2.2 1.7 1.3 2.1 2.5 2.8
Median 0 0 0 3.8 0 0 0 0 7.0 0 4.4 0

31
Q7_2. [$15,000-34,999] Approximately what percentage of your full-time employees fall into each of the following annual salary/wage bands? ______________________________________________________________________________ Proportions/Means: Columns Tested (10% risk level) - A/B/C - D/E - F/G/H - I/J/K * small base; ** very small base (under 30) ineligible for sig testing
Company Size Decision Maker Awareness Occupation
Total 2 to 49 50 to 499 500 + Primary Decision Maker
Influencer Low Medium High Manufacturing
Retail trade Finance/Insurance
A B C D E F G H I J K
Base: All Respondents 1329 336 458 535 672 657 758 384 187 321 329 250
Weighted 1329 508 426 395* 683 646 813 378* 138** 62 154 56
$15,000-34,999
0% 163 88 36 38 110 53 106 41 15 5 12 6 12.3% 17.4% 8.5% 9.6% 16.1% 8.1% 13.1% 11.0% 11.0% 8.1% 7.9% 11.2% B E
1% to 25% 317 80 127 110 161 156 150 96 71 17 28 15 23.9% 15.8% 29.9% 27.7% 23.5% 24.2% 18.4% 25.4% 51.4% 26.5% 17.9% 26.4% A A J J
26% to 50% 213 88 75 50 120 93 113 68 32 15 35 12 16.0% 17.3% 17.7% 12.6% 17.5% 14.4% 13.9% 17.9% 23.2% 24.6% 22.5% 21.6%
51% to 75% 130 56 43 32 43 87 66 57 7 7 15 4 9.8% 11.0% 10.0% 8.0% 6.3% 13.5% 8.2% 15.0% 5.1% 11.8% 9.7% 7.6% D F K
76% to 99% 93 36 42 15 54 39 62 29 2 5 10 2 7.0% 7.2% 9.8% 3.8% 7.9% 6.0% 7.6% 7.7% 1.8% 8.4% 6.4% 3.2% C K K
100% 67 60 3 3 38 29 42 22 2 3 12 1 5.0% 11.9% 0.7% 0.9% 5.6% 4.5% 5.2% 5.9% 1.6% 4.7% 7.6% 2.0% BC K K
I Don't Know 346 99 99 148 158 189 273 65 8 10 43 16 26.1% 19.5% 23.3% 37.4% 23.1% 29.2% 33.6% 17.1% 6.0% 15.9% 28.0% 28.0% AB G I I
Summary
Mean (Incl. 0) 37.7 44.5 35.1 29.9 36.2 39.4 39.1 39.9 26.4 40.1 44.5 31.2 BC K K
Std. Dev. 31.6 36.6 27.8 24.3 32.4 30.6 33.6 30.6 21.6 29.8 31.3 26.3
Std. Err. 1.0 2.2 1.5 1.3 1.4 1.4 1.5 1.7 1.6 1.8 2.0 2.0
Mean (Excl. 0) 45.2 56.8 39.5 35.3 45.8 44.6 48.7 46.0 29.9 44.4 50.0 37.0 BC K IK
Std. Dev. 29.3 31.8 26.4 22.5 29.8 28.8 30.6 28.3 20.6 28.2 28.7 24.6
Std. Err. 1.0 2.1 1.5 1.3 1.4 1.4 1.5 1.7 1.6 1.8 2.0 2.0
Median 29.2 41.6 25.0 24.2 24.6 30.8 28.0 34.6 23.2 29.7 39.8 24.1
32
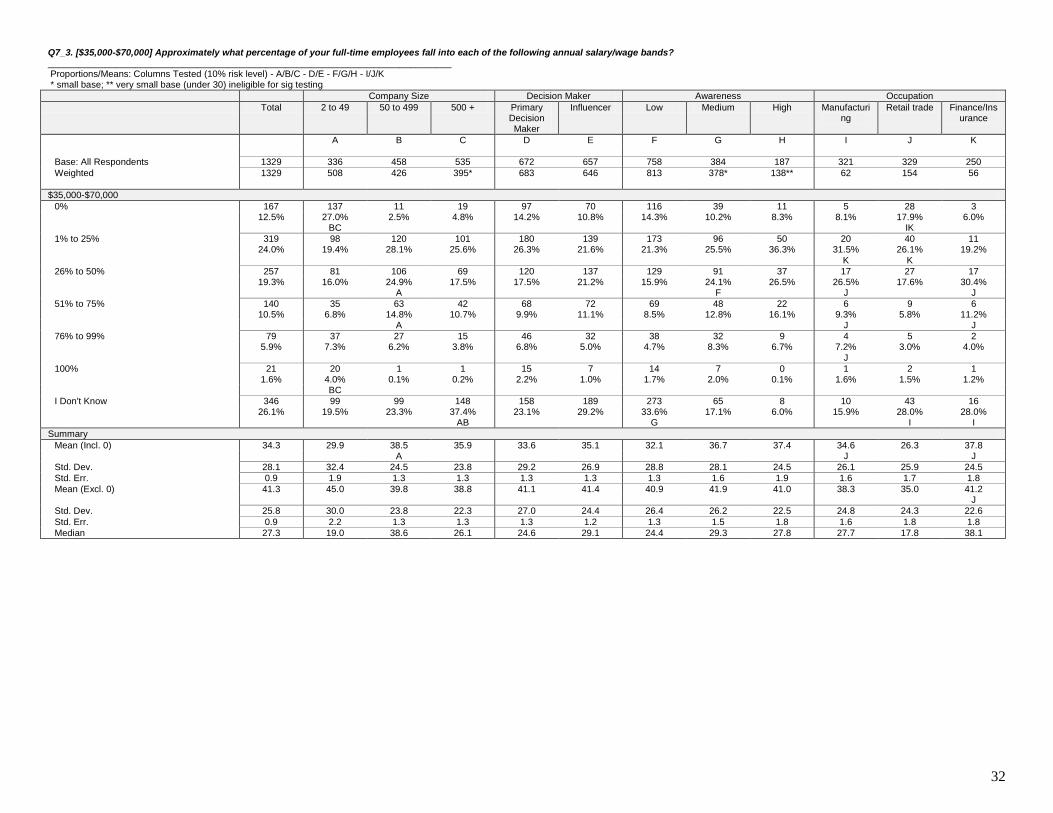
Q7_3. [$35,000-$70,000] Approximately what percentage of your full-time employees fall into each of the following annual salary/wage bands? ______________________________________________________________________________ Proportions/Means: Columns Tested (10% risk level) - A/B/C - D/E - F/G/H - I/J/K * small base; ** very small base (under 30) ineligible for sig testing
Company Size Decision Maker Awareness Occupation
Total 2 to 49 50 to 499 500 + Primary Decision Maker
Influencer Low Medium High Manufacturing
Retail trade Finance/Insurance
A B C D E F G H I J K
Base: All Respondents 1329 336 458 535 672 657 758 384 187 321 329 250
Weighted 1329 508 426 395* 683 646 813 378* 138** 62 154 56
$35,000-$70,000
0% 167 137 11 19 97 70 116 39 11 5 28 3 12.5% 27.0% 2.5% 4.8% 14.2% 10.8% 14.3% 10.2% 8.3% 8.1% 17.9% 6.0% BC IK
1% to 25% 319 98 120 101 180 139 173 96 50 20 40 11 24.0% 19.4% 28.1% 25.6% 26.3% 21.6% 21.3% 25.5% 36.3% 31.5% 26.1% 19.2% K K
26% to 50% 257 81 106 69 120 137 129 91 37 17 27 17 19.3% 16.0% 24.9% 17.5% 17.5% 21.2% 15.9% 24.1% 26.5% 26.5% 17.6% 30.4% A F J J
51% to 75% 140 35 63 42 68 72 69 48 22 6 9 6 10.5% 6.8% 14.8% 10.7% 9.9% 11.1% 8.5% 12.8% 16.1% 9.3% 5.8% 11.2% A J J
76% to 99% 79 37 27 15 46 32 38 32 9 4 5 2 5.9% 7.3% 6.2% 3.8% 6.8% 5.0% 4.7% 8.3% 6.7% 7.2% 3.0% 4.0% J
100% 21 20 1 1 15 7 14 7 0 1 2 1 1.6% 4.0% 0.1% 0.2% 2.2% 1.0% 1.7% 2.0% 0.1% 1.6% 1.5% 1.2% BC
I Don't Know 346 99 99 148 158 189 273 65 8 10 43 16 26.1% 19.5% 23.3% 37.4% 23.1% 29.2% 33.6% 17.1% 6.0% 15.9% 28.0% 28.0% AB G I I
Summary
Mean (Incl. 0) 34.3 29.9 38.5 35.9 33.6 35.1 32.1 36.7 37.4 34.6 26.3 37.8 A J J
Std. Dev. 28.1 32.4 24.5 23.8 29.2 26.9 28.8 28.1 24.5 26.1 25.9 24.5
Std. Err. 0.9 1.9 1.3 1.3 1.3 1.3 1.3 1.6 1.9 1.6 1.7 1.8
Mean (Excl. 0) 41.3 45.0 39.8 38.8 41.1 41.4 40.9 41.9 41.0 38.3 35.0 41.2 J
Std. Dev. 25.8 30.0 23.8 22.3 27.0 24.4 26.4 26.2 22.5 24.8 24.3 22.6
Std. Err. 0.9 2.2 1.3 1.3 1.3 1.2 1.3 1.5 1.8 1.6 1.8 1.8
Median 27.3 19.0 38.6 26.1 24.6 29.1 24.4 29.3 27.8 27.7 17.8 38.1

33
Q7_4. [Over $70,000] Approximately what percentage of your full-time employees fall into each of the following annual salary/wage bands? ______________________________________________________________________________ Proportions/Means: Columns Tested (10% risk level) - A/B/C - D/E - F/G/H - I/J/K * small base; ** very small base (under 30) ineligible for sig testing
Company Size Decision Maker Awareness Occupation
Total 2 to 49 50 to 499 500 + Primary Decision Maker
Influencer Low Medium High Manufacturing
Retail trade Finance/Insurance
A B C D E F G H I J K
Base: All Respondents 1329 336 458 535 672 657 758 384 187 321 329 250
Weighted 1329 508 426 395* 683 646 813 378* 138** 62 154 56
Over $70,000
0% 335 238 67 30 190 146 231 86 17 13 53 6 25.2% 46.9% 15.8% 7.5% 27.7% 22.5% 28.5% 22.9% 12.5% 20.2% 34.3% 10.0% BC C K IK
1% to 25% 480 128 192 160 243 237 223 182 76 32 47 23 36.1% 25.2% 45.1% 40.6% 35.6% 36.7% 27.4% 48.2% 54.6% 50.5% 30.7% 40.4% A A F JK J
26% to 50% 102 22 51 29 40 61 47 36 19 7 8 8 7.7% 4.3% 12.0% 7.3% 5.9% 9.5% 5.8% 9.5% 13.5% 11.5% 5.2% 14.8% A J J
51% to 75% 20 1 10 8 12 8 10 2 7 1 2 2 1.5% 0.3% 2.4% 2.1% 1.7% 1.3% 1.3% 0.6% 5.4% 1.2% 1.2% 4.4% IJ
76% to 99% 39 13 6 20 35 4 27 0 11 0 0 1 2.9% 2.6% 1.4% 5.0% 5.1% 0.6% 3.3% 0.1% 8.0% 0.6% 0.3% 1.2% E G
100% 7 6 0 1 6 1 1 6 0 0 0 1 0.5% 1.3% - 0.2% 0.9% 0.1% 0.1% 1.7% - - 0.3% 1.2% F I
I Don't Know 346 99 99 148 158 189 273 65 8 10 43 16 26.1% 19.5% 23.3% 37.4% 23.1% 29.2% 33.6% 17.1% 6.0% 15.9% 28.0% 28.0% AB G I I
Summary
Mean (Incl. 0) 15.5 10.4 17.1 21.9 17.0 13.8 14.2 13.6 25.5 14.6 9.6 22.4 A A J IJ
Std. Dev. 21.2 21.6 18.1 22.3 24.0 17.2 21.1 18.7 24.3 15.7 15.2 22.2
Std. Err. 0.7 1.3 1.0 1.2 1.1 0.8 1.0 1.0 1.8 1.0 1.0 1.7
Mean (Excl. 0) 23.5 24.9 21.5 24.9 26.6 20.2 24.9 18.7 29.5 19.3 18.4 26.0 E G IJ
Std. Dev. 22.2 27.5 17.8 22.1 25.4 17.4 22.6 19.7 23.8 15.3 16.7 21.8
Std. Err. 0.8 2.5 1.1 1.3 1.3 0.9 1.3 1.3 2.0 1.1 1.5 1.8
Median 9.2 0 9.8 14.5 9.2 9.2 5.0 8.2 19.2 9.6 2.0 19.0
34
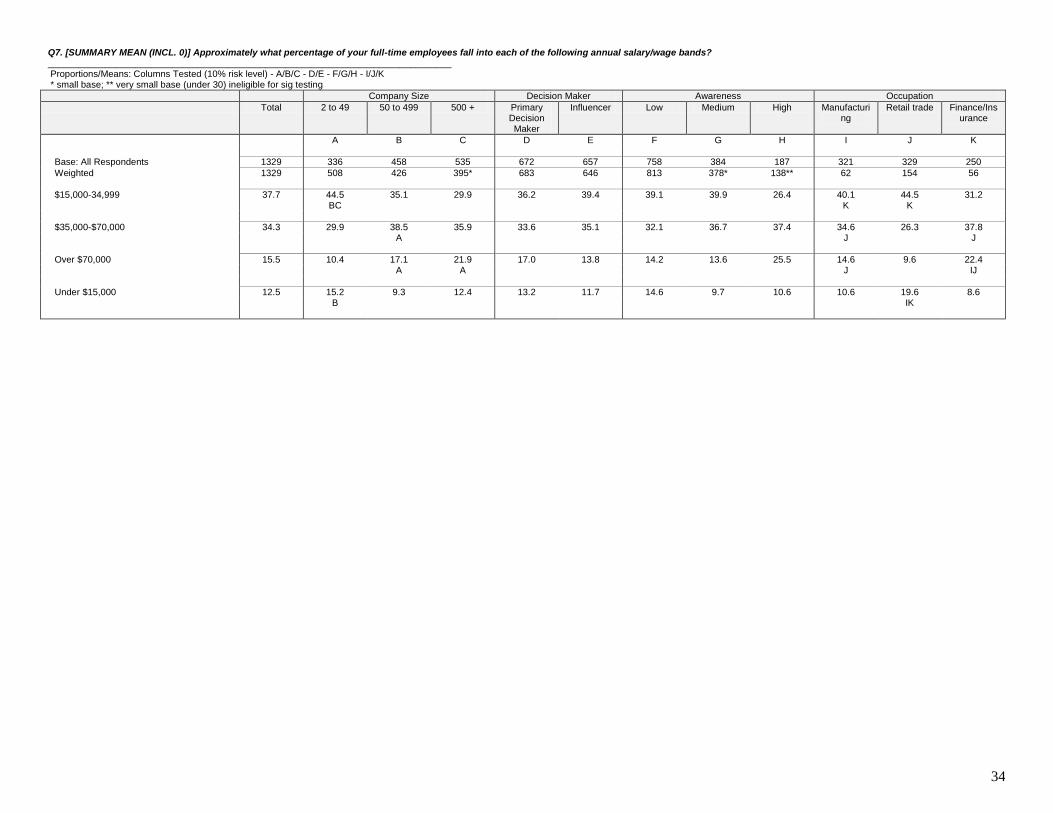
Q7. [SUMMARY MEAN (INCL. 0)] Approximately what percentage of your full-time employees fall into each of the following annual salary/wage bands? ______________________________________________________________________________ Proportions/Means: Columns Tested (10% risk level) - A/B/C - D/E - F/G/H - I/J/K * small base; ** very small base (under 30) ineligible for sig testing
Company Size Decision Maker Awareness Occupation
Total 2 to 49 50 to 499 500 + Primary Decision Maker
Influencer Low Medium High Manufacturing
Retail trade Finance/Insurance
A B C D E F G H I J K
Base: All Respondents 1329 336 458 535 672 657 758 384 187 321 329 250
Weighted 1329 508 426 395* 683 646 813 378* 138** 62 154 56
$15,000-34,999 37.7 44.5 35.1 29.9 36.2 39.4 39.1 39.9 26.4 40.1 44.5 31.2 BC K K
$35,000-$70,000 34.3 29.9 38.5 35.9 33.6 35.1 32.1 36.7 37.4 34.6 26.3 37.8 A J J
Over $70,000 15.5 10.4 17.1 21.9 17.0 13.8 14.2 13.6 25.5 14.6 9.6 22.4 A A J IJ
Under $15,000 12.5 15.2 9.3 12.4 13.2 11.7 14.6 9.7 10.6 10.6 19.6 8.6 B IK

35
Q8. Approximately what percentage of your full-time employees are unionized? ______________________________________________________________________________ Proportions/Means: Columns Tested (10% risk level) - A/B/C - D/E - F/G/H - I/J/K * small base; ** very small base (under 30) ineligible for sig testing
Company Size Decision Maker Awareness Occupation
Total 2 to 49 50 to 499 500 + Primary Decision Maker
Influencer Low Medium High Manufacturing
Retail trade Finance/Insurance
A B C D E F G H I J K
Base: All Respondents 1329 336 458 535 672 657 758 384 187 321 329 250
Weighted 1329 508 426 395* 683 646 813 378* 138** 62 154 56
0% 825 382 276 167 408 417 520 217 88 33 89 38 62.1% 75.2% 64.8% 42.3% 59.7% 64.6% 64.0% 57.4% 63.9% 52.6% 58.1% 67.2% BC C IJ
1% to 25% 51 4 22 24 27 24 19 25 7 4 8 2 3.8% 0.8% 5.2% 6.2% 3.9% 3.7% 2.4% 6.5% 4.8% 6.5% 5.5% 4.0% A A F
26% to 50% 64 28 9 27 50 14 40 21 3 5 7 2 4.8% 5.6% 2.1% 6.8% 7.3% 2.2% 4.9% 5.7% 2.3% 8.7% 4.3% 2.8% B E JK
51% to 75% 49 4 25 20 23 26 31 14 4 4 4 2 3.7% 0.8% 5.8% 5.1% 3.3% 4.1% 3.8% 3.7% 3.1% 6.2% 2.4% 3.2% A A JK
76% to 99% 54 9 19 26 20 34 37 12 4 6 3 2 4.0% 1.7% 4.5% 6.6% 3.0% 5.2% 4.6% 3.2% 3.0% 9.3% 2.1% 3.2% A JK
100% 78 36 21 20 53 25 33 23 22 3 10 1 5.8% 7.1% 5.0% 5.0% 7.8% 3.8% 4.1% 6.0% 15.7% 5.0% 6.7% 2.0% K K
I Don't Know 209 44 54 111 103 105 132 66 10 7 32 10 15.7% 8.7% 12.6% 28.0% 15.1% 16.3% 16.3% 17.4% 7.3% 11.5% 21.0% 17.6% AB I I
Summary
Mean (Incl. 0) 17.1 13.1 16.1 24.7 19.2 14.8 15.4 18.0 23.8 24.4 15.9 10.5 A JK K
Std. Dev. 32.8 30.9 32.0 35.8 34.1 31.2 31.2 32.9 39.7 35.6 32.6 26.4
Std. Err. 1.0 1.8 1.6 1.8 1.4 1.3 1.3 1.8 3.0 2.1 2.0 1.8
Mean (Excl. 0) 64.7 74.6 62.2 59.9 64.5 65.1 65.2 59.0 76.6 60.3 60.0 57.1
Std. Dev. 31.7 28.8 32.8 31.5 31.6 32.0 29.8 33.7 31.7 30.9 36.9 34.1
Std. Err. 1.7 4.0 3.1 2.4 2.3 2.6 2.4 3.1 3.6 2.9 4.4 5.5

36
Q9_1. [Mandate that all individuals obtain health insurance with a minimum level of coverage or pay a penalty ...] How aware are you of the following provisions in the recently passed U.S. healthcare reform act? ______________________________________________________________________________ Proportions/Means: Columns Tested (10% risk level) - A/B/C - D/E - F/G/H - I/J/K * small base; ** very small base (under 30) ineligible for sig testing
Company Size Decision Maker Awareness Occupation
Total 2 to 49 50 to 499 500 + Primary Decision Maker
Influencer Low Medium High Manufacturing
Retail trade Finance/Insurance
A B C D E F G H I J K
Base: All Respondents 1329 336 458 535 672 657 758 384 187 321 329 250
Weighted 1329 508 426 395* 683 646 813 378* 138** 62 154 56
Mandate that all individuals obtain health insurance with a minimum level of coverage or pay a penalty ...
Am highly familiar and know the details of the provision
183 61 49 73 136 47 35 37 111 13 16 9
13.8% 12.0% 11.4% 18.5% 19.9% 7.3% 4.3% 9.7% 80.2% 21.2% 10.3% 16.8% E F J J
Am familiar with the provision 283 95 109 79 132 151 63 202 18 15 32 13 21.3% 18.7% 25.7% 19.9% 19.4% 23.4% 7.7% 53.5% 13.3% 24.6% 21.0% 23.6% F
Am somewhat familiar and know the 'basics' of this provision
271 92 114 64 137 133 142 120 9 13 29 12
20.4% 18.2% 26.8% 16.2% 20.1% 20.7% 17.5% 31.6% 6.5% 20.9% 18.8% 21.2% C F
Have heard of this, but don't know much about it
248 110 78 60 95 153 235 13 0 11 33 9
18.7% 21.7% 18.4% 15.1% 13.9% 23.8% 29.0% 3.4% - 16.8% 21.6% 15.2% D G K
Am not at all familiar 344 149 76 119 183 161 337 7 0 10 43 13 25.9% 29.4% 17.7% 30.2% 26.8% 24.9% 41.5% 1.7% - 16.5% 28.3% 23.2% B B G I I
Summary
Total at least somewhat familiar 737 248 272 216 405 331 240 359 138 42 77 35 55.4% 48.9% 63.9% 54.7% 59.3% 51.3% 29.5% 94.8% 100.0% 66.7% 50.2% 61.6% A F J J
Total have heard of 985 359 350 276 500 485 475 372 138 52 110 43 74.1% 70.6% 82.3% 69.8% 73.2% 75.1% 58.5% 98.3% 100.0% 83.5% 71.7% 76.8% AC F JK

37
Q9_2. [Requirement that all employers with more than 50 U.S. employees offer employees a minimum level of health insurance coverage or pay a $2000 penalty per employee ...] How aware are you of the following provisions in the recently passed U.S. healthcare reform act? ______________________________________________________________________________ Proportions/Means: Columns Tested (10% risk level) - A/B/C - D/E - F/G/H - I/J/K * small base; ** very small base (under 30) ineligible for sig testing
Company Size Decision Maker Awareness Occupation
Total 2 to 49 50 to 499 500 + Primary Decision Maker
Influencer Low Medium High Manufacturing
Retail trade Finance/Insurance
A B C D E F G H I J K
Base: All Respondents 1329 336 458 535 672 657 758 384 187 321 329 250
Weighted 1329 508 426 395* 683 646 813 378* 138** 62 154 56
Requirement that all employers with more than 50 U.S. employees offer employees a minimum level of health insurance coverage or pay a $2000 penalty per employee ...
Am highly familiar and know the details of the provision
138 43 44 52 107 31 10 23 105 10 13 10
10.4% 8.4% 10.3% 13.1% 15.7% 4.8% 1.3% 6.1% 76.0% 16.5% 8.5% 18.4% E F J J
Am familiar with the provision 270 91 129 50 126 144 52 193 26 16 28 13 20.3% 17.9% 30.3% 12.6% 18.5% 22.2% 6.4% 50.9% 18.5% 26.2% 18.5% 22.4% AC F J
Am somewhat familiar and know the 'basics' of this provision
275 107 100 68 148 126 115 152 8 13 34 13
20.7% 21.1% 23.5% 17.1% 21.7% 19.6% 14.2% 40.2% 5.5% 21.2% 22.2% 22.8% F
Have heard of this, but don't know much about it
276 120 73 82 106 170 265 10 0 11 31 8
20.8% 23.6% 17.2% 20.9% 15.5% 26.3% 32.7% 2.8% - 17.8% 20.4% 13.6% D G K
Am not at all familiar 370 147 80 144 196 174 370 0 0 11 47 13 27.9% 28.9% 18.7% 36.3% 28.7% 27.0% 45.5% 0.1% - 18.4% 30.4% 22.8% B B G IK
Summary
Total at least somewhat familiar 683 241 273 169 382 301 177 368 138 40 76 36 51.4% 47.4% 64.0% 42.8% 55.8% 46.6% 21.8% 97.2% 100.0% 63.9% 49.2% 63.6% AC E F J J
Total have heard of 959 361 346 252 488 471 442 378 138 51 107 43 72.1% 71.1% 81.3% 63.7% 71.3% 73.0% 54.5% 99.9% 100.0% 81.6% 69.6% 77.2% AC F J J

38
Q9_3. [Penalty levied on employers whose health plan premiums cost above 9.5% of household income for at least one employee and if at least one such employee...] How aware are you of the following provisions in the recently passed U.S. healthcare reform act? ______________________________________________________________________________ Proportions/Means: Columns Tested (10% risk level) - A/B/C - D/E - F/G/H - I/J/K * small base; ** very small base (under 30) ineligible for sig testing
Company Size Decision Maker Awareness Occupation
Total 2 to 49 50 to 499 500 + Primary Decision Maker
Influencer Low Medium High Manufacturing
Retail trade Finance/Insurance
A B C D E F G H I J K
Base: All Respondents 1329 336 458 535 672 657 758 384 187 321 329 250
Weighted 1329 508 426 395* 683 646 813 378* 138** 62 154 56
Penalty levied on employers whose health plan premiums cost above 9.5% of household income for at least one employee and if at least one such employee...
Am highly familiar and know the details of the provision
93 22 27 44 72 21 0 8 85 9 9 8
7.0% 4.4% 6.3% 11.1% 10.6% 3.3% 0.1% 2.1% 61.6% 14.6% 6.1% 13.6% A E F J J
Am familiar with the provision 216 52 106 58 136 80 9 163 44 15 26 12 16.3% 10.3% 25.0% 14.6% 19.9% 12.4% 1.1% 43.1% 31.9% 23.7% 16.7% 21.2% AC E F J
Am somewhat familiar and know the 'basics' of this provision
240 88 91 61 97 142 71 160 8 12 28 12
18.0% 17.2% 21.3% 15.5% 14.2% 22.0% 8.7% 42.4% 6.0% 19.6% 17.9% 21.2% D F
Have heard of this, but don't know much about it
267 99 100 68 133 134 223 43 1 11 34 7
20.1% 19.5% 23.5% 17.1% 19.4% 20.7% 27.5% 11.3% 0.5% 16.8% 22.2% 12.4% G IK
Am not at all familiar 513 247 102 165 245 268 509 5 0 16 57 18 38.6% 48.6% 23.9% 41.6% 35.8% 41.6% 62.6% 1.2% - 25.2% 37.1% 31.6% B B G I I
Summary
Total at least somewhat familiar 549 162 224 163 306 244 81 331 138 36 63 31 41.3% 31.9% 52.6% 41.2% 44.7% 37.7% 9.9% 87.5% 99.5% 57.9% 40.7% 56.0% AC F J J
Total have heard of 816 261 324 231 439 377 304 374 138 47 97 38 61.4% 51.4% 76.1% 58.4% 64.2% 58.4% 37.4% 98.8% 100.0% 74.8% 62.9% 68.4% AC F JK
39
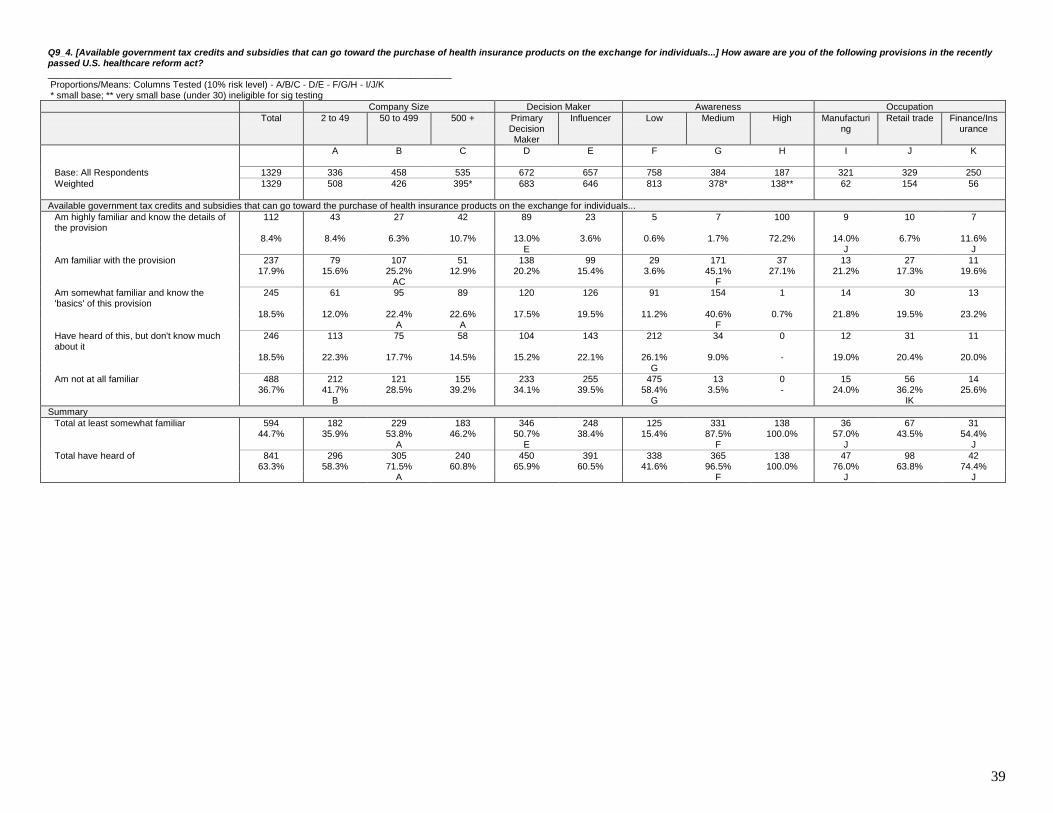
Q9_4. [Available government tax credits and subsidies that can go toward the purchase of health insurance products on the exchange for individuals...] How aware are you of the following provisions in the recently passed U.S. healthcare reform act? ______________________________________________________________________________ Proportions/Means: Columns Tested (10% risk level) - A/B/C - D/E - F/G/H - I/J/K * small base; ** very small base (under 30) ineligible for sig testing
Company Size Decision Maker Awareness Occupation
Total 2 to 49 50 to 499 500 + Primary Decision Maker
Influencer Low Medium High Manufacturing
Retail trade Finance/Insurance
A B C D E F G H I J K
Base: All Respondents 1329 336 458 535 672 657 758 384 187 321 329 250
Weighted 1329 508 426 395* 683 646 813 378* 138** 62 154 56
Available government tax credits and subsidies that can go toward the purchase of health insurance products on the exchange for individuals...
Am highly familiar and know the details of the provision
112 43 27 42 89 23 5 7 100 9 10 7
8.4% 8.4% 6.3% 10.7% 13.0% 3.6% 0.6% 1.7% 72.2% 14.0% 6.7% 11.6% E J J
Am familiar with the provision 237 79 107 51 138 99 29 171 37 13 27 11 17.9% 15.6% 25.2% 12.9% 20.2% 15.4% 3.6% 45.1% 27.1% 21.2% 17.3% 19.6% AC F
Am somewhat familiar and know the 'basics' of this provision
245 61 95 89 120 126 91 154 1 14 30 13
18.5% 12.0% 22.4% 22.6% 17.5% 19.5% 11.2% 40.6% 0.7% 21.8% 19.5% 23.2% A A F
Have heard of this, but don't know much about it
246 113 75 58 104 143 212 34 0 12 31 11
18.5% 22.3% 17.7% 14.5% 15.2% 22.1% 26.1% 9.0% - 19.0% 20.4% 20.0% G
Am not at all familiar 488 212 121 155 233 255 475 13 0 15 56 14 36.7% 41.7% 28.5% 39.2% 34.1% 39.5% 58.4% 3.5% - 24.0% 36.2% 25.6% B G IK
Summary
Total at least somewhat familiar 594 182 229 183 346 248 125 331 138 36 67 31 44.7% 35.9% 53.8% 46.2% 50.7% 38.4% 15.4% 87.5% 100.0% 57.0% 43.5% 54.4% A E F J J
Total have heard of 841 296 305 240 450 391 338 365 138 47 98 42 63.3% 58.3% 71.5% 60.8% 65.9% 60.5% 41.6% 96.5% 100.0% 76.0% 63.8% 74.4% A F J J

40
Q9_5. [Opportunity for employers to return up to 30% of premiums ... to employees based on their participation in wellness programs] How aware are you of the following provisions in the recently passed U.S. healthcare reform act? ______________________________________________________________________________ Proportions/Means: Columns Tested (10% risk level) - A/B/C - D/E - F/G/H - I/J/K * small base; ** very small base (under 30) ineligible for sig testing
Company Size Decision Maker Awareness Occupation
Total 2 to 49 50 to 499 500 + Primary Decision Maker
Influencer Low Medium High Manufacturing
Retail trade Finance/Insurance
A B C D E F G H I J K
Base: All Respondents 1329 336 458 535 672 657 758 384 187 321 329 250
Weighted 1329 508 426 395* 683 646 813 378* 138** 62 154 56
Opportunity for employers to return up to 30% of premiums ... to employees based on their participation in wellness programs
Am highly familiar and know the details of the provision
109 34 28 47 93 16 2 8 99 9 12 7
8.2% 6.6% 6.6% 12.0% 13.5% 2.5% 0.3% 2.0% 71.7% 13.7% 7.6% 12.0% E J J
Am familiar with the provision 174 40 85 49 101 73 16 127 31 14 23 12 13.1% 7.8% 19.9% 12.5% 14.8% 11.3% 1.9% 33.7% 22.5% 23.1% 15.2% 21.2% A F J J
Am somewhat familiar and know the 'basics' of this provision
270 85 112 73 126 144 89 174 7 13 30 11
20.3% 16.8% 26.3% 18.5% 18.5% 22.3% 11.0% 46.0% 5.3% 20.6% 19.5% 19.6% A F
Have heard of this, but don't know much about it
287 131 87 69 128 159 239 48 1 12 37 10
21.6% 25.8% 20.5% 17.4% 18.8% 24.6% 29.4% 12.6% 0.5% 19.3% 24.0% 18.0% G K
Am not at all familiar 489 218 114 157 235 254 467 21 0 15 52 16 36.8% 43.0% 26.7% 39.7% 34.4% 39.3% 57.5% 5.7% - 23.4% 33.7% 29.2% B B G I
Summary
Total at least somewhat familiar 553 158 225 170 320 233 107 309 138 36 65 30 41.6% 31.2% 52.8% 42.9% 46.8% 36.1% 13.1% 81.7% 99.5% 57.3% 42.2% 52.8% A A E F J J
Total have heard of 840 289 312 238 448 392 345 357 138 48 102 40 63.2% 57.0% 73.3% 60.3% 65.6% 60.7% 42.5% 94.3% 100.0% 76.6% 66.3% 70.8% AC F J

41
Q9_6. [Creation of state-level healthcare exchanges/marketplaces for individuals and small businesses ... to purchase health insurance products] How aware are you of the following provisions in the recently passed U.S. healthcare reform act? ______________________________________________________________________________ Proportions/Means: Columns Tested (10% risk level) - A/B/C - D/E - F/G/H - I/J/K * small base; ** very small base (under 30) ineligible for sig testing
Company Size Decision Maker Awareness Occupation
Total 2 to 49 50 to 499 500 + Primary Decision Maker
Influencer Low Medium High Manufacturing
Retail trade Finance/Insurance
A B C D E F G H I J K
Base: All Respondents 1329 336 458 535 672 657 758 384 187 321 329 250
Weighted 1329 508 426 395* 683 646 813 378* 138** 62 154 56
Creation of state-level healthcare exchanges/marketplaces for individuals and small businesses ... to purchase health insurance products
Am highly familiar and know the details of the provision
120 35 39 46 92 28 4 20 96 9 9 7
9.0% 6.9% 9.1% 11.6% 13.5% 4.3% 0.5% 5.2% 69.2% 15.0% 6.1% 13.2% E F J J
Am familiar with the provision 236 80 107 48 130 106 29 166 40 16 25 11 17.8% 15.8% 25.2% 12.3% 19.0% 16.4% 3.6% 43.9% 29.3% 26.2% 16.4% 20.0% AC F JK
Am somewhat familiar and know the 'basics' of this provision
277 90 109 78 153 124 100 175 2 12 33 15
20.8% 17.7% 25.6% 19.8% 22.3% 19.3% 12.3% 46.2% 1.5% 19.9% 21.3% 26.0% F I
Have heard of this, but don't know much about it
250 90 89 71 86 165 235 15 0 11 36 9
18.8% 17.7% 20.9% 18.0% 12.6% 25.5% 28.9% 4.1% - 17.8% 23.4% 16.8% D G IK
Am not at all familiar 446 212 82 152 223 223 444 2 0 13 50 13 33.6% 41.8% 19.3% 38.3% 32.6% 34.5% 54.6% 0.6% - 21.2% 32.8% 24.0% B B G IK
Summary
Total at least somewhat familiar 633 205 255 172 375 258 134 361 138 38 67 33 47.6% 40.5% 59.8% 43.6% 54.8% 40.0% 16.5% 95.4% 100.0% 61.1% 43.8% 59.2% AC E F J J
Total have heard of 883 295 344 244 460 423 369 376 138 49 103 43 66.4% 58.2% 80.7% 61.7% 67.4% 65.5% 45.4% 99.4% 100.0% 78.8% 67.2% 76.0% AC F J J
42
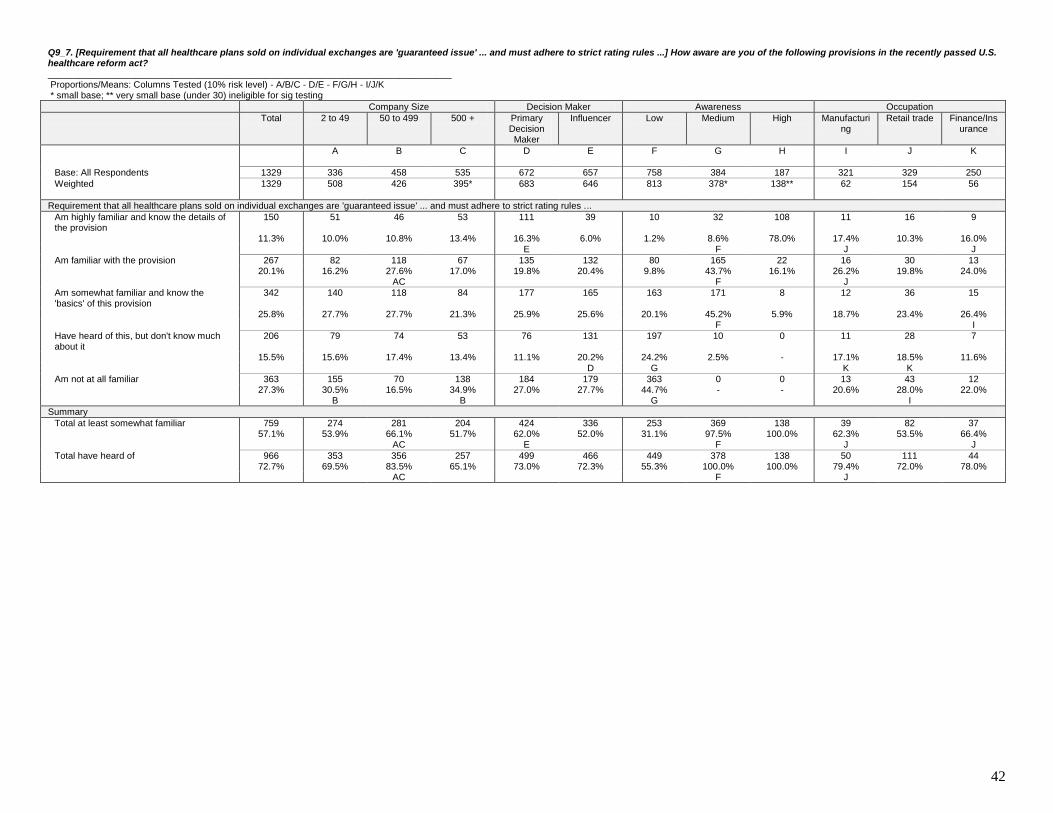
Q9_7. [Requirement that all healthcare plans sold on individual exchanges are 'guaranteed issue' ... and must adhere to strict rating rules ...] How aware are you of the following provisions in the recently passed U.S. healthcare reform act? ______________________________________________________________________________ Proportions/Means: Columns Tested (10% risk level) - A/B/C - D/E - F/G/H - I/J/K * small base; ** very small base (under 30) ineligible for sig testing
Company Size Decision Maker Awareness Occupation
Total 2 to 49 50 to 499 500 + Primary Decision Maker
Influencer Low Medium High Manufacturing
Retail trade Finance/Insurance
A B C D E F G H I J K
Base: All Respondents 1329 336 458 535 672 657 758 384 187 321 329 250
Weighted 1329 508 426 395* 683 646 813 378* 138** 62 154 56
Requirement that all healthcare plans sold on individual exchanges are 'guaranteed issue' ... and must adhere to strict rating rules ...
Am highly familiar and know the details of the provision
150 51 46 53 111 39 10 32 108 11 16 9
11.3% 10.0% 10.8% 13.4% 16.3% 6.0% 1.2% 8.6% 78.0% 17.4% 10.3% 16.0% E F J J
Am familiar with the provision 267 82 118 67 135 132 80 165 22 16 30 13 20.1% 16.2% 27.6% 17.0% 19.8% 20.4% 9.8% 43.7% 16.1% 26.2% 19.8% 24.0% AC F J
Am somewhat familiar and know the 'basics' of this provision
342 140 118 84 177 165 163 171 8 12 36 15
25.8% 27.7% 27.7% 21.3% 25.9% 25.6% 20.1% 45.2% 5.9% 18.7% 23.4% 26.4% F I
Have heard of this, but don't know much about it
206 79 74 53 76 131 197 10 0 11 28 7
15.5% 15.6% 17.4% 13.4% 11.1% 20.2% 24.2% 2.5% - 17.1% 18.5% 11.6% D G K K
Am not at all familiar 363 155 70 138 184 179 363 0 0 13 43 12 27.3% 30.5% 16.5% 34.9% 27.0% 27.7% 44.7% - - 20.6% 28.0% 22.0% B B G I
Summary
Total at least somewhat familiar 759 274 281 204 424 336 253 369 138 39 82 37 57.1% 53.9% 66.1% 51.7% 62.0% 52.0% 31.1% 97.5% 100.0% 62.3% 53.5% 66.4% AC E F J J
Total have heard of 966 353 356 257 499 466 449 378 138 50 111 44 72.7% 69.5% 83.5% 65.1% 73.0% 72.3% 55.3% 100.0% 100.0% 79.4% 72.0% 78.0% AC F J

43
Q9_8. [Starting in 2018, an excise or 'Cadillac' tax on employer health plans that cost more than a certain threshold ...] How aware are you of the following provisions in the recently passed U.S. healthcare reform act? ______________________________________________________________________________ Proportions/Means: Columns Tested (10% risk level) - A/B/C - D/E - F/G/H - I/J/K * small base; ** very small base (under 30) ineligible for sig testing
Company Size Decision Maker Awareness Occupation
Total 2 to 49 50 to 499 500 + Primary Decision Maker
Influencer Low Medium High Manufacturing
Retail trade Finance/Insurance
A B C D E F G H I J K
Base: All Respondents 1329 336 458 535 672 657 758 384 187 321 329 250
Weighted 1329 508 426 395* 683 646 813 378* 138** 62 154 56
Starting in 2018, an excise or 'Cadillac' tax on employer health plans that cost more than a certain threshold ...
Am highly familiar and know the details of the provision
128 42 41 44 102 26 6 15 108 11 9 9
9.6% 8.3% 9.7% 11.3% 14.9% 4.1% 0.7% 3.9% 77.8% 17.8% 6.1% 15.2% E F J J
Am familiar with the provision 209 54 111 44 123 86 22 158 29 12 25 10 15.7% 10.7% 26.0% 11.2% 18.0% 13.4% 2.7% 41.8% 20.9% 19.6% 16.1% 18.0% AC F
Am somewhat familiar and know the 'basics' of this provision
249 89 82 79 102 148 88 160 2 13 28 12
18.8% 17.5% 19.2% 19.9% 14.9% 22.9% 10.8% 42.3% 1.3% 20.9% 18.5% 22.0% D F
Have heard of this, but don't know much about it
247 102 86 60 111 136 211 36 0 10 31 8
18.6% 20.0% 20.2% 15.1% 16.3% 21.1% 26.0% 9.5% - 15.6% 20.1% 14.4% G K
Am not at all familiar 495 221 106 168 246 249 486 9 0 16 60 17 37.3% 43.5% 24.9% 42.6% 36.0% 38.6% 59.8% 2.5% - 26.2% 39.2% 30.4% B B G IK
Summary
Total at least somewhat familiar 586 185 234 167 326 260 115 333 138 36 63 31 44.1% 36.4% 54.9% 42.3% 47.7% 40.3% 14.2% 88.0% 100.0% 58.3% 40.7% 55.2% AC F J J
Total have heard of 834 287 320 227 437 397 327 369 138 46 93 39 62.7% 56.5% 75.1% 57.4% 64.0% 61.4% 40.2% 97.5% 100.0% 73.8% 60.8% 69.6% AC F J J

44
Q9_9. [Temporary tax credits to offset the cost of providing health insurance for small employers ... . Credits will offset up to 35% of...] How aware are you of the following provisions in the recently passed U.S. healthcare reform act? ______________________________________________________________________________ Proportions/Means: Columns Tested (10% risk level) - A/B/C - D/E - F/G/H - I/J/K * small base; ** very small base (under 30) ineligible for sig testing
Company Size Decision Maker Awareness Occupation
Total 2 to 49 50 to 499 500 + Primary Decision Maker
Influencer Low Medium High Manufacturing
Retail trade Finance/Insurance
A B C D E F G H I J K
Base: Up to 49 - U.S. based Employee in office
336 336 0 0 171 165 219 85 32 64 94 38
Weighted 508 508 -** -** 253* 255* 351* 115** 42** 12* 44* 9*
Temporary tax credits to offset the cost of providing health insurance for small employers ... . Credits will offset up to 35% of...
Am highly familiar and know the details of the provision
32 32 0 0 23 9 1 0 31 1 4 1
6.3% 6.3% - - 9.1% 3.5% 0.2% 0.4% 73.6% 4.7% 9.6% 13.2%
Am familiar with the provision 73 73 0 0 30 43 13 49 11 2 7 1 14.3% 14.3% - - 11.9% 16.8% 3.6% 42.6% 26.4% 15.6% 17.0% 15.8%
Am somewhat familiar and know the ‘basics' of this provision
98 98 0 0 59 40 49 50 0 3 7 2
19.4% 19.4% - - 23.2% 15.6% 13.9% 43.4% - 25.0% 16.0% 21.1%
Have heard of this, but don't know much about it
116 116 0 0 54 62 101 14 0 3 12 2
22.8% 22.8% - - 21.5% 24.2% 28.9% 12.6% - 26.6% 27.7% 23.7%
Am not at all familiar 189 189 0 0 87 102 187 1 0 4 13 2 37.2% 37.2% - - 34.3% 40.0% 53.5% 1.0% - 28.1% 29.8% 26.3%
Summary
Top2Box (Familiar) 105 105 0 0 53 52 13 50 42 3 12 2 20.6% 20.6% - - 21.0% 20.2% 3.8% 43.0% 100.0% 20.3% 26.6% 28.9%
Low2Box (Not Familiar) 304 304 0 0 141 163 289 16 0 7 25 4 60.0% 60.0% - - 55.8% 64.1% 82.4% 13.6% - 54.7% 57.4% 50.0%

45
Q10. Current benefits offering What medical plan(s) does your company currently offer employees? ______________________________________________________________________________ Proportions/Means: Columns Tested (10% risk level) - A/B/C - D/E - F/G/H - I/J/K * small base; ** very small base (under 30) ineligible for sig testing
Company Size Decision Maker Awareness Occupation
Total 2 to 49 50 to 499 500 + Primary Decision Maker
Influencer Low Medium High Manufacturing
Retail trade Finance/Insurance
A B C D E F G H I J K
Base: All Respondents 1329 336 458 535 672 657 758 384 187 321 329 250
Weighted 1329 508 426 395* 683 646 813 378* 138** 62 154 56
PPO Plan 609 167 204 238 310 298 365 161 83 36 58 33 45.8% 32.9% 47.9% 60.1% 45.4% 46.2% 44.9% 42.5% 60.3% 57.3% 37.7% 59.2% A AB J J
HMO or POS plan 569 169 200 200 311 259 304 189 77 31 63 30 42.8% 33.3% 46.9% 50.7% 45.4% 40.1% 37.4% 49.9% 55.5% 50.2% 40.7% 54.0% A A F J J
High-deductible plan with savings or reimbursement account
240 59 59 122 105 136 130 70 40 18 25 16
18.1% 11.7% 13.8% 30.9% 15.3% 21.0% 16.0% 18.4% 29.0% 29.6% 16.4% 28.8% AB J J
Traditional indemnity plan 119 42 36 42 87 32 54 43 22 13 12 4 9.0% 8.2% 8.3% 10.6% 12.8% 5.0% 6.7% 11.3% 16.1% 20.2% 7.6% 6.8% E JK
Limited coverage plans 79 31 23 26 55 24 32 25 22 9 10 4 5.9% 6.0% 5.3% 6.5% 8.1% 3.7% 3.9% 6.6% 16.0% 13.7% 6.7% 6.4% E JK
Other plans 70 14 33 24 31 39 25 38 7 3 9 3 5.3% 2.7% 7.7% 6.0% 4.5% 6.1% 3.1% 10.0% 5.2% 4.4% 5.8% 5.2% A F
None 135 117 14 4 68 67 119 13 2 2 17 2 10.1% 23.0% 3.2% 1.1% 9.9% 10.4% 14.7% 3.5% 1.6% 3.7% 11.2% 4.4% BC G IK
I don't know 90 21 31 37 39 50 63 26 0 3 19 4 6.7% 4.1% 7.4% 9.5% 5.7% 7.8% 7.8% 6.9% 0.2% 4.0% 12.2% 6.4% IK

46
Q11. With what insurer(s) or carriers does your company contract for medical benefits today? ______________________________________________________________________________ Proportions/Means: Columns Tested (10% risk level) - A/B/C - D/E - F/G/H - I/J/K * small base; ** very small base (under 30) ineligible for sig testing
Company Size Decision Maker Awareness Occupation
Total 2 to 49 50 to 499 500 + Primary Decision Maker
Influencer Low Medium High Manufacturing
Retail trade Finance/Insurance
A B C D E F G H I J K
Base: Respondents With Medical Plan(s) 1137 249 416 472 575 562 607 351 179 296 252 223
Weighted 1105 370* 381 354* 577 528 630 339* 136** 58 118 50
Blue Cross Blue Shield 591 203 193 196 315 277 356 163 72 33 56 27 53.5% 54.7% 50.6% 55.4% 54.5% 52.4% 56.5% 48.0% 53.4% 56.8% 47.6% 54.7% J
Aetna 180 39 55 86 114 66 110 40 30 12 23 12 16.3% 10.6% 14.5% 24.2% 19.7% 12.5% 17.4% 11.9% 21.8% 21.6% 19.4% 23.3% AB
United Health Group 156 45 28 83 105 51 77 46 33 12 21 10 14.1% 12.2% 7.3% 23.4% 18.1% 9.7% 12.2% 13.7% 24.0% 20.6% 17.9% 19.3% AB E
Kaiser Permanente 115 15 29 71 81 34 45 35 35 7 9 5 10.4% 4.1% 7.5% 20.2% 14.0% 6.5% 7.2% 10.2% 26.0% 12.8% 7.9% 9.4% AB E J
Humana 90 26 32 33 37 53 52 20 18 10 6 3 8.1% 6.9% 8.3% 9.2% 6.4% 10.0% 8.2% 5.8% 13.3% 17.6% 5.2% 6.3% JK
Cigna 90 10 31 48 57 33 36 24 29 11 13 9 8.1% 2.8% 8.2% 13.6% 9.8% 6.2% 5.7% 7.2% 21.4% 19.6% 10.7% 17.5% A A J J
Health Net 67 23 18 27 50 17 24 32 12 7 7 4 6.1% 6.1% 4.7% 7.6% 8.7% 3.2% 3.7% 9.3% 9.1% 12.8% 6.0% 7.6% E F JK
Assurant Health 17 1 7 9 13 4 2 8 7 7 2 2 1.5% 0.3% 1.7% 2.6% 2.3% 0.7% 0.3% 2.3% 5.2% 12.8% 1.6% 4.5% JK J
Other company 130 50 58 23 52 79 76 49 6 5 7 3 11.8% 13.4% 15.1% 6.6% 9.0% 14.9% 12.0% 14.3% 4.6% 8.8% 6.3% 5.4% C
I don't know 39 12 5 23 12 27 26 13 0 1 6 1 3.6% 3.2% 1.3% 6.4% 2.1% 5.1% 4.2% 3.8% - 2.0% 4.8% 1.8% B IK

47
Q12. Is your employer medical coverage offering fully insured ... , ASO ... / self-insured ..., or a mixture? ______________________________________________________________________________ Proportions/Means: Columns Tested (10% risk level) - A/B/C - D/E - F/G/H - I/J/K * small base; ** very small base (under 30) ineligible for sig testing
Company Size Decision Maker Awareness Occupation
Total 2 to 49 50 to 499 500 + Primary Decision Maker
Influencer Low Medium High Manufacturing
Retail trade Finance/Insurance
A B C D E F G H I J K
Base: Respondents With Medical Plan(s) 1137 249 416 472 575 562 607 351 179 296 252 223
Weighted 1105 370* 381 354* 577 528 630 339* 136** 58 118 50
All fully insured 591 217 232 141 362 229 313 199 79 32 56 30 53.5% 58.8% 61.0% 40.0% 62.7% 43.5% 49.6% 58.7% 58.6% 55.7% 47.6% 60.1% C C E J J
A mix of fully insured and ASO 255 79 85 90 114 140 134 82 38 11 27 10 23.0% 21.5% 22.2% 25.6% 19.8% 26.5% 21.3% 24.2% 28.2% 18.9% 22.6% 20.2%
All ASO 72 17 24 31 31 41 22 32 18 7 9 2 6.5% 4.5% 6.3% 8.8% 5.4% 7.8% 3.5% 9.5% 13.1% 12.5% 7.9% 4.9% F JK
I don't know 187 57 40 91 70 117 161 26 0 7 26 7 16.9% 15.3% 10.5% 25.7% 12.1% 22.2% 25.6% 7.5% 0.1% 12.8% 21.8% 14.8% AB D G IK
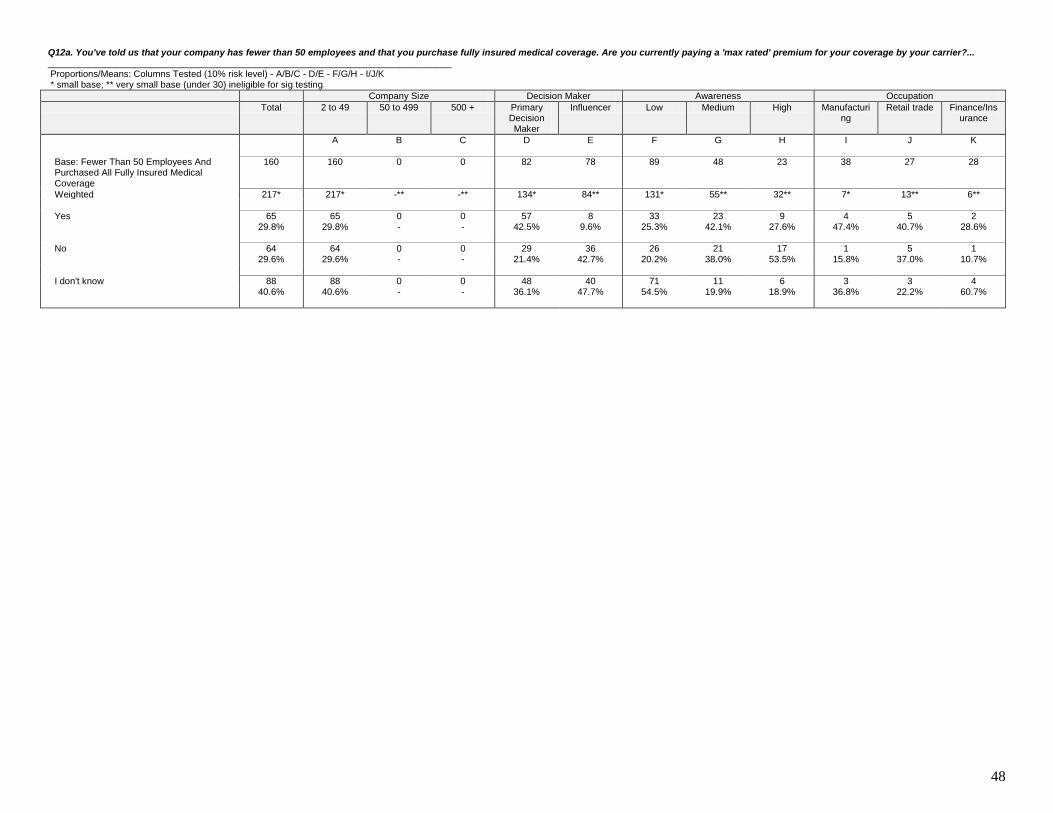
48
Q12a. You've told us that your company has fewer than 50 employees and that you purchase fully insured medical coverage. Are you currently paying a 'max rated' premium for your coverage by your carrier?... ______________________________________________________________________________ Proportions/Means: Columns Tested (10% risk level) - A/B/C - D/E - F/G/H - I/J/K * small base; ** very small base (under 30) ineligible for sig testing
Company Size Decision Maker Awareness Occupation
Total 2 to 49 50 to 499 500 + Primary Decision Maker
Influencer Low Medium High Manufacturing
Retail trade Finance/Insurance
A B C D E F G H I J K
Base: Fewer Than 50 Employees And Purchased All Fully Insured Medical Coverage
160 160 0 0 82 78 89 48 23 38 27 28
Weighted 217* 217* -** -** 134* 84** 131* 55** 32** 7* 13** 6**
Yes 65 65 0 0 57 8 33 23 9 4 5 2 29.8% 29.8% - - 42.5% 9.6% 25.3% 42.1% 27.6% 47.4% 40.7% 28.6%
No 64 64 0 0 29 36 26 21 17 1 5 1 29.6% 29.6% - - 21.4% 42.7% 20.2% 38.0% 53.5% 15.8% 37.0% 10.7%
I don't know 88 88 0 0 48 40 71 11 6 3 3 4 40.6% 40.6% - - 36.1% 47.7% 54.5% 19.9% 18.9% 36.8% 22.2% 60.7%

49
Q13. What percentage of your employees are eligible for medical benefits? ______________________________________________________________________________ Proportions/Means: Columns Tested (10% risk level) - A/B/C - D/E - F/G/H - I/J/K * small base; ** very small base (under 30) ineligible for sig testing
Company Size Decision Maker Awareness Occupation
Total 2 to 49 50 to 499 500 + Primary Decision Maker
Influencer Low Medium High Manufacturing
Retail trade Finance/Insurance
A B C D E F G H I J K
Base: Respondents With Medical Plan(s) 1137 249 416 472 575 562 607 351 179 296 252 223
Weighted 1105 370* 381 354* 577 528 630 339* 136** 58 118 50
0% 6 4 0 2 2 4 6 0 0 0 0 0 0.6% 1.1% - 0.6% 0.4% 0.7% 1.0% - - - - -
1% to 25% 25 18 7 1 1 24 23 1 0 1 4 0 2.3% 4.7% 1.7% 0.3% 0.2% 4.5% 3.7% 0.4% 0.1% 1.4% 3.2% 0.9% C D
26% to 50% 76 36 22 18 43 32 24 37 15 5 12 2 6.9% 9.8% 5.7% 5.0% 7.5% 6.1% 3.9% 10.9% 10.7% 9.5% 10.3% 3.6% F K K
51% to 75% 112 46 33 33 68 44 60 37 15 8 20 4 10.2% 12.5% 8.7% 9.3% 11.8% 8.4% 9.6% 10.8% 11.4% 13.2% 17.1% 8.5% K K
76% to 99% 275 74 117 84 147 128 125 86 65 15 26 17 24.9% 20.0% 30.7% 23.8% 25.5% 24.2% 19.8% 25.3% 47.6% 26.4% 22.2% 33.2% A IJ
100% 376 139 140 97 213 163 219 121 36 21 29 19 34.0% 37.6% 36.8% 27.4% 36.9% 30.9% 34.8% 35.7% 26.3% 36.5% 25.0% 37.7% J J
I Don't Know 234 53 62 119 102 133 172 57 5 8 26 8 21.2% 14.3% 16.4% 33.7% 17.6% 25.2% 27.3% 16.8% 4.0% 13.2% 22.2% 16.1% AB G I
Summary
Mean (Incl. 0) 84.7 81.8 87.1 85.3 86.0 83.1 84.9 84.6 84.0 84.0 78.9 89.1 J IJ
Std. Dev. 21.8 25.5 19.1 19.4 19.2 24.6 23.8 20.2 17.8 21.2 23.2 16.1
Std. Err. 0.7 1.7 1.0 1.0 0.9 1.2 1.1 1.2 1.3 1.3 1.7 1.2
Mean (Excl. 0) 85.3 82.8 87.1 86.1 86.4 83.9 86.0 84.6 84.0 84.0 78.9 89.1 J IJ
Std. Dev. 20.7 23.9 19.1 17.6 18.3 23.2 21.8 20.2 17.8 21.2 23.2 16.1
Std. Err. 0.7 1.6 1.0 0.9 0.8 1.1 1.0 1.2 1.3 1.3 1.7 1.2
Median 94.1 94.9 97.0 91.8 95.1 93.7 98.3 93.5 89.2 90.8 84.5 94.1

50
Q14. Approximately what percentage of eligible employees actually enroll for your company's medical benefits? ______________________________________________________________________________ Proportions/Means: Columns Tested (10% risk level) - A/B/C - D/E - F/G/H - I/J/K * small base; ** very small base (under 30) ineligible for sig testing
Company Size Decision Maker Awareness Occupation
Total 2 to 49 50 to 499 500 + Primary Decision Maker
Influencer Low Medium High Manufacturing
Retail trade Finance/Insurance
A B C D E F G H I J K
Base: Respondents With Medical Plan(s) 1137 249 416 472 575 562 607 351 179 296 252 223
Weighted 1105 370* 381 354* 577 528 630 339* 136** 58 118 50
0% 4 4 0 0 0 4 4 0 0 0 0 0 0.4% 1.2% - - 0.1% 0.7% 0.7% - - - 0.4% -
1% to 25% 31 20 6 4 9 22 22 6 3 1 6 1 2.8% 5.5% 1.6% 1.3% 1.6% 4.1% 3.4% 1.9% 2.3% 1.7% 5.2% 2.2% I
26% to 50% 123 48 30 46 69 54 53 60 11 8 15 2 11.2% 12.9% 7.9% 12.9% 12.0% 10.2% 8.4% 17.7% 7.8% 13.9% 12.7% 4.0% F K K
51% to 75% 196 56 83 57 107 88 88 70 37 13 21 12 17.7% 15.3% 21.7% 16.1% 18.6% 16.8% 14.0% 20.8% 27.3% 22.0% 17.9% 23.8%
76% to 99% 309 80 142 86 172 137 163 90 56 16 24 16 27.9% 21.5% 37.4% 24.4% 29.8% 25.9% 25.8% 26.4% 41.5% 27.0% 20.2% 32.3% AC J J
100% 176 106 42 28 100 76 84 65 27 9 17 5 15.9% 28.6% 10.9% 8.0% 17.4% 14.3% 13.4% 19.2% 19.5% 15.5% 14.7% 10.8% BC
I Don't Know 266 56 78 132 118 147 216 47 2 11 34 13 24.0% 15.0% 20.4% 37.4% 20.5% 27.9% 34.3% 14.0% 1.6% 19.9% 29.0% 26.9% AB G I I
Summary
Mean (Incl. 0) 76.2 76.0 77.6 74.5 78.1 73.8 75.9 74.7 80.2 74.9 71.2 78.5 IJ
Std. Dev. 23.4 27.5 19.9 21.2 21.1 25.7 24.7 22.7 19.9 22.7 25.3 19.0
Std. Err. 0.8 1.9 1.1 1.2 1.0 1.3 1.3 1.3 1.5 1.5 1.9 1.5
Mean (Excl. 0) 76.6 77.1 77.6 74.5 78.2 74.6 76.8 74.7 80.2 74.9 71.6 78.5 IJ
Std. Dev. 22.8 26.2 19.9 21.2 21.0 24.7 23.6 22.7 19.9 22.7 24.8 19.0
Std. Err. 0.8 1.8 1.1 1.2 1.0 1.2 1.2 1.3 1.5 1.5 1.9 1.5
Median 79.5 79.8 79.1 78.2 81.4 79.0 79.3 78.3 82.9 76.5 74.5 79.1

51
Q15. Approximately what did your company spend on medical and prescription drug benefits last year per each active, full-time employee ...? ______________________________________________________________________________ Proportions/Means: Columns Tested (10% risk level) - A/B/C - D/E - F/G/H - I/J/K * small base; ** very small base (under 30) ineligible for sig testing
Company Size Decision Maker Awareness Occupation
Total 2 to 49 50 to 499 500 + Primary Decision Maker
Influencer Low Medium High Manufacturing
Retail trade Finance/Insurance
A B C D E F G H I J K
Base: Respondents With Medical Plan(s) 1137 249 416 472 575 562 607 351 179 296 252 223
Weighted 1105 370* 381 354* 577 528 630 339* 136** 58 118 50
$0 3 2 0 0 0 2 3 0 0 0 0 0 0.2% 0.7% - 0.1% 0 0.5% 0.4% - - 0.3% - -
$1 to $1,000 140 55 40 45 108 32 37 72 31 11 17 5 12.7% 14.7% 10.5% 12.8% 18.7% 6.0% 5.9% 21.2% 22.7% 18.9% 14.7% 9.9% E F K
$1,001 to $5,000 120 33 70 16 59 61 58 40 21 8 11 7 10.8% 9.0% 18.5% 4.5% 10.2% 11.6% 9.3% 11.8% 15.7% 13.2% 9.5% 13.0% AC
$5,001 to $10,000 88 39 36 13 51 37 39 27 22 6 7 6 8.0% 10.6% 9.5% 3.7% 8.8% 7.0% 6.2% 7.9% 16.1% 9.8% 6.0% 11.2% C J J
More than $10,000 110 37 45 28 64 46 28 43 39 4 9 4 10.0% 10.0% 11.9% 7.8% 11.1% 8.8% 4.5% 12.6% 28.7% 7.4% 7.5% 7.2% F
I Don't Know 644 203 189 252 295 349 464 158 23 29 73 29 58.3% 55.0% 49.7% 71.2% 51.2% 66.1% 73.6% 46.5% 16.8% 50.3% 62.3% 58.7% AB D G I I
Summary
Mean (Incl. 0) 18093.2 7616.0 11933.9 46813.1 18322.6 17731.9 16747.7 7972.3 36327.1 110337.5 36797.6 18592.0
Std. Dev. 215127.5 9574.3 68882.1 447702.0 249699.0 145546.7 150439.8 18278.9 394372.6 801216.4 259297.9 87585.7
Std. Err. 10041.3 889.0 5120.0 35174.8 14843.1 10971.0 12242.6 1393.8 33817.2 66083.2 26603.4 9131.4
Mean (Excl. 0) 18198.2 7730.2 11933.9 46902.7 18335.3 17979.6 17020.0 7972.3 36327.1 111093.2 36797.6 18592.0
Std. Dev. 215748.1 9600.1 68882.1 448129.5 249785.2 146550.1 151650.0 18278.9 394372.6 804001.3 259297.9 87585.7
Std. Err. 10092.3 895.2 5120.0 35317.5 14874.5 11078.1 12423.7 1393.8 33817.2 66539.6 26603.4 9131.4
Median 4425.7 4865.5 4202.7 2091.8 2926.3 4866.9 4123.0 3668.4 7233.2 2150.0 2250.0 4500.0

52
Q16. For medical benefits, approximately what percent of total costs/premiums does your company pay ... ______________________________________________________________________________ Proportions/Means: Columns Tested (10% risk level) - A/B/C - D/E - F/G/H - I/J/K * small base; ** very small base (under 30) ineligible for sig testing
Company Size Decision Maker Awareness Occupation
Total 2 to 49 50 to 499 500 + Primary Decision Maker
Influencer Low Medium High Manufacturing
Retail trade Finance/Insurance
A B C D E F G H I J K
Base: Respondents With Medical Plan(s) 1137 249 416 472 575 562 607 351 179 296 252 223
Weighted 1105 370* 381 354* 577 528 630 339* 136** 58 118 50
0% 8 0 8 0 8 0 8 0 0 0 0 0 0.7% - 2.1% - 1.4% - 1.2% 0.1% - 0.3% - -
1% to 25% 52 24 13 15 21 31 31 16 6 4 4 3 4.7% 6.6% 3.4% 4.1% 3.7% 5.8% 4.9% 4.6% 4.1% 6.8% 3.6% 6.7% J J
26% to 50% 221 69 84 68 143 78 117 65 39 10 19 6 20.0% 18.6% 22.0% 19.4% 24.8% 14.8% 18.6% 19.3% 28.6% 16.6% 16.3% 12.6% E
51% to 75% 169 73 44 52 77 92 79 55 35 14 21 11 15.3% 19.8% 11.4% 14.7% 13.4% 17.4% 12.5% 16.2% 25.8% 23.6% 17.9% 21.1% J
76% to 99% 170 41 85 44 88 82 78 63 30 11 15 9 15.4% 11.1% 22.3% 12.5% 15.3% 15.5% 12.4% 18.5% 21.8% 19.6% 12.7% 17.5% AC J
100% 103 57 29 17 52 51 52 39 11 3 7 3 9.3% 15.4% 7.5% 4.8% 9.1% 9.6% 8.3% 11.6% 8.1% 5.4% 6.0% 5.4% BC
I Don't Know 382 106 119 157 187 195 265 101 16 16 51 18 34.5% 28.5% 31.2% 44.5% 32.4% 36.9% 42.1% 29.7% 11.6% 27.7% 43.7% 36.8% AB G I I
Summary
Mean (Incl. 0) 64.9 67.3 64.0 62.7 63.3 66.7 63.5 67.7 63.4 63.4 65.6 65.1
Std. Dev. 24.7 24.9 25.1 23.6 24.9 24.4 25.3 24.2 23.5 24.1 22.1 24.8
Std. Err. 0.9 1.9 1.5 1.5 1.3 1.3 1.4 1.5 1.9 1.6 1.9 2.1
Mean (Excl. 0) 65.6 67.3 66.0 62.7 64.6 66.7 64.9 67.7 63.4 63.7 65.6 65.1
Std. Dev. 23.9 24.9 22.8 23.6 23.4 24.4 23.8 24.1 23.5 23.7 22.1 24.8
Std. Err. 0.9 1.9 1.4 1.5 1.2 1.3 1.4 1.5 1.9 1.6 1.9 2.1
Median 68.8 65.3 69.8 66.0 64.4 73.1 63.2 73.6 66.6 68.5 67.1 67.8
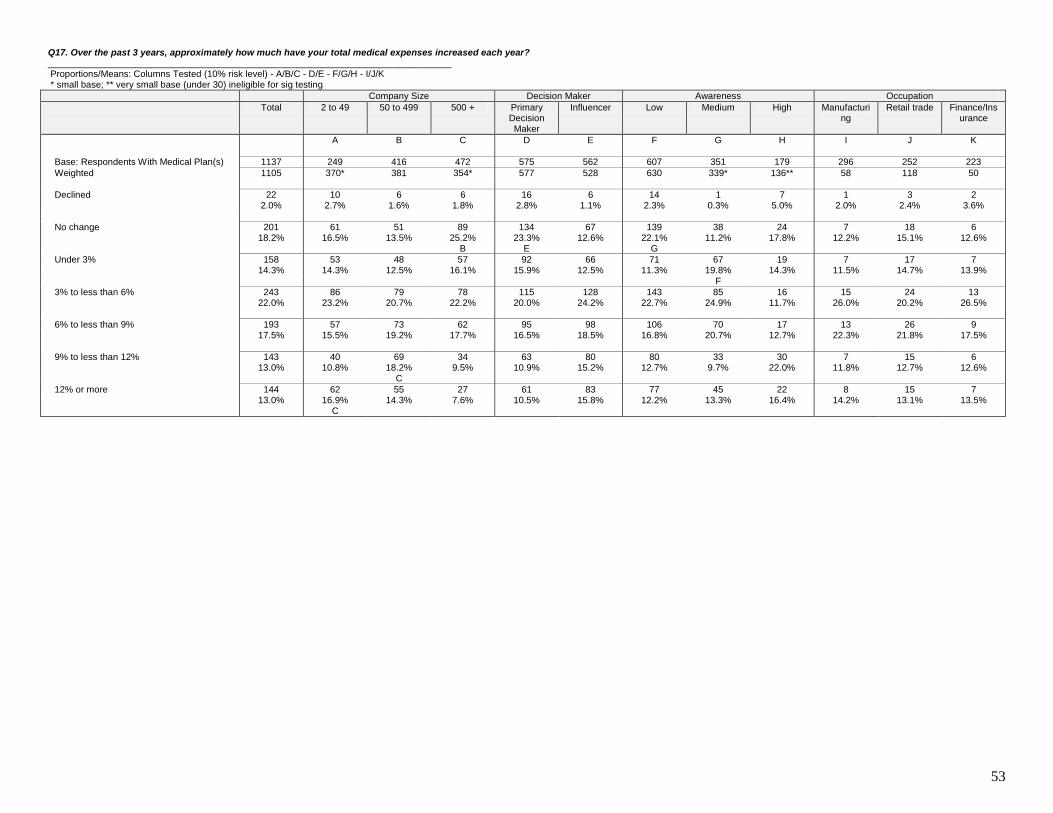
53
Q17. Over the past 3 years, approximately how much have your total medical expenses increased each year? ______________________________________________________________________________ Proportions/Means: Columns Tested (10% risk level) - A/B/C - D/E - F/G/H - I/J/K * small base; ** very small base (under 30) ineligible for sig testing
Company Size Decision Maker Awareness Occupation
Total 2 to 49 50 to 499 500 + Primary Decision Maker
Influencer Low Medium High Manufacturing
Retail trade Finance/Insurance
A B C D E F G H I J K
Base: Respondents With Medical Plan(s) 1137 249 416 472 575 562 607 351 179 296 252 223
Weighted 1105 370* 381 354* 577 528 630 339* 136** 58 118 50
Declined 22 10 6 6 16 6 14 1 7 1 3 2 2.0% 2.7% 1.6% 1.8% 2.8% 1.1% 2.3% 0.3% 5.0% 2.0% 2.4% 3.6%
No change 201 61 51 89 134 67 139 38 24 7 18 6 18.2% 16.5% 13.5% 25.2% 23.3% 12.6% 22.1% 11.2% 17.8% 12.2% 15.1% 12.6% B E G
Under 3% 158 53 48 57 92 66 71 67 19 7 17 7 14.3% 14.3% 12.5% 16.1% 15.9% 12.5% 11.3% 19.8% 14.3% 11.5% 14.7% 13.9% F
3% to less than 6% 243 86 79 78 115 128 143 85 16 15 24 13 22.0% 23.2% 20.7% 22.2% 20.0% 24.2% 22.7% 24.9% 11.7% 26.0% 20.2% 26.5%
6% to less than 9% 193 57 73 62 95 98 106 70 17 13 26 9 17.5% 15.5% 19.2% 17.7% 16.5% 18.5% 16.8% 20.7% 12.7% 22.3% 21.8% 17.5%
9% to less than 12% 143 40 69 34 63 80 80 33 30 7 15 6 13.0% 10.8% 18.2% 9.5% 10.9% 15.2% 12.7% 9.7% 22.0% 11.8% 12.7% 12.6% C
12% or more 144 62 55 27 61 83 77 45 22 8 15 7 13.0% 16.9% 14.3% 7.6% 10.5% 15.8% 12.2% 13.3% 16.4% 14.2% 13.1% 13.5% C

54
Q18. Does your company offer medical benefits for its retirees? ______________________________________________________________________________ Proportions/Means: Columns Tested (10% risk level) - A/B/C - D/E - F/G/H - I/J/K * small base; ** very small base (under 30) ineligible for sig testing
Company Size Decision Maker Awareness Occupation
Total 2 to 49 50 to 499 500 + Primary Decision Maker
Influencer Low Medium High Manufacturing
Retail trade Finance/Insurance
A B C D E F G H I J K
Base: Respondents With Medical Plan(s) 1137 249 416 472 575 562 607 351 179 296 252 223
Weighted 1105 370* 381 354* 577 528 630 339* 136** 58 118 50
Yes 379 92 120 168 263 116 186 118 74 21 28 16 34.3% 24.8% 31.4% 47.5% 45.5% 22.1% 29.6% 35.0% 54.7% 36.8% 24.2% 30.9% AB E J J
No 556 234 197 126 235 322 306 190 60 29 68 23 50.4% 63.2% 51.6% 35.6% 40.7% 60.9% 48.6% 56.0% 44.3% 49.7% 57.9% 46.6% C C D IK
I don't know 169 44 65 60 79 90 137 31 1 8 21 11 15.3% 12.0% 17.0% 16.9% 13.8% 17.0% 21.8% 9.0% 1.0% 13.5% 17.9% 22.4% G I

55
Q18a. Which of the following best describes your company's retiree medical benefits costs? ______________________________________________________________________________ Proportions/Means: Columns Tested (10% risk level) - A/B/C - D/E - F/G/H - I/J/K * small base; ** very small base (under 30) ineligible for sig testing
Company Size Decision Maker Awareness Occupation
Total 2 to 49 50 to 499 500 + Primary Decision Maker
Influencer Low Medium High Manufacturing
Retail trade Finance/Insurance
A B C D E F G H I J K
Base: Offers Medical Benefits For Retirees 378 55 107 216 230 148 165 121 92 109 61 69
Weighted 379* 92** 120** 168* 263* 116* 186* 118** 74** 21 28* 16*
Our retiree medical costs are low/minimal compared to how much we spend on for active employee benefits - not a big deal
133 48 57 28 97 36 42 46 45 7 8 6
35.1% 52.5% 47.4% 16.8% 37.0% 30.8% 22.5% 39.2% 60.3% 33.0% 27.9% 36.2%
Our retiree medical costs comprise a moderate portion of our total benefits spend each year, but still relatively small compared to what we spend on active employee medical coverage
122 26 43 53 79 43 42 55 25 9 13 6
32.2% 28.1% 36.2% 31.6% 30.1% 36.9% 22.5% 46.5% 33.8% 43.1% 44.3% 36.2%
Our retiree medical costs are significant portion of our total benefits spend each year
34 3 11 20 24 10 25 4 4 2 1 1
8.8% 2.9% 8.8% 12.1% 9.0% 8.4% 13.6% 3.6% 5.2% 9.2% 3.3% 8.7%
I don't know enough about my company's retiree medical benefits costs to answer this question
90 15 9 66 63 28 77 13 1 3 7 3
23.9% 16.4% 7.6% 39.5% 23.9% 23.9% 41.5% 10.7% 0.7% 14.7% 24.6% 18.8%

56
Q19_1. [Catastrophic or acute illness support/ recovery programs ...] Does your company currently offer the following types of health management programs for employees? ______________________________________________________________________________ Proportions/Means: Columns Tested (10% risk level) - A/B/C - D/E - F/G/H - I/J/K * small base; ** very small base (under 30) ineligible for sig testing
Company Size Decision Maker Awareness Occupation
Total 2 to 49 50 to 499 500 + Primary Decision Maker
Influencer Low Medium High Manufacturing
Retail trade Finance/Insurance
A B C D E F G H I J K
Base: All Respondents 1329 336 458 535 672 657 758 384 187 321 329 250
Weighted 1329 508 426 395* 683 646 813 378* 138** 62 154 56
Catastrophic or acute illness support/ recovery programs ...
Yes 506 119 199 188 305 201 227 175 104 30 52 20 38.1% 23.4% 46.8% 47.6% 44.6% 31.2% 27.9% 46.3% 75.5% 47.4% 33.7% 35.6% A A E F JK
No 639 342 176 120 294 345 437 169 32 26 73 27 48.1% 67.4% 41.4% 30.4% 43.0% 53.4% 53.8% 44.7% 23.4% 41.1% 47.7% 48.4% BC C D I I
I don't know 184 46 51 87 85 99 148 34 2 7 28 9 13.9% 9.2% 11.9% 22.0% 12.4% 15.4% 18.3% 9.0% 1.2% 11.5% 18.5% 16.0% AB G I

57
Q19_2. [Chronic disease management ...] Does your company currently offer the following types of health management programs for employees? ______________________________________________________________________________ Proportions/Means: Columns Tested (10% risk level) - A/B/C - D/E - F/G/H - I/J/K * small base; ** very small base (under 30) ineligible for sig testing
Company Size Decision Maker Awareness Occupation
Total 2 to 49 50 to 499 500 + Primary Decision Maker
Influencer Low Medium High Manufacturing
Retail trade Finance/Insurance
A B C D E F G H I J K
Base: All Respondents 1329 336 458 535 672 657 758 384 187 321 329 250
Weighted 1329 508 426 395* 683 646 813 378* 138** 62 154 56
Chronic disease management ...
Yes 486 106 193 186 294 192 230 168 88 29 51 22 36.5% 21.0% 45.3% 47.1% 43.0% 29.7% 28.3% 44.4% 63.4% 47.0% 33.1% 39.6% A A E F JK
No 654 351 184 119 310 344 437 168 49 26 74 27 49.2% 69.2% 43.3% 30.0% 45.4% 53.2% 53.8% 44.3% 35.6% 41.7% 48.3% 47.6% BC C I
I don't know 189 50 48 91 79 110 145 42 1 7 28 7 14.2% 9.9% 11.4% 22.9% 11.6% 17.0% 17.9% 11.2% 1.0% 11.2% 18.5% 12.8% AB IK

58
Q19_3. [Smoking cessation] Does your company currently offer the following types of health management programs for employees? ______________________________________________________________________________ Proportions/Means: Columns Tested (10% risk level) - A/B/C - D/E - F/G/H - I/J/K * small base; ** very small base (under 30) ineligible for sig testing
Company Size Decision Maker Awareness Occupation
Total 2 to 49 50 to 499 500 + Primary Decision Maker
Influencer Low Medium High Manufacturing
Retail trade Finance/Insurance
A B C D E F G H I J K
Base: All Respondents 1329 336 458 535 672 657 758 384 187 321 329 250
Weighted 1329 508 426 395* 683 646 813 378* 138** 62 154 56
Smoking cessation
Yes 478 80 181 217 292 186 249 135 94 30 54 26 36.0% 15.8% 42.5% 55.0% 42.7% 28.8% 30.7% 35.7% 67.8% 47.4% 35.3% 46.4% A AB E J J
No 699 388 203 108 312 387 461 195 43 28 78 24 52.6% 76.3% 47.7% 27.3% 45.7% 59.9% 56.8% 51.5% 31.0% 44.9% 50.5% 42.4% BC C D K
I don't know 152 40 42 70 79 73 102 48 2 5 22 6 11.4% 7.9% 9.8% 17.7% 11.6% 11.3% 12.5% 12.8% 1.2% 7.8% 14.3% 11.2% AB I

59
Q19_4. [Diet/ nutrition / health coaching] Does your company currently offer the following types of health management programs for employees? ______________________________________________________________________________ Proportions/Means: Columns Tested (10% risk level) - A/B/C - D/E - F/G/H - I/J/K * small base; ** very small base (under 30) ineligible for sig testing
Company Size Decision Maker Awareness Occupation
Total 2 to 49 50 to 499 500 + Primary Decision Maker
Influencer Low Medium High Manufacturing
Retail trade Finance/Insurance
A B C D E F G H I J K
Base: All Respondents 1329 336 458 535 672 657 758 384 187 321 329 250
Weighted 1329 508 426 395* 683 646 813 378* 138** 62 154 56
Diet/ nutrition / health coaching
Yes 500 98 188 215 306 194 263 145 92 25 50 25 37.7% 19.3% 44.0% 54.3% 44.8% 30.1% 32.4% 38.3% 66.9% 39.9% 32.8% 44.4% A A E J J
No 691 382 193 116 318 373 448 198 45 32 79 25 52.0% 75.2% 45.3% 29.4% 46.5% 57.8% 55.1% 52.5% 32.4% 50.8% 51.4% 44.0% BC C D K
I don't know 138 28 45 65 59 78 102 35 1 6 24 7 10.4% 5.5% 10.7% 16.3% 8.7% 12.2% 12.5% 9.3% 0.7% 9.3% 15.8% 11.6% A I

60
Q19_5. [Obesity / Weight-loss programs] Does your company currently offer the following types of health management programs for employees? ______________________________________________________________________________ Proportions/Means: Columns Tested (10% risk level) - A/B/C - D/E - F/G/H - I/J/K * small base; ** very small base (under 30) ineligible for sig testing
Company Size Decision Maker Awareness Occupation
Total 2 to 49 50 to 499 500 + Primary Decision Maker
Influencer Low Medium High Manufacturing
Retail trade Finance/Insurance
A B C D E F G H I J K
Base: All Respondents 1329 336 458 535 672 657 758 384 187 321 329 250
Weighted 1329 508 426 395* 683 646 813 378* 138** 62 154 56
Obesity / Weight-loss programs
Yes 450 83 182 185 284 166 230 126 93 25 49 25 33.9% 16.3% 42.8% 46.8% 41.6% 25.8% 28.4% 33.4% 67.7% 40.8% 32.2% 43.6% A A E J J
No 734 396 199 139 327 408 480 211 44 31 79 25 55.2% 77.9% 46.8% 35.1% 47.8% 63.1% 59.0% 55.7% 31.8% 49.2% 51.4% 45.2% BC C D
I don't know 145 29 44 72 73 72 103 41 1 6 25 6 10.9% 5.7% 10.3% 18.1% 10.7% 11.1% 12.6% 10.9% 0.6% 10.0% 16.4% 11.2% A IK

61
Q19_6. [Exercise promotion] Does your company currently offer the following types of health management programs for employees? ______________________________________________________________________________ Proportions/Means: Columns Tested (10% risk level) - A/B/C - D/E - F/G/H - I/J/K * small base; ** very small base (under 30) ineligible for sig testing
Company Size Decision Maker Awareness Occupation
Total 2 to 49 50 to 499 500 + Primary Decision Maker
Influencer Low Medium High Manufacturing
Retail trade Finance/Insurance
A B C D E F G H I J K
Base: All Respondents 1329 336 458 535 672 657 758 384 187 321 329 250
Weighted 1329 508 426 395* 683 646 813 378* 138** 62 154 56
Exercise promotion
Yes 608 150 223 235 361 247 328 173 107 29 55 30 45.8% 29.5% 52.4% 59.4% 52.8% 38.3% 40.4% 45.7% 77.3% 46.7% 35.6% 52.8% A A E J J
No 607 337 169 101 276 331 406 171 30 28 78 21 45.7% 66.4% 39.7% 25.5% 40.4% 51.2% 49.9% 45.3% 21.8% 45.2% 50.5% 37.6% BC C D K K
I don't know 114 21 34 60 46 68 79 34 1 5 21 5 8.6% 4.1% 7.9% 15.1% 6.8% 10.5% 9.7% 9.0% 0.9% 8.1% 14.0% 9.6% A I
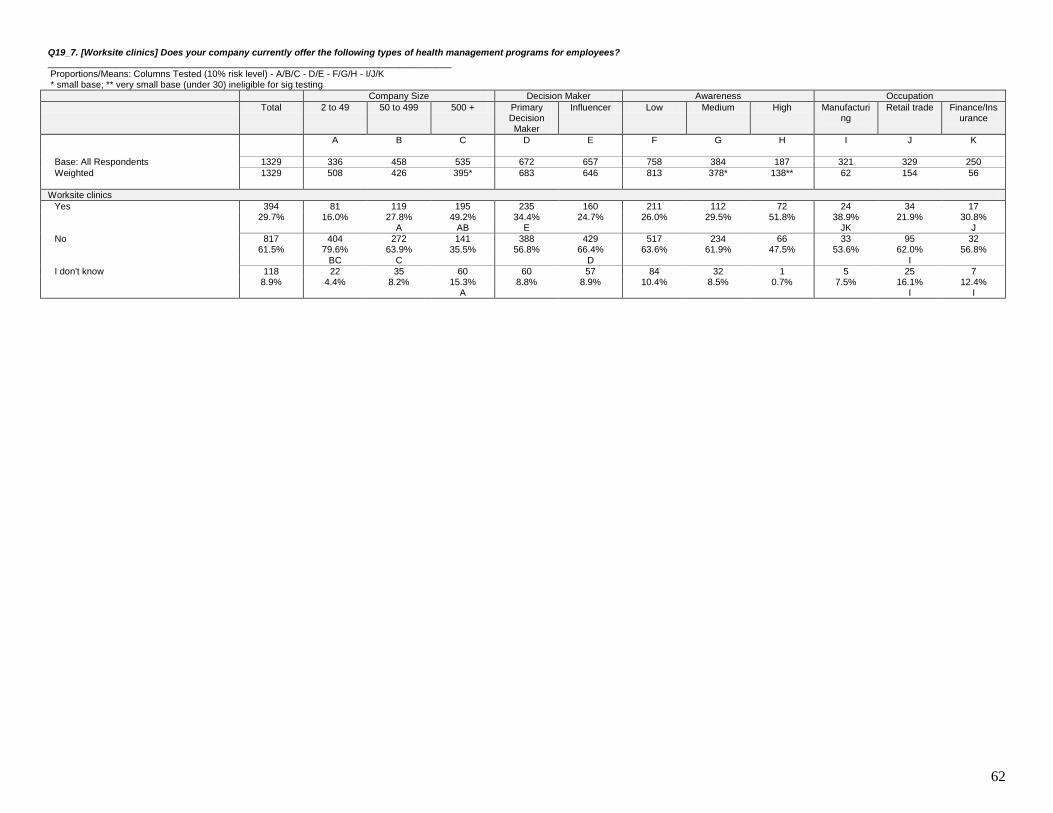
62
Q19_7. [Worksite clinics] Does your company currently offer the following types of health management programs for employees? ______________________________________________________________________________ Proportions/Means: Columns Tested (10% risk level) - A/B/C - D/E - F/G/H - I/J/K * small base; ** very small base (under 30) ineligible for sig testing
Company Size Decision Maker Awareness Occupation
Total 2 to 49 50 to 499 500 + Primary Decision Maker
Influencer Low Medium High Manufacturing
Retail trade Finance/Insurance
A B C D E F G H I J K
Base: All Respondents 1329 336 458 535 672 657 758 384 187 321 329 250
Weighted 1329 508 426 395* 683 646 813 378* 138** 62 154 56
Worksite clinics
Yes 394 81 119 195 235 160 211 112 72 24 34 17 29.7% 16.0% 27.8% 49.2% 34.4% 24.7% 26.0% 29.5% 51.8% 38.9% 21.9% 30.8% A AB E JK J
No 817 404 272 141 388 429 517 234 66 33 95 32 61.5% 79.6% 63.9% 35.5% 56.8% 66.4% 63.6% 61.9% 47.5% 53.6% 62.0% 56.8% BC C D I
I don't know 118 22 35 60 60 57 84 32 1 5 25 7 8.9% 4.4% 8.2% 15.3% 8.8% 8.9% 10.4% 8.5% 0.7% 7.5% 16.1% 12.4% A I I
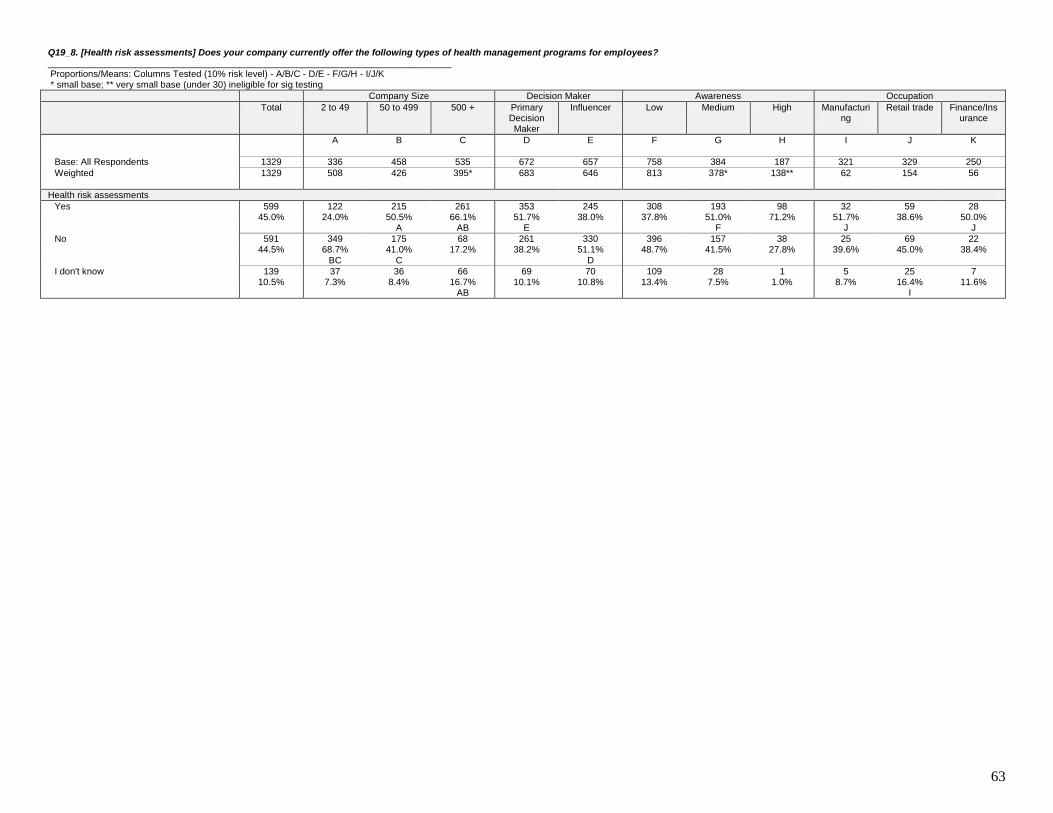
63
Q19_8. [Health risk assessments] Does your company currently offer the following types of health management programs for employees? ______________________________________________________________________________ Proportions/Means: Columns Tested (10% risk level) - A/B/C - D/E - F/G/H - I/J/K * small base; ** very small base (under 30) ineligible for sig testing
Company Size Decision Maker Awareness Occupation
Total 2 to 49 50 to 499 500 + Primary Decision Maker
Influencer Low Medium High Manufacturing
Retail trade Finance/Insurance
A B C D E F G H I J K
Base: All Respondents 1329 336 458 535 672 657 758 384 187 321 329 250
Weighted 1329 508 426 395* 683 646 813 378* 138** 62 154 56
Health risk assessments
Yes 599 122 215 261 353 245 308 193 98 32 59 28 45.0% 24.0% 50.5% 66.1% 51.7% 38.0% 37.8% 51.0% 71.2% 51.7% 38.6% 50.0% A AB E F J J
No 591 349 175 68 261 330 396 157 38 25 69 22 44.5% 68.7% 41.0% 17.2% 38.2% 51.1% 48.7% 41.5% 27.8% 39.6% 45.0% 38.4% BC C D
I don't know 139 37 36 66 69 70 109 28 1 5 25 7 10.5% 7.3% 8.4% 16.7% 10.1% 10.8% 13.4% 7.5% 1.0% 8.7% 16.4% 11.6% AB I

64
Q19_9. [Stress management] Does your company currently offer the following types of health management programs for employees? ______________________________________________________________________________ Proportions/Means: Columns Tested (10% risk level) - A/B/C - D/E - F/G/H - I/J/K * small base; ** very small base (under 30) ineligible for sig testing
Company Size Decision Maker Awareness Occupation
Total 2 to 49 50 to 499 500 + Primary Decision Maker
Influencer Low Medium High Manufacturing
Retail trade Finance/Insurance
A B C D E F G H I J K
Base: All Respondents 1329 336 458 535 672 657 758 384 187 321 329 250
Weighted 1329 508 426 395* 683 646 813 378* 138** 62 154 56
Stress management
Yes 477 92 189 196 296 182 241 134 102 29 54 26 35.9% 18.1% 44.5% 49.6% 43.2% 28.2% 29.7% 35.5% 74.1% 46.7% 35.3% 45.6% A A E J J
No 697 373 203 121 311 386 452 211 34 27 75 24 52.5% 73.6% 47.6% 30.5% 45.5% 59.8% 55.6% 55.8% 24.6% 43.0% 48.6% 42.0% BC C D
I don't know 154 42 34 78 77 77 119 33 2 6 25 7 11.6% 8.4% 7.9% 19.8% 11.3% 12.0% 14.7% 8.7% 1.4% 10.3% 16.1% 12.4% AB I
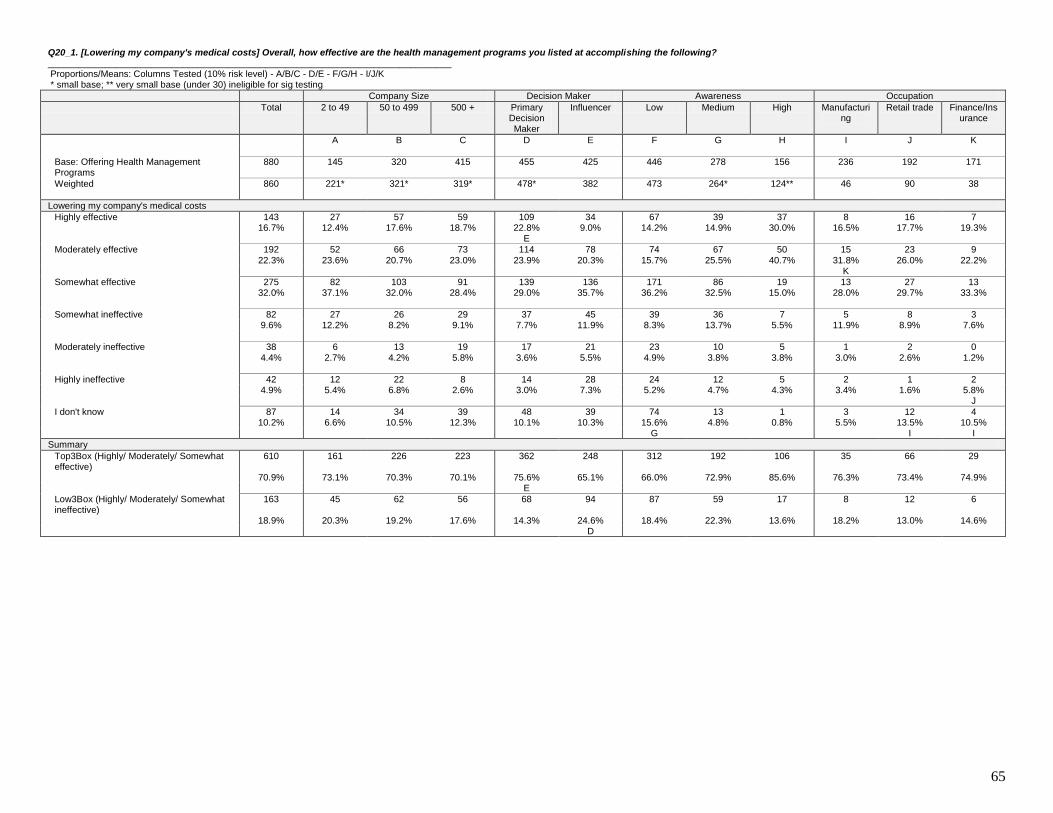
65
Q20_1. [Lowering my company's medical costs] Overall, how effective are the health management programs you listed at accomplishing the following? ______________________________________________________________________________ Proportions/Means: Columns Tested (10% risk level) - A/B/C - D/E - F/G/H - I/J/K * small base; ** very small base (under 30) ineligible for sig testing
Company Size Decision Maker Awareness Occupation
Total 2 to 49 50 to 499 500 + Primary Decision Maker
Influencer Low Medium High Manufacturing
Retail trade Finance/Insurance
A B C D E F G H I J K
Base: Offering Health Management Programs
880 145 320 415 455 425 446 278 156 236 192 171
Weighted 860 221* 321* 319* 478* 382 473 264* 124** 46 90 38
Lowering my company's medical costs
Highly effective 143 27 57 59 109 34 67 39 37 8 16 7 16.7% 12.4% 17.6% 18.7% 22.8% 9.0% 14.2% 14.9% 30.0% 16.5% 17.7% 19.3% E
Moderately effective 192 52 66 73 114 78 74 67 50 15 23 9 22.3% 23.6% 20.7% 23.0% 23.9% 20.3% 15.7% 25.5% 40.7% 31.8% 26.0% 22.2% K
Somewhat effective 275 82 103 91 139 136 171 86 19 13 27 13 32.0% 37.1% 32.0% 28.4% 29.0% 35.7% 36.2% 32.5% 15.0% 28.0% 29.7% 33.3%
Somewhat ineffective 82 27 26 29 37 45 39 36 7 5 8 3 9.6% 12.2% 8.2% 9.1% 7.7% 11.9% 8.3% 13.7% 5.5% 11.9% 8.9% 7.6%
Moderately ineffective 38 6 13 19 17 21 23 10 5 1 2 0 4.4% 2.7% 4.2% 5.8% 3.6% 5.5% 4.9% 3.8% 3.8% 3.0% 2.6% 1.2%
Highly ineffective 42 12 22 8 14 28 24 12 5 2 1 2 4.9% 5.4% 6.8% 2.6% 3.0% 7.3% 5.2% 4.7% 4.3% 3.4% 1.6% 5.8% J
I don't know 87 14 34 39 48 39 74 13 1 3 12 4 10.2% 6.6% 10.5% 12.3% 10.1% 10.3% 15.6% 4.8% 0.8% 5.5% 13.5% 10.5% G I I
Summary
Top3Box (Highly/ Moderately/ Somewhat effective)
610 161 226 223 362 248 312 192 106 35 66 29
70.9% 73.1% 70.3% 70.1% 75.6% 65.1% 66.0% 72.9% 85.6% 76.3% 73.4% 74.9% E
Low3Box (Highly/ Moderately/ Somewhat ineffective)
163 45 62 56 68 94 87 59 17 8 12 6
18.9% 20.3% 19.2% 17.6% 14.3% 24.6% 18.4% 22.3% 13.6% 18.2% 13.0% 14.6% D

66
Q20_2. [Improving employee health and/or productivity] Overall, how effective are the health management programs you listed at accomplishing the following? ______________________________________________________________________________ Proportions/Means: Columns Tested (10% risk level) - A/B/C - D/E - F/G/H - I/J/K * small base; ** very small base (under 30) ineligible for sig testing
Company Size Decision Maker Awareness Occupation
Total 2 to 49 50 to 499 500 + Primary Decision Maker
Influencer Low Medium High Manufacturing
Retail trade Finance/Insurance
A B C D E F G H I J K
Base: Offering Health Management Programs
880 145 320 415 455 425 446 278 156 236 192 171
Weighted 860 221* 321* 319* 478* 382 473 264* 124** 46 90 38
Improving employee health and/or productivity
Highly effective 185 47 71 67 148 37 82 60 42 9 16 9 21.5% 21.5% 22.0% 21.0% 31.0% 9.6% 17.4% 22.9% 34.3% 19.9% 18.2% 22.8% E
Moderately effective 237 64 85 88 140 97 109 69 59 17 26 10 27.5% 28.8% 26.5% 27.7% 29.2% 25.5% 23.1% 26.2% 47.5% 37.3% 29.2% 25.1% JK
Somewhat effective 263 65 92 106 108 155 159 93 11 12 31 13 30.6% 29.3% 28.8% 33.3% 22.5% 40.7% 33.5% 35.4% 8.9% 26.7% 34.9% 32.7% D I
Somewhat ineffective 65 15 36 14 21 45 41 18 6 3 4 3 7.6% 6.6% 11.3% 4.5% 4.3% 11.7% 8.7% 7.0% 4.9% 6.4% 4.2% 7.6% D
Moderately ineffective 20 7 3 10 14 6 7 8 5 2 3 1 2.3% 3.2% 0.8% 3.2% 2.9% 1.7% 1.5% 3.2% 3.6% 4.2% 3.1% 1.8%
Highly ineffective 22 6 10 6 10 12 14 7 1 0 0 1 2.5% 2.6% 3.1% 2.0% 2.0% 3.2% 3.0% 2.7% 0.7% 0.4% 0.5% 2.3% IJ
I don't know 68 18 24 27 39 29 61 7 0 2 9 3 7.9% 8.0% 7.4% 8.3% 8.1% 7.6% 12.9% 2.7% - 5.1% 9.9% 7.6% G I
Summary
Top3Box (Highly/ Moderately/ Somewhat effective)
685 176 248 261 395 289 350 223 112 39 74 31
79.6% 79.6% 77.3% 81.9% 82.6% 75.8% 74.0% 84.4% 90.8% 83.9% 82.3% 80.7%
Low3Box (Highly/ Moderately/ Somewhat ineffective)
107 27 49 31 44 63 62 34 11 5 7 4
12.5% 12.4% 15.3% 9.7% 9.2% 16.6% 13.1% 12.8% 9.2% 11.0% 7.8% 11.7%

67
Q20_3. [Increasing employee satisfaction] Overall, how effective are the health management programs you listed at accomplishing the following? ______________________________________________________________________________ Proportions/Means: Columns Tested (10% risk level) - A/B/C - D/E - F/G/H - I/J/K * small base; ** very small base (under 30) ineligible for sig testing
Company Size Decision Maker Awareness Occupation
Total 2 to 49 50 to 499 500 + Primary Decision Maker
Influencer Low Medium High Manufacturing
Retail trade Finance/Insurance
A B C D E F G H I J K
Base: Offering Health Management Programs
880 145 320 415 455 425 446 278 156 236 192 171
Weighted 860 221* 321* 319* 478* 382 473 264* 124** 46 90 38
Increasing employee satisfaction
Highly effective 193 54 70 68 141 51 82 66 44 10 22 9 22.4% 24.5% 21.8% 21.5% 29.5% 13.4% 17.4% 25.2% 35.5% 21.2% 24.5% 24.0% E
Moderately effective 223 68 58 96 137 86 118 53 52 16 24 11 25.9% 31.0% 18.1% 30.2% 28.6% 22.5% 25.0% 20.1% 41.7% 34.7% 27.1% 29.8% B B J
Somewhat effective 265 57 123 85 123 142 142 100 24 11 27 12 30.8% 25.9% 38.2% 26.7% 25.7% 37.2% 29.9% 37.8% 19.1% 24.6% 29.7% 30.4% D
Somewhat ineffective 65 9 29 27 19 46 43 21 1 4 5 2 7.5% 4.0% 9.0% 8.5% 4.1% 11.9% 9.1% 8.1% 0.5% 8.1% 5.7% 4.1% D
Moderately ineffective 26 15 2 9 9 17 15 8 3 2 2 1 3.0% 6.8% 0.6% 2.9% 2.0% 4.4% 3.3% 2.9% 2.4% 5.1% 2.6% 1.8% B K
Highly ineffective 21 6 10 5 11 11 13 8 1 1 2 1 2.5% 2.6% 3.2% 1.6% 2.3% 2.8% 2.7% 2.9% 0.7% 1.3% 2.1% 2.3%
I don't know 68 11 29 27 38 30 60 8 0 2 7 3 7.9% 5.1% 9.0% 8.6% 7.9% 7.8% 12.7% 2.9% - 5.1% 8.3% 7.6% G
Summary
Top3Box (Highly/ Moderately/ Somewhat effective)
680 180 251 250 401 279 342 219 119 37 73 32
79.1% 81.5% 78.1% 78.4% 83.9% 73.1% 72.3% 83.1% 96.3% 80.5% 81.2% 84.2% E
Low3Box (Highly/ Moderately/ Somewhat ineffective)
112 30 41 41 40 73 71 37 5 7 9 3
13.1% 13.4% 12.9% 13.0% 8.3% 19.1% 15.0% 14.0% 3.7% 14.4% 10.4% 8.2% D K
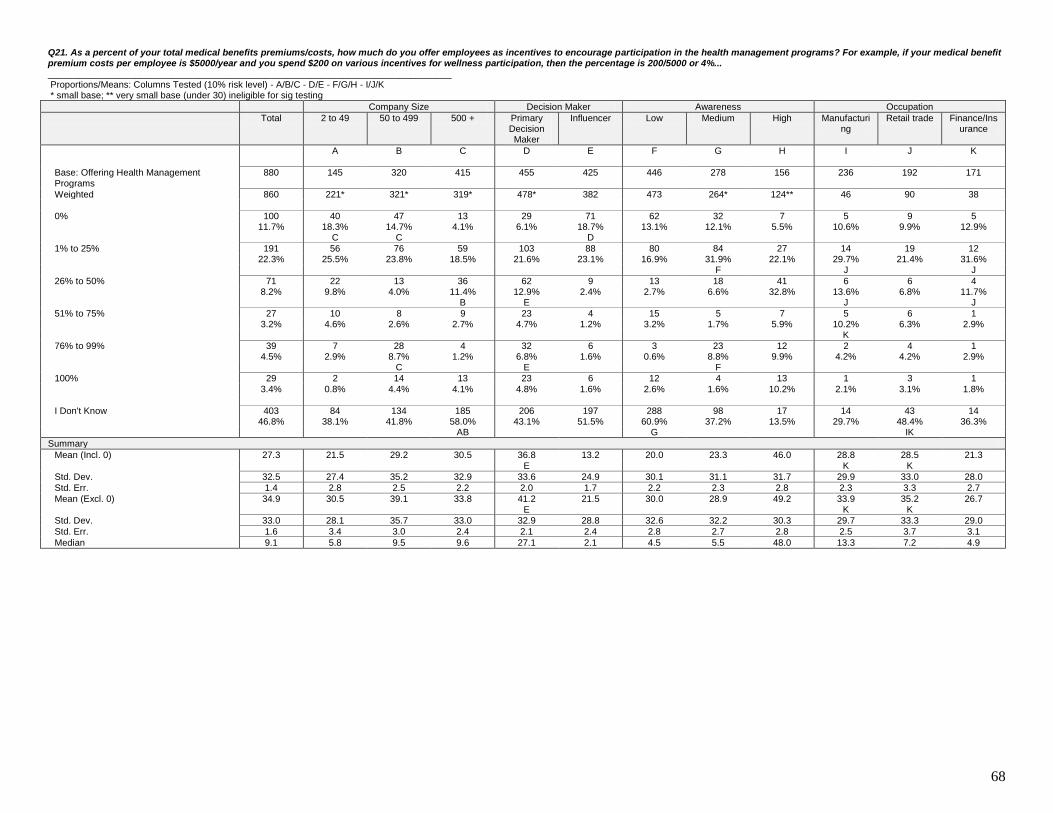
68
Q21. As a percent of your total medical benefits premiums/costs, how much do you offer employees as incentives to encourage participation in the health management programs? For example, if your medical benefit premium costs per employee is $5000/year and you spend $200 on various incentives for wellness participation, then the percentage is 200/5000 or 4%... ______________________________________________________________________________ Proportions/Means: Columns Tested (10% risk level) - A/B/C - D/E - F/G/H - I/J/K * small base; ** very small base (under 30) ineligible for sig testing
Company Size Decision Maker Awareness Occupation
Total 2 to 49 50 to 499 500 + Primary Decision Maker
Influencer Low Medium High Manufacturing
Retail trade Finance/Insurance
A B C D E F G H I J K
Base: Offering Health Management Programs
880 145 320 415 455 425 446 278 156 236 192 171
Weighted 860 221* 321* 319* 478* 382 473 264* 124** 46 90 38
0% 100 40 47 13 29 71 62 32 7 5 9 5 11.7% 18.3% 14.7% 4.1% 6.1% 18.7% 13.1% 12.1% 5.5% 10.6% 9.9% 12.9% C C D
1% to 25% 191 56 76 59 103 88 80 84 27 14 19 12 22.3% 25.5% 23.8% 18.5% 21.6% 23.1% 16.9% 31.9% 22.1% 29.7% 21.4% 31.6% F J J
26% to 50% 71 22 13 36 62 9 13 18 41 6 6 4 8.2% 9.8% 4.0% 11.4% 12.9% 2.4% 2.7% 6.6% 32.8% 13.6% 6.8% 11.7% B E J J
51% to 75% 27 10 8 9 23 4 15 5 7 5 6 1 3.2% 4.6% 2.6% 2.7% 4.7% 1.2% 3.2% 1.7% 5.9% 10.2% 6.3% 2.9% K
76% to 99% 39 7 28 4 32 6 3 23 12 2 4 1 4.5% 2.9% 8.7% 1.2% 6.8% 1.6% 0.6% 8.8% 9.9% 4.2% 4.2% 2.9% C E F
100% 29 2 14 13 23 6 12 4 13 1 3 1 3.4% 0.8% 4.4% 4.1% 4.8% 1.6% 2.6% 1.6% 10.2% 2.1% 3.1% 1.8%
I Don't Know 403 84 134 185 206 197 288 98 17 14 43 14 46.8% 38.1% 41.8% 58.0% 43.1% 51.5% 60.9% 37.2% 13.5% 29.7% 48.4% 36.3% AB G IK
Summary
Mean (Incl. 0) 27.3 21.5 29.2 30.5 36.8 13.2 20.0 23.3 46.0 28.8 28.5 21.3 E K K
Std. Dev. 32.5 27.4 35.2 32.9 33.6 24.9 30.1 31.1 31.7 29.9 33.0 28.0
Std. Err. 1.4 2.8 2.5 2.2 2.0 1.7 2.2 2.3 2.8 2.3 3.3 2.7
Mean (Excl. 0) 34.9 30.5 39.1 33.8 41.2 21.5 30.0 28.9 49.2 33.9 35.2 26.7 E K K
Std. Dev. 33.0 28.1 35.7 33.0 32.9 28.8 32.6 32.2 30.3 29.7 33.3 29.0
Std. Err. 1.6 3.4 3.0 2.4 2.1 2.4 2.8 2.7 2.8 2.5 3.7 3.1
Median 9.1 5.8 9.5 9.6 27.1 2.1 4.5 5.5 48.0 13.3 7.2 4.9

69
Q22_1. [Catastrophic or acute illnesses or injuries ...] Thinking about your company's employee population overall, how concerning is each of the following health issues? That is, what 'keeps you up at night' regarding employee health? ______________________________________________________________________________ Proportions/Means: Columns Tested (10% risk level) - A/B/C - D/E - F/G/H - I/J/K * small base; ** very small base (under 30) ineligible for sig testing
Company Size Decision Maker Awareness Occupation
Total 2 to 49 50 to 499 500 + Primary Decision Maker
Influencer Low Medium High Manufacturing
Retail trade Finance/Insurance
A B C D E F G H I J K
Base: All Respondents 1329 336 458 535 672 657 758 384 187 321 329 250
Weighted 1329 508 426 395* 683 646 813 378* 138** 62 154 56
Catastrophic or acute illnesses or injuries ...
Major concern 365 100 133 131 222 143 191 120 55 22 43 13 27.5% 19.8% 31.3% 33.3% 32.5% 22.2% 23.5% 31.6% 39.5% 34.6% 28.3% 23.6% A A E JK
Somewhat of a concern 609 206 199 204 291 319 360 176 73 28 67 29 45.8% 40.5% 46.8% 51.7% 42.5% 49.4% 44.4% 46.6% 52.5% 44.9% 43.5% 50.8% J
Not a concern 355 202 93 60 171 184 261 82 11 13 43 14 26.7% 39.8% 21.9% 15.1% 25.0% 28.5% 32.2% 21.8% 8.0% 20.6% 28.3% 25.6% BC G I

70
Q22_2. [Chronic illnesses ...] Thinking about your company's employee population overall, how concerning is each of the following health issues? That is, what 'keeps you up at night' regarding employee health? ______________________________________________________________________________ Proportions/Means: Columns Tested (10% risk level) - A/B/C - D/E - F/G/H - I/J/K * small base; ** very small base (under 30) ineligible for sig testing
Company Size Decision Maker Awareness Occupation
Total 2 to 49 50 to 499 500 + Primary Decision Maker
Influencer Low Medium High Manufacturing
Retail trade Finance/Insurance
A B C D E F G H I J K
Base: All Respondents 1329 336 458 535 672 657 758 384 187 321 329 250
Weighted 1329 508 426 395* 683 646 813 378* 138** 62 154 56
Chronic illnesses ...
Major concern 392 99 139 154 255 137 200 123 69 24 47 18 29.5% 19.5% 32.7% 38.9% 37.4% 21.2% 24.6% 32.6% 50.1% 38.3% 30.4% 31.6% A A E JK
Somewhat of a concern 577 202 197 178 271 306 351 169 57 27 64 27 43.4% 39.8% 46.2% 45.1% 39.7% 47.3% 43.1% 44.7% 41.4% 43.0% 41.9% 48.0%
Not a concern 360 206 90 63 157 203 262 86 12 12 42 11 27.1% 40.6% 21.1% 16.0% 22.9% 31.5% 32.3% 22.7% 8.5% 18.7% 27.7% 20.4% BC D G IK

71
Q22_3. [Smoking] Thinking about your company's employee population overall, how concerning is each of the following health issues? That is, what 'keeps you up at night' regarding employee health? ______________________________________________________________________________ Proportions/Means: Columns Tested (10% risk level) - A/B/C - D/E - F/G/H - I/J/K * small base; ** very small base (under 30) ineligible for sig testing
Company Size Decision Maker Awareness Occupation
Total 2 to 49 50 to 499 500 + Primary Decision Maker
Influencer Low Medium High Manufacturing
Retail trade Finance/Insurance
A B C D E F G H I J K
Base: All Respondents 1329 336 458 535 672 657 758 384 187 321 329 250
Weighted 1329 508 426 395* 683 646 813 378* 138** 62 154 56
Smoking
Major concern 321 96 105 120 207 114 172 87 62 20 41 14 24.2% 18.9% 24.6% 30.4% 30.3% 17.7% 21.2% 23.1% 44.6% 32.4% 26.7% 25.6% A E K
Somewhat of a concern 537 163 193 181 245 292 284 197 56 27 61 22 40.4% 32.2% 45.2% 45.9% 35.9% 45.2% 35.0% 52.1% 40.6% 42.7% 39.8% 40.0% A A D F
Not a concern 470 248 128 94 231 239 356 94 20 16 51 19 35.4% 48.9% 30.1% 23.7% 33.8% 37.1% 43.9% 24.8% 14.7% 24.9% 33.4% 34.4% BC G I I

72
Q22_4. [Obesity] Thinking about your company's employee population overall, how concerning is each of the following health issues? That is, what 'keeps you up at night' regarding employee health? ______________________________________________________________________________ Proportions/Means: Columns Tested (10% risk level) - A/B/C - D/E - F/G/H - I/J/K * small base; ** very small base (under 30) ineligible for sig testing
Company Size Decision Maker Awareness Occupation
Total 2 to 49 50 to 499 500 + Primary Decision Maker
Influencer Low Medium High Manufacturing
Retail trade Finance/Insurance
A B C D E F G H I J K
Base: All Respondents 1329 336 458 535 672 657 758 384 187 321 329 250
Weighted 1329 508 426 395* 683 646 813 378* 138** 62 154 56
Obesity
Major concern 307 81 99 127 216 91 150 93 64 17 34 14 23.1% 16.0% 23.2% 32.1% 31.6% 14.2% 18.5% 24.5% 46.6% 26.8% 21.9% 25.6% A E
Somewhat of a concern 525 158 185 181 235 290 293 173 60 30 64 26 39.5% 31.1% 43.5% 45.9% 34.4% 44.9% 36.0% 45.6% 43.1% 48.0% 41.6% 46.8% A A D
Not a concern 497 268 142 87 233 264 370 113 14 16 56 16 37.4% 52.8% 33.2% 22.0% 34.0% 41.0% 45.5% 29.8% 10.4% 25.2% 36.5% 27.6% BC C G IK

73
Q22_5. [Mental health] Thinking about your company's employee population overall, how concerning is each of the following health issues? That is, what 'keeps you up at night' regarding employee health? ______________________________________________________________________________ Proportions/Means: Columns Tested (10% risk level) - A/B/C - D/E - F/G/H - I/J/K * small base; ** very small base (under 30) ineligible for sig testing
Company Size Decision Maker Awareness Occupation
Total 2 to 49 50 to 499 500 + Primary Decision Maker
Influencer Low Medium High Manufacturing
Retail trade Finance/Insurance
A B C D E F G H I J K
Base: All Respondents 1329 336 458 535 672 657 758 384 187 321 329 250
Weighted 1329 508 426 395* 683 646 813 378* 138** 62 154 56
Mental health
Major concern 260 64 83 113 178 82 132 76 52 16 28 13 19.6% 12.6% 19.5% 28.6% 26.1% 12.7% 16.3% 20.2% 37.4% 25.2% 18.5% 24.0% A E J
Somewhat of a concern 552 160 212 180 249 303 305 189 58 27 68 24 41.6% 31.5% 49.8% 45.6% 36.5% 46.9% 37.6% 49.9% 42.1% 43.9% 44.1% 42.8% A A D F
Not a concern 517 284 131 102 256 261 375 113 28 19 57 19 38.9% 55.9% 30.7% 25.9% 37.5% 40.4% 46.1% 29.9% 20.5% 30.8% 37.4% 33.2% BC G I
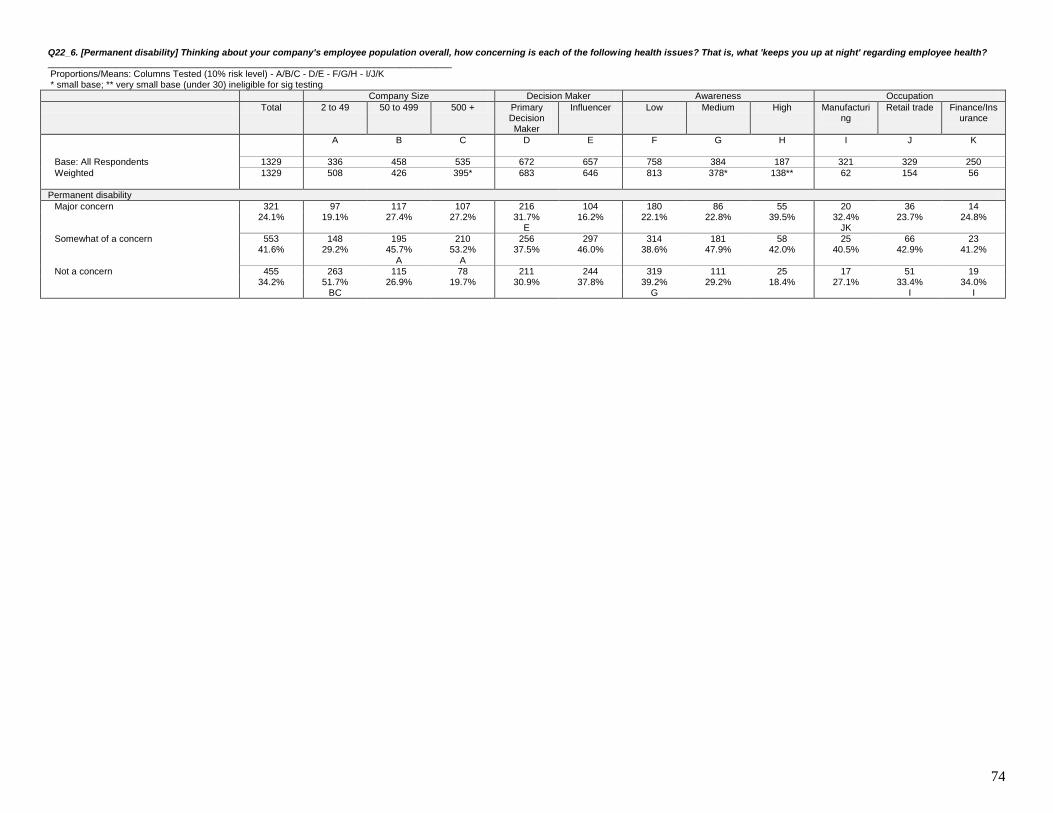
74
Q22_6. [Permanent disability] Thinking about your company's employee population overall, how concerning is each of the following health issues? That is, what 'keeps you up at night' regarding employee health? ______________________________________________________________________________ Proportions/Means: Columns Tested (10% risk level) - A/B/C - D/E - F/G/H - I/J/K * small base; ** very small base (under 30) ineligible for sig testing
Company Size Decision Maker Awareness Occupation
Total 2 to 49 50 to 499 500 + Primary Decision Maker
Influencer Low Medium High Manufacturing
Retail trade Finance/Insurance
A B C D E F G H I J K
Base: All Respondents 1329 336 458 535 672 657 758 384 187 321 329 250
Weighted 1329 508 426 395* 683 646 813 378* 138** 62 154 56
Permanent disability
Major concern 321 97 117 107 216 104 180 86 55 20 36 14 24.1% 19.1% 27.4% 27.2% 31.7% 16.2% 22.1% 22.8% 39.5% 32.4% 23.7% 24.8% E JK
Somewhat of a concern 553 148 195 210 256 297 314 181 58 25 66 23 41.6% 29.2% 45.7% 53.2% 37.5% 46.0% 38.6% 47.9% 42.0% 40.5% 42.9% 41.2% A A
Not a concern 455 263 115 78 211 244 319 111 25 17 51 19 34.2% 51.7% 26.9% 19.7% 30.9% 37.8% 39.2% 29.2% 18.4% 27.1% 33.4% 34.0% BC G I I

75
Q22_7. [Generally improving employee health ...] Thinking about your company's employee population overall, how concerning is each of the following health issues? That is, what 'keeps you up at night' regarding employee health? ______________________________________________________________________________ Proportions/Means: Columns Tested (10% risk level) - A/B/C - D/E - F/G/H - I/J/K * small base; ** very small base (under 30) ineligible for sig testing
Company Size Decision Maker Awareness Occupation
Total 2 to 49 50 to 499 500 + Primary Decision Maker
Influencer Low Medium High Manufacturing
Retail trade Finance/Insurance
A B C D E F G H I J K
Base: All Respondents 1329 336 458 535 672 657 758 384 187 321 329 250
Weighted 1329 508 426 395* 683 646 813 378* 138** 62 154 56
Generally improving employee health ...
Major concern 363 118 125 120 228 135 208 102 54 19 43 18 27.3% 23.3% 29.4% 30.3% 33.4% 20.9% 25.5% 26.9% 39.2% 31.2% 28.3% 31.6% E
Somewhat of a concern 622 193 209 220 306 316 360 190 73 33 69 26 46.8% 38.0% 49.2% 55.6% 44.7% 49.0% 44.2% 50.1% 52.6% 52.6% 45.0% 46.4% A A J
Not a concern 344 197 91 56 150 194 246 87 11 10 41 12 25.9% 38.8% 21.4% 14.1% 21.9% 30.1% 30.2% 23.0% 8.2% 16.2% 26.7% 22.0% BC D I I

76
Q23_1. [To attract/ compete for talent] Below is a list of potential reasons a company would offer its employees medical benefits. Please allocate 100 points based on how important these reasons are to your company. If a reason is very important, give it more points. If a reason is not that important for your company, give it fewer points. ______________________________________________________________________________ Proportions/Means: Columns Tested (10% risk level) - A/B/C - D/E - F/G/H - I/J/K * small base; ** very small base (under 30) ineligible for sig testing
Company Size Decision Maker Awareness Occupation
Total 2 to 49 50 to 499 500 + Primary Decision Maker
Influencer Low Medium High Manufacturing
Retail trade Finance/Insurance
A B C D E F G H I J K
Base: All Respondents 1329 336 458 535 672 657 758 384 187 321 329 250
Weighted 1329 508 426 395* 683 646 813 378* 138** 62 154 56
0 257 141 84 32 114 143 164 77 16 10 28 8 19.3% 27.8% 19.6% 8.1% 16.6% 22.2% 20.1% 20.4% 11.7% 15.6% 17.9% 14.8% C C
1 to 25 580 166 223 192 317 264 307 179 94 35 73 28 43.7% 32.6% 52.4% 48.4% 46.3% 40.9% 37.8% 47.4% 68.2% 55.8% 47.7% 49.2% A A J
26 to 50 123 63 37 23 51 72 66 45 12 6 9 7 9.3% 12.4% 8.7% 5.9% 7.4% 11.2% 8.1% 11.8% 8.9% 9.3% 6.1% 12.8% J
51 to 75 20 11 6 3 8 13 11 6 3 0 2 1 1.5% 2.1% 1.4% 0.9% 1.1% 2.0% 1.3% 1.6% 2.4% 0.3% 1.2% 1.6%
76 to 99 4 3 0 1 1 3 1 3 0 1 0 0 0.3% 0.5% 0 0.2% 0.1% 0.4% 0.1% 0.7% - 0.9% 0.3% -
100 17 4 9 5 6 11 4 7 6 0 0 1 1.3% 0.8% 2.0% 1.2% 0.9% 1.7% 0.5% 1.9% 4.2% 0.6% 0.3% 1.6% J
I Don't Know 327 120 67 140 188 139 260 61 6 11 41 11 24.6% 23.7% 15.8% 35.4% 27.5% 21.6% 32.0% 16.2% 4.6% 17.4% 26.4% 20.0% AB G IK
Summary
Mean (Incl. 0) 16.4 15.5 17.4 16.3 15.0 17.7 15.2 17.7 18.0 15.9 13.9 18.7 IJ
Std. Dev. 19.0 19.5 19.7 17.1 17.1 20.6 17.1 20.4 22.6 16.4 15.5 19.5
Std. Err. 0.6 1.2 1.0 0.9 0.8 0.9 0.7 1.1 1.7 1.0 1.0 1.4
Mean (Excl. 0) 22.0 24.4 22.7 18.7 19.5 24.7 21.6 23.4 20.6 19.7 18.4 23.0 C D IJ
Std. Dev. 19.0 19.6 19.6 17.1 17.1 20.5 16.6 20.4 23.0 16.1 15.3 19.2
Std. Err. 0.7 1.5 1.1 1.0 0.9 1.0 0.9 1.2 1.9 1.1 1.1 1.5
Median 9.8 9.4 9.9 9.8 9.7 9.9 9.7 9.8 9.7 9.9 9.6 10.5

77
Q23_2. [To ensure a stable talent pool/ retain talent] Below is a list of potential reasons a company would offer its employees medical benefits. Please allocate 100 points based on how important these reasons are to your company. If a reason is very important, give it more points. If a reason is not that important for your company, give it fewer points. ______________________________________________________________________________ Proportions/Means: Columns Tested (10% risk level) - A/B/C - D/E - F/G/H - I/J/K * small base; ** very small base (under 30) ineligible for sig testing
Company Size Decision Maker Awareness Occupation
Total 2 to 49 50 to 499 500 + Primary Decision Maker
Influencer Low Medium High Manufacturing
Retail trade Finance/Insurance
A B C D E F G H I J K
Base: All Respondents 1329 336 458 535 672 657 758 384 187 321 329 250
Weighted 1329 508 426 395* 683 646 813 378* 138** 62 154 56
0 233 127 72 34 112 121 147 67 19 8 27 9 17.5% 25.0% 17.0% 8.5% 16.4% 18.7% 18.1% 17.6% 13.8% 12.8% 17.3% 16.4% C C
1 to 25 658 214 254 191 346 313 346 212 100 37 76 30 49.5% 42.2% 59.6% 48.2% 50.6% 48.4% 42.6% 56.2% 72.4% 58.6% 49.2% 54.0% A F J
26 to 50 95 39 29 27 31 64 56 28 11 6 9 5 7.2% 7.7% 6.9% 6.9% 4.6% 9.9% 6.9% 7.5% 8.0% 9.3% 6.1% 8.8% D
51 to 75 7 3 0 3 1 6 3 3 1 1 0 0 0.5% 0.6% 0.1% 0.8% 0.2% 0.9% 0.4% 0.8% 0.6% 1.6% 0.3% - JK
76 to 99 7 4 3 0 4 3 0 7 0 0 0 0 0.5% 0.9% 0.6% - 0.6% 0.4% - 1.7% 0.3% - 0.3% - F
100 1 0 0 1 1 0 1 0 0 0 0 0 0.1% - 0.1% 0.2% 0.1% 0 0.1% - 0.3% 0.3% 0.3% 0.8%
I Don't Know 327 120 67 140 188 139 260 61 6 11 41 11 24.6% 23.7% 15.8% 35.4% 27.5% 21.6% 32.0% 16.2% 4.6% 17.4% 26.4% 20.0% AB G IK
Summary
Mean (Incl. 0) 13.4 13.5 13.3 13.4 12.4 14.4 13.4 13.3 13.5 15.5 12.7 14.2 J
Std. Dev. 14.3 16.3 13.2 12.6 13.7 14.9 13.7 15.6 13.6 14.4 14.0 14.1
Std. Err. 0.4 1.0 0.7 0.6 0.6 0.7 0.6 0.9 1.0 0.9 0.9 1.0
Mean (Excl. 0) 17.5 20.1 16.6 15.4 16.0 18.9 18.3 16.9 15.8 18.3 16.6 17.9 C
Std. Dev. 14.0 16.2 12.7 12.4 13.6 14.4 13.0 15.8 13.4 13.9 13.9 13.6
Std. Err. 0.5 1.2 0.7 0.7 0.7 0.7 0.7 1.0 1.1 0.9 1.0 1.1
Median 9.6 9.5 9.6 9.6 9.5 9.3 9.6 9.4 9.6 9.8 9.0 9.9

78
Q23_3. [To promote employee productivity ...] Below is a list of potential reasons a company would offer its employees medical benefits. Please allocate 100 points based on how important these reasons are to your company. If a reason is very important, give it more points. If a reason is not that important for your company, give it fewer points. ______________________________________________________________________________ Proportions/Means: Columns Tested (10% risk level) - A/B/C - D/E - F/G/H - I/J/K * small base; ** very small base (under 30) ineligible for sig testing
Company Size Decision Maker Awareness Occupation
Total 2 to 49 50 to 499 500 + Primary Decision Maker
Influencer Low Medium High Manufacturing
Retail trade Finance/Insurance
A B C D E F G H I J K
Base: All Respondents 1329 336 458 535 672 657 758 384 187 321 329 250
Weighted 1329 508 426 395* 683 646 813 378* 138** 62 154 56
0 247 149 70 28 128 119 154 71 23 7 25 7 18.6% 29.3% 16.3% 7.2% 18.7% 18.4% 18.9% 18.7% 16.3% 10.9% 16.4% 12.0% BC C I
1 to 25 649 211 252 186 312 337 322 225 102 38 74 32 48.9% 41.5% 59.3% 47.0% 45.6% 52.3% 39.6% 59.5% 74.0% 61.4% 48.3% 57.6% AC F J J
26 to 50 90 25 28 37 46 44 63 20 7 5 10 5 6.8% 4.9% 6.7% 9.3% 6.7% 6.8% 7.8% 5.3% 4.8% 8.7% 6.7% 8.4%
51 to 75 11 2 5 4 9 2 10 1 0 0 3 1 0.8% 0.4% 1.2% 0.9% 1.3% 0.3% 1.2% 0.3% - 0.3% 1.8% 1.2%
76 to 99 0 0 0 0 0 0 0 0 0 0 0 0 0 0 0.1% - 0 0 0 - 0.1% 0.3% - -
100 4 1 3 1 1 3 4 0 0 1 0 0 0.3% 0.1% 0.6% 0.2% 0.1% 0.5% 0.4% 0.1% 0.1% 0.9% 0.3% 0.8%
I Don't Know 327 120 67 140 188 139 260 61 6 11 41 11 24.6% 23.7% 15.8% 35.4% 27.5% 21.6% 32.0% 16.2% 4.6% 17.4% 26.4% 20.0% AB G IK
Summary
Mean (Incl. 0) 13.0 10.2 13.8 16.0 12.2 13.7 14.2 11.3 11.9 15.4 14.2 15.4 A A
Std. Dev. 14.0 12.6 14.2 15.0 13.8 14.2 16.0 10.6 11.7 15.1 15.8 15.7
Std. Err. 0.4 0.8 0.7 0.8 0.6 0.6 0.7 0.6 0.9 0.9 1.0 1.1
Mean (Excl. 0) 17.2 16.5 17.1 18.0 16.5 17.9 19.6 14.5 14.4 17.8 18.3 18.2 G
Std. Dev. 13.7 12.4 13.9 14.7 13.7 13.7 15.7 9.9 11.4 14.8 15.7 15.5
Std. Err. 0.5 0.9 0.8 0.8 0.7 0.7 0.8 0.6 0.9 1.0 1.1 1.2
Median 9.5 4.8 9.1 9.7 9.4 9.4 9.3 7.9 9.5 9.7 8.3 9.8

79
Q23_4. [To take care of our employees, without any specifically defined business benefit] Below is a list of potential reasons a company would offer its employees medical benefits. Please allocate 100 points based on how important these reasons are to your company. If a reason is very important, give it more points. If a reason is not that important for your company, give it fewer points. ______________________________________________________________________________ Proportions/Means: Columns Tested (10% risk level) - A/B/C - D/E - F/G/H - I/J/K * small base; ** very small base (under 30) ineligible for sig testing
Company Size Decision Maker Awareness Occupation
Total 2 to 49 50 to 499 500 + Primary Decision Maker
Influencer Low Medium High Manufacturing
Retail trade Finance/Insurance
A B C D E F G H I J K
Base: All Respondents 1329 336 458 535 672 657 758 384 187 321 329 250
Weighted 1329 508 426 395* 683 646 813 378* 138** 62 154 56
0 199 88 67 44 86 112 124 51 23 11 21 9 14.9% 17.2% 15.8% 11.1% 12.6% 17.4% 15.2% 13.6% 16.9% 18.4% 13.4% 15.6% J
1 to 25 597 182 229 187 315 283 317 198 82 33 72 31 45.0% 35.8% 53.7% 47.2% 46.0% 43.8% 39.1% 52.3% 59.6% 53.3% 47.1% 54.4% A A F J
26 to 50 150 81 50 19 66 83 92 37 20 5 14 4 11.3% 15.9% 11.7% 4.9% 9.7% 12.9% 11.4% 9.8% 14.7% 8.7% 8.8% 8.0% C C
51 to 75 19 9 6 4 4 15 9 10 0 1 2 1 1.4% 1.8% 1.4% 1.0% 0.6% 2.4% 1.1% 2.6% - 1.2% 1.2% 1.6%
76 to 99 13 7 6 0 12 1 3 5 5 0 1 0 1.0% 1.4% 1.3% 0 1.8% 0.2% 0.3% 1.4% 3.8% - 0.6% -
100 24 21 1 2 12 12 8 15 1 1 4 0 1.8% 4.1% 0.3% 0.5% 1.8% 1.8% 1.0% 4.1% 0.5% 0.9% 2.4% 0.4% BC F K
I Don't Know 327 120 67 140 188 139 260 61 6 11 41 11 24.6% 23.7% 15.8% 35.4% 27.5% 21.6% 32.0% 16.2% 4.6% 17.4% 26.4% 20.0% AB G IK
Summary
Mean (Incl. 0) 18.6 23.5 17.3 13.1 18.2 19.0 17.6 20.9 17.2 13.9 17.3 15.0 BC I
Std. Dev. 21.4 26.6 17.5 15.0 21.4 21.4 19.4 25.3 18.9 16.8 21.7 15.6
Std. Err. 0.7 1.6 0.9 0.8 0.9 0.9 0.8 1.4 1.5 1.0 1.4 1.1
Mean (Excl. 0) 23.2 30.3 21.3 15.8 22.0 24.4 22.7 24.9 20.9 17.9 21.2 18.7 BC C
Std. Dev. 21.5 26.5 17.1 15.2 21.7 21.4 19.2 25.7 19.0 17.1 22.2 15.3
Std. Err. 0.8 1.9 1.0 0.9 1.1 1.1 1.0 1.6 1.6 1.2 1.6 1.2
Median 9.8 13.3 9.8 9.4 9.8 9.9 9.8 9.8 9.8 9.5 8.2 9.7

80
Q23_5. [Because it’s a tax-advantaged way to provide compensation to our employees] Below is a list of potential reasons a company would offer its employees medical benefits. Please allocate 100 points based on how important these reasons are to your company. If a reason is very important, give it more points. If a reason is not that important for your company, give it fewer points. ______________________________________________________________________________ Proportions/Means: Columns Tested (10% risk level) - A/B/C - D/E - F/G/H - I/J/K * small base; ** very small base (under 30) ineligible for sig testing
Company Size Decision Maker Awareness Occupation
Total 2 to 49 50 to 499 500 + Primary Decision Maker
Influencer Low Medium High Manufacturing
Retail trade Finance/Insurance
A B C D E F G H I J K
Base: All Respondents 1329 336 458 535 672 657 758 384 187 321 329 250
Weighted 1329 508 426 395* 683 646 813 378* 138** 62 154 56
0 344 166 109 69 140 203 220 85 39 15 35 14 25.9% 32.6% 25.5% 17.5% 20.5% 31.5% 27.1% 22.4% 28.4% 24.6% 22.5% 25.2% C D
1 to 25 624 197 246 181 326 298 317 223 84 35 72 29 46.9% 38.8% 57.7% 45.8% 47.7% 46.2% 39.0% 58.9% 60.9% 55.8% 46.8% 52.4% AC F J
26 to 50 22 14 3 4 19 3 15 4 3 1 4 1 1.6% 2.8% 0.7% 1.1% 2.8% 0.4% 1.8% 1.0% 2.4% 1.6% 2.7% 2.0% E
51 to 75 6 5 0 0 5 0 0 0 5 0 0 0 0.4% 1.0% 0 0.1% 0.8% 0.1% 0 0.1% 3.8% 0.3% - 0.4%
76 to 99 1 0 0 0 0 0 0 1 0 0 0 0 0.1% 0.1% - 0.1% 0.1% 0 - 0.2% - - 0.3% -
100 6 5 1 0 5 1 1 5 0 0 2 0 0.5% 1.0% 0.2% 0 0.7% 0.2% 0.1% 1.3% 0 0.3% 1.2% -
I Don't Know 327 120 67 140 188 139 260 61 6 11 41 11 24.6% 23.7% 15.8% 35.4% 27.5% 21.6% 32.0% 16.2% 4.6% 17.4% 26.4% 20.0% AB G IK
Summary
Mean (Incl. 0) 8.6 8.7 8.5 8.6 9.8 7.4 7.5 10.1 9.6 8.5 10.4 8.4 E
Std. Dev. 11.7 15.2 9.2 8.4 13.6 9.4 9.6 14.1 13.2 10.5 15.5 9.2
Std. Err. 0.4 0.9 0.5 0.4 0.6 0.4 0.4 0.8 1.0 0.6 1.0 0.7
Mean (Excl. 0) 13.1 15.1 12.2 11.8 13.7 12.4 12.5 13.8 13.7 12.1 15.0 12.3 I
Std. Dev. 12.3 17.5 8.8 7.6 14.3 9.4 9.5 14.9 13.9 10.7 16.6 8.7
Std. Err. 0.5 1.4 0.5 0.5 0.8 0.5 0.5 1.0 1.2 0.8 1.3 0.7
Median 4.9 4.2 6.3 9.2 9.1 4.5 4.4 9.2 9.2 9.1 9.1 9.0

81
Q23_6. [Because if we do not offer insurance, some employees may not be able to afford health insurance] Below is a list of potential reasons a company would offer its employees medical benefits. Please allocate 100 points based on how important these reasons are to your company. If a reason is very important, give it more points. If a reason is not that important for your company, give it fewer points. ______________________________________________________________________________ Proportions/Means: Columns Tested (10% risk level) - A/B/C - D/E - F/G/H - I/J/K * small base; ** very small base (under 30) ineligible for sig testing
Company Size Decision Maker Awareness Occupation
Total 2 to 49 50 to 499 500 + Primary Decision Maker
Influencer Low Medium High Manufacturing
Retail trade Finance/Insurance
A B C D E F G H I J K
Base: All Respondents 1329 336 458 535 672 657 758 384 187 321 329 250
Weighted 1329 508 426 395* 683 646 813 378* 138** 62 154 56
0 364 159 129 76 170 194 216 109 39 15 32 12 27.4% 31.3% 30.3% 19.3% 24.8% 30.1% 26.6% 28.8% 28.4% 24.3% 21.0% 22.0% C C
1 to 25 584 195 215 174 302 282 297 198 90 33 71 31 43.9% 38.3% 50.5% 44.0% 44.2% 43.7% 36.5% 52.3% 64.8% 53.3% 46.5% 54.4% A F J J
26 to 50 41 23 13 5 19 22 28 10 3 3 8 2 3.1% 4.5% 3.0% 1.2% 2.7% 3.4% 3.4% 2.6% 2.0% 4.4% 5.2% 2.8%
51 to 75 6 6 0 0 0 6 6 0 0 0 0 0 0.5% 1.3% 0 - 0 1.0% 0.8% - - - - -
76 to 99 1 0 1 0 0 1 1 0 0 0 0 0 0 - 0.2% - - 0.1% 0.1% - - 0.3% 0.3% -
100 6 5 1 0 5 1 5 0 0 0 1 0 0.4% 0.9% 0.2% 0.1% 0.8% 0.1% 0.7% 0.1% 0.2% 0.3% 0.6% 0.8%
I Don't Know 327 120 67 140 188 139 260 61 6 11 41 11 24.6% 23.7% 15.8% 35.4% 27.5% 21.6% 32.0% 16.2% 4.6% 17.4% 26.4% 20.0% AB G IK
Summary
Mean (Incl. 0) 9.5 10.8 8.7 8.7 9.4 9.6 10.4 7.9 9.4 10.1 10.8 10.5
Std. Dev. 13.2 17.0 11.0 8.3 13.5 12.9 15.5 9.4 9.8 12.2 14.1 13.6
Std. Err. 0.4 1.1 0.6 0.4 0.6 0.6 0.7 0.5 0.8 0.7 0.9 1.0
Mean (Excl. 0) 14.9 18.2 13.5 12.4 14.3 15.5 17.1 12.1 13.3 14.3 15.1 14.4 C G
Std. Dev. 13.9 18.9 11.0 7.3 14.4 13.3 16.7 9.2 9.1 12.3 14.6 14.1
Std. Err. 0.5 1.4 0.7 0.5 0.8 0.7 0.9 0.6 0.8 0.9 1.1 1.2
Median 5.2 4.5 9.1 9.1 9.0 4.8 4.9 4.7 9.4 7.7 6.8 9.2
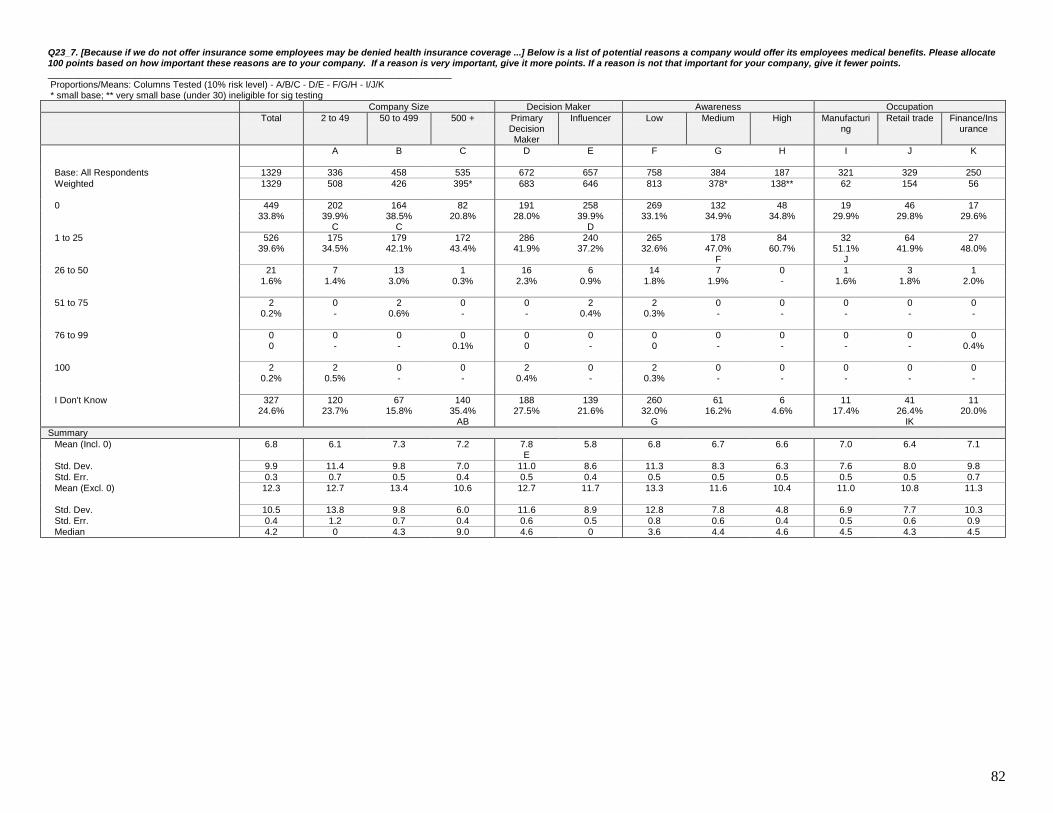
82
Q23_7. [Because if we do not offer insurance some employees may be denied health insurance coverage ...] Below is a list of potential reasons a company would offer its employees medical benefits. Please allocate 100 points based on how important these reasons are to your company. If a reason is very important, give it more points. If a reason is not that important for your company, give it fewer points. ______________________________________________________________________________ Proportions/Means: Columns Tested (10% risk level) - A/B/C - D/E - F/G/H - I/J/K * small base; ** very small base (under 30) ineligible for sig testing
Company Size Decision Maker Awareness Occupation
Total 2 to 49 50 to 499 500 + Primary Decision Maker
Influencer Low Medium High Manufacturing
Retail trade Finance/Insurance
A B C D E F G H I J K
Base: All Respondents 1329 336 458 535 672 657 758 384 187 321 329 250
Weighted 1329 508 426 395* 683 646 813 378* 138** 62 154 56
0 449 202 164 82 191 258 269 132 48 19 46 17 33.8% 39.9% 38.5% 20.8% 28.0% 39.9% 33.1% 34.9% 34.8% 29.9% 29.8% 29.6% C C D
1 to 25 526 175 179 172 286 240 265 178 84 32 64 27 39.6% 34.5% 42.1% 43.4% 41.9% 37.2% 32.6% 47.0% 60.7% 51.1% 41.9% 48.0% F J
26 to 50 21 7 13 1 16 6 14 7 0 1 3 1 1.6% 1.4% 3.0% 0.3% 2.3% 0.9% 1.8% 1.9% - 1.6% 1.8% 2.0%
51 to 75 2 0 2 0 0 2 2 0 0 0 0 0 0.2% - 0.6% - - 0.4% 0.3% - - - - -
76 to 99 0 0 0 0 0 0 0 0 0 0 0 0 0 - - 0.1% 0 - 0 - - - - 0.4%
100 2 2 0 0 2 0 2 0 0 0 0 0 0.2% 0.5% - - 0.4% - 0.3% - - - - -
I Don't Know 327 120 67 140 188 139 260 61 6 11 41 11 24.6% 23.7% 15.8% 35.4% 27.5% 21.6% 32.0% 16.2% 4.6% 17.4% 26.4% 20.0% AB G IK
Summary
Mean (Incl. 0) 6.8 6.1 7.3 7.2 7.8 5.8 6.8 6.7 6.6 7.0 6.4 7.1 E
Std. Dev. 9.9 11.4 9.8 7.0 11.0 8.6 11.3 8.3 6.3 7.6 8.0 9.8
Std. Err. 0.3 0.7 0.5 0.4 0.5 0.4 0.5 0.5 0.5 0.5 0.5 0.7
Mean (Excl. 0) 12.3 12.7 13.4 10.6 12.7 11.7 13.3 11.6 10.4 11.0 10.8 11.3
Std. Dev. 10.5 13.8 9.8 6.0 11.6 8.9 12.8 7.8 4.8 6.9 7.7 10.3
Std. Err. 0.4 1.2 0.7 0.4 0.6 0.5 0.8 0.6 0.4 0.5 0.6 0.9
Median 4.2 0 4.3 9.0 4.6 0 3.6 4.4 4.6 4.5 4.3 4.5

83
Q23_8. [To meet collective bargaining obligations] Below is a list of potential reasons a company would offer its employees medical benefits. Please allocate 100 points based on how important these reasons are to your company. If a reason is very important, give it more points. If a reason is not that important for your company, give it fewer points. ______________________________________________________________________________ Proportions/Means: Columns Tested (10% risk level) - A/B/C - D/E - F/G/H - I/J/K * small base; ** very small base (under 30) ineligible for sig testing
Company Size Decision Maker Awareness Occupation
Total 2 to 49 50 to 499 500 + Primary Decision Maker
Influencer Low Medium High Manufacturing
Retail trade Finance/Insurance
A B C D E F G H I J K
Base: All Respondents 1329 336 458 535 672 657 758 384 187 321 329 250
Weighted 1329 508 426 395* 683 646 813 378* 138** 62 154 56
0 547 240 203 103 224 323 320 170 58 25 60 26 41.2% 47.3% 47.7% 26.2% 32.8% 50.1% 39.3% 44.9% 41.7% 39.9% 38.9% 46.4% C C D J
1 to 25 398 131 133 133 245 152 190 136 71 24 47 18 29.9% 25.9% 31.3% 33.6% 35.9% 23.6% 23.3% 36.1% 51.7% 38.6% 30.4% 32.4% E F J
26 to 50 26 8 9 10 5 22 23 3 0 2 3 0 2.0% 1.5% 2.1% 2.5% 0.7% 3.4% 2.9% 0.7% 0.2% 3.1% 2.1% 0.8% D K
51 to 75 9 0 3 6 8 1 6 3 0 0 0 0 0.7% - 0.6% 1.5% 1.2% 0.1% 0.7% 0.9% - 0.3% 0.3% -
76 to 99 1 0 0 1 0 1 1 1 0 0 1 0 0.1% - - 0.3% 0 0.2% 0.1% 0.1% - - 0.6% 0.4%
100 20 8 10 2 13 7 14 4 2 0 2 0 1.5% 1.6% 2.4% 0.5% 1.9% 1.1% 1.7% 1.1% 1.8% 0.6% 1.2% -
I Don't Know 327 120 67 140 188 139 260 61 6 11 41 11 24.6% 23.7% 15.8% 35.4% 27.5% 21.6% 32.0% 16.2% 4.6% 17.4% 26.4% 20.0% AB G IK
Summary
Mean (Incl. 0) 7.4 5.7 8.5 8.5 8.3 6.5 8.4 6.1 6.6 7.3 7.5 4.4 K K
Std. Dev. 16.7 15.6 18.7 15.1 17.8 15.5 18.6 14.1 13.9 13.1 16.7 8.8
Std. Err. 0.5 1.0 1.0 0.8 0.8 0.7 0.8 0.8 1.1 0.8 1.1 0.6
Mean (Excl. 0) 16.4 15.0 19.6 14.4 15.2 18.1 19.8 13.2 11.8 14.2 15.9 10.5 K K
Std. Dev. 21.7 22.4 24.4 17.3 21.8 21.4 24.3 18.3 16.8 15.4 21.5 11.0
Std. Err. 1.0 2.3 1.9 1.1 1.3 1.5 1.6 1.4 1.7 1.3 2.0 1.2
Median 0 0 0 4.4 3.1 0 0 0 2.5 3.5 0 0
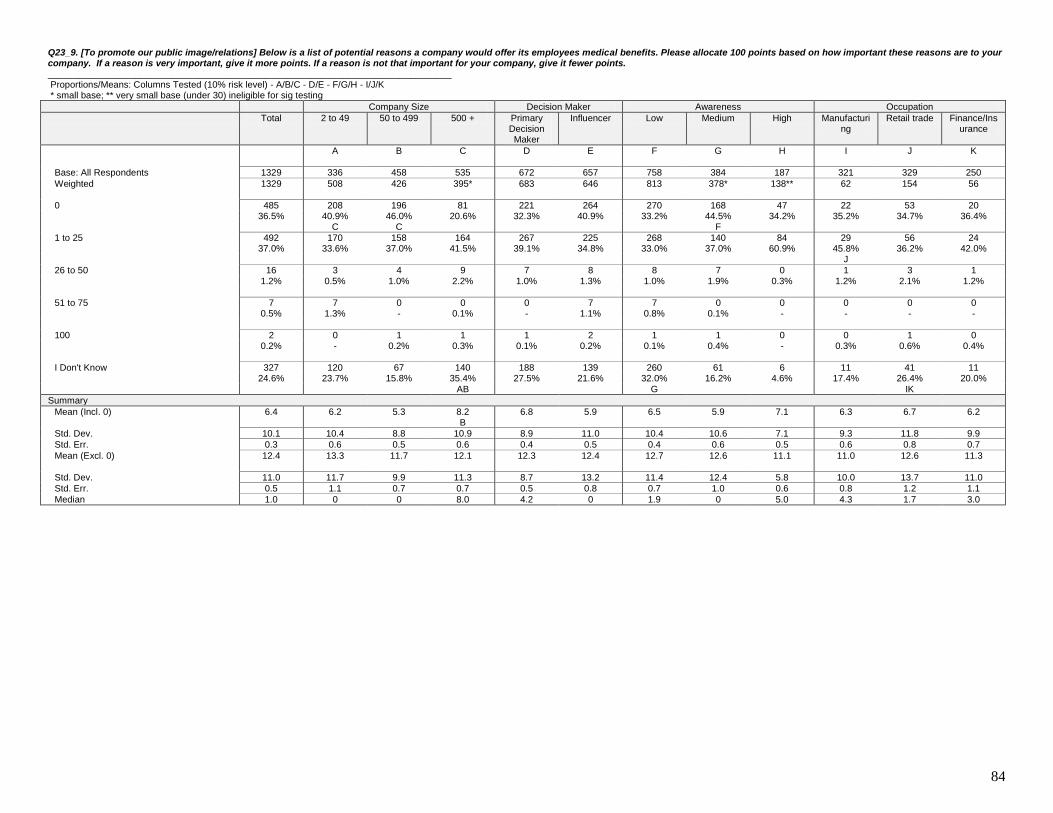
84
Q23_9. [To promote our public image/relations] Below is a list of potential reasons a company would offer its employees medical benefits. Please allocate 100 points based on how important these reasons are to your company. If a reason is very important, give it more points. If a reason is not that important for your company, give it fewer points. ______________________________________________________________________________ Proportions/Means: Columns Tested (10% risk level) - A/B/C - D/E - F/G/H - I/J/K * small base; ** very small base (under 30) ineligible for sig testing
Company Size Decision Maker Awareness Occupation
Total 2 to 49 50 to 499 500 + Primary Decision Maker
Influencer Low Medium High Manufacturing
Retail trade Finance/Insurance
A B C D E F G H I J K
Base: All Respondents 1329 336 458 535 672 657 758 384 187 321 329 250
Weighted 1329 508 426 395* 683 646 813 378* 138** 62 154 56
0 485 208 196 81 221 264 270 168 47 22 53 20 36.5% 40.9% 46.0% 20.6% 32.3% 40.9% 33.2% 44.5% 34.2% 35.2% 34.7% 36.4% C C F
1 to 25 492 170 158 164 267 225 268 140 84 29 56 24 37.0% 33.6% 37.0% 41.5% 39.1% 34.8% 33.0% 37.0% 60.9% 45.8% 36.2% 42.0% J
26 to 50 16 3 4 9 7 8 8 7 0 1 3 1 1.2% 0.5% 1.0% 2.2% 1.0% 1.3% 1.0% 1.9% 0.3% 1.2% 2.1% 1.2%
51 to 75 7 7 0 0 0 7 7 0 0 0 0 0 0.5% 1.3% - 0.1% - 1.1% 0.8% 0.1% - - - -
100 2 0 1 1 1 2 1 1 0 0 1 0 0.2% - 0.2% 0.3% 0.1% 0.2% 0.1% 0.4% - 0.3% 0.6% 0.4%
I Don't Know 327 120 67 140 188 139 260 61 6 11 41 11 24.6% 23.7% 15.8% 35.4% 27.5% 21.6% 32.0% 16.2% 4.6% 17.4% 26.4% 20.0% AB G IK
Summary
Mean (Incl. 0) 6.4 6.2 5.3 8.2 6.8 5.9 6.5 5.9 7.1 6.3 6.7 6.2 B
Std. Dev. 10.1 10.4 8.8 10.9 8.9 11.0 10.4 10.6 7.1 9.3 11.8 9.9
Std. Err. 0.3 0.6 0.5 0.6 0.4 0.5 0.4 0.6 0.5 0.6 0.8 0.7
Mean (Excl. 0) 12.4 13.3 11.7 12.1 12.3 12.4 12.7 12.6 11.1 11.0 12.6 11.3
Std. Dev. 11.0 11.7 9.9 11.3 8.7 13.2 11.4 12.4 5.8 10.0 13.7 11.0
Std. Err. 0.5 1.1 0.7 0.7 0.5 0.8 0.7 1.0 0.6 0.8 1.2 1.1
Median 1.0 0 0 8.0 4.2 0 1.9 0 5.0 4.3 1.7 3.0

85
Q25. Benefits decision making and sourcing When you make decisions changing your employee benefits offering, which of the following best describes how you think about the impact of your decision on employees? ______________________________________________________________________________ Proportions/Means: Columns Tested (10% risk level) - A/B/C - D/E - F/G/H - I/J/K * small base; ** very small base (under 30) ineligible for sig testing
Company Size Decision Maker Awareness Occupation
Total 2 to 49 50 to 499 500 + Primary Decision Maker
Influencer Low Medium High Manufacturing
Retail trade Finance/Insurance
A B C D E F G H I J K
Base: All Respondents 1329 336 458 535 672 657 758 384 187 321 329 250
Weighted 1329 508 426 395* 683 646 813 378* 138** 62 154 56
I weigh the impact equally across all employees regardless of wage, role, or family status
541 232 175 134 263 277 375 135 31 22 61 23
40.7% 45.6% 41.1% 33.8% 38.5% 43.0% 46.1% 35.7% 22.2% 34.9% 39.5% 41.6% C G
I am most concerned about the impact on employees with dependents and families
323 99 108 116 191 132 168 111 44 21 35 14
24.3% 19.5% 25.3% 29.4% 28.0% 20.4% 20.7% 29.2% 32.1% 33.6% 22.8% 25.2% A JK
I am most concerned with the impact on our lower-wage employees
256 100 99 57 147 109 138 75 43 13 32 9
19.3% 19.8% 23.3% 14.3% 21.6% 16.9% 17.0% 19.7% 31.2% 21.5% 21.0% 15.2% C K K
I am most concerned with the impact on the average/median wage employee
136 26 35 75 48 88 89 38 9 4 20 7
10.2% 5.1% 8.3% 18.9% 7.1% 13.6% 11.0% 9.9% 6.8% 6.2% 13.1% 13.2% AB D I I
I am most concerned with the impact on a specific group of employees that is crucial to my business's success...
73 51 9 14 33 40 42 20 11 2 6 3
5.5% 10.0% 2.0% 3.5% 4.8% 6.2% 5.2% 5.4% 7.8% 3.7% 3.6% 4.8% BC
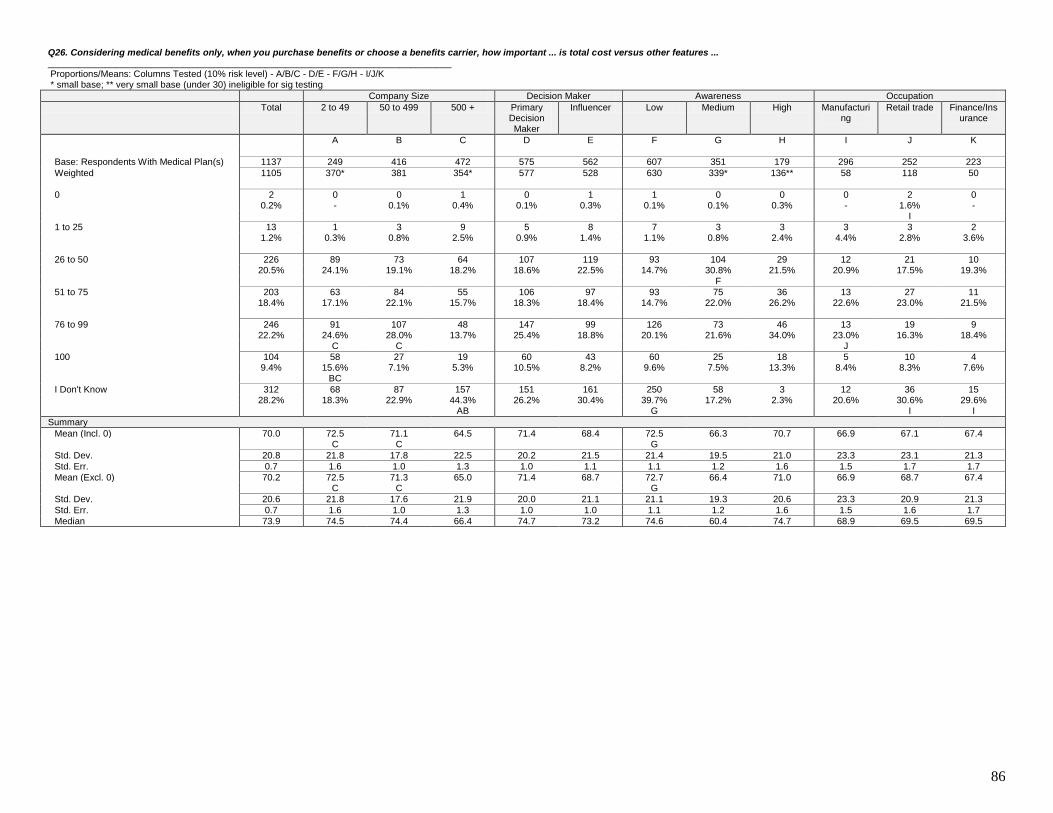
86
Q26. Considering medical benefits only, when you purchase benefits or choose a benefits carrier, how important ... is total cost versus other features ... ______________________________________________________________________________ Proportions/Means: Columns Tested (10% risk level) - A/B/C - D/E - F/G/H - I/J/K * small base; ** very small base (under 30) ineligible for sig testing
Company Size Decision Maker Awareness Occupation
Total 2 to 49 50 to 499 500 + Primary Decision Maker
Influencer Low Medium High Manufacturing
Retail trade Finance/Insurance
A B C D E F G H I J K
Base: Respondents With Medical Plan(s) 1137 249 416 472 575 562 607 351 179 296 252 223
Weighted 1105 370* 381 354* 577 528 630 339* 136** 58 118 50
0 2 0 0 1 0 1 1 0 0 0 2 0 0.2% - 0.1% 0.4% 0.1% 0.3% 0.1% 0.1% 0.3% - 1.6% - I
1 to 25 13 1 3 9 5 8 7 3 3 3 3 2 1.2% 0.3% 0.8% 2.5% 0.9% 1.4% 1.1% 0.8% 2.4% 4.4% 2.8% 3.6%
26 to 50 226 89 73 64 107 119 93 104 29 12 21 10 20.5% 24.1% 19.1% 18.2% 18.6% 22.5% 14.7% 30.8% 21.5% 20.9% 17.5% 19.3% F
51 to 75 203 63 84 55 106 97 93 75 36 13 27 11 18.4% 17.1% 22.1% 15.7% 18.3% 18.4% 14.7% 22.0% 26.2% 22.6% 23.0% 21.5%
76 to 99 246 91 107 48 147 99 126 73 46 13 19 9 22.2% 24.6% 28.0% 13.7% 25.4% 18.8% 20.1% 21.6% 34.0% 23.0% 16.3% 18.4% C C J
100 104 58 27 19 60 43 60 25 18 5 10 4 9.4% 15.6% 7.1% 5.3% 10.5% 8.2% 9.6% 7.5% 13.3% 8.4% 8.3% 7.6% BC
I Don't Know 312 68 87 157 151 161 250 58 3 12 36 15 28.2% 18.3% 22.9% 44.3% 26.2% 30.4% 39.7% 17.2% 2.3% 20.6% 30.6% 29.6% AB G I I
Summary
Mean (Incl. 0) 70.0 72.5 71.1 64.5 71.4 68.4 72.5 66.3 70.7 66.9 67.1 67.4 C C G
Std. Dev. 20.8 21.8 17.8 22.5 20.2 21.5 21.4 19.5 21.0 23.3 23.1 21.3
Std. Err. 0.7 1.6 1.0 1.3 1.0 1.1 1.1 1.2 1.6 1.5 1.7 1.7
Mean (Excl. 0) 70.2 72.5 71.3 65.0 71.4 68.7 72.7 66.4 71.0 66.9 68.7 67.4 C C G
Std. Dev. 20.6 21.8 17.6 21.9 20.0 21.1 21.1 19.3 20.6 23.3 20.9 21.3
Std. Err. 0.7 1.6 1.0 1.3 1.0 1.0 1.1 1.2 1.6 1.5 1.6 1.7
Median 73.9 74.5 74.4 66.4 74.7 73.2 74.6 60.4 74.7 68.9 69.5 69.5

87
Q27a. Biggest concern Considering just your costs for your self-insured/ ASO... medical benefits, of the following areas, which is your biggest concern? ______________________________________________________________________________ Proportions/Means: Columns Tested (10% risk level) - A/B/C - D/E - F/G/H - I/J/K * small base; ** very small base (under 30) ineligible for sig testing
Company Size Decision Maker Awareness Occupation
Total 2 to 49 50 to 499 500 + Primary Decision Maker
Influencer Low Medium High Manufacturing
Retail trade Finance/Insurance
A B C D E F G H I J K
Base: All ASO OR A Mix Of Fully Insured And ASO
315 54 115 146 156 159 143 117 55 93 77 56
Weighted 326* 96** 109* 121** 145** 181* 156* 114** 56** 18* 36* 13*
Administrative fee which is paid monthly on a per contract basis for administration of the plan, as well as transparency into these costs
22 12 5 5 10 11 9 9 4 2 3 1
6.6% 12.2% 4.4% 4.2% 7.1% 6.2% 5.5% 8.2% 6.5% 11.8% 9.1% 10.7%
Expected medical cost, including discount for medical services within the network, discounts outside of the network, guarantees on the level of discount provided, utilization management / pre-authorization programs, network management tools ... that manage use
98 22 38 37 43 55 67 20 11 4 11 4
30.0% 23.2% 35.0% 30.8% 29.3% 30.5% 42.7% 17.4% 20.2% 24.7% 31.2% 33.9%
Stop loss price and product, including the level of stop loss coverage ... and premium
25 7 15 3 13 12 9 14 2 2 2 1
7.7% 7.8% 14.0% 2.1% 8.8% 6.9% 6.0% 12.1% 3.5% 10.8% 5.2% 10.7%
Cost of doing business to employer including basic cost of doing business ... and switching costs ...
60 31 10 19 20 40 29 25 6 3 9 2
18.4% 32.3% 9.1% 15.7% 13.7% 22.2% 18.7% 22.1% 10.0% 18.3% 26.0% 16.1%
Cost trend, both of medical and administrative costs
101 18 35 48 53 48 36 32 33 5 8 3
30.9% 18.6% 32.2% 39.5% 36.4% 26.5% 22.9% 28.2% 58.8% 28.0% 23.4% 23.2%
Consultant fees or agent/broker commissions
21 6 6 9 7 14 7 14 1 1 2 1
6.4% 5.9% 5.4% 7.6% 4.6% 7.7% 4.2% 11.9% 1.1% 6.5% 5.2% 5.4%

88
Q27b. Second biggest concern Considering just your costs for your self-insured/ ASO... medical benefits, of the following areas, which is your second biggest concern? ______________________________________________________________________________ Proportions/Means: Columns Tested (10% risk level) - A/B/C - D/E - F/G/H - I/J/K * small base; ** very small base (under 30) ineligible for sig testing
Company Size Decision Maker Awareness Occupation
Total 2 to 49 50 to 499 500 + Primary Decision Maker
Influencer Low Medium High Manufacturing
Retail trade Finance/Insurance
A B C D E F G H I J K
Base: All ASO OR A Mix Of Fully Insured And ASO
315 54 115 146 156 159 143 117 55 93 77 56
Weighted 326* 96** 109* 121** 145** 181* 156* 114** 56** 18* 36* 13*
Administrative fee which is paid monthly on a per contract basis for administration of the plan, as well as transparency into these costs
67 7 25 34 33 34 37 6 23 3 5 1
20.4% 7.4% 23.0% 28.4% 22.6% 18.6% 23.8% 5.3% 41.9% 15.1% 13.0% 7.1%
Expected medical cost, including discount for medical services within the network, discounts outside of the network, guarantees on the level of discount provided, utilization management / pre-authorization programs, network management tools ... that manage use
65 30 21 14 31 35 22 35 8 4 10 3
20.0% 30.9% 19.6% 11.9% 21.2% 19.1% 14.2% 30.7% 14.5% 20.4% 27.3% 25.0%
Stop loss price and product, including the level of stop loss coverage ... and premium
46 17 11 18 11 36 25 17 4 4 7 2
14.2% 17.9% 10.3% 14.8% 7.3% 19.8% 16.2% 14.9% 7.0% 20.4% 18.2% 17.9%
Cost of doing business to employer including basic cost of doing business ... and switching costs ...
74 16 40 18 42 32 34 23 16 3 5 3
22.6% 16.9% 36.4% 14.8% 28.6% 17.8% 22.0% 20.2% 29.1% 18.3% 14.3% 21.4%
Cost trend, both of medical and administrative costs
49 10 9 29 18 31 20 26 4 3 4 2
15.0% 10.7% 8.5% 24.3% 12.7% 16.9% 12.7% 22.5% 6.2% 15.1% 11.7% 16.1%
Consultant fees or agent/broker commissions
25 16 2 7 11 14 17 7 1 2 6 2
7.8% 16.3% 2.3% 5.9% 7.6% 7.9% 11.1% 6.4% 1.2% 10.8% 15.6% 12.5%

89
Q27a/b. Biggest/ Second biggest concern Considering just your costs for your self-insured/ ASO... medical benefits, of the following areas, which is your biggest/ second biggest concern? ______________________________________________________________________________ Proportions/Means: Columns Tested (10% risk level) - A/B/C - D/E - F/G/H - I/J/K * small base; ** very small base (under 30) ineligible for sig testing
Company Size Decision Maker Awareness Occupation
Total 2 to 49 50 to 499 500 + Primary Decision Maker
Influencer Low Medium High Manufacturing
Retail trade Finance/Insurance
A B C D E F G H I J K
Base: All ASO OR A Mix Of Fully Insured And ASO
315 54 115 146 156 159 143 117 55 93 77 56
Weighted 326* 96** 109* 121** 145** 181* 156* 114** 56** 18* 36* 13*
Administrative fee which is paid monthly on a per contract basis for administration of the plan, as well as transparency into these costs
88 19 30 40 43 45 46 15 27 5 8 2
27.0% 19.6% 27.4% 32.6% 29.8% 24.8% 29.2% 13.5% 48.3% 26.9% 22.1% 17.9%
Expected medical cost, including discount for medical services within the network, discounts outside of the network, guarantees on the level of discount provided, utilization management / pre-authorization programs, network management tools ... that manage use
163 52 59 52 73 90 89 55 19 8 21 7
50.0% 54.1% 54.6% 42.7% 50.5% 49.6% 56.8% 48.2% 34.7% 45.2% 58.4% 58.9% I
Stop loss price and product, including the level of stop loss coverage ... and premium
72 25 26 20 23 48 35 31 6 6 8 4
21.9% 25.7% 24.3% 16.9% 16.1% 26.6% 22.3% 27.0% 10.5% 31.2% 23.4% 28.6%
Cost of doing business to employer including basic cost of doing business ... and switching costs ...
134 47 49 37 61 72 64 48 22 7 14 5
41.0% 49.2% 45.4% 30.6% 42.3% 40.0% 40.7% 42.3% 39.1% 36.6% 40.3% 37.5%
Cost trend, both of medical and administrative costs
150 28 44 78 71 79 56 58 36 8 13 5
45.9% 29.3% 40.7% 63.8% 49.1% 43.4% 35.6% 50.7% 65.0% 43.0% 35.1% 39.3%
Consultant fees or agent/broker commissions
46 21 8 16 18 28 24 21 1 3 7 2
14.1% 22.2% 7.7% 13.5% 12.2% 15.6% 15.3% 18.3% 2.4% 17.2% 20.8% 17.9%
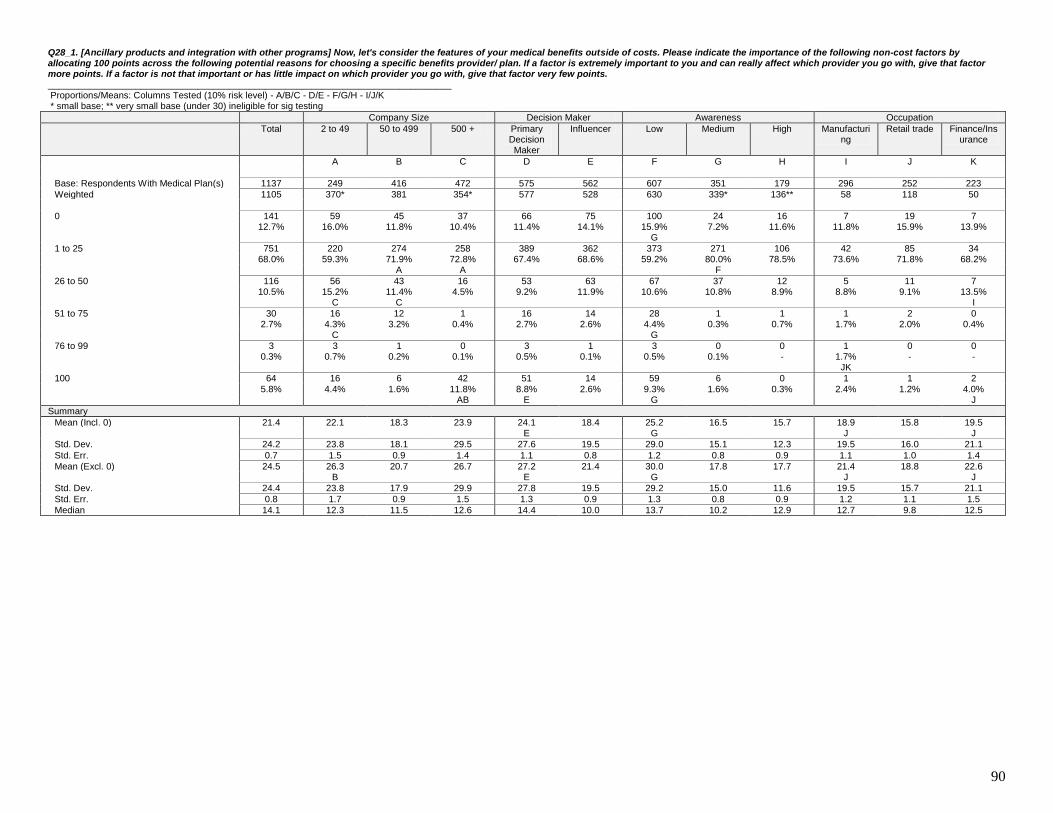
90
Q28_1. [Ancillary products and integration with other programs] Now, let's consider the features of your medical benefits outside of costs. Please indicate the importance of the following non-cost factors by allocating 100 points across the following potential reasons for choosing a specific benefits provider/ plan. If a factor is extremely important to you and can really affect which provider you go with, give that factor more points. If a factor is not that important or has little impact on which provider you go with, give that factor very few points. ______________________________________________________________________________ Proportions/Means: Columns Tested (10% risk level) - A/B/C - D/E - F/G/H - I/J/K * small base; ** very small base (under 30) ineligible for sig testing
Company Size Decision Maker Awareness Occupation
Total 2 to 49 50 to 499 500 + Primary Decision Maker
Influencer Low Medium High Manufacturing
Retail trade Finance/Insurance
A B C D E F G H I J K
Base: Respondents With Medical Plan(s) 1137 249 416 472 575 562 607 351 179 296 252 223
Weighted 1105 370* 381 354* 577 528 630 339* 136** 58 118 50
0 141 59 45 37 66 75 100 24 16 7 19 7 12.7% 16.0% 11.8% 10.4% 11.4% 14.1% 15.9% 7.2% 11.6% 11.8% 15.9% 13.9% G
1 to 25 751 220 274 258 389 362 373 271 106 42 85 34 68.0% 59.3% 71.9% 72.8% 67.4% 68.6% 59.2% 80.0% 78.5% 73.6% 71.8% 68.2% A A F
26 to 50 116 56 43 16 53 63 67 37 12 5 11 7 10.5% 15.2% 11.4% 4.5% 9.2% 11.9% 10.6% 10.8% 8.9% 8.8% 9.1% 13.5% C C I
51 to 75 30 16 12 1 16 14 28 1 1 1 2 0 2.7% 4.3% 3.2% 0.4% 2.7% 2.6% 4.4% 0.3% 0.7% 1.7% 2.0% 0.4% C G
76 to 99 3 3 1 0 3 1 3 0 0 1 0 0 0.3% 0.7% 0.2% 0.1% 0.5% 0.1% 0.5% 0.1% - 1.7% - - JK
100 64 16 6 42 51 14 59 6 0 1 1 2 5.8% 4.4% 1.6% 11.8% 8.8% 2.6% 9.3% 1.6% 0.3% 2.4% 1.2% 4.0% AB E G J
Summary
Mean (Incl. 0) 21.4 22.1 18.3 23.9 24.1 18.4 25.2 16.5 15.7 18.9 15.8 19.5 E G J J
Std. Dev. 24.2 23.8 18.1 29.5 27.6 19.5 29.0 15.1 12.3 19.5 16.0 21.1
Std. Err. 0.7 1.5 0.9 1.4 1.1 0.8 1.2 0.8 0.9 1.1 1.0 1.4
Mean (Excl. 0) 24.5 26.3 20.7 26.7 27.2 21.4 30.0 17.8 17.7 21.4 18.8 22.6 B E G J J
Std. Dev. 24.4 23.8 17.9 29.9 27.8 19.5 29.2 15.0 11.6 19.5 15.7 21.1
Std. Err. 0.8 1.7 0.9 1.5 1.3 0.9 1.3 0.8 0.9 1.2 1.1 1.5
Median 14.1 12.3 11.5 12.6 14.4 10.0 13.7 10.2 12.9 12.7 9.8 12.5

91
Q28_2. [Product flexibility and benefit customization] Now, let's consider the features of your medical benefits outside of costs. Please indicate the importance of the following non-cost factors by allocating 100 points across the following potential reasons for choosing a specific benefits provider/ plan. If a factor is extremely important to you and can really affect which provider you go with, give that factor more points. If a factor is not that important or has little impact on which provider you go with, give that factor very few points. ______________________________________________________________________________ Proportions/Means: Columns Tested (10% risk level) - A/B/C - D/E - F/G/H - I/J/K * small base; ** very small base (under 30) ineligible for sig testing
Company Size Decision Maker Awareness Occupation
Total 2 to 49 50 to 499 500 + Primary Decision Maker
Influencer Low Medium High Manufacturing
Retail trade Finance/Insurance
A B C D E F G H I J K
Base: Respondents With Medical Plan(s) 1137 249 416 472 575 562 607 351 179 296 252 223
Weighted 1105 370* 381 354* 577 528 630 339* 136** 58 118 50
0 199 76 50 73 128 71 148 33 18 8 15 10 18.0% 20.5% 13.2% 20.5% 22.2% 13.4% 23.4% 9.8% 13.4% 13.9% 13.1% 19.7% E G IJ
1 to 25 805 262 296 247 410 395 411 283 111 44 90 37 72.9% 70.9% 77.7% 69.9% 71.1% 74.9% 65.2% 83.6% 82.1% 75.7% 76.6% 73.1% F
26 to 50 87 28 31 29 37 50 59 22 6 5 10 3 7.9% 7.5% 8.0% 8.1% 6.3% 9.6% 9.4% 6.5% 4.2% 8.4% 8.3% 5.8%
51 to 75 8 2 1 5 0 7 8 0 0 0 1 0 0.7% 0.7% 0.2% 1.3% 0.1% 1.4% 1.2% - - 0.3% 0.8% 0.4%
76 to 99 1 0 1 0 1 0 0 0 0 1 0 0 0.1% 0.1% 0.2% 0.1% 0.1% 0.1% 0.1% 0.1% 0.3% 1.0% 0.4% 0.4%
100 4 1 3 0 1 4 4 0 0 0 1 0 0.4% 0.4% 0.7% 0.1% 0.2% 0.7% 0.7% 0.1% - 0.7% 0.8% 0.4%
Summary
Mean (Incl. 0) 13.1 12.8 14.4 12.1 10.7 15.8 13.9 12.2 11.9 15.1 14.7 12.9 D K
Std. Dev. 12.9 12.7 13.0 12.7 10.7 14.4 14.8 9.2 10.4 14.5 14.6 13.2
Std. Err. 0.4 0.8 0.6 0.6 0.4 0.6 0.6 0.5 0.8 0.8 0.9 0.9
Mean (Excl. 0) 16.0 16.2 16.6 15.3 13.8 18.2 18.2 13.5 13.7 17.5 16.9 16.1 D G
Std. Dev. 12.5 12.2 12.6 12.5 10.3 13.9 14.5 8.7 10.0 14.2 14.4 12.9
Std. Err. 0.4 0.9 0.7 0.6 0.5 0.6 0.7 0.5 0.8 0.9 1.0 1.0
Median 9.6 9.6 9.8 9.5 9.3 9.9 9.3 9.6 9.6 9.7 9.7 9.7

92
Q28_3. [Provider network] Now, let's consider the features of your medical benefits outside of costs. Please indicate the importance of the following non-cost factors by allocating 100 points across the following potential reasons for choosing a specific benefits provider/ plan. If a factor is extremely important to you and can really affect which provider you go with, give that factor more points. If a factor is not that important or has little impact on which provider you go with, give that factor very few points. ______________________________________________________________________________ Proportions/Means: Columns Tested (10% risk level) - A/B/C - D/E - F/G/H - I/J/K * small base; ** very small base (under 30) ineligible for sig testing
Company Size Decision Maker Awareness Occupation
Total 2 to 49 50 to 499 500 + Primary Decision Maker
Influencer Low Medium High Manufacturing
Retail trade Finance/Insurance
A B C D E F G H I J K
Base: Respondents With Medical Plan(s) 1137 249 416 472 575 562 607 351 179 296 252 223
Weighted 1105 370* 381 354* 577 528 630 339* 136** 58 118 50
0 161 36 49 76 111 50 121 26 13 6 13 6 14.6% 9.7% 12.8% 21.5% 19.3% 9.4% 19.3% 7.8% 9.6% 10.5% 11.1% 11.7% A E G
1 to 25 761 256 261 244 391 370 398 253 110 42 85 34 68.9% 69.2% 68.6% 68.9% 67.7% 70.1% 63.2% 74.6% 80.9% 73.3% 72.2% 66.8% F
26 to 50 144 53 64 27 61 83 81 51 12 7 12 8 13.0% 14.2% 16.8% 7.8% 10.6% 15.7% 12.8% 15.0% 9.0% 12.8% 9.9% 16.6% C J
51 to 75 14 8 5 2 5 10 10 4 0 0 3 1 1.3% 2.2% 1.2% 0.4% 0.8% 1.9% 1.6% 1.2% 0.2% 0.7% 2.8% 2.2% I
76 to 99 3 1 1 1 0 3 3 1 0 0 2 0 0.3% 0.2% 0.2% 0.4% 0 0.5% 0.4% 0.2% - 0.3% 2.0% 0.4%
100 22 17 2 4 9 13 17 4 0 1 2 1 2.0% 4.5% 0.4% 1.0% 1.6% 2.4% 2.7% 1.2% 0.3% 2.4% 2.0% 2.2% B
Summary
Mean (Incl. 0) 17.4 20.8 17.1 14.1 15.2 19.7 18.4 16.6 14.6 18.2 19.2 20.0 C D
Std. Dev. 18.0 22.4 14.8 15.1 16.6 19.1 20.2 15.4 11.6 18.3 20.4 19.6
Std. Err. 0.5 1.4 0.7 0.7 0.7 0.8 0.8 0.8 0.9 1.1 1.3 1.3
Mean (Excl. 0) 20.3 23.1 19.6 17.9 18.8 21.8 22.8 18.0 16.2 20.3 21.6 22.7 C G
Std. Dev. 17.8 22.4 14.2 14.9 16.5 18.9 20.1 15.2 11.1 18.2 20.5 19.4
Std. Err. 0.6 1.5 0.7 0.7 0.7 0.8 0.9 0.9 0.9 1.1 1.4 1.4
Median 10.0 10.0 10.4 9.9 9.8 12.1 10.1 9.9 10.8 9.9 10.0 12.7

93
Q28_4. [Health management programs] Now, let's consider the features of your medical benefits outside of costs. Please indicate the importance of the following non-cost factors by allocating 100 points across the following potential reasons for choosing a specific benefits provider/ plan. If a factor is extremely important to you and can really affect which provider you go with, give that factor more points. If a factor is not that important or has little impact on which provider you go with, give that factor very few points. ______________________________________________________________________________ Proportions/Means: Columns Tested (10% risk level) - A/B/C - D/E - F/G/H - I/J/K * small base; ** very small base (under 30) ineligible for sig testing
Company Size Decision Maker Awareness Occupation
Total 2 to 49 50 to 499 500 + Primary Decision Maker
Influencer Low Medium High Manufacturing
Retail trade Finance/Insurance
A B C D E F G H I J K
Base: Respondents With Medical Plan(s) 1137 249 416 472 575 562 607 351 179 296 252 223
Weighted 1105 370* 381 354* 577 528 630 339* 136** 58 118 50
0 274 109 75 90 136 138 216 42 16 12 23 11 24.8% 29.5% 19.8% 25.4% 23.7% 26.1% 34.3% 12.4% 12.0% 21.6% 19.4% 21.1% G
1 to 25 771 246 294 231 412 359 386 274 110 43 89 39 69.8% 66.4% 77.2% 65.3% 71.4% 68.0% 61.3% 81.0% 81.3% 74.7% 75.4% 77.1% AC F
26 to 50 45 11 6 29 16 29 22 15 9 2 4 0 4.1% 3.0% 1.5% 8.2% 2.8% 5.5% 3.4% 4.5% 6.4% 2.7% 3.2% 0.9% B
51 to 75 4 0 1 3 3 1 1 3 0 0 1 0 0.4% - 0.2% 0.9% 0.5% 0.2% 0.2% 0.8% - 0.7% 0.8% -
76 to 99 4 4 0 0 4 0 0 4 0 0 0 0 0.4% 1.1% 0.1% - 0.7% 0 0 1.2% - 0.3% - -
100 6 0 5 1 5 1 5 1 0 0 1 0 0.5% 0 1.3% 0.3% 0.9% 0.2% 0.8% 0.2% 0.3% - 1.2% 0.9%
Summary
Mean (Incl. 0) 10.5 8.7 11.4 11.3 11.1 9.8 8.8 12.6 12.6 9.9 11.7 10.1 F
Std. Dev. 12.3 11.0 13.2 12.6 14.1 10.0 12.0 12.7 11.8 10.2 13.9 11.5
Std. Err. 0.4 0.7 0.6 0.6 0.6 0.4 0.5 0.7 0.9 0.6 0.9 0.8
Mean (Excl. 0) 13.9 12.3 14.2 15.2 14.5 13.2 13.5 14.4 14.3 12.7 14.5 12.8
Std. Dev. 12.4 11.3 13.3 12.4 14.5 9.5 12.6 12.6 11.6 9.9 14.1 11.5
Std. Err. 0.4 0.9 0.7 0.6 0.7 0.5 0.6 0.7 0.9 0.6 1.0 0.9
Median 9.3 4.9 9.5 9.4 9.4 9.2 9.0 9.6 9.7 9.3 9.4 9.3

94
Q28_5. [Employer servicing] Now, let's consider the features of your medical benefits outside of costs. Please indicate the importance of the following non-cost factors by allocating 100 points across the following potential reasons for choosing a specific benefits provider/ plan. If a factor is extremely important to you and can really affect which provider you go with, give that factor more points. If a factor is not that important or has little impact on which provider you go with, give that factor very few points. ______________________________________________________________________________ Proportions/Means: Columns Tested (10% risk level) - A/B/C - D/E - F/G/H - I/J/K * small base; ** very small base (under 30) ineligible for sig testing
Company Size Decision Maker Awareness Occupation
Total 2 to 49 50 to 499 500 + Primary Decision Maker
Influencer Low Medium High Manufacturing
Retail trade Finance/Insurance
A B C D E F G H I J K
Base: Respondents With Medical Plan(s) 1137 249 416 472 575 562 607 351 179 296 252 223
Weighted 1105 370* 381 354* 577 528 630 339* 136** 58 118 50
0 326 147 78 101 169 157 247 56 24 12 29 14 29.5% 39.8% 20.3% 28.5% 29.3% 29.7% 39.1% 16.4% 17.4% 21.3% 24.6% 27.8% B G I
1 to 25 771 222 297 251 401 370 378 282 111 44 86 35 69.8% 60.0% 78.0% 71.1% 69.5% 70.0% 59.9% 83.1% 82.1% 77.0% 73.4% 70.4% A F K
26 to 50 4 1 2 1 2 1 2 2 0 1 2 1 0.3% 0.2% 0.5% 0.3% 0.4% 0.3% 0.3% 0.5% 0.2% 1.4% 1.6% 1.8%
100 5 0 4 0 4 0 4 0 0 0 0 0 0.4% - 1.2% 0.1% 0.8% 0 0.7% - 0.3% 0.3% 0.4% -
Summary
Mean (Incl. 0) 7.8 6.6 8.9 7.8 7.9 7.6 6.8 8.9 9.1 9.1 8.5 7.7 A F K
Std. Dev. 8.8 6.8 11.3 7.1 10.2 6.9 10.1 5.7 8.0 8.9 9.0 7.4
Std. Err. 0.3 0.4 0.6 0.3 0.4 0.3 0.4 0.3 0.6 0.5 0.6 0.5
Mean (Excl. 0) 11.0 10.9 11.2 10.9 11.2 10.8 11.2 10.7 11.1 11.5 11.2 10.7
Std. Dev. 8.5 5.5 11.6 6.0 10.4 5.8 10.8 4.5 7.5 8.6 8.8 6.7
Std. Err. 0.3 0.4 0.6 0.3 0.5 0.3 0.5 0.3 0.6 0.6 0.6 0.5
Median 9.1 4.1 9.2 9.1 9.1 9.1 4.6 9.3 9.4 9.3 9.2 8.3

95
Q28_6. [Account management / sales consultant] Now, let's consider the features of your medical benefits outside of costs. Please indicate the importance of the following non-cost factors by allocating 100 points across the following potential reasons for choosing a specific benefits provider/ plan. If a factor is extremely important to you and can really affect which provider you go with, give that factor more points. If a factor is not that important or has little impact on which provider you go with, give that factor very few points. ______________________________________________________________________________ Proportions/Means: Columns Tested (10% risk level) - A/B/C - D/E - F/G/H - I/J/K * small base; ** very small base (under 30) ineligible for sig testing
Company Size Decision Maker Awareness Occupation
Total 2 to 49 50 to 499 500 + Primary Decision Maker
Influencer Low Medium High Manufacturing
Retail trade Finance/Insurance
A B C D E F G H I J K
Base: Respondents With Medical Plan(s) 1137 249 416 472 575 562 607 351 179 296 252 223
Weighted 1105 370* 381 354* 577 528 630 339* 136** 58 118 50
0 333 138 89 106 183 150 249 62 22 15 35 16 30.1% 37.3% 23.4% 29.8% 31.7% 28.4% 39.5% 18.3% 16.2% 26.4% 29.4% 31.8% B G
1 to 25 755 220 291 244 378 377 378 275 101 42 81 34 68.3% 59.4% 76.4% 69.0% 65.6% 71.3% 60.0% 81.3% 74.8% 73.3% 68.7% 67.3% A F
26 to 50 9 7 1 1 8 1 1 1 7 0 2 0 0.8% 1.8% 0.3% 0.4% 1.3% 0.3% 0.2% 0.3% 5.2% 0.3% 2.0% - K
100 8 5 0 3 8 0 3 0 5 0 0 0 0.7% 1.5% - 0.8% 1.4% - 0.4% 0.1% 3.8% - - 0.9% J
Summary
Mean (Incl. 0) 7.4 7.6 7.0 7.6 8.2 6.6 5.9 7.8 13.4 7.3 7.2 7.0 F
Std. Dev. 10.1 13.1 5.4 10.3 12.7 5.9 8.6 5.7 18.9 5.9 7.4 10.5
Std. Err. 0.3 0.8 0.3 0.5 0.5 0.3 0.3 0.3 1.4 0.3 0.5 0.7
Mean (Excl. 0) 10.6 12.1 9.2 10.8 11.9 9.2 9.8 9.5 16.0 9.9 10.2 10.3 E
Std. Dev. 10.5 14.9 4.2 10.7 13.8 5.0 9.2 4.9 19.6 4.6 6.8 11.3
Std. Err. 0.4 1.2 0.2 0.6 0.7 0.3 0.5 0.3 1.6 0.3 0.5 0.9
Median 4.8 3.8 9.0 4.7 5.0 4.5 4.3 9.1 9.4 9.1 4.7 4.5
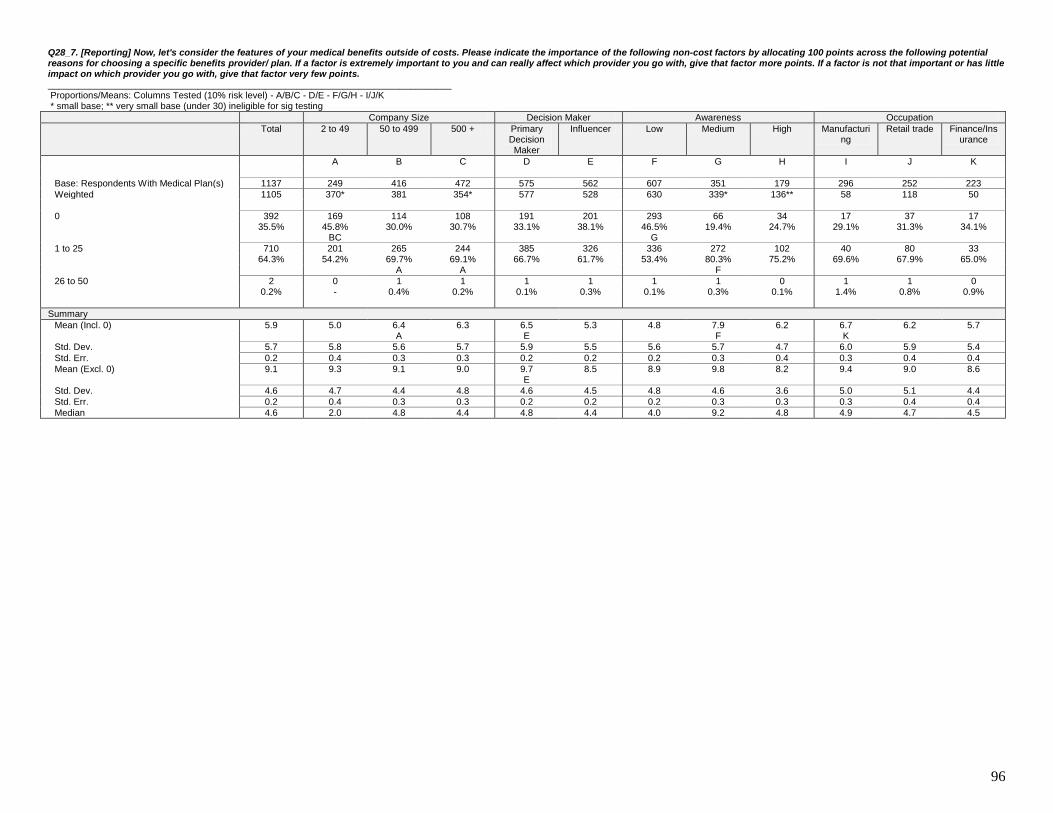
96
Q28_7. [Reporting] Now, let's consider the features of your medical benefits outside of costs. Please indicate the importance of the following non-cost factors by allocating 100 points across the following potential reasons for choosing a specific benefits provider/ plan. If a factor is extremely important to you and can really affect which provider you go with, give that factor more points. If a factor is not that important or has little impact on which provider you go with, give that factor very few points. ______________________________________________________________________________ Proportions/Means: Columns Tested (10% risk level) - A/B/C - D/E - F/G/H - I/J/K * small base; ** very small base (under 30) ineligible for sig testing
Company Size Decision Maker Awareness Occupation
Total 2 to 49 50 to 499 500 + Primary Decision Maker
Influencer Low Medium High Manufacturing
Retail trade Finance/Insurance
A B C D E F G H I J K
Base: Respondents With Medical Plan(s) 1137 249 416 472 575 562 607 351 179 296 252 223
Weighted 1105 370* 381 354* 577 528 630 339* 136** 58 118 50
0 392 169 114 108 191 201 293 66 34 17 37 17 35.5% 45.8% 30.0% 30.7% 33.1% 38.1% 46.5% 19.4% 24.7% 29.1% 31.3% 34.1% BC G
1 to 25 710 201 265 244 385 326 336 272 102 40 80 33 64.3% 54.2% 69.7% 69.1% 66.7% 61.7% 53.4% 80.3% 75.2% 69.6% 67.9% 65.0% A A F
26 to 50 2 0 1 1 1 1 1 1 0 1 1 0 0.2% - 0.4% 0.2% 0.1% 0.3% 0.1% 0.3% 0.1% 1.4% 0.8% 0.9%
Summary
Mean (Incl. 0) 5.9 5.0 6.4 6.3 6.5 5.3 4.8 7.9 6.2 6.7 6.2 5.7 A E F K
Std. Dev. 5.7 5.8 5.6 5.7 5.9 5.5 5.6 5.7 4.7 6.0 5.9 5.4
Std. Err. 0.2 0.4 0.3 0.3 0.2 0.2 0.2 0.3 0.4 0.3 0.4 0.4
Mean (Excl. 0) 9.1 9.3 9.1 9.0 9.7 8.5 8.9 9.8 8.2 9.4 9.0 8.6 E
Std. Dev. 4.6 4.7 4.4 4.8 4.6 4.5 4.8 4.6 3.6 5.0 5.1 4.4
Std. Err. 0.2 0.4 0.3 0.3 0.2 0.2 0.2 0.3 0.3 0.3 0.4 0.4
Median 4.6 2.0 4.8 4.4 4.8 4.4 4.0 9.2 4.8 4.9 4.7 4.5

97
Q28_8. [Employee servicing, including communication of benefits] Now, let's consider the features of your medical benefits outside of costs. Please indicate the importance of the following non-cost factors by allocating 100 points across the following potential reasons for choosing a specific benefits provider/ plan. If a factor is extremely important to you and can really affect which provider you go with, give that factor more points. If a factor is not that important or has little impact on which provider you go with, give that factor very few points. ______________________________________________________________________________ Proportions/Means: Columns Tested (10% risk level) - A/B/C - D/E - F/G/H - I/J/K * small base; ** very small base (under 30) ineligible for sig testing
Company Size Decision Maker Awareness Occupation
Total 2 to 49 50 to 499 500 + Primary Decision Maker
Influencer Low Medium High Manufacturing
Retail trade Finance/Insurance
A B C D E F G H I J K
Base: Respondents With Medical Plan(s) 1137 249 416 472 575 562 607 351 179 296 252 223
Weighted 1105 370* 381 354* 577 528 630 339* 136** 58 118 50
0 289 106 86 97 146 143 206 59 24 14 29 12 26.2% 28.6% 22.6% 27.4% 25.3% 27.1% 32.6% 17.4% 18.0% 25.0% 24.6% 23.8% G
1 to 25 776 248 280 248 414 362 397 269 110 42 86 36 70.3% 66.9% 73.6% 70.2% 71.9% 68.5% 63.0% 79.4% 80.9% 72.6% 73.4% 72.6% F
26 to 50 28 12 11 5 13 15 16 10 1 1 1 1 2.5% 3.3% 2.9% 1.3% 2.2% 2.9% 2.6% 3.1% 0.9% 1.7% 0.8% 2.2%
51 to 75 1 0 0 1 0 1 1 0 0 0 0 0 0.1% 0.1% - 0.2% 0 0.1% 0.1% 0.1% - 0.3% 0.4% 0.4%
76 to 99 6 4 2 0 2 4 6 0 0 0 0 0 0.6% 1.1% 0.6% - 0.4% 0.7% 1.0% - - - - -
100 4 0 1 3 1 3 4 0 0 0 1 0 0.4% 0.1% 0.2% 0.9% 0.2% 0.6% 0.6% 0 0.2% 0.3% 0.8% 0.9%
Summary
Mean (Incl. 0) 8.9 8.8 9.2 8.8 8.6 9.3 8.7 9.1 9.6 8.2 8.5 9.7
Std. Dev. 11.1 11.3 10.4 11.7 9.5 12.7 13.3 7.3 7.8 9.3 11.2 12.3
Std. Err. 0.3 0.7 0.5 0.5 0.4 0.5 0.5 0.4 0.6 0.5 0.7 0.8
Mean (Excl. 0) 12.1 12.3 11.9 12.1 11.5 12.8 12.9 11.0 11.7 11.0 11.3 12.7
Std. Dev. 11.4 11.7 10.5 12.1 9.4 13.3 14.4 6.5 7.1 9.2 11.7 12.6
Std. Err. 0.4 0.9 0.6 0.6 0.4 0.7 0.7 0.4 0.6 0.6 0.8 1.0
Median 9.0 5.0 9.2 9.0 9.1 4.9 4.7 9.2 8.9 8.2 4.9 9.1

98
Q28_9. [Breadth of complementary products & services] Now, let's consider the features of your medical benefits outside of costs. Please indicate the importance of the following non-cost factors by allocating 100 points across the following potential reasons for choosing a specific benefits provider/ plan. If a factor is extremely important to you and can really affect which provider you go with, give that factor more points. If a factor is not that important or has little impact on which provider you go with, give that factor very few points. ______________________________________________________________________________ Proportions/Means: Columns Tested (10% risk level) - A/B/C - D/E - F/G/H - I/J/K * small base; ** very small base (under 30) ineligible for sig testing
Company Size Decision Maker Awareness Occupation
Total 2 to 49 50 to 499 500 + Primary Decision Maker
Influencer Low Medium High Manufacturing
Retail trade Finance/Insurance
A B C D E F G H I J K
Base: Respondents With Medical Plan(s) 1137 249 416 472 575 562 607 351 179 296 252 223
Weighted 1105 370* 381 354* 577 528 630 339* 136** 58 118 50
0 402 164 128 111 209 193 268 92 42 20 36 18 36.4% 44.2% 33.6% 31.3% 36.3% 36.5% 42.6% 27.2% 30.8% 34.8% 30.6% 36.8% C G
1 to 25 667 193 243 232 348 319 336 237 94 37 77 30 60.4% 52.0% 63.8% 65.6% 60.3% 60.5% 53.4% 70.0% 69.0% 64.2% 65.1% 60.5% A A F
26 to 50 24 8 8 8 12 12 17 7 0 0 4 0 2.2% 2.2% 2.2% 2.2% 2.1% 2.3% 2.6% 2.2% 0.2% 0.3% 3.2% 0.9% I
51 to 75 0 0 0 0 0 0 0 0 0 0 0 0 0 - 0.1% - - 0.1% 0.1% - - 0.3% - 0.4%
100 11 6 2 3 7 3 8 2 0 0 1 1 1.0% 1.6% 0.4% 0.9% 1.2% 0.6% 1.3% 0.7% - 0.3% 1.2% 1.3%
Summary
Mean (Incl. 0) 7.7 7.5 7.4 8.1 7.7 7.6 7.4 8.4 7.0 6.7 8.2 7.3
Std. Dev. 12.0 14.0 9.8 12.0 12.9 11.1 13.7 10.2 6.4 8.7 13.1 13.0
Std. Err. 0.4 0.9 0.5 0.6 0.5 0.5 0.6 0.5 0.5 0.5 0.8 0.9
Mean (Excl. 0) 12.0 13.5 11.1 11.8 12.2 11.9 13.0 11.5 10.1 10.3 11.9 11.6
Std. Dev. 13.2 16.5 10.1 12.9 14.3 11.9 16.0 10.4 5.3 9.0 14.3 14.8
Std. Err. 0.5 1.4 0.6 0.7 0.7 0.6 0.8 0.7 0.5 0.6 1.1 1.2
Median 4.6 4.1 4.8 5.0 4.6 4.6 3.4 9.0 8.1 4.4 4.7 4.2
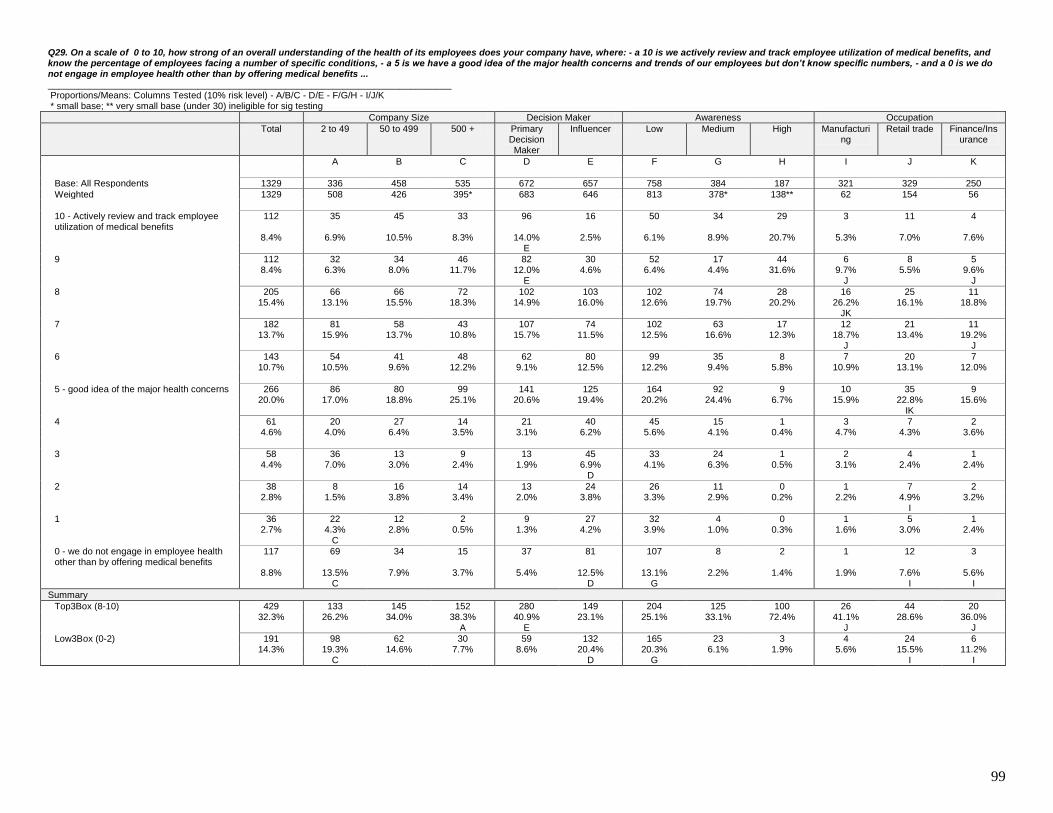
99
Q29. On a scale of 0 to 10, how strong of an overall understanding of the health of its employees does your company have, where: - a 10 is we actively review and track employee utilization of medical benefits, and know the percentage of employees facing a number of specific conditions, - a 5 is we have a good idea of the major health concerns and trends of our employees but don’t know specific numbers, - and a 0 is we do not engage in employee health other than by offering medical benefits ... ______________________________________________________________________________ Proportions/Means: Columns Tested (10% risk level) - A/B/C - D/E - F/G/H - I/J/K * small base; ** very small base (under 30) ineligible for sig testing
Company Size Decision Maker Awareness Occupation
Total 2 to 49 50 to 499 500 + Primary Decision Maker
Influencer Low Medium High Manufacturing
Retail trade Finance/Insurance
A B C D E F G H I J K
Base: All Respondents 1329 336 458 535 672 657 758 384 187 321 329 250
Weighted 1329 508 426 395* 683 646 813 378* 138** 62 154 56
10 - Actively review and track employee utilization of medical benefits
112 35 45 33 96 16 50 34 29 3 11 4
8.4% 6.9% 10.5% 8.3% 14.0% 2.5% 6.1% 8.9% 20.7% 5.3% 7.0% 7.6% E
9 112 32 34 46 82 30 52 17 44 6 8 5 8.4% 6.3% 8.0% 11.7% 12.0% 4.6% 6.4% 4.4% 31.6% 9.7% 5.5% 9.6% E J J
8 205 66 66 72 102 103 102 74 28 16 25 11 15.4% 13.1% 15.5% 18.3% 14.9% 16.0% 12.6% 19.7% 20.2% 26.2% 16.1% 18.8% JK
7 182 81 58 43 107 74 102 63 17 12 21 11 13.7% 15.9% 13.7% 10.8% 15.7% 11.5% 12.5% 16.6% 12.3% 18.7% 13.4% 19.2% J J
6 143 54 41 48 62 80 99 35 8 7 20 7 10.7% 10.5% 9.6% 12.2% 9.1% 12.5% 12.2% 9.4% 5.8% 10.9% 13.1% 12.0%
5 - good idea of the major health concerns 266 86 80 99 141 125 164 92 9 10 35 9 20.0% 17.0% 18.8% 25.1% 20.6% 19.4% 20.2% 24.4% 6.7% 15.9% 22.8% 15.6% IK
4 61 20 27 14 21 40 45 15 1 3 7 2 4.6% 4.0% 6.4% 3.5% 3.1% 6.2% 5.6% 4.1% 0.4% 4.7% 4.3% 3.6%
3 58 36 13 9 13 45 33 24 1 2 4 1 4.4% 7.0% 3.0% 2.4% 1.9% 6.9% 4.1% 6.3% 0.5% 3.1% 2.4% 2.4% D
2 38 8 16 14 13 24 26 11 0 1 7 2 2.8% 1.5% 3.8% 3.4% 2.0% 3.8% 3.3% 2.9% 0.2% 2.2% 4.9% 3.2% I
1 36 22 12 2 9 27 32 4 0 1 5 1 2.7% 4.3% 2.8% 0.5% 1.3% 4.2% 3.9% 1.0% 0.3% 1.6% 3.0% 2.4% C
0 - we do not engage in employee health other than by offering medical benefits
117 69 34 15 37 81 107 8 2 1 12 3
8.8% 13.5% 7.9% 3.7% 5.4% 12.5% 13.1% 2.2% 1.4% 1.9% 7.6% 5.6% C D G I I
Summary
Top3Box (8-10) 429 133 145 152 280 149 204 125 100 26 44 20 32.3% 26.2% 34.0% 38.3% 40.9% 23.1% 25.1% 33.1% 72.4% 41.1% 28.6% 36.0% A E J J
Low3Box (0-2) 191 98 62 30 59 132 165 23 3 4 24 6 14.3% 19.3% 14.6% 7.7% 8.6% 20.4% 20.3% 6.1% 1.9% 5.6% 15.5% 11.2% C D G I I

100
Q30_1. [Current Broker/agent] How much does your company rely on guidance/advice from each of the following in determining what benefits to offer employees? ______________________________________________________________________________ Proportions/Means: Columns Tested (10% risk level) - A/B/C - D/E - F/G/H - I/J/K * small base; ** very small base (under 30) ineligible for sig testing
Company Size Decision Maker Awareness Occupation
Total 2 to 49 50 to 499 500 + Primary Decision Maker
Influencer Low Medium High Manufacturing
Retail trade Finance/Insurance
A B C D E F G H I J K
Base: All Respondents 1329 336 458 535 672 657 758 384 187 321 329 250
Weighted 1329 508 426 395* 683 646 813 378* 138** 62 154 56
Current Broker/agent
Extensively 244 104 105 35 160 84 135 65 43 15 26 12 18.3% 20.4% 24.6% 8.9% 23.4% 12.9% 16.7% 17.3% 31.0% 24.0% 17.0% 22.0% C C E J
Some 549 160 200 189 267 282 311 178 60 29 59 22 41.3% 31.5% 47.0% 47.8% 39.0% 43.7% 38.3% 47.0% 43.7% 47.0% 38.3% 38.8% A A JK
A little 265 82 83 99 119 146 139 98 28 13 30 12 19.9% 16.2% 19.6% 25.1% 17.3% 22.7% 17.2% 25.9% 19.9% 20.2% 19.5% 20.8% F
None 271 162 38 71 138 133 227 37 7 5 39 10 20.4% 32.0% 8.8% 18.1% 20.2% 20.7% 27.9% 9.8% 5.4% 8.7% 25.2% 18.4% BC B G IK I
Summary
Top2Box (Extensively/ Some) 793 263 305 224 427 366 446 243 103 44 85 34 59.6% 51.9% 71.6% 56.8% 62.4% 56.7% 54.9% 64.3% 74.7% 71.0% 55.3% 60.8% AC JK
Low2Box (A little/ None ) 536 244 121 171 257 280 366 135 35 18 69 22 40.4% 48.1% 28.4% 43.2% 37.6% 43.3% 45.1% 35.7% 25.3% 29.0% 44.7% 39.2% B B I I

101
Q30_2. [Current benefits consultant] How much does your company rely on guidance/advice from each of the following in determining what benefits to offer employees? ______________________________________________________________________________ Proportions/Means: Columns Tested (10% risk level) - A/B/C - D/E - F/G/H - I/J/K * small base; ** very small base (under 30) ineligible for sig testing
Company Size Decision Maker Awareness Occupation
Total 2 to 49 50 to 499 500 + Primary Decision Maker
Influencer Low Medium High Manufacturing
Retail trade Finance/Insurance
A B C D E F G H I J K
Base: All Respondents 1329 336 458 535 672 657 758 384 187 321 329 250
Weighted 1329 508 426 395* 683 646 813 378* 138** 62 154 56
Current benefits consultant
Extensively 234 67 113 53 156 78 123 68 42 17 29 12 17.6% 13.3% 26.6% 13.5% 22.9% 12.0% 15.2% 18.0% 30.7% 27.1% 18.8% 21.2% AC E J
Some 582 142 186 253 284 298 306 193 83 28 63 25 43.8% 28.0% 43.7% 64.0% 41.6% 46.1% 37.7% 50.9% 59.8% 45.5% 40.7% 45.2% A AB F
A little 209 88 70 51 86 123 142 60 6 10 26 9 15.7% 17.4% 16.3% 12.9% 12.5% 19.1% 17.5% 15.9% 4.5% 16.5% 17.0% 16.0%
None 305 210 57 38 157 147 240 57 7 7 36 10 22.9% 41.3% 13.4% 9.6% 23.0% 22.8% 29.6% 15.1% 5.1% 10.9% 23.4% 17.6% BC G IK I
Summary
Top2Box (Extensively/ Some) 816 210 299 307 440 375 430 261 125 45 92 37 61.4% 41.3% 70.3% 77.5% 64.4% 58.1% 52.9% 68.9% 90.4% 72.6% 59.6% 66.4% A A F J J
Low2Box (A little/ None ) 513 298 127 89 243 270 383 117 13 17 62 19 38.6% 58.7% 29.7% 22.5% 35.6% 41.9% 47.1% 31.1% 9.6% 27.4% 40.4% 33.6% BC G IK

102
Q30_3. [Current Insurers/Carriers] How much does your company rely on guidance/advice from each of the following in determining what benefits to offer employees? ______________________________________________________________________________ Proportions/Means: Columns Tested (10% risk level) - A/B/C - D/E - F/G/H - I/J/K * small base; ** very small base (under 30) ineligible for sig testing
Company Size Decision Maker Awareness Occupation
Total 2 to 49 50 to 499 500 + Primary Decision Maker
Influencer Low Medium High Manufacturing
Retail trade Finance/Insurance
A B C D E F G H I J K
Base: All Respondents 1329 336 458 535 672 657 758 384 187 321 329 250
Weighted 1329 508 426 395* 683 646 813 378* 138** 62 154 56
Current Insurers/Carriers
Extensively 239 63 110 67 150 90 116 64 59 16 32 12 18.0% 12.3% 25.8% 16.8% 21.9% 13.9% 14.3% 16.8% 42.8% 26.2% 20.7% 22.0% A E J
Some 651 185 231 236 302 349 360 232 60 35 71 26 49.0% 36.4% 54.2% 59.6% 44.2% 54.1% 44.2% 61.3% 43.3% 56.4% 46.5% 46.8% A A D F JK
A little 222 120 58 44 111 111 144 62 17 7 23 10 16.7% 23.6% 13.7% 11.1% 16.3% 17.2% 17.7% 16.3% 12.1% 11.8% 14.9% 17.6% BC I
None 216 140 27 49 120 96 193 21 2 4 28 8 16.3% 27.6% 6.3% 12.4% 17.6% 14.8% 23.7% 5.6% 1.8% 5.6% 17.9% 13.6% BC G I I
Summary
Top2Box (Extensively/ Some) 890 247 341 302 452 439 476 295 119 52 103 39 67.0% 48.7% 80.0% 76.5% 66.1% 67.9% 58.6% 78.1% 86.1% 82.6% 67.2% 68.8% A A F JK
Low2Box (A little/ None ) 439 260 85 93 232 207 337 83 19 11 50 18 33.0% 51.3% 20.0% 23.5% 33.9% 32.1% 41.4% 21.9% 13.9% 17.4% 32.8% 31.2% BC G I I

103
Q30_4. [Industry or other association ...] How much does your company rely on guidance/advice from each of the following in determining what benefits to offer employees? ______________________________________________________________________________ Proportions/Means: Columns Tested (10% risk level) - A/B/C - D/E - F/G/H - I/J/K * small base; ** very small base (under 30) ineligible for sig testing
Company Size Decision Maker Awareness Occupation
Total 2 to 49 50 to 499 500 + Primary Decision Maker
Influencer Low Medium High Manufacturing
Retail trade Finance/Insurance
A B C D E F G H I J K
Base: All Respondents 1329 336 458 535 672 657 758 384 187 321 329 250
Weighted 1329 508 426 395* 683 646 813 378* 138** 62 154 56
Industry or other association ...
Extensively 156 47 73 37 83 73 69 43 44 14 16 9 11.8% 9.3% 17.0% 9.3% 12.2% 11.3% 8.5% 11.4% 31.8% 21.8% 10.6% 15.2% AC JK J
Some 519 131 178 209 281 238 290 176 53 25 57 22 39.0% 25.9% 41.7% 53.0% 41.1% 36.8% 35.7% 46.5% 38.3% 40.2% 36.8% 38.4% A A F
A little 264 84 98 82 134 130 154 85 25 15 33 14 19.8% 16.6% 22.9% 20.7% 19.6% 20.1% 18.9% 22.6% 17.8% 24.6% 21.6% 24.8%
None 390 245 78 67 185 205 300 74 17 8 48 12 29.4% 48.2% 18.3% 17.0% 27.1% 31.8% 36.9% 19.6% 12.1% 13.4% 31.0% 21.6% BC G IK I
Summary
Top2Box (Extensively/ Some) 675 179 250 246 364 311 359 219 97 39 73 30 50.8% 35.2% 58.7% 62.2% 53.3% 48.1% 44.2% 57.8% 70.1% 62.0% 47.4% 53.6% A A F JK
Low2Box (A little/ None ) 654 329 176 149 319 335 453 159 41 24 81 26 49.2% 64.8% 41.3% 37.8% 46.7% 51.9% 55.8% 42.2% 29.9% 38.0% 52.6% 46.4% BC G I I

104
Q30_5. [Expertise within our company] How much does your company rely on guidance/advice from each of the following in determining what benefits to offer employees? ______________________________________________________________________________ Proportions/Means: Columns Tested (10% risk level) - A/B/C - D/E - F/G/H - I/J/K * small base; ** very small base (under 30) ineligible for sig testing
Company Size Decision Maker Awareness Occupation
Total 2 to 49 50 to 499 500 + Primary Decision Maker
Influencer Low Medium High Manufacturing
Retail trade Finance/Insurance
A B C D E F G H I J K
Base: All Respondents 1329 336 458 535 672 657 758 384 187 321 329 250
Weighted 1329 508 426 395* 683 646 813 378* 138** 62 154 56
Expertise within our company
Extensively 273 100 90 82 167 106 139 72 62 18 29 19 20.5% 19.8% 21.1% 20.8% 24.5% 16.3% 17.1% 18.9% 45.1% 29.6% 18.8% 33.6% E J J
Some 590 168 217 205 294 296 334 203 53 29 69 22 44.4% 33.1% 51.0% 51.8% 43.0% 45.8% 41.1% 53.7% 38.1% 47.0% 45.0% 38.4% A A F K
A little 230 93 77 60 96 134 141 83 7 11 24 8 17.3% 18.4% 18.1% 15.2% 14.1% 20.8% 17.3% 21.8% 4.9% 18.1% 15.8% 14.8%
None 236 146 42 48 126 110 199 21 16 3 31 7 17.8% 28.8% 9.8% 12.2% 18.5% 17.0% 24.5% 5.5% 11.9% 5.3% 20.4% 13.2% BC G IK I
Summary
Top2Box (Extensively/ Some) 863 269 307 287 461 402 473 275 115 48 98 40 64.9% 52.9% 72.1% 72.6% 67.5% 62.2% 58.2% 72.7% 83.2% 76.6% 63.8% 72.0% A A F J J
Low2Box (A little/ None ) 466 239 119 108 222 244 340 103 23 15 56 16 35.1% 47.1% 27.9% 27.4% 32.5% 37.8% 41.8% 27.3% 16.8% 23.4% 36.2% 28.0% BC G IK

105
Q31_1. [Current Broker/agent] How effective do you feel this guidance/ advice is? ______________________________________________________________________________ Proportions/Means: Columns Tested (10% risk level) - A/B/C - D/E - F/G/H - I/J/K * small base; ** very small base (under 30) ineligible for sig testing
Company Size Decision Maker Awareness Occupation
Total 2 to 49 50 to 499 500 + Primary Decision Maker
Influencer Low Medium High Manufacturing
Retail trade Finance/Insurance
A B C D E F G H I J K
Base: Current Broker/agent - Extensively OR Some
815 190 309 316 406 409 420 254 141 228 182 152
Weighted 793 263* 305* 224* 427* 366 446 243* 103** 44 85 34
Current Broker/agent
Highly effective 155 58 69 28 108 47 72 51 33 10 16 9 19.6% 22.1% 22.5% 12.5% 25.3% 12.9% 16.1% 20.9% 31.5% 22.8% 19.2% 25.0% E
Effective 274 105 98 70 155 118 161 79 34 17 31 13 34.5% 39.9% 32.2% 31.3% 36.4% 32.3% 36.0% 32.3% 33.1% 38.2% 36.3% 39.5%
Somewhat effective 304 83 112 109 144 159 177 91 35 14 28 9 38.3% 31.5% 36.7% 48.6% 33.8% 43.5% 39.7% 37.5% 34.3% 30.7% 33.5% 25.0% A K
Somewhat ineffective 16 2 12 2 5 11 4 11 1 2 3 2 2.0% 0.7% 3.9% 0.8% 1.1% 3.0% 0.9% 4.5% 0.6% 3.9% 3.8% 5.3%
Ineffective 11 9 1 0 1 10 3 7 0 1 1 0 1.4% 3.6% 0.4% 0.2% 0.3% 2.7% 0.7% 3.1% 0.5% 1.8% 1.1% 0.7%
I don't know 34 6 13 15 14 20 30 4 0 1 5 2 4.3% 2.1% 4.4% 6.7% 3.2% 5.6% 6.7% 1.7% - 2.6% 6.0% 4.6%
Summary
Highly effective/ Effective/ Somewhat effective
732 246 279 207 408 325 410 220 102 41 76 31
92.4% 93.5% 91.4% 92.3% 95.5% 88.7% 91.8% 90.7% 98.9% 91.7% 89.0% 89.5% E
Somewhat ineffective/ Ineffective 27 11 13 2 6 21 7 19 1 3 4 2 3.4% 4.3% 4.2% 1.0% 1.3% 5.7% 1.5% 7.6% 1.1% 5.7% 4.9% 5.9% D F
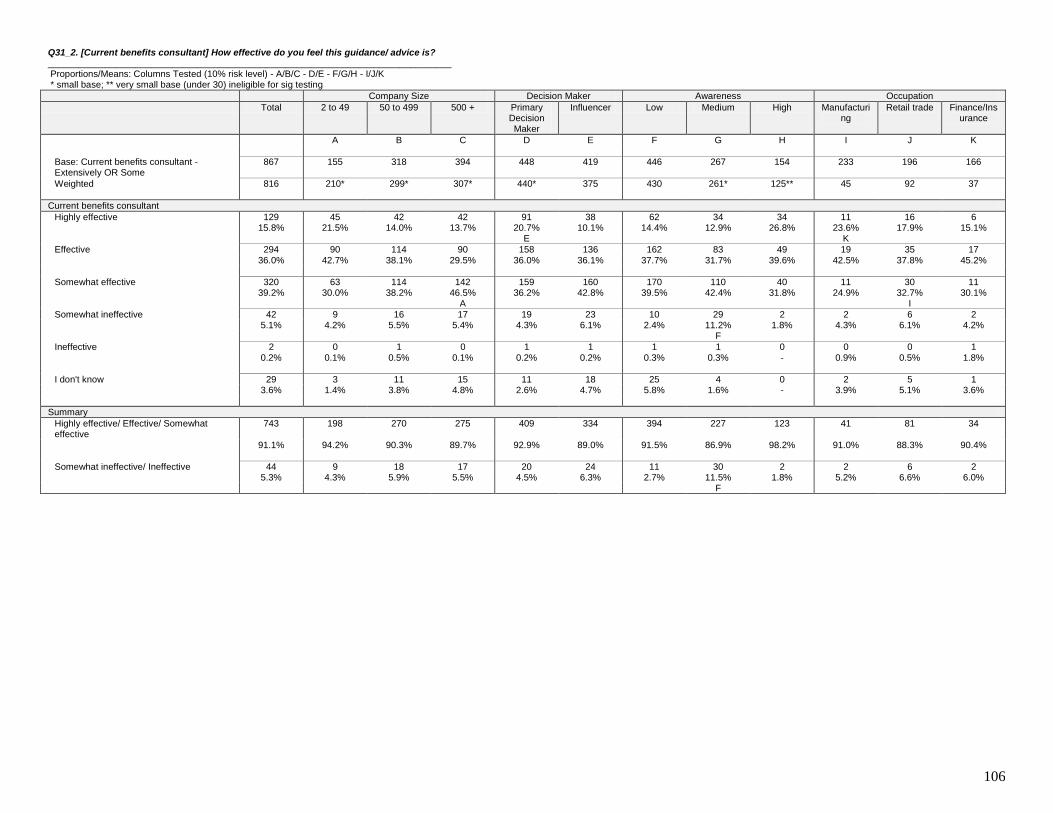
106
Q31_2. [Current benefits consultant] How effective do you feel this guidance/ advice is? ______________________________________________________________________________ Proportions/Means: Columns Tested (10% risk level) - A/B/C - D/E - F/G/H - I/J/K * small base; ** very small base (under 30) ineligible for sig testing
Company Size Decision Maker Awareness Occupation
Total 2 to 49 50 to 499 500 + Primary Decision Maker
Influencer Low Medium High Manufacturing
Retail trade Finance/Insurance
A B C D E F G H I J K
Base: Current benefits consultant - Extensively OR Some
867 155 318 394 448 419 446 267 154 233 196 166
Weighted 816 210* 299* 307* 440* 375 430 261* 125** 45 92 37
Current benefits consultant
Highly effective 129 45 42 42 91 38 62 34 34 11 16 6 15.8% 21.5% 14.0% 13.7% 20.7% 10.1% 14.4% 12.9% 26.8% 23.6% 17.9% 15.1% E K
Effective 294 90 114 90 158 136 162 83 49 19 35 17 36.0% 42.7% 38.1% 29.5% 36.0% 36.1% 37.7% 31.7% 39.6% 42.5% 37.8% 45.2%
Somewhat effective 320 63 114 142 159 160 170 110 40 11 30 11 39.2% 30.0% 38.2% 46.5% 36.2% 42.8% 39.5% 42.4% 31.8% 24.9% 32.7% 30.1% A I
Somewhat ineffective 42 9 16 17 19 23 10 29 2 2 6 2 5.1% 4.2% 5.5% 5.4% 4.3% 6.1% 2.4% 11.2% 1.8% 4.3% 6.1% 4.2% F
Ineffective 2 0 1 0 1 1 1 1 0 0 0 1 0.2% 0.1% 0.5% 0.1% 0.2% 0.2% 0.3% 0.3% - 0.9% 0.5% 1.8%
I don't know 29 3 11 15 11 18 25 4 0 2 5 1 3.6% 1.4% 3.8% 4.8% 2.6% 4.7% 5.8% 1.6% - 3.9% 5.1% 3.6%
Summary
Highly effective/ Effective/ Somewhat effective
743 198 270 275 409 334 394 227 123 41 81 34
91.1% 94.2% 90.3% 89.7% 92.9% 89.0% 91.5% 86.9% 98.2% 91.0% 88.3% 90.4%
Somewhat ineffective/ Ineffective 44 9 18 17 20 24 11 30 2 2 6 2 5.3% 4.3% 5.9% 5.5% 4.5% 6.3% 2.7% 11.5% 1.8% 5.2% 6.6% 6.0% F

107
Q31_3. [Current Insurers/Carriers] How effective do you feel this guidance/ advice is? ______________________________________________________________________________ Proportions/Means: Columns Tested (10% risk level) - A/B/C - D/E - F/G/H - I/J/K * small base; ** very small base (under 30) ineligible for sig testing
Company Size Decision Maker Awareness Occupation
Total 2 to 49 50 to 499 500 + Primary Decision Maker
Influencer Low Medium High Manufacturing
Retail trade Finance/Insurance
A B C D E F G H I J K
Base: Current Insurers/Carriers - Extensively OR Some
948 191 354 403 472 476 489 294 165 265 221 172
Weighted 890 247* 341* 302* 452* 439 476 295* 119** 52 103 39
Current Insurers/Carriers
Highly effective 128 31 60 38 95 33 54 41 34 9 17 6 14.4% 12.3% 17.5% 12.7% 21.1% 7.5% 11.3% 13.7% 28.8% 18.1% 16.3% 16.3% E
Effective 298 104 115 79 144 154 175 85 38 19 38 17 33.5% 42.1% 33.6% 26.2% 31.8% 35.2% 36.8% 28.8% 31.9% 37.0% 37.1% 43.6% C
Somewhat effective 372 88 138 147 187 185 185 143 45 18 35 11 41.8% 35.5% 40.4% 48.5% 41.4% 42.2% 38.8% 48.3% 37.5% 35.1% 34.4% 29.1%
Somewhat ineffective 54 18 15 21 10 45 31 22 1 3 7 3 6.1% 7.4% 4.5% 6.9% 2.2% 10.2% 6.5% 7.5% 1.1% 6.0% 6.3% 7.0% D
Ineffective 4 3 1 1 1 3 3 0 1 1 0 0 0.5% 1.2% 0.2% 0.3% 0.3% 0.7% 0.7% 0.1% 0.6% 1.9% 0.5% 1.2%
I don't know 33 4 13 16 15 18 29 5 0 1 6 1 3.7% 1.4% 3.9% 5.4% 3.3% 4.2% 6.0% 1.6% - 1.9% 5.4% 2.9% I
Summary
Highly effective/ Effective/ Somewhat effective
798 222 312 264 426 373 413 268 117 47 91 34
89.7% 90.0% 91.5% 87.4% 94.3% 85.0% 86.8% 90.8% 98.3% 90.2% 87.8% 89.0% E
Somewhat ineffective/ Ineffective 59 21 16 22 11 48 34 22 2 4 7 3 6.6% 8.6% 4.6% 7.1% 2.4% 10.9% 7.2% 7.6% 1.7% 7.9% 6.8% 8.1% D

108
Q31_4. [Industry or other association ....] How effective do you feel this guidance/ advice is? ______________________________________________________________________________ Proportions/Means: Columns Tested (10% risk level) - A/B/C - D/E - F/G/H - I/J/K * small base; ** very small base (under 30) ineligible for sig testing
Company Size Decision Maker Awareness Occupation
Total 2 to 49 50 to 499 500 + Primary Decision Maker
Influencer Low Medium High Manufacturing
Retail trade Finance/Insurance
A B C D E F G H I J K
Base: Industry or other association .... - Extensively OR Some
725 120 267 338 378 347 365 235 125 199 156 134
Weighted 675 179* 250* 246* 364* 311 359* 219* 97** 39 73 30
Industry or other association ....
Highly effective 102 30 49 22 88 14 28 39 35 8 11 6 15.1% 16.9% 19.8% 9.1% 24.1% 4.6% 7.8% 17.8% 36.2% 20.6% 14.7% 18.7% E F
Effective 215 58 90 67 121 94 113 71 31 15 23 11 31.9% 32.3% 36.0% 27.4% 33.3% 30.3% 31.5% 32.6% 31.6% 39.7% 32.1% 38.1%
Somewhat effective 281 78 79 124 134 147 171 80 31 12 28 9 41.6% 43.4% 31.6% 50.5% 36.7% 47.4% 47.5% 36.5% 31.5% 31.7% 39.1% 31.3% B
Somewhat ineffective 37 9 14 13 10 27 18 19 1 1 5 2 5.5% 5.1% 5.7% 5.4% 2.8% 8.5% 4.9% 8.5% 0.7% 3.0% 6.4% 5.2%
Ineffective 5 1 1 4 1 5 3 3 0 0 0 1 0.8% 0.3% 0.3% 1.7% 0.2% 1.5% 0.7% 1.3% - 0.5% 0.6% 2.2%
I don't know 34 3 17 14 11 24 27 7 0 2 5 1 5.1% 1.9% 6.7% 5.8% 2.9% 7.7% 7.5% 3.4% - 4.5% 7.1% 4.5%
Summary
Highly effective/ Effective/ Somewhat effective
598 165 219 214 342 256 312 190 96 36 63 27
88.6% 92.7% 87.4% 87.0% 94.0% 82.3% 86.8% 86.8% 99.3% 92.0% 85.9% 88.1% E J
Somewhat ineffective/ Ineffective 42 10 15 18 11 31 20 21 1 1 5 2 6.3% 5.4% 6.0% 7.2% 3.1% 10.0% 5.6% 9.8% 0.7% 3.5% 7.1% 7.5% D

109
Q31_5. [Expertise within our company] How effective do you feel this guidance/ advice is? ______________________________________________________________________________ Proportions/Means: Columns Tested (10% risk level) - A/B/C - D/E - F/G/H - I/J/K * small base; ** very small base (under 30) ineligible for sig testing
Company Size Decision Maker Awareness Occupation
Total 2 to 49 50 to 499 500 + Primary Decision Maker
Influencer Low Medium High Manufacturing
Retail trade Finance/Insurance
A B C D E F G H I J K
Base: Expertise within our company - Extensively OR Some
916 181 338 397 473 443 456 292 168 246 210 180
Weighted 863 269* 307* 287* 461* 402 473 275* 115** 48 98 40
Expertise within our company
Highly effective 159 27 79 53 129 30 58 68 33 12 18 11 18.4% 10.2% 25.7% 18.3% 28.0% 7.4% 12.3% 24.6% 28.8% 24.8% 18.1% 26.1% A E F J J
Effective 293 109 103 81 155 138 171 82 40 19 35 15 34.0% 40.7% 33.5% 28.2% 33.6% 34.4% 36.2% 29.7% 35.0% 39.8% 35.7% 37.2%
Somewhat effective 343 114 98 131 159 184 198 105 40 14 36 11 39.8% 42.5% 31.9% 45.5% 34.5% 45.8% 41.8% 38.2% 35.0% 29.3% 37.1% 27.2% B IK
Somewhat ineffective 41 14 15 13 6 35 26 14 1 2 3 2 4.8% 5.2% 4.8% 4.5% 1.3% 8.8% 5.5% 5.1% 1.2% 3.3% 3.3% 4.4% D
Ineffective 5 1 1 3 1 3 3 2 0 0 1 1 0.6% 0.3% 0.3% 1.1% 0.3% 0.9% 0.7% 0.6% - 0.4% 1.0% 2.2% I
I don't know 22 3 11 7 11 11 16 5 0 1 5 1 2.5% 1.2% 3.7% 2.4% 2.3% 2.7% 3.5% 1.8% - 2.4% 4.8% 2.8%
Summary
Highly effective/ Effective/ Somewhat effective
795 251 280 264 443 352 427 254 114 45 89 37
92.1% 93.4% 91.2% 92.0% 96.0% 87.7% 90.4% 92.4% 98.8% 93.9% 91.0% 90.6% E
Somewhat ineffective/ Ineffective 46 15 16 16 8 39 29 16 1 2 4 3 5.4% 5.4% 5.1% 5.6% 1.6% 9.6% 6.1% 5.7% 1.2% 3.7% 4.3% 6.7% D
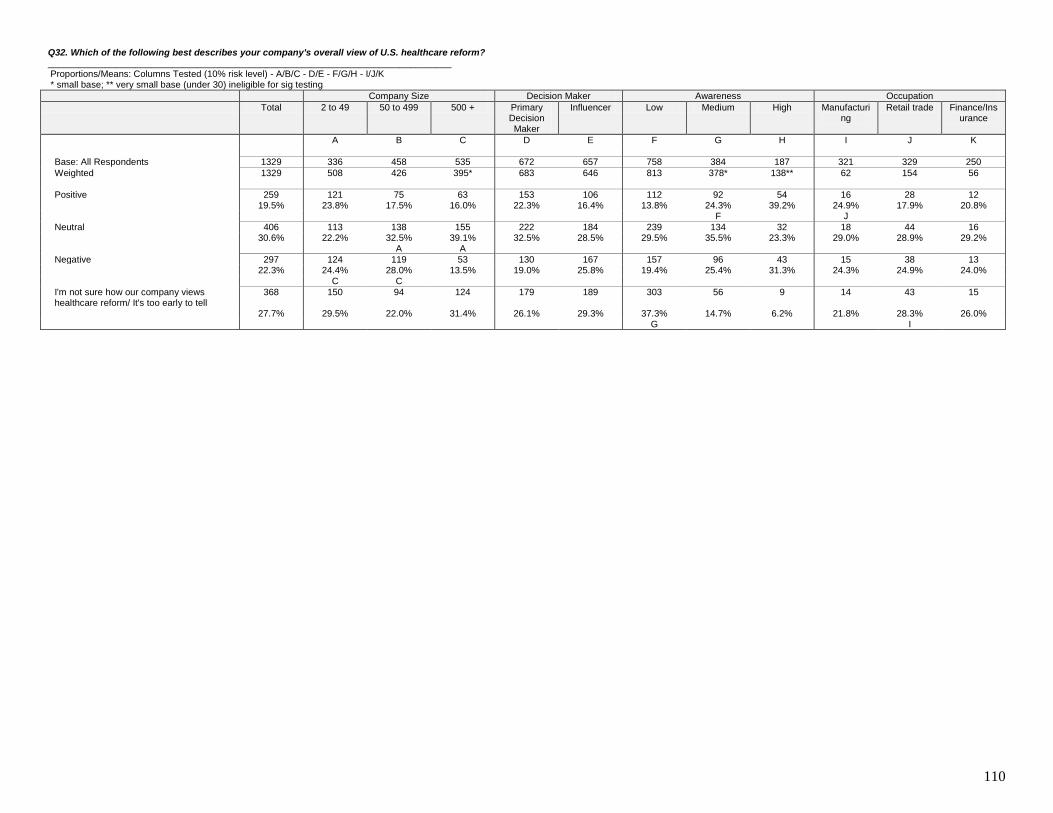
110
Q32. Which of the following best describes your company's overall view of U.S. healthcare reform? ______________________________________________________________________________ Proportions/Means: Columns Tested (10% risk level) - A/B/C - D/E - F/G/H - I/J/K * small base; ** very small base (under 30) ineligible for sig testing
Company Size Decision Maker Awareness Occupation
Total 2 to 49 50 to 499 500 + Primary Decision Maker
Influencer Low Medium High Manufacturing
Retail trade Finance/Insurance
A B C D E F G H I J K
Base: All Respondents 1329 336 458 535 672 657 758 384 187 321 329 250
Weighted 1329 508 426 395* 683 646 813 378* 138** 62 154 56
Positive 259 121 75 63 153 106 112 92 54 16 28 12 19.5% 23.8% 17.5% 16.0% 22.3% 16.4% 13.8% 24.3% 39.2% 24.9% 17.9% 20.8% F J
Neutral 406 113 138 155 222 184 239 134 32 18 44 16 30.6% 22.2% 32.5% 39.1% 32.5% 28.5% 29.5% 35.5% 23.3% 29.0% 28.9% 29.2% A A
Negative 297 124 119 53 130 167 157 96 43 15 38 13 22.3% 24.4% 28.0% 13.5% 19.0% 25.8% 19.4% 25.4% 31.3% 24.3% 24.9% 24.0% C C
I'm not sure how our company views healthcare reform/ It's too early to tell
368 150 94 124 179 189 303 56 9 14 43 15
27.7% 29.5% 22.0% 31.4% 26.1% 29.3% 37.3% 14.7% 6.2% 21.8% 28.3% 26.0% G I
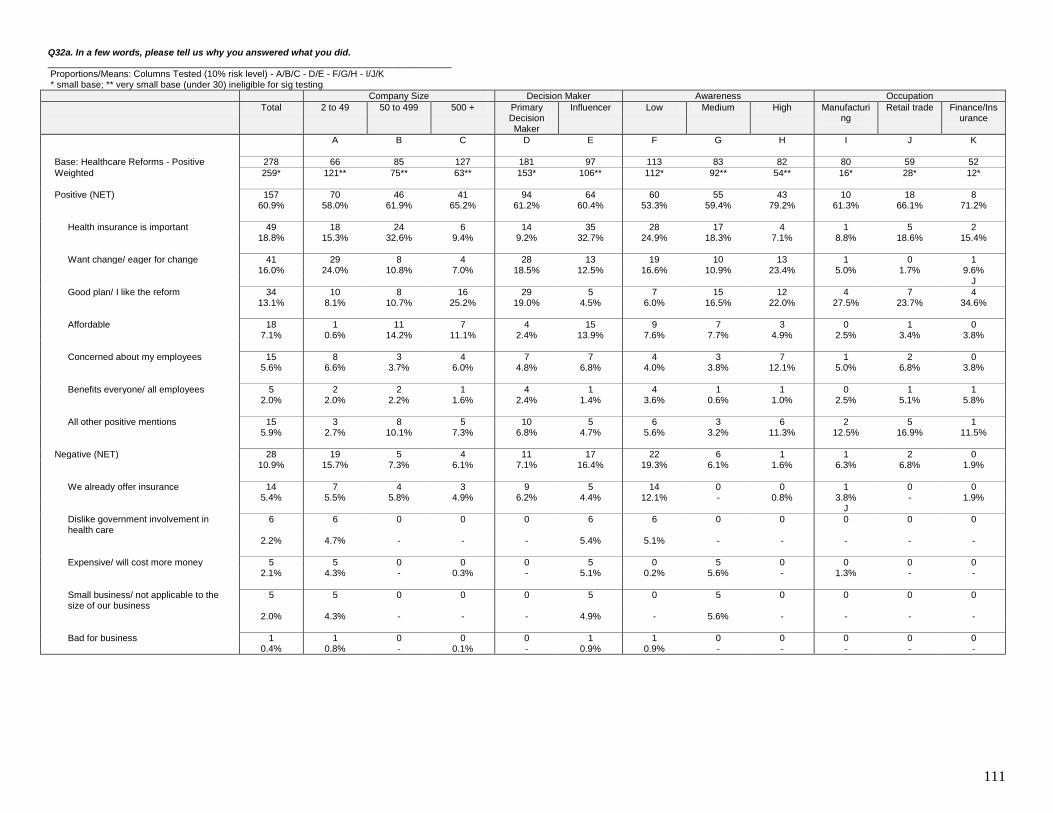
111
Q32a. In a few words, please tell us why you answered what you did. ______________________________________________________________________________ Proportions/Means: Columns Tested (10% risk level) - A/B/C - D/E - F/G/H - I/J/K * small base; ** very small base (under 30) ineligible for sig testing
Company Size Decision Maker Awareness Occupation
Total 2 to 49 50 to 499 500 + Primary Decision Maker
Influencer Low Medium High Manufacturing
Retail trade Finance/Insurance
A B C D E F G H I J K
Base: Healthcare Reforms - Positive 278 66 85 127 181 97 113 83 82 80 59 52
Weighted 259* 121** 75** 63** 153* 106** 112* 92** 54** 16* 28* 12*
Positive (NET) 157 70 46 41 94 64 60 55 43 10 18 8 60.9% 58.0% 61.9% 65.2% 61.2% 60.4% 53.3% 59.4% 79.2% 61.3% 66.1% 71.2%
Health insurance is important 49 18 24 6 14 35 28 17 4 1 5 2 18.8% 15.3% 32.6% 9.4% 9.2% 32.7% 24.9% 18.3% 7.1% 8.8% 18.6% 15.4%
Want change/ eager for change 41 29 8 4 28 13 19 10 13 1 0 1 16.0% 24.0% 10.8% 7.0% 18.5% 12.5% 16.6% 10.9% 23.4% 5.0% 1.7% 9.6% J
Good plan/ I like the reform 34 10 8 16 29 5 7 15 12 4 7 4 13.1% 8.1% 10.7% 25.2% 19.0% 4.5% 6.0% 16.5% 22.0% 27.5% 23.7% 34.6%
Affordable 18 1 11 7 4 15 9 7 3 0 1 0 7.1% 0.6% 14.2% 11.1% 2.4% 13.9% 7.6% 7.7% 4.9% 2.5% 3.4% 3.8%
Concerned about my employees 15 8 3 4 7 7 4 3 7 1 2 0 5.6% 6.6% 3.7% 6.0% 4.8% 6.8% 4.0% 3.8% 12.1% 5.0% 6.8% 3.8%
Benefits everyone/ all employees 5 2 2 1 4 1 4 1 1 0 1 1 2.0% 2.0% 2.2% 1.6% 2.4% 1.4% 3.6% 0.6% 1.0% 2.5% 5.1% 5.8%
All other positive mentions 15 3 8 5 10 5 6 3 6 2 5 1 5.9% 2.7% 10.1% 7.3% 6.8% 4.7% 5.6% 3.2% 11.3% 12.5% 16.9% 11.5%
Negative (NET) 28 19 5 4 11 17 22 6 1 1 2 0 10.9% 15.7% 7.3% 6.1% 7.1% 16.4% 19.3% 6.1% 1.6% 6.3% 6.8% 1.9%
We already offer insurance 14 7 4 3 9 5 14 0 0 1 0 0 5.4% 5.5% 5.8% 4.9% 6.2% 4.4% 12.1% - 0.8% 3.8% - 1.9% J
Dislike government involvement in health care
6 6 0 0 0 6 6 0 0 0 0 0
2.2% 4.7% - - - 5.4% 5.1% - - - - -
Expensive/ will cost more money 5 5 0 0 0 5 0 5 0 0 0 0 2.1% 4.3% - 0.3% - 5.1% 0.2% 5.6% - 1.3% - -
Small business/ not applicable to the size of our business
5 5 0 0 0 5 0 5 0 0 0 0
2.0% 4.3% - - - 4.9% - 5.6% - - - -
Bad for business 1 1 0 0 0 1 1 0 0 0 0 0 0.4% 0.8% - 0.1% - 0.9% 0.9% - - - - -

112
Q32a. In a few words, please tell us why you answered what you did. ______________________________________________________________________________ Proportions/Means: Columns Tested (10% risk level) - A/B/C - D/E - F/G/H - I/J/K * small base; ** very small base (under 30) ineligible for sig testing
Company Size Decision Maker Awareness Occupation
Total 2 to 49 50 to 499 500 + Primary Decision Maker
Influencer Low Medium High Manufacturing
Retail trade Finance/Insurance
A B C D E F G H I J K
Need more information 1 0 0 0 1 0 0 0 0 0 1 0 0.4% 0.4% 0.6% - 0.6% - 0.4% - 0.9% - 3.4% -
Congress/ the government (incl. Obama/ the president)
0 0 0 0 0 0 0 0 0 0 0 0
0.2% - 0.6% - 0.3% - - 0.5% - - 1.7% -
Not interested 0 0 0 0 0 0 0 0 0 0 0 0 0.1% - - 0.3% 0.1% - - - 0.4% 1.3% - -
Greatly impacts (all other) benefits/ need to reconsider the company benefit package
0 0 0 0 0 0 0 0 0 0 0 0
0.1% - 0.3% - - 0.2% 0.2% - - 1.3% - -
All other negative mentions 0 0 0 0 0 0 0 0 0 0 0 0 0.2% - - 0.7% - 0.4% 0.4% - - - 1.7% -
Other 22 17 3 2 2 20 8 13 1 1 2 1 8.5% 14.1% 4.2% 3.1% 1.5% 18.6% 7.6% 14.0% 1.2% 8.8% 6.8% 7.7%
Nothing 18 2 6 9 14 4 5 10 3 2 1 1 6.8% 1.9% 8.3% 14.5% 9.2% 3.3% 4.5% 10.8% 4.8% 15.0% 5.1% 5.8% J
(DK/NS) 40 19 14 7 32 8 24 9 7 2 5 2 15.5% 15.6% 18.8% 11.5% 21.2% 7.3% 21.2% 9.7% 13.6% 11.3% 16.9% 15.4%

113
Q32a. In a few words, please tell us why you answered what you did. ______________________________________________________________________________ Proportions/Means: Columns Tested (10% risk level) - A/B/C - D/E - F/G/H - I/J/K * small base; ** very small base (under 30) ineligible for sig testing
Company Size Decision Maker Awareness Occupation
Total 2 to 49 50 to 499 500 + Primary Decision Maker
Influencer Low Medium High Manufacturing
Retail trade Finance/Insurance
A B C D E F G H I J K
Base: Healthcare Reforms - Neutral 384 93 143 148 208 176 205 142 37 93 95 73
Weighted 406* 113* 138** 155** 222* 184* 239* 134** 32** 18* 44* 16*
Negative (NET) 123 37 42 44 57 66 88 27 8 6 12 5 30.3% 33.2% 30.0% 28.4% 25.5% 36.0% 36.6% 20.0% 25.8% 34.4% 26.3% 32.9%
Need more information 32 14 16 3 19 13 21 11 1 2 4 1 8.0% 12.2% 11.3% 2.0% 8.5% 7.3% 8.8% 7.9% 2.4% 9.7% 8.4% 6.8%
Good for some employees (but not all) 20 4 6 9 7 13 15 5 0 0 0 1 4.8% 3.5% 4.6% 5.9% 3.1% 6.9% 6.3% 3.4% - 2.2% 1.1% 6.8% J
Expensive/ will cost more money 12 3 2 7 7 5 9 2 1 1 1 1 3.0% 2.8% 1.3% 4.6% 3.2% 2.7% 3.9% 1.3% 2.6% 3.2% 3.2% 5.5%
Does not impact my company 10 7 1 2 4 5 3 1 5 0 1 0 2.4% 6.2% 0.7% 1.0% 1.9% 2.9% 1.4% 0.7% 16.0% 1.1% 3.2% 2.7%
More changes to come/ this is just a draft bill
10 0 2 8 3 7 8 1 1 1 1 0
2.3% 0.2% 1.2% 5.0% 1.2% 3.7% 3.2% 0.6% 2.8% 5.4% 3.2% 2.7%
Too complex 6 0 0 6 3 3 6 0 0 0 1 0 1.5% - - 4.0% 1.4% 1.7% 2.4% 0.3% - - 2.1% -
Benefits no one/ doesn't benefit anyone (country/economy)
6 0 5 0 3 3 0 6 0 0 0 0
1.4% 0.2% 3.8% - 1.2% 1.6% - 4.1% - - - 1.4%
Not optional/ dislike being forced (to buy insurance)
5 4 1 0 0 5 4 0 0 1 0 0
1.2% 3.5% 0.4% 0.1% 0.1% 2.4% 1.8% 0.3% - 3.2% - 1.4% J
We already offer insurance 4 0 0 4 3 1 2 1 1 0 0 0 1.0% - 0.3% 2.4% 1.3% 0.7% 1.0% 0.8% 2.1% 2.2% 1.1% 1.4%
Not interested 4 3 0 0 3 1 3 0 0 0 0 0 0.9% 2.7% 0.2% 0.3% 1.4% 0.3% 1.4% - 1.4% - 1.1% -
Dislike government involvement in health care
3 0 2 0 1 3 2 1 0 0 1 0
0.8% 0.4% 1.7% 0.3% 0.3% 1.5% 0.9% 0.8% - 1.1% 2.1% -
Plan insures dependants 3 0 0 3 3 0 3 0 0 0 0 0 0.8% 0.2% 0.1% 1.7% 1.2% 0.2% 1.2% 0.2% - 1.1% - 1.4%
Not legal/ violates the constitution 3 0 0 3 3 0 3 0 0 0 0 0 0.7% - - 1.7% 1.2% - 1.1% - - - - -
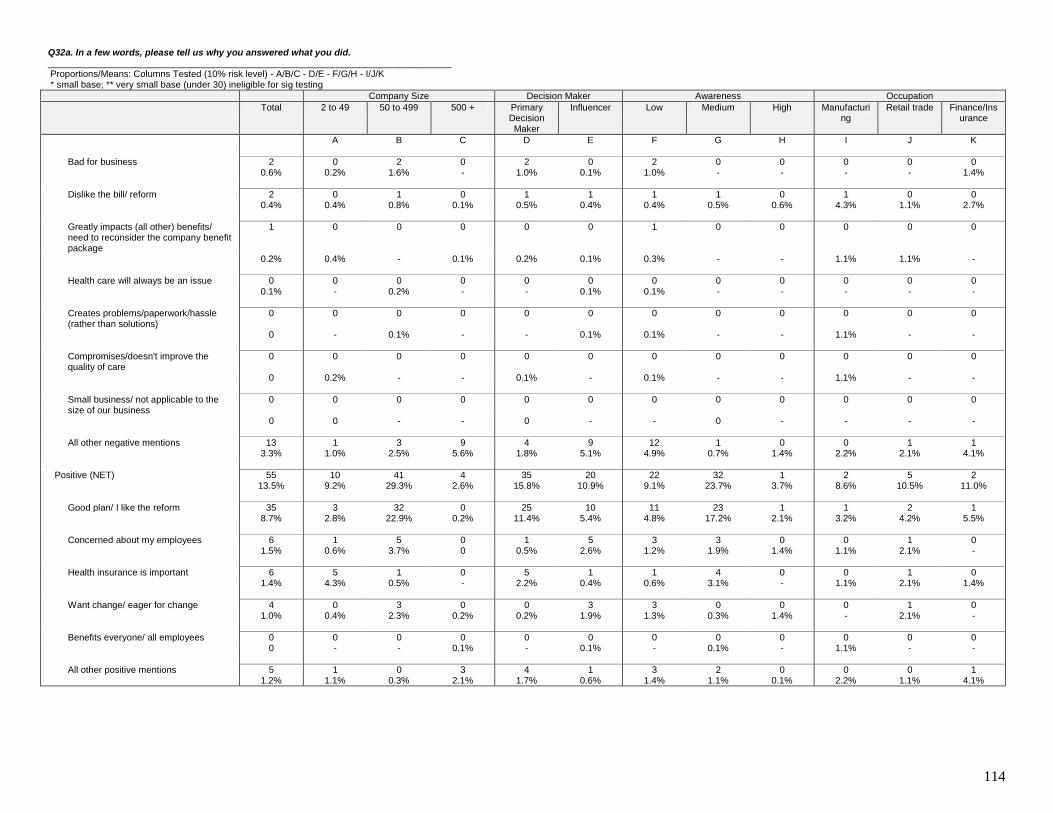
114
Q32a. In a few words, please tell us why you answered what you did. ______________________________________________________________________________ Proportions/Means: Columns Tested (10% risk level) - A/B/C - D/E - F/G/H - I/J/K * small base; ** very small base (under 30) ineligible for sig testing
Company Size Decision Maker Awareness Occupation
Total 2 to 49 50 to 499 500 + Primary Decision Maker
Influencer Low Medium High Manufacturing
Retail trade Finance/Insurance
A B C D E F G H I J K
Bad for business 2 0 2 0 2 0 2 0 0 0 0 0 0.6% 0.2% 1.6% - 1.0% 0.1% 1.0% - - - - 1.4%
Dislike the bill/ reform 2 0 1 0 1 1 1 1 0 1 0 0 0.4% 0.4% 0.8% 0.1% 0.5% 0.4% 0.4% 0.5% 0.6% 4.3% 1.1% 2.7%
Greatly impacts (all other) benefits/ need to reconsider the company benefit package
1 0 0 0 0 0 1 0 0 0 0 0
0.2% 0.4% - 0.1% 0.2% 0.1% 0.3% - - 1.1% 1.1% -
Health care will always be an issue 0 0 0 0 0 0 0 0 0 0 0 0 0.1% - 0.2% - - 0.1% 0.1% - - - - -
Creates problems/paperwork/hassle (rather than solutions)
0 0 0 0 0 0 0 0 0 0 0 0
0 - 0.1% - - 0.1% 0.1% - - 1.1% - -
Compromises/doesn't improve the quality of care
0 0 0 0 0 0 0 0 0 0 0 0
0 0.2% - - 0.1% - 0.1% - - 1.1% - -
Small business/ not applicable to the size of our business
0 0 0 0 0 0 0 0 0 0 0 0
0 0 - - 0 - - 0 - - - -
All other negative mentions 13 1 3 9 4 9 12 1 0 0 1 1 3.3% 1.0% 2.5% 5.6% 1.8% 5.1% 4.9% 0.7% 1.4% 2.2% 2.1% 4.1%
Positive (NET) 55 10 41 4 35 20 22 32 1 2 5 2 13.5% 9.2% 29.3% 2.6% 15.8% 10.9% 9.1% 23.7% 3.7% 8.6% 10.5% 11.0%
Good plan/ I like the reform 35 3 32 0 25 10 11 23 1 1 2 1 8.7% 2.8% 22.9% 0.2% 11.4% 5.4% 4.8% 17.2% 2.1% 3.2% 4.2% 5.5%
Concerned about my employees 6 1 5 0 1 5 3 3 0 0 1 0 1.5% 0.6% 3.7% 0 0.5% 2.6% 1.2% 1.9% 1.4% 1.1% 2.1% -
Health insurance is important 6 5 1 0 5 1 1 4 0 0 1 0 1.4% 4.3% 0.5% - 2.2% 0.4% 0.6% 3.1% - 1.1% 2.1% 1.4%
Want change/ eager for change 4 0 3 0 0 3 3 0 0 0 1 0 1.0% 0.4% 2.3% 0.2% 0.2% 1.9% 1.3% 0.3% 1.4% - 2.1% -
Benefits everyone/ all employees 0 0 0 0 0 0 0 0 0 0 0 0 0 - - 0.1% - 0.1% - 0.1% - 1.1% - -
All other positive mentions 5 1 0 3 4 1 3 2 0 0 0 1 1.2% 1.1% 0.3% 2.1% 1.7% 0.6% 1.4% 1.1% 0.1% 2.2% 1.1% 4.1%

115
Q32a. In a few words, please tell us why you answered what you did. ______________________________________________________________________________ Proportions/Means: Columns Tested (10% risk level) - A/B/C - D/E - F/G/H - I/J/K * small base; ** very small base (under 30) ineligible for sig testing
Company Size Decision Maker Awareness Occupation
Total 2 to 49 50 to 499 500 + Primary Decision Maker
Influencer Low Medium High Manufacturing
Retail trade Finance/Insurance
A B C D E F G H I J K
Will wait and see/ am neutral on the matter 26 13 9 4 16 10 18 7 1 1 3 1 6.4% 11.6% 6.5% 2.6% 7.3% 5.3% 7.4% 5.5% 2.9% 3.2% 7.4% 4.1%
Neither good nor bad 1 0 1 1 1 0 1 0 0 0 0 1 0.3% - 0.5% 0.4% 0.5% 0.1% 0.5% 0.2% - 1.1% 1.1% 4.1%
Other 62 30 5 27 37 25 17 25 20 1 6 3 15.2% 26.4% 3.7% 17.4% 16.6% 13.5% 7.2% 18.5% 61.1% 5.4% 13.7% 19.2% I I
Nothing 47 6 19 22 22 25 23 24 0 3 2 2 11.7% 5.3% 13.7% 14.5% 10.0% 13.7% 9.7% 17.7% 1.2% 16.1% 5.3% 9.6% J
(DK/NS) 101 20 26 55 60 41 79 20 2 6 17 3 24.8% 17.7% 18.6% 35.6% 27.1% 22.0% 32.9% 14.6% 7.4% 32.3% 38.9% 20.5% K K

116
Q32a. In a few words, please tell us why you answered what you did. ______________________________________________________________________________ Proportions/Means: Columns Tested (10% risk level) - A/B/C - D/E - F/G/H - I/J/K * small base; ** very small base (under 30) ineligible for sig testing
Company Size Decision Maker Awareness Occupation
Total 2 to 49 50 to 499 500 + Primary Decision Maker
Influencer Low Medium High Manufacturing
Retail trade Finance/Insurance
A B C D E F G H I J K
Base: Healthcare Reforms - Negative 316 98 132 86 132 184 167 97 52 78 82 60
Weighted 297* 124* 119* 53** 130* 167* 157* 96** 43** 15* 38* 13*
Negative (NET) 260 110 109 41 116 144 130 88 41 12 31 9 87.4% 88.4% 91.1% 77.0% 89.0% 86.2% 82.7% 91.8% 94.9% 82.1% 80.5% 65.0% K K
Expensive/ will cost more money 126 51 57 18 51 75 53 48 26 6 12 5 42.5% 40.8% 48.0% 34.2% 39.2% 45.1% 33.4% 49.8% 59.6% 38.5% 31.7% 38.3%
Dislike government involvement in health care
62 31 27 4 33 29 20 28 14 2 9 1
20.9% 24.8% 22.7% 8.0% 25.5% 17.4% 12.8% 29.2% 32.2% 14.1% 23.2% 10.0% K
Dislike the bill/ reform 37 22 11 4 20 16 32 3 1 2 3 1 12.3% 17.5% 8.9% 7.9% 15.5% 9.8% 20.6% 3.3% 2.3% 10.3% 8.5% 8.3%
Not optional/ dislike being forced (to buy insurance)
29 14 11 3 8 20 13 8 7 1 7 1
9.6% 11.6% 9.6% 5.3% 6.5% 12.1% 8.5% 8.2% 16.9% 5.1% 18.3% 8.3% I
Compromises/doesn't improve the quality of care
16 6 6 4 14 2 10 0 5 1 1 0
5.3% 4.9% 5.1% 6.7% 10.7% 1.1% 6.4% 0.4% 12.0% 3.8% 3.7% 3.3% E
Greatly impacts (all other) benefits/ need to reconsider the company benefit package
14 12 2 0 1 14 13 1 1 0 1 0
4.8% 9.9% 1.3% 0.8% 0.5% 8.2% 8.1% 0.9% 1.5% 2.6% 3.7% 1.7% D
Bad for business 13 11 1 1 6 6 6 2 4 0 4 1 4.2% 8.7% 0.8% 1.4% 4.9% 3.7% 3.9% 2.2% 9.8% - 11.0% 6.7% I I
We already offer insurance 11 0 6 6 5 6 4 8 0 1 0 0 3.9% - 4.7% 10.9% 4.1% 3.6% 2.3% 8.2% - 3.8% 1.2% -
Need more information 9 0 5 3 3 5 3 5 0 0 0 0 2.9% 0.4% 4.6% 5.0% 2.4% 3.3% 2.2% 5.4% - - 1.2% -
Too complex 8 3 1 4 6 1 3 0 4 0 1 0 2.6% 2.2% 0.7% 7.7% 4.9% 0.8% 2.0% 0.2% 10.0% 2.6% 2.4% 1.7%
Health care will always be an issue 7 0 3 4 7 0 3 0 4 0 0 0 2.4% - 2.4% 7.9% 5.1% 0.3% 1.7% 0.5% 9.1% 1.3% - -
Benefits no one/ doesn't benefit anyone (country/economy)
6 2 3 1 2 3 2 2 1 1 2 1
1.9% 1.5% 2.4% 1.8% 1.8% 2.0% 1.5% 2.1% 2.8% 9.0% 4.9% 5.0%
Not legal/ violates the constitution 5 1 4 0 5 1 4 0 1 0 1 0 1.8% 0.8% 3.7% 0.1% 3.7% 0.3% 2.8% - 2.2% - 3.7% -

117
Q32a. In a few words, please tell us why you answered what you did. ______________________________________________________________________________ Proportions/Means: Columns Tested (10% risk level) - A/B/C - D/E - F/G/H - I/J/K * small base; ** very small base (under 30) ineligible for sig testing
Company Size Decision Maker Awareness Occupation
Total 2 to 49 50 to 499 500 + Primary Decision Maker
Influencer Low Medium High Manufacturing
Retail trade Finance/Insurance
A B C D E F G H I J K
Does not impact my company 5 5 0 0 0 5 0 5 0 0 0 0 1.7% 4.2% - - - 3.1% - 5.4% - - - -
Too many rules 5 1 0 4 4 1 0 0 5 0 0 0 1.7% 0.7% 0.2% 7.4% 3.0% 0.7% - - 11.6% - - 1.7%
More changes to come/ this is just a draft bill
4 2 2 0 3 1 2 1 1 1 0 0
1.2% 1.5% 1.4% 0.4% 2.0% 0.6% 1.5% 0.7% 1.5% 5.1% 1.2% 3.3%
Creates problems/paperwork/hassle (rather than solutions)
3 1 2 0 1 2 2 1 0 1 1 0
1.0% 0.8% 1.4% 0.8% 0.6% 1.4% 1.4% 0.7% 0.5% 3.8% 3.7% 3.3%
Plan insures dependants 3 0 3 0 2 0 0 2 0 0 0 0 0.9% - 2.2% - 1.7% 0.3% 0.3% 2.3% - - 1.2% -
Congress/ the government (incl. Obama/ the president)
1 1 0 0 1 1 1 1 0 1 0 0
0.5% 0.7% 0.2% 0.7% 0.7% 0.3% 0.5% 0.6% - 3.8% 1.2% 1.7%
Small business/ not applicable to the size of our business
1 1 1 0 1 1 1 0 0 0 1 0
0.5% 0.4% 0.6% 0.4% 0.4% 0.5% 0.6% 0.5% - 2.6% 2.4% -
Not interested 1 0 0 0 0 1 1 0 0 0 0 0 0.3% - 0.4% 0.7% 0.1% 0.4% 0.4% 0.2% - 2.6% 1.2% -
All other negative mentions 31 17 12 2 20 11 17 4 9 1 2 1 10.4% 13.7% 10.1% 3.5% 15.2% 6.6% 11.1% 4.4% 21.2% 9.0% 6.1% 5.0%
Positive (NET) 6 1 0 5 5 1 5 1 0 1 1 0 2.1% 0.7% 0.2% 9.6% 3.9% 0.7% 3.3% 0.9% 0.5% 3.8% 3.7% 1.7%
Affordable 4 0 0 4 4 0 4 0 0 0 0 0 1.3% - - 7.4% 3.0% - 2.5% - - - - -
Health insurance is important 1 1 0 1 1 1 1 0 0 0 1 0 0.4% 0.4% - 1.3% 0.5% 0.3% 0.3% 0.5% 0.5% - 2.4% 1.7%
Want change/ eager for change 1 0 0 1 1 0 1 0 0 0 0 0 0.3% 0.2% - 1.3% 0.5% 0.1% 0.4% - 0.5% 1.3% 1.2% 1.7%
Concerned about my employees 1 0 0 0 0 0 0 1 0 0 0 0 0.2% - 0.2% 0.9% 0.4% 0.1% - 0.7% - 1.3% 1.2% -
All other positive mentions 0 0 0 0 0 0 0 0 0 0 0 0 0.1% 0.2% - 0.1% 0 0.1% 0 0.2% - 1.3% - -

118
Q32a. In a few words, please tell us why you answered what you did. ______________________________________________________________________________ Proportions/Means: Columns Tested (10% risk level) - A/B/C - D/E - F/G/H - I/J/K * small base; ** very small base (under 30) ineligible for sig testing
Company Size Decision Maker Awareness Occupation
Total 2 to 49 50 to 499 500 + Primary Decision Maker
Influencer Low Medium High Manufacturing
Retail trade Finance/Insurance
A B C D E F G H I J K
Other 20 5 12 3 9 11 13 4 2 2 5 2 6.7% 4.3% 10.0% 5.0% 6.7% 6.7% 8.4% 4.6% 5.1% 11.5% 12.2% 15.0%
Nothing 5 1 0 3 0 5 4 1 0 0 1 1 1.8% 1.1% 0.4% 6.3% 0.4% 2.8% 2.8% 0.6% 0.5% 2.6% 3.7% 5.0%
(DK/NS) 11 7 2 1 3 8 5 5 0 1 1 2 3.6% 5.9% 1.7% 2.5% 2.1% 4.7% 3.3% 5.5% 0.5% 6.4% 3.7% 13.3% J

119
Q33. On a scale of 1-5, how much effort has your company invested so far in preparing for and responding to healthcare reform? ______________________________________________________________________________ Proportions/Means: Columns Tested (10% risk level) - A/B/C - D/E - F/G/H - I/J/K * small base; ** very small base (under 30) ineligible for sig testing
Company Size Decision Maker Awareness Occupation
Total 2 to 49 50 to 499 500 + Primary Decision Maker
Influencer Low Medium High Manufacturing
Retail trade Finance/Insurance
A B C D E F G H I J K
Base: All Respondents 1329 336 458 535 672 657 758 384 187 321 329 250
Weighted 1329 508 426 395* 683 646 813 378* 138** 62 154 56
5 - A lot 97 41 26 30 58 39 36 16 46 5 9 7 7.3% 8.1% 6.1% 7.7% 8.6% 6.0% 4.4% 4.2% 33.1% 7.8% 5.8% 12.4% IJ
4 186 64 59 62 132 54 82 68 36 16 21 9 14.0% 12.7% 13.9% 15.7% 19.3% 8.4% 10.0% 18.1% 25.8% 26.2% 14.0% 16.4% E F JK
3 - Some 464 121 187 156 239 225 254 163 48 25 50 16 34.9% 23.9% 43.8% 39.5% 35.0% 34.9% 31.2% 43.1% 34.4% 39.6% 32.8% 29.2% A A F JK
2 133 56 55 22 63 70 64 65 3 6 15 6 10.0% 11.0% 12.8% 5.6% 9.2% 10.8% 7.9% 17.3% 2.1% 9.0% 10.0% 11.2% C F
1 - None 201 155 36 10 80 121 163 32 6 4 24 5 15.1% 30.5% 8.4% 2.6% 11.7% 18.7% 20.0% 8.5% 4.2% 6.9% 15.8% 9.2% BC C D G IK
I don’t know 248 70 64 114 112 137 214 33 1 7 33 12 18.7% 13.9% 15.0% 28.8% 16.3% 21.2% 26.4% 8.8% 0.4% 10.6% 21.6% 21.6% AB G I I
Summary
Top2Box 283 105 85 93 190 93 117 84 81 21 30 16 21.3% 20.8% 20.0% 23.4% 27.8% 14.4% 14.4% 22.3% 58.9% 34.0% 19.8% 28.8% E F J J
Low2Box 333 211 90 33 143 191 227 98 9 10 40 11 25.1% 41.5% 21.2% 8.2% 20.9% 29.6% 28.0% 25.8% 6.2% 15.9% 25.8% 20.4% BC C D I
Mean 2.9 2.5 3.0 3.3 3.0 2.6 2.6 2.9 3.8 3.2 2.8 3.1 A AB E F J J
Std. Dev. 1.2 1.3 1.0 0.9 1.1 1.2 1.2 1.0 1.1 1.0 1.2 1.2
Std. Err. 0 0.1 0.1 0 0 0.1 0.1 0.1 0.1 0.1 0.1 0.1
Median 2.4 2.1 2.5 2.7 2.6 2.3 2.3 2.5 3.4 2.7 2.4 2.6

120
Q34_1. [Current Broker/agent] From what external parties have you sought and/or received advice about preparing for healthcare reform? ______________________________________________________________________________ Proportions/Means: Columns Tested (10% risk level) - A/B/C - D/E - F/G/H - I/J/K * small base; ** very small base (under 30) ineligible for sig testing
Company Size Decision Maker Awareness Occupation
Total 2 to 49 50 to 499 500 + Primary Decision Maker
Influencer Low Medium High Manufacturing
Retail trade Finance/Insurance
A B C D E F G H I J K
Base: All respondents 1329 336 458 535 672 657 758 384 187 321 329 250
Weighted 1329 508 426 395* 683 646 813 378* 138** 62 154 56
Current Broker/agent
Extensively 225 92 99 34 151 73 100 66 59 15 22 13 16.9% 18.2% 23.2% 8.5% 22.1% 11.4% 12.3% 17.5% 42.5% 23.7% 14.6% 22.4% C C E J J
Some 459 167 152 140 231 228 231 165 62 28 52 19 34.5% 32.8% 35.8% 35.5% 33.8% 35.4% 28.5% 43.7% 45.1% 44.5% 33.7% 33.6% F JK
A little 173 45 70 58 70 103 87 76 9 7 20 6 13.0% 8.9% 16.5% 14.6% 10.2% 15.9% 10.7% 20.2% 6.6% 11.2% 13.1% 10.0% A F
None 473 204 105 164 232 241 394 70 8 13 59 19 35.6% 40.1% 24.6% 41.5% 33.9% 37.3% 48.5% 18.6% 5.8% 20.6% 38.6% 34.0% B B G I I
Summary
Top2Box (Extensively/ Some) 684 259 251 174 382 302 331 232 121 43 74 31 51.4% 51.0% 58.9% 44.0% 55.9% 46.8% 40.7% 61.2% 87.6% 68.2% 48.3% 56.0% C E F JK J
Low2Box (A little/ None) 645 249 175 222 301 344 482 147 17 20 79 25 48.6% 49.0% 41.1% 56.0% 44.1% 53.2% 59.3% 38.8% 12.4% 31.8% 51.7% 44.0% B D G IK I

121
Q34_2. [Other broker/agents] From what external parties have you sought and/or received advice about preparing for healthcare reform? ______________________________________________________________________________ Proportions/Means: Columns Tested (10% risk level) - A/B/C - D/E - F/G/H - I/J/K * small base; ** very small base (under 30) ineligible for sig testing
Company Size Decision Maker Awareness Occupation
Total 2 to 49 50 to 499 500 + Primary Decision Maker
Influencer Low Medium High Manufacturing
Retail trade Finance/Insurance
A B C D E F G H I J K
Base: All respondents 1329 336 458 535 672 657 758 384 187 321 329 250
Weighted 1329 508 426 395* 683 646 813 378* 138** 62 154 56
Other broker/agents
Extensively 93 19 53 21 75 17 17 42 34 8 12 5 7.0% 3.7% 12.5% 5.2% 11.0% 2.7% 2.0% 11.2% 24.4% 12.1% 7.9% 9.2% AC E F J
Some 374 148 114 112 237 137 199 108 67 22 40 14 28.1% 29.2% 26.7% 28.3% 34.7% 21.2% 24.5% 28.5% 48.5% 34.9% 26.1% 25.2% E JK
A little 207 47 85 75 67 140 95 101 11 12 30 11 15.6% 9.3% 19.9% 19.1% 9.8% 21.7% 11.7% 26.6% 8.0% 19.3% 19.8% 19.2% A A D F
None 655 294 174 187 304 351 502 127 26 21 71 26 49.3% 57.9% 40.9% 47.4% 44.5% 54.4% 61.7% 33.7% 19.1% 33.6% 46.2% 46.4% B D G I I
Summary
Top2Box (Extensively/ Some) 466 167 167 133 312 154 216 150 101 29 52 19 35.1% 32.9% 39.2% 33.5% 45.7% 23.9% 26.5% 39.7% 72.9% 47.0% 34.0% 34.4% E F JK
Low2Box (A little/ None) 863 341 259 263 371 491 597 228 37 33 101 37 64.9% 67.1% 60.8% 66.5% 54.3% 76.1% 73.5% 60.3% 27.1% 53.0% 66.0% 65.6% D G I I

122
Q34_3. [Current benefits consultant] From what external parties have you sought and/or received advice about preparing for healthcare reform? ______________________________________________________________________________ Proportions/Means: Columns Tested (10% risk level) - A/B/C - D/E - F/G/H - I/J/K * small base; ** very small base (under 30) ineligible for sig testing
Company Size Decision Maker Awareness Occupation
Total 2 to 49 50 to 499 500 + Primary Decision Maker
Influencer Low Medium High Manufacturing
Retail trade Finance/Insurance
A B C D E F G H I J K
Base: All respondents 1329 336 458 535 672 657 758 384 187 321 329 250
Weighted 1329 508 426 395* 683 646 813 378* 138** 62 154 56
Current benefits consultant
Extensively 159 37 84 38 110 49 56 55 47 12 22 10 11.9% 7.3% 19.7% 9.5% 16.0% 7.6% 6.9% 14.6% 34.2% 19.9% 14.6% 18.4% AC E F J
Some 432 142 150 140 235 197 203 163 66 26 49 20 32.5% 28.0% 35.2% 35.5% 34.4% 30.5% 25.0% 43.1% 47.9% 41.1% 31.9% 34.8% F J
A little 226 71 71 84 91 135 152 57 17 11 23 7 17.0% 14.1% 16.6% 21.3% 13.4% 20.9% 18.7% 15.1% 12.3% 16.8% 14.9% 12.0% D
None 512 257 122 133 247 264 401 103 8 14 59 20 38.5% 50.6% 28.5% 33.6% 36.2% 41.0% 49.4% 27.2% 5.5% 22.1% 38.6% 34.8% BC G I I
Summary
Top2Box (Extensively/ Some) 591 179 234 178 345 246 259 218 114 38 71 30 44.5% 35.3% 54.9% 45.0% 50.5% 38.1% 31.9% 57.8% 82.2% 61.1% 46.5% 53.2% A E F JK
Low2Box (A little/ None) 738 328 192 217 339 399 554 160 25 24 82 26 55.5% 64.7% 45.1% 55.0% 49.5% 61.9% 68.1% 42.2% 17.8% 38.9% 53.5% 46.8% B D G I I

123
Q34_4. [Other benefit consultants] From what external parties have you sought and/or received advice about preparing for healthcare reform? ______________________________________________________________________________ Proportions/Means: Columns Tested (10% risk level) - A/B/C - D/E - F/G/H - I/J/K * small base; ** very small base (under 30) ineligible for sig testing
Company Size Decision Maker Awareness Occupation
Total 2 to 49 50 to 499 500 + Primary Decision Maker
Influencer Low Medium High Manufacturing
Retail trade Finance/Insurance
A B C D E F G H I J K
Base: All respondents 1329 336 458 535 672 657 758 384 187 321 329 250
Weighted 1329 508 426 395* 683 646 813 378* 138** 62 154 56
Other benefit consultants
Extensively 85 13 47 24 68 17 12 37 36 6 11 5 6.4% 2.7% 11.0% 6.2% 9.9% 2.7% 1.4% 9.7% 26.3% 10.0% 7.3% 8.4% A E F
Some 354 102 139 113 203 151 178 116 60 21 42 18 26.6% 20.2% 32.6% 28.5% 29.7% 23.4% 21.9% 30.7% 43.3% 33.6% 27.7% 32.8% A J
A little 260 95 68 97 115 145 142 104 13 13 28 9 19.6% 18.7% 16.0% 24.5% 16.8% 22.5% 17.5% 27.6% 9.6% 21.2% 17.9% 15.2% F K
None 630 297 172 162 298 332 481 121 29 22 72 25 47.4% 58.5% 40.3% 40.9% 43.6% 51.5% 59.2% 31.9% 20.8% 35.2% 47.1% 43.6% BC G I I
Summary
Top2Box (Extensively/ Some) 439 116 186 137 271 168 190 153 96 27 54 23 33.0% 22.8% 43.7% 34.6% 39.6% 26.0% 23.3% 40.4% 69.6% 43.6% 35.0% 41.2% A A E F J
Low2Box (A little/ None) 890 392 240 258 413 478 623 225 42 35 100 33 67.0% 77.2% 56.3% 65.4% 60.4% 74.0% 76.7% 59.6% 30.4% 56.4% 65.0% 58.8% BC D G I

124
Q34_5. [My current Insurers/Carriers] From what external parties have you sought and/or received advice about preparing for healthcare reform? ______________________________________________________________________________ Proportions/Means: Columns Tested (10% risk level) - A/B/C - D/E - F/G/H - I/J/K * small base; ** very small base (under 30) ineligible for sig testing
Company Size Decision Maker Awareness Occupation
Total 2 to 49 50 to 499 500 + Primary Decision Maker
Influencer Low Medium High Manufacturing
Retail trade Finance/Insurance
A B C D E F G H I J K
Base: All respondents 1329 336 458 535 672 657 758 384 187 321 329 250
Weighted 1329 508 426 395* 683 646 813 378* 138** 62 154 56
My current Insurers/Carriers
Extensively 205 59 93 53 153 52 86 57 62 14 24 14 15.4% 11.6% 21.9% 13.5% 22.4% 8.1% 10.6% 15.0% 45.0% 21.8% 15.5% 24.4% A E J J
Some 442 123 180 140 213 229 223 165 54 27 49 18 33.3% 24.2% 42.2% 35.4% 31.2% 35.5% 27.4% 43.7% 39.2% 43.9% 31.9% 32.4% A A F JK
A little 211 77 54 80 104 107 119 79 13 11 26 9 15.9% 15.1% 12.7% 20.3% 15.2% 16.6% 14.6% 20.9% 9.3% 17.1% 17.0% 16.8%
None 470 249 99 122 214 257 384 77 9 11 55 15 35.4% 49.1% 23.3% 30.9% 31.3% 39.7% 47.3% 20.4% 6.5% 17.1% 35.6% 26.4% BC G IK I
Summary
Top2Box (Extensively/ Some) 648 182 273 193 366 282 309 222 116 41 73 32 48.7% 35.8% 64.0% 48.8% 53.6% 43.6% 38.1% 58.7% 84.2% 65.7% 47.4% 56.8% AC A E F JK J
Low2Box (A little/ None) 681 326 153 202 317 364 503 156 22 21 81 24 51.3% 64.2% 36.0% 51.2% 46.4% 56.4% 61.9% 41.3% 15.8% 34.3% 52.6% 43.2% BC B D G IK I

125
Q34_6. [Other insurers/carriers] From what external parties have you sought and/or received advice about preparing for healthcare reform? ______________________________________________________________________________ Proportions/Means: Columns Tested (10% risk level) - A/B/C - D/E - F/G/H - I/J/K * small base; ** very small base (under 30) ineligible for sig testing
Company Size Decision Maker Awareness Occupation
Total 2 to 49 50 to 499 500 + Primary Decision Maker
Influencer Low Medium High Manufacturing
Retail trade Finance/Insurance
A B C D E F G H I J K
Base: All respondents 1329 336 458 535 672 657 758 384 187 321 329 250
Weighted 1329 508 426 395* 683 646 813 378* 138** 62 154 56
Other insurers/carriers
Extensively 105 22 59 24 80 25 26 39 40 9 13 6 7.9% 4.4% 13.8% 6.1% 11.7% 3.9% 3.2% 10.2% 29.1% 14.6% 8.5% 10.4% AC E F J
Some 334 99 120 115 193 141 171 111 52 20 35 14 25.1% 19.5% 28.1% 29.0% 28.2% 21.8% 21.0% 29.3% 37.8% 32.1% 23.1% 24.8% JK
A little 221 73 65 83 101 120 111 95 14 11 34 12 16.6% 14.4% 15.2% 20.9% 14.8% 18.6% 13.7% 25.2% 10.4% 17.8% 22.2% 21.6% F
None 669 313 183 174 310 360 504 134 31 22 71 24 50.4% 61.7% 42.9% 43.9% 45.3% 55.7% 62.1% 35.3% 22.7% 35.5% 46.2% 43.2% BC D G I I
Summary
Top2Box (Extensively/ Some) 439 121 179 139 273 166 197 149 92 29 49 20 33.0% 23.9% 41.9% 35.1% 39.9% 25.7% 24.2% 39.5% 66.9% 46.7% 31.6% 35.2% A A E F JK
Low2Box (A little/ None) 890 386 247 256 411 479 616 229 46 33 105 36 67.0% 76.1% 58.1% 64.9% 60.1% 74.3% 75.8% 60.5% 33.1% 53.3% 68.4% 64.8% BC D G I I

126
Q34_7. [Industry association or other business group] From what external parties have you sought and/or received advice about preparing for healthcare reform? ______________________________________________________________________________ Proportions/Means: Columns Tested (10% risk level) - A/B/C - D/E - F/G/H - I/J/K * small base; ** very small base (under 30) ineligible for sig testing
Company Size Decision Maker Awareness Occupation
Total 2 to 49 50 to 499 500 + Primary Decision Maker
Influencer Low Medium High Manufacturing
Retail trade Finance/Insurance
A B C D E F G H I J K
Base: All respondents 1329 336 458 535 672 657 758 384 187 321 329 250
Weighted 1329 508 426 395* 683 646 813 378* 138** 62 154 56
Industry association or other business group
Extensively 157 51 82 24 115 42 56 53 48 9 15 7 11.8% 10.0% 19.3% 6.2% 16.8% 6.5% 6.9% 14.1% 34.6% 14.0% 10.0% 12.8% AC E F
Some 304 86 95 124 160 144 129 116 59 24 42 20 22.9% 16.9% 22.3% 31.2% 23.5% 22.3% 15.9% 30.6% 42.9% 38.0% 27.1% 35.6% A F J J
A little 289 106 101 82 146 143 162 110 17 14 34 10 21.7% 20.9% 23.7% 20.6% 21.4% 22.1% 19.9% 29.0% 12.5% 21.8% 21.9% 17.6% F
None 579 265 148 166 262 317 465 100 14 16 63 19 43.6% 52.2% 34.8% 42.0% 38.4% 49.1% 57.3% 26.4% 10.0% 26.2% 41.0% 34.0% B D G IK I
Summary
Top2Box (Extensively/ Some) 461 136 177 148 275 186 185 169 107 32 57 27 34.7% 26.9% 41.5% 37.4% 40.3% 28.8% 22.8% 44.7% 77.5% 52.0% 37.1% 48.4% A A E F J J
Low2Box (A little/ None) 868 371 249 247 408 460 627 209 31 30 97 29 65.3% 73.1% 58.5% 62.6% 59.7% 71.2% 77.2% 55.3% 22.5% 48.0% 62.9% 51.6% BC D G IK

127
Q34_8. [Independent websites/publications] From what external parties have you sought and/or received advice about preparing for healthcare reform? ______________________________________________________________________________ Proportions/Means: Columns Tested (10% risk level) - A/B/C - D/E - F/G/H - I/J/K * small base; ** very small base (under 30) ineligible for sig testing
Company Size Decision Maker Awareness Occupation
Total 2 to 49 50 to 499 500 + Primary Decision Maker
Influencer Low Medium High Manufacturing
Retail trade Finance/Insurance
A B C D E F G H I J K
Base: All respondents 1329 336 458 535 672 657 758 384 187 321 329 250
Weighted 1329 508 426 395* 683 646 813 378* 138** 62 154 56
Independent websites/publications
Extensively 125 31 67 27 82 43 33 43 49 10 11 7 9.4% 6.2% 15.7% 6.9% 12.0% 6.7% 4.0% 11.4% 35.7% 15.6% 7.0% 12.0% AC E F J J
Some 361 115 134 112 211 150 166 145 51 22 46 16 27.2% 22.6% 31.5% 28.3% 30.9% 23.3% 20.4% 38.3% 36.6% 34.6% 29.8% 27.6% F K
A little 293 97 103 94 150 143 160 106 27 14 36 12 22.1% 19.1% 24.1% 23.7% 22.0% 22.2% 19.7% 27.9% 19.8% 22.4% 23.7% 21.6%
None 550 265 122 163 240 309 454 85 11 17 61 22 41.4% 52.1% 28.7% 41.2% 35.2% 47.9% 55.8% 22.5% 7.8% 27.4% 39.5% 38.8% B B D G I I
Summary
Top2Box (Extensively/ Some) 486 146 201 139 293 193 199 188 100 31 57 22 36.6% 28.8% 47.2% 35.1% 42.9% 29.9% 24.4% 49.6% 72.3% 50.2% 36.8% 39.6% AC E F JK
Low2Box (A little/ None) 843 361 225 256 390 452 614 191 38 31 97 34 63.4% 71.2% 52.8% 64.9% 57.1% 70.1% 75.6% 50.4% 27.7% 49.8% 63.2% 60.4% B B D G I I

128
Q34_9. [Government websites and press releases] From what external parties have you sought and/or received advice about preparing for healthcare reform? ______________________________________________________________________________ Proportions/Means: Columns Tested (10% risk level) - A/B/C - D/E - F/G/H - I/J/K * small base; ** very small base (under 30) ineligible for sig testing
Company Size Decision Maker Awareness Occupation
Total 2 to 49 50 to 499 500 + Primary Decision Maker
Influencer Low Medium High Manufacturing
Retail trade Finance/Insurance
A B C D E F G H I J K
Base: All respondents 1329 336 458 535 672 657 758 384 187 321 329 250
Weighted 1329 508 426 395* 683 646 813 378* 138** 62 154 56
Government websites and press releases
Extensively 126 24 68 34 89 37 29 48 49 11 15 7 9.5% 4.7% 16.1% 8.5% 13.1% 5.7% 3.6% 12.7% 35.2% 16.8% 9.7% 12.8% AC E F J
Some 380 122 134 125 207 173 157 168 56 22 44 19 28.6% 24.0% 31.4% 31.6% 30.4% 26.8% 19.3% 44.4% 40.2% 35.5% 28.9% 34.0% F J
A little 277 94 96 87 121 157 180 86 11 14 33 11 20.9% 18.5% 22.6% 22.1% 17.7% 24.3% 22.2% 22.7% 8.0% 22.7% 21.6% 20.4%
None 545 268 127 149 266 280 446 76 23 16 61 18 41.0% 52.9% 29.9% 37.8% 38.9% 43.3% 54.9% 20.2% 16.5% 24.9% 39.8% 32.8% BC G IK I
Summary
Top2Box (Extensively/ Some) 506 145 202 159 297 209 186 216 104 33 59 26 38.1% 28.6% 47.5% 40.1% 43.4% 32.4% 22.9% 57.1% 75.5% 52.3% 38.6% 46.8% A A E F J J
Low2Box (A little/ None) 823 362 224 237 387 436 627 162 34 30 94 30 61.9% 71.4% 52.5% 59.9% 56.6% 67.6% 77.1% 42.9% 24.5% 47.7% 61.4% 53.2% BC D G IK

129
Q34_10. [Google' or general search engines] From what external parties have you sought and/or received advice about preparing for healthcare reform? ______________________________________________________________________________ Proportions/Means: Columns Tested (10% risk level) - A/B/C - D/E - F/G/H - I/J/K * small base; ** very small base (under 30) ineligible for sig testing
Company Size Decision Maker Awareness Occupation
Total 2 to 49 50 to 499 500 + Primary Decision Maker
Influencer Low Medium High Manufacturing
Retail trade Finance/Insurance
A B C D E F G H I J K
Base: All respondents 1329 336 458 535 672 657 758 384 187 321 329 250
Weighted 1329 508 426 395* 683 646 813 378* 138** 62 154 56
Google' or general search engines
Extensively 126 28 77 21 89 37 31 50 44 7 16 4 9.5% 5.5% 18.2% 5.2% 13.0% 5.8% 3.9% 13.3% 31.9% 11.5% 10.3% 7.6% AC E F
Some 302 118 97 87 168 134 133 123 46 22 35 15 22.7% 23.2% 22.8% 22.0% 24.6% 20.7% 16.4% 32.4% 33.2% 35.2% 22.5% 26.4% F JK
A little 315 95 103 118 140 175 195 95 25 11 34 13 23.7% 18.7% 24.1% 29.8% 20.5% 27.1% 24.0% 25.1% 18.1% 17.4% 22.2% 23.6% A I
None 586 267 149 170 287 299 452 110 23 22 69 24 44.1% 52.6% 34.9% 43.1% 41.9% 46.4% 55.7% 29.2% 16.8% 35.8% 45.0% 42.4% B G I
Summary
Top2Box (Extensively/ Some) 428 146 175 107 257 171 165 173 90 29 50 19 32.2% 28.7% 41.0% 27.2% 37.6% 26.5% 20.3% 45.8% 65.1% 46.7% 32.8% 34.0% AC E F JK
Low2Box (A little/ None) 901 362 251 288 427 474 648 205 48 33 103 37 67.8% 71.3% 59.0% 72.8% 62.4% 73.5% 79.7% 54.2% 34.9% 53.3% 67.2% 66.0% B B D G I I

130
Q35_1. [Supply levers] As you think about ways to control your company's medical benefit costs both today and in the first few years post-healthcare reform, how important do you think 'supply' levers will be... versus 'demand' levers ...? ______________________________________________________________________________ Proportions/Means: Columns Tested (10% risk level) - A/B/C - D/E - F/G/H - I/J/K * small base; ** very small base (under 30) ineligible for sig testing
Company Size Decision Maker Awareness Occupation
Total 2 to 49 50 to 499 500 + Primary Decision Maker
Influencer Low Medium High Manufacturing
Retail trade Finance/Insurance
A B C D E F G H I J K
Base: Respondents With Medical Plan(s) 1137 249 416 472 575 562 607 351 179 296 252 223
Weighted 1105 370* 381 354* 577 528 630 339* 136** 58 118 50
0 13 8 1 4 4 9 12 1 0 0 1 1 1.1% 2.2% 0.2% 1.1% 0.7% 1.7% 1.9% 0.3% - 0.7% 0.8% 1.3%
1 to 25 52 24 9 19 16 36 35 11 6 1 3 2 4.7% 6.6% 2.3% 5.3% 2.7% 6.9% 5.5% 3.3% 4.3% 2.0% 2.4% 3.6% D
26 to 50 697 192 252 252 391 306 396 216 84 34 78 31 63.1% 52.0% 66.2% 71.4% 67.8% 57.9% 62.9% 63.7% 62.2% 59.1% 66.7% 61.9% A A E I
51 to 75 212 84 79 50 90 123 115 73 25 16 28 13 19.2% 22.6% 20.6% 14.2% 15.5% 23.2% 18.2% 21.5% 18.2% 27.0% 23.4% 25.1%
76 to 99 99 53 30 15 59 40 48 30 21 5 5 3 8.9% 14.4% 7.9% 4.3% 10.2% 7.5% 7.6% 8.9% 15.3% 8.8% 4.4% 5.8% C J
100 32 8 11 13 18 14 25 8 0 1 3 1 2.9% 2.3% 2.8% 3.8% 3.1% 2.7% 3.9% 2.3% - 2.4% 2.4% 2.2%
Summary
Mean (Incl. 0) 54.3 54.8 55.4 52.5 55.0 53.4 53.6 54.6 56.5 54.7 53.8 53.8
Std. Dev. 17.5 20.1 15.4 16.7 16.3 18.8 18.8 15.8 15.7 16.7 15.3 16.1
Std. Err. 0.5 1.3 0.8 0.8 0.7 0.8 0.8 0.8 1.2 1.0 1.0 1.1
Mean (Excl. 0) 54.9 56.0 55.5 53.1 55.4 54.4 54.6 54.8 56.5 55.1 54.3 54.5
Std. Dev. 16.6 18.6 15.2 15.8 15.7 17.6 17.4 15.5 15.7 16.1 14.6 14.9
Std. Err. 0.5 1.2 0.7 0.7 0.7 0.7 0.7 0.8 1.2 0.9 0.9 1.0
Median 49.3 48.7 48.7 49.1 48.5 49.3 48.1 48.3 49.4 49.4 48.2 48.7

131
Q35_2. [Demand levers] As you think about ways to control your company's medical benefit costs both today and in the first few years post-healthcare reform, how important do you think 'supply' levers will be... versus 'demand' levers ...? ______________________________________________________________________________ Proportions/Means: Columns Tested (10% risk level) - A/B/C - D/E - F/G/H - I/J/K * small base; ** very small base (under 30) ineligible for sig testing
Company Size Decision Maker Awareness Occupation
Total 2 to 49 50 to 499 500 + Primary Decision Maker
Influencer Low Medium High Manufacturing
Retail trade Finance/Insurance
A B C D E F G H I J K
Base: Respondents With Medical Plan(s) 1137 249 416 472 575 562 607 351 179 296 252 223
Weighted 1105 370* 381 354* 577 528 630 339* 136** 58 118 50
0 32 8 11 13 18 14 25 8 0 1 3 1 2.9% 2.3% 2.8% 3.8% 3.1% 2.7% 3.9% 2.3% - 2.4% 2.4% 2.2%
1 to 25 152 71 58 24 72 81 81 46 25 7 14 4 13.8% 19.1% 15.3% 6.7% 12.4% 15.3% 12.9% 13.5% 18.6% 12.5% 11.5% 8.5% C C
26 to 50 749 222 267 260 413 336 421 230 98 38 83 36 67.8% 60.0% 70.0% 73.5% 71.5% 63.6% 66.8% 67.7% 72.5% 65.5% 70.2% 72.6% A I
51 to 75 118 44 37 37 62 56 63 46 9 10 16 7 10.7% 12.0% 9.6% 10.4% 10.7% 10.6% 10.0% 13.5% 6.8% 17.6% 13.9% 13.9%
76 to 99 41 17 8 16 9 32 29 9 3 1 1 1 3.7% 4.5% 2.1% 4.6% 1.6% 6.0% 4.6% 2.7% 2.2% 1.4% 1.2% 1.3% D
100 13 8 1 4 4 9 12 1 0 0 1 1 1.1% 2.2% 0.2% 1.1% 0.7% 1.7% 1.9% 0.3% - 0.7% 0.8% 1.3%
Summary
Mean (Incl. 0) 45.7 45.2 44.6 47.5 45.0 46.6 46.4 45.4 43.5 45.3 46.2 46.2
Std. Dev. 17.5 20.1 15.4 16.7 16.3 18.8 18.8 15.8 15.7 16.7 15.3 16.1
Std. Err. 0.5 1.3 0.8 0.8 0.7 0.8 0.8 0.8 1.2 1.0 1.0 1.1
Mean (Excl. 0) 47.1 46.3 45.9 49.3 46.4 47.9 48.3 46.5 43.5 46.4 47.3 47.3
Std. Dev. 15.9 19.1 13.6 14.1 14.4 17.3 16.6 14.3 15.7 15.3 13.6 14.6
Std. Err. 0.5 1.2 0.7 0.7 0.6 0.7 0.7 0.8 1.2 0.9 0.9 1.0
Median 49.4 49.3 47.3 47.2 49.4 49.3 49.4 49.3 46.4 49.3 46.8 46.7

132
Q36a_1. [Increasing the costs borne by employees overall...] Please describe your company's level of interest in implementing the following medical expense reduction strategies. ______________________________________________________________________________ Proportions/Means: Columns Tested (10% risk level) - A/B/C - D/E - F/G/H - I/J/K * small base; ** very small base (under 30) ineligible for sig testing
Company Size Decision Maker Awareness Occupation
Total 2 to 49 50 to 499 500 + Primary Decision Maker
Influencer Low Medium High Manufacturing
Retail trade Finance/Insurance
A B C D E F G H I J K
Base: Respondents With Medical Plan(s) 1137 249 416 472 575 562 607 351 179 296 252 223
Weighted 1105 370* 381 354* 577 528 630 339* 136** 58 118 50
Increasing the costs borne by employees overall...
Definitely would 178 49 91 38 118 60 75 49 54 11 14 7 16.1% 13.3% 23.9% 10.7% 20.5% 11.3% 11.9% 14.4% 39.7% 19.9% 11.9% 13.9% AC E JK
Probably would 279 92 101 86 127 152 138 108 32 22 40 16 25.2% 24.9% 26.5% 24.3% 22.0% 28.7% 21.9% 32.0% 23.8% 37.5% 33.7% 31.4% F
May or may not 421 124 127 170 242 179 272 120 29 19 46 21 38.1% 33.4% 33.5% 48.0% 41.9% 34.0% 43.2% 35.3% 21.5% 32.8% 39.3% 41.7% AB I
Probably would not 170 78 47 45 53 116 106 54 9 4 11 5 15.4% 21.0% 12.3% 12.7% 9.2% 22.0% 16.9% 16.0% 6.6% 7.1% 9.5% 9.9% D
Definitely would not 57 27 15 15 36 21 38 8 11 2 7 2 5.2% 7.3% 3.9% 4.3% 6.3% 4.0% 6.0% 2.3% 8.4% 2.7% 5.6% 3.1%
Summary
Top2Box (Definitely/ Probably Would) 457 142 192 124 246 211 213 157 86 33 54 23 41.4% 38.3% 50.3% 35.0% 42.6% 40.0% 33.9% 46.4% 63.5% 57.4% 45.6% 45.3% AC F JK
Low2Box (Definitely/ Probably Would Not) 227 105 62 60 90 137 144 62 20 6 18 7 20.5% 28.3% 16.2% 17.0% 15.5% 26.0% 22.9% 18.3% 15.0% 9.8% 15.1% 13.0% BC D I

133
Q36a_2. [Increasing the costs borne by employees for care related to controllable chronic conditions...] Please describe your company's level of interest in implementing the following medical expense reduction strategies. ______________________________________________________________________________ Proportions/Means: Columns Tested (10% risk level) - A/B/C - D/E - F/G/H - I/J/K * small base; ** very small base (under 30) ineligible for sig testing
Company Size Decision Maker Awareness Occupation
Total 2 to 49 50 to 499 500 + Primary Decision Maker
Influencer Low Medium High Manufacturing
Retail trade Finance/Insurance
A B C D E F G H I J K
Base: Respondents With Medical Plan(s) 1137 249 416 472 575 562 607 351 179 296 252 223
Weighted 1105 370* 381 354* 577 528 630 339* 136** 58 118 50
Increasing the costs borne by employees for care related to controllable chronic conditions...
Definitely would 143 51 65 27 101 42 47 54 41 10 13 8 12.9% 13.8% 17.0% 7.5% 17.5% 7.9% 7.4% 16.1% 30.4% 17.2% 11.1% 15.2% C E F J
Probably would 264 83 110 71 141 123 143 79 42 19 30 12 23.9% 22.4% 28.9% 20.1% 24.5% 23.2% 22.8% 23.3% 30.7% 33.4% 25.8% 24.7% JK
May or may not 424 96 141 187 224 200 255 134 35 19 52 20 38.4% 26.1% 37.0% 52.8% 38.8% 38.0% 40.5% 39.6% 25.6% 32.8% 44.4% 39.0% AB I
Probably would not 182 85 54 43 75 107 130 40 11 6 16 9 16.4% 23.0% 14.1% 12.1% 13.0% 20.2% 20.7% 11.9% 8.2% 11.1% 13.5% 17.0% C G I
Definitely would not 92 55 12 26 36 57 54 31 7 3 6 2 8.4% 14.8% 3.1% 7.4% 6.2% 10.7% 8.6% 9.2% 5.1% 5.4% 5.2% 4.0% B
Summary
Top2Box (Definitely/ Probably Would) 406 134 175 98 242 164 190 133 83 29 43 20 36.8% 36.2% 45.9% 27.6% 42.0% 31.1% 30.2% 39.4% 61.1% 50.7% 36.9% 39.9% C E JK
Low2Box (Definitely/ Probably Would Not) 274 140 65 69 111 163 185 71 18 10 22 11 24.8% 37.8% 17.1% 19.5% 19.2% 30.9% 29.3% 21.1% 13.3% 16.6% 18.7% 21.1%
BC D

134
Q36a_3. [Increasing the costs borne by employees for elective care] Please describe your company's level of interest in implementing the following medical expense reduction strategies. ______________________________________________________________________________ Proportions/Means: Columns Tested (10% risk level) - A/B/C - D/E - F/G/H - I/J/K * small base; ** very small base (under 30) ineligible for sig testing
Company Size Decision Maker Awareness Occupation
Total 2 to 49 50 to 499 500 + Primary Decision Maker
Influencer Low Medium High Manufacturing
Retail trade Finance/Insurance
A B C D E F G H I J K
Base: Respondents With Medical Plan(s) 1137 249 416 472 575 562 607 351 179 296 252 223
Weighted 1105 370* 381 354* 577 528 630 339* 136** 58 118 50
Increasing the costs borne by employees for elective care
Definitely would 177 57 89 31 99 79 80 61 36 11 16 9 16.1% 15.5% 23.3% 8.9% 17.1% 14.9% 12.7% 18.0% 26.7% 19.9% 13.9% 17.0% C J
Probably would 331 105 125 101 174 156 187 94 50 21 35 15 29.9% 28.3% 32.8% 28.6% 30.2% 29.6% 29.7% 27.6% 36.9% 36.8% 29.8% 30.5% J
May or may not 430 134 125 171 243 187 268 131 30 19 49 20 38.9% 36.2% 32.9% 48.2% 42.1% 35.4% 42.6% 38.7% 22.4% 33.8% 41.7% 40.8% B I
Probably would not 121 49 33 38 35 86 69 46 5 4 12 5 10.9% 13.3% 8.7% 10.8% 6.0% 16.2% 11.0% 13.7% 3.8% 7.8% 10.3% 9.4% D
Definitely would not 46 25 9 12 26 20 26 7 14 1 5 1 4.2% 6.8% 2.3% 3.5% 4.5% 3.8% 4.1% 2.0% 10.2% 1.7% 4.4% 2.2% I
Summary
Top2Box (Definitely/ Probably Would) 508 162 214 132 273 235 267 155 86 33 51 24 46.0% 43.8% 56.1% 37.4% 47.3% 44.6% 42.4% 45.6% 63.6% 56.8% 43.7% 47.5% AC JK
Low2Box (Definitely/ Probably Would Not) 167 74 42 51 61 106 95 53 19 5 17 6 15.1% 20.0% 11.0% 14.3% 10.6% 20.0% 15.0% 15.6% 14.0% 9.5% 14.7% 11.7% B D I

135
Q36a_4. [Increasing the costs for employees to insure spouses and/or dependents] Please describe your company's level of interest in implementing the following medical expense reduction strategies. ______________________________________________________________________________ Proportions/Means: Columns Tested (10% risk level) - A/B/C - D/E - F/G/H - I/J/K * small base; ** very small base (under 30) ineligible for sig testing
Company Size Decision Maker Awareness Occupation
Total 2 to 49 50 to 499 500 + Primary Decision Maker
Influencer Low Medium High Manufacturing
Retail trade Finance/Insurance
A B C D E F G H I J K
Base: Respondents With Medical Plan(s) 1137 249 416 472 575 562 607 351 179 296 252 223
Weighted 1105 370* 381 354* 577 528 630 339* 136** 58 118 50
Increasing the costs for employees to insure spouses and/or dependents
Definitely would 183 63 87 34 111 72 84 54 44 11 16 7 16.5% 16.9% 22.7% 9.5% 19.3% 13.6% 13.4% 15.9% 32.6% 18.6% 13.5% 13.9% C J
Probably would 278 77 113 89 149 129 160 86 32 20 34 18 25.2% 20.7% 29.7% 25.1% 25.9% 24.4% 25.5% 25.3% 23.6% 34.8% 29.0% 35.0%
May or may not 448 130 129 189 233 215 262 145 41 21 49 19 40.5% 35.2% 33.8% 53.4% 40.3% 40.8% 41.5% 42.8% 30.4% 35.8% 41.3% 38.1% AB
Probably would not 136 67 45 24 51 84 82 42 12 5 13 4 12.3% 18.0% 11.9% 6.7% 8.9% 16.0% 12.9% 12.4% 8.9% 8.1% 11.1% 9.0% C D
Definitely would not 60 34 8 19 33 28 42 12 6 2 6 2 5.5% 9.2% 2.0% 5.3% 5.7% 5.3% 6.7% 3.7% 4.5% 2.7% 5.2% 4.0% B
Summary
Top2Box (Definitely/ Probably Would) 461 139 199 122 260 200 245 140 76 31 50 25 41.7% 37.6% 52.4% 34.6% 45.1% 38.0% 38.9% 41.2% 56.2% 53.4% 42.5% 48.9% AC J
Low2Box (Definitely/ Probably Would Not) 196 101 53 42 84 112 123 54 18 6 19 7 17.7% 27.2% 13.8% 12.0% 14.5% 21.3% 19.6% 16.0% 13.4% 10.8% 16.3% 13.0% BC I

136
Q36a_5. [Eliminating or discouraging coverage for spouses who have the option of enrolling in a plan provided by their employer] Please describe your company's level of interest in implementing the following medical expense reduction strategies. ______________________________________________________________________________ Proportions/Means: Columns Tested (10% risk level) - A/B/C - D/E - F/G/H - I/J/K * small base; ** very small base (under 30) ineligible for sig testing
Company Size Decision Maker Awareness Occupation
Total 2 to 49 50 to 499 500 + Primary Decision Maker
Influencer Low Medium High Manufacturing
Retail trade Finance/Insurance
A B C D E F G H I J K
Base: Respondents With Medical Plan(s) 1137 249 416 472 575 562 607 351 179 296 252 223
Weighted 1105 370* 381 354* 577 528 630 339* 136** 58 118 50
Eliminating or discouraging coverage for spouses who have the option of enrolling in a plan provided by their employer
Definitely would 160 49 77 34 95 65 75 45 39 12 16 8 14.5% 13.1% 20.1% 9.7% 16.4% 12.3% 11.9% 13.3% 29.1% 21.3% 13.9% 16.1% C J
Probably would 243 108 81 55 126 117 130 81 33 18 30 12 22.0% 29.1% 21.3% 15.5% 21.9% 22.2% 20.6% 23.9% 24.1% 30.7% 25.8% 24.2% C
May or may not 454 123 160 172 246 208 270 142 42 19 48 19 41.1% 33.1% 41.9% 48.6% 42.7% 39.3% 42.8% 42.0% 30.9% 33.4% 40.9% 38.1% A I
Probably would not 169 48 52 69 69 100 101 55 12 6 17 8 15.3% 13.0% 13.6% 19.5% 12.0% 18.9% 16.1% 16.4% 8.9% 9.8% 14.7% 16.1% I I
Definitely would not 79 43 12 23 40 38 54 15 9 3 6 3 7.1% 11.7% 3.1% 6.6% 7.0% 7.3% 8.6% 4.4% 7.0% 4.7% 4.8% 5.4% B
Summary
Top2Box (Definitely/ Probably Would) 403 156 158 89 221 182 205 126 72 30 47 20 36.5% 42.2% 41.4% 25.3% 38.4% 34.5% 32.5% 37.2% 53.2% 52.0% 39.7% 40.4% C C JK
Low2Box (Definitely/ Probably Would Not) 248 91 64 92 109 138 156 70 22 8 23 11 22.4% 24.7% 16.7% 26.2% 18.9% 26.2% 24.7% 20.8% 15.9% 14.5% 19.4% 21.5%
I

137
Q36a_6. [Introducing or growing enrollment in 'high-deductible health plans'...] Please describe your company's level of interest in implementing the following medical expense reduction strategies. ______________________________________________________________________________ Proportions/Means: Columns Tested (10% risk level) - A/B/C - D/E - F/G/H - I/J/K * small base; ** very small base (under 30) ineligible for sig testing
Company Size Decision Maker Awareness Occupation
Total 2 to 49 50 to 499 500 + Primary Decision Maker
Influencer Low Medium High Manufacturing
Retail trade Finance/Insurance
A B C D E F G H I J K
Base: Respondents With Medical Plan(s) 1137 249 416 472 575 562 607 351 179 296 252 223
Weighted 1105 370* 381 354* 577 528 630 339* 136** 58 118 50
Introducing or growing enrollment in 'high-deductible health plans'...
Definitely would 164 54 72 38 103 61 78 40 46 10 16 7 14.9% 14.7% 18.9% 10.7% 17.9% 11.5% 12.4% 11.8% 34.1% 17.6% 13.9% 14.3%
Probably would 298 110 116 72 140 158 148 120 31 20 30 16 27.0% 29.7% 30.4% 20.4% 24.4% 29.9% 23.4% 35.3% 22.9% 34.8% 25.8% 31.8% F J
May or may not 434 118 136 180 246 188 260 140 35 21 53 20 39.3% 31.9% 35.7% 50.9% 42.7% 35.6% 41.3% 41.2% 25.5% 36.1% 44.8% 39.9% AB I
Probably would not 153 62 42 49 52 101 111 33 9 5 13 5 13.8% 16.6% 11.2% 13.8% 9.0% 19.1% 17.6% 9.6% 6.7% 9.5% 10.7% 10.8% D G
Definitely would not 55 26 15 15 35 20 33 7 15 1 6 2 5.0% 7.0% 3.8% 4.2% 6.0% 3.9% 5.3% 2.1% 10.8% 2.0% 4.8% 3.1% I
Summary
Top2Box (Definitely/ Probably Would) 462 165 188 110 244 219 226 160 77 30 47 23 41.9% 44.5% 49.3% 31.1% 42.3% 41.4% 35.8% 47.1% 57.0% 52.4% 39.7% 46.2% C C F J
Low2Box (Definitely/ Probably Would Not) 208 87 57 64 86 122 145 40 24 7 18 7 18.8% 23.6% 15.0% 18.0% 15.0% 23.0% 22.9% 11.7% 17.5% 11.5% 15.5% 13.9% D G

138
Q36a_7. [Discontinuing some or all benefits for retirees] Please describe your company's level of interest in implementing the following medical expense reduction strategies. ______________________________________________________________________________ Proportions/Means: Columns Tested (10% risk level) - A/B/C - D/E - F/G/H - I/J/K * small base; ** very small base (under 30) ineligible for sig testing
Company Size Decision Maker Awareness Occupation
Total 2 to 49 50 to 499 500 + Primary Decision Maker
Influencer Low Medium High Manufacturing
Retail trade Finance/Insurance
A B C D E F G H I J K
Base: Respondents With Medical Plan(s) And Benefits For Retirees
378 55 107 216 230 148 165 121 92 109 61 69
Weighted 379* 92** 120** 168* 263* 116* 186* 118** 74** 21 28* 16*
Discontinuing some or all benefits for retirees
Definitely would 71 13 34 24 62 10 17 26 28 5 7 3 18.8% 14.3% 28.1% 14.6% 23.5% 8.2% 8.9% 22.1% 38.3% 22.0% 26.2% 20.3% E
Probably would 68 26 23 18 42 26 26 22 20 7 5 2 17.9% 28.9% 19.6% 10.6% 16.0% 22.1% 14.0% 18.6% 26.3% 33.9% 18.0% 13.0% JK
May or may not 137 28 37 73 83 54 88 46 3 5 9 5 36.2% 30.2% 30.8% 43.4% 31.7% 46.5% 47.5% 38.8% 4.0% 25.7% 32.8% 34.8%
Probably would not 56 14 10 33 46 11 34 16 6 2 4 4 14.9% 15.0% 8.0% 19.7% 17.4% 9.2% 18.2% 13.8% 8.2% 11.0% 13.1% 26.1% IJ
Definitely would not 46 11 16 20 30 16 21 8 17 2 3 1 12.2% 11.6% 13.5% 11.7% 11.5% 14.0% 11.5% 6.6% 23.1% 7.3% 9.8% 5.8%
Summary
Top2Box (Definitely/ Probably Would) 139 40 57 42 104 35 43 48 48 12 13 5 36.6% 43.2% 47.7% 25.1% 39.5% 30.2% 22.9% 40.7% 64.6% 56.0% 44.3% 33.3% K
Low2Box (Definitely/ Probably Would Not) 103 24 26 53 76 27 55 24 23 4 7 5 27.1% 26.6% 21.5% 31.4% 28.9% 23.2% 29.6% 20.5% 31.4% 18.3% 23.0% 31.9%
I

139
Q36a_8. [Changing eligibility thresholds...] Please describe your company's level of interest in implementing the following medical expense reduction strategies. ______________________________________________________________________________ Proportions/Means: Columns Tested (10% risk level) - A/B/C - D/E - F/G/H - I/J/K * small base; ** very small base (under 30) ineligible for sig testing
Company Size Decision Maker Awareness Occupation
Total 2 to 49 50 to 499 500 + Primary Decision Maker
Influencer Low Medium High Manufacturing
Retail trade Finance/Insurance
A B C D E F G H I J K
Base: Respondents With Medical Plan(s) 1137 249 416 472 575 562 607 351 179 296 252 223
Weighted 1105 370* 381 354* 577 528 630 339* 136** 58 118 50
Changing eligibility thresholds...
Definitely would 126 44 55 26 77 48 37 54 35 9 16 6 11.4% 11.8% 14.5% 7.5% 13.4% 9.2% 5.8% 16.0% 25.4% 14.9% 13.9% 12.1% F
Probably would 215 79 89 47 123 92 124 63 28 16 24 12 19.5% 21.4% 23.3% 13.3% 21.3% 17.4% 19.8% 18.5% 20.5% 27.7% 20.6% 23.3% C J
May or may not 416 106 112 198 212 204 274 107 34 19 51 17 37.6% 28.5% 29.4% 56.0% 36.8% 38.6% 43.5% 31.6% 25.3% 33.4% 43.3% 33.6% AB G IK
Probably would not 231 88 92 52 104 127 122 95 14 9 16 10 21.0% 23.7% 24.2% 14.6% 18.0% 24.1% 19.4% 28.1% 10.0% 15.5% 13.9% 20.6% J
Definitely would not 117 54 33 30 60 57 72 20 25 5 10 5 10.6% 14.6% 8.6% 8.6% 10.5% 10.7% 11.4% 5.8% 18.7% 8.4% 8.3% 10.3%
Summary
Top2Box (Definitely/ Probably Would) 340 123 144 73 200 140 161 117 62 25 41 18 30.8% 33.3% 37.8% 20.7% 34.7% 26.6% 25.6% 34.5% 45.9% 42.6% 34.5% 35.4% C C JK
Low2Box (Definitely/ Probably Would Not) 349 141 125 82 165 184 195 115 39 14 26 16 31.6% 38.2% 32.8% 23.2% 28.5% 34.9% 30.9% 33.9% 28.7% 24.0% 22.2% 30.9% C IJ
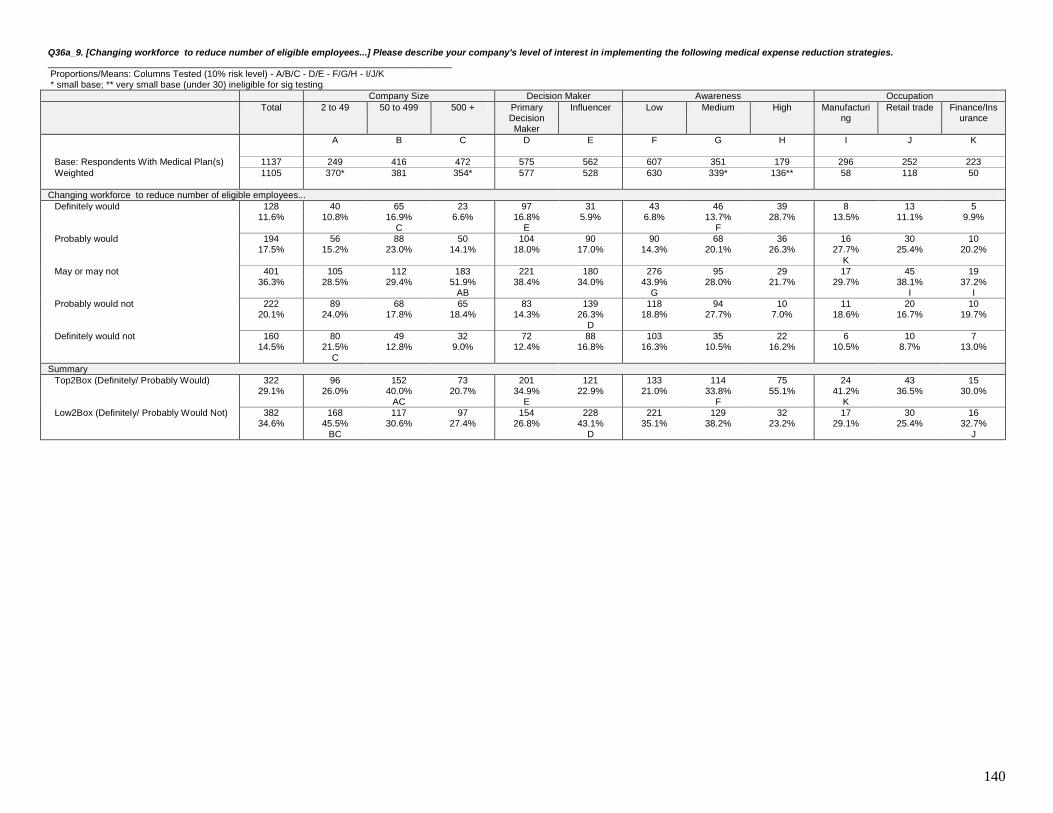
140
Q36a_9. [Changing workforce to reduce number of eligible employees...] Please describe your company's level of interest in implementing the following medical expense reduction strategies. ______________________________________________________________________________ Proportions/Means: Columns Tested (10% risk level) - A/B/C - D/E - F/G/H - I/J/K * small base; ** very small base (under 30) ineligible for sig testing
Company Size Decision Maker Awareness Occupation
Total 2 to 49 50 to 499 500 + Primary Decision Maker
Influencer Low Medium High Manufacturing
Retail trade Finance/Insurance
A B C D E F G H I J K
Base: Respondents With Medical Plan(s) 1137 249 416 472 575 562 607 351 179 296 252 223
Weighted 1105 370* 381 354* 577 528 630 339* 136** 58 118 50
Changing workforce to reduce number of eligible employees...
Definitely would 128 40 65 23 97 31 43 46 39 8 13 5 11.6% 10.8% 16.9% 6.6% 16.8% 5.9% 6.8% 13.7% 28.7% 13.5% 11.1% 9.9% C E F
Probably would 194 56 88 50 104 90 90 68 36 16 30 10 17.5% 15.2% 23.0% 14.1% 18.0% 17.0% 14.3% 20.1% 26.3% 27.7% 25.4% 20.2% K
May or may not 401 105 112 183 221 180 276 95 29 17 45 19 36.3% 28.5% 29.4% 51.9% 38.4% 34.0% 43.9% 28.0% 21.7% 29.7% 38.1% 37.2% AB G I I
Probably would not 222 89 68 65 83 139 118 94 10 11 20 10 20.1% 24.0% 17.8% 18.4% 14.3% 26.3% 18.8% 27.7% 7.0% 18.6% 16.7% 19.7% D
Definitely would not 160 80 49 32 72 88 103 35 22 6 10 7 14.5% 21.5% 12.8% 9.0% 12.4% 16.8% 16.3% 10.5% 16.2% 10.5% 8.7% 13.0% C
Summary
Top2Box (Definitely/ Probably Would) 322 96 152 73 201 121 133 114 75 24 43 15 29.1% 26.0% 40.0% 20.7% 34.9% 22.9% 21.0% 33.8% 55.1% 41.2% 36.5% 30.0% AC E F K
Low2Box (Definitely/ Probably Would Not) 382 168 117 97 154 228 221 129 32 17 30 16 34.6% 45.5% 30.6% 27.4% 26.8% 43.1% 35.1% 38.2% 23.2% 29.1% 25.4% 32.7% BC D J

141
Q36b. Please indicate any of these strategies that you have implemented within the past 3 years. ______________________________________________________________________________ Proportions/Means: Columns Tested (10% risk level) - A/B/C - D/E - F/G/H - I/J/K * small base; ** very small base (under 30) ineligible for sig testing
Company Size Decision Maker Awareness Occupation
Total 2 to 49 50 to 499 500 + Primary Decision Maker
Influencer Low Medium High Manufacturing
Retail trade Finance/Insurance
A B C D E F G H I J K
Base: Respondents With Medical Plan(s) 1137 249 416 472 575 562 607 351 179 296 252 223
Weighted 1105 370* 381 354* 577 528 630 339* 136** 58 118 50
Increasing the costs borne by employees overall...
432 147 175 110 199 233 225 147 59 26 42 21
39.1% 39.6% 46.0% 31.0% 34.5% 44.1% 35.7% 43.5% 43.5% 45.9% 35.7% 42.2% C J
Increasing the costs for employees to insure spouses and/or dependents
366 111 151 104 176 190 174 135 57 20 33 16
33.1% 30.0% 39.6% 29.4% 30.5% 36.0% 27.7% 39.8% 41.7% 35.5% 27.8% 31.8% F J
Increasing the costs borne by employees for elective care
202 65 61 76 96 106 74 73 55 18 21 13
18.3% 17.6% 16.0% 21.6% 16.7% 20.1% 11.7% 21.5% 40.8% 31.4% 18.3% 26.9% F J J
Eliminating or discouraging coverage for spouses who have the option of enrolling in a plan provided by their employer
199 57 61 81 99 99 93 64 41 14 17 7
18.0% 15.4% 16.1% 22.8% 17.2% 18.8% 14.8% 19.0% 30.4% 24.0% 14.7% 14.8% JK
Increasing the costs borne by employees for care related to chronic conditions
173 52 70 51 103 70 62 87 23 15 20 8
15.6% 14.1% 18.5% 14.3% 17.8% 13.3% 9.9% 25.8% 17.2% 26.4% 17.1% 16.1% F JK
Introducing or growing enrollment in 'high-deductible health plans'...
166 58 58 49 84 82 104 47 14 14 21 11
15.0% 15.8% 15.2% 13.9% 14.5% 15.5% 16.5% 14.0% 10.5% 23.6% 17.9% 22.9% J
Discontinuing some or all benefits for retirees
126 46 53 27 67 59 68 47 11 8 14 6
11.4% 12.4% 14.0% 7.7% 11.7% 11.2% 10.8% 13.9% 8.3% 13.5% 11.9% 11.2%
Changing workforce to reduce number of eligible employees...
125 32 52 41 60 65 81 31 12 7 20 4
11.3% 8.5% 13.8% 11.6% 10.4% 12.4% 12.9% 9.3% 9.0% 12.5% 17.1% 8.5% K
Changing eligibility thresholds... 110 39 41 30 64 46 54 41 15 7 14 5 10.0% 10.5% 10.8% 8.5% 11.2% 8.7% 8.6% 12.1% 11.1% 12.5% 11.9% 9.9%
Other actions 8 1 5 2 1 7 3 5 0 0 3 0 0.7% 0.3% 1.4% 0.5% 0.2% 1.3% 0.5% 1.4% - 0.7% 2.8% - IK
None 293 83 84 126 148 145 221 53 18 12 37 13 26.5% 22.4% 22.1% 35.6% 25.6% 27.4% 35.1% 15.7% 13.4% 20.3% 31.7% 25.6% AB G I

142
Q37. Has your company considered (either in the recent past or at present) dropping employee health benefits altogether? ______________________________________________________________________________ Proportions/Means: Columns Tested (10% risk level) - A/B/C - D/E - F/G/H - I/J/K * small base; ** very small base (under 30) ineligible for sig testing
Company Size Decision Maker Awareness Occupation
Total 2 to 49 50 to 499 500 + Primary Decision Maker
Influencer Low Medium High Manufacturing
Retail trade Finance/Insurance
A B C D E F G H I J K
Base: Respondents With Medical Plan(s) 1137 249 416 472 575 562 607 351 179 296 252 223
Weighted 1105 370* 381 354* 577 528 630 339* 136** 58 118 50
Yes 203 87 87 29 137 66 83 88 31 15 20 7 18.4% 23.5% 22.7% 8.3% 23.7% 12.6% 13.2% 26.1% 23.0% 26.0% 17.1% 13.5% C C E F JK
No 747 242 243 262 369 377 425 218 103 36 76 36 67.6% 65.4% 63.7% 74.0% 64.0% 71.5% 67.5% 64.3% 76.2% 62.8% 64.7% 71.7% I
I don't know 155 41 51 63 71 84 121 32 1 6 21 7 14.0% 11.0% 13.5% 17.7% 12.3% 15.9% 19.3% 9.6% 0.8% 11.1% 18.3% 14.8% G I

143
Q38. We would like to understand if your company has adopted any of the following tactics to reduce your health benefit costs or improve your benefits offering. Which of the following arrangements does your company have? ______________________________________________________________________________ Proportions/Means: Columns Tested (10% risk level) - A/B/C - D/E - F/G/H - I/J/K * small base; ** very small base (under 30) ineligible for sig testing
Company Size Decision Maker Awareness Occupation
Total 2 to 49 50 to 499 500 + Primary Decision Maker
Influencer Low Medium High Manufacturing
Retail trade Finance/Insurance
A B C D E F G H I J K
Base: All Respondents 1329 336 458 535 672 657 758 384 187 321 329 250
Weighted 1329 508 426 395* 683 646 813 378* 138** 62 154 56
Direct contract with a health provider... to receive preferential rates and discounts for employees
280 84 93 104 137 144 108 90 83 23 30 11
21.1% 16.6% 21.7% 26.3% 20.0% 22.2% 13.2% 23.7% 60.1% 37.1% 19.8% 19.2% A F JK
Partnership with a provider... or retailer... to promote employee wellness and health management
279 95 68 116 161 119 132 88 59 18 29 15
21.0% 18.7% 16.1% 29.3% 23.5% 18.4% 16.2% 23.4% 42.5% 28.3% 18.8% 26.4% AB J J
Partnership with a retailer... to provide employees with added discounts for prescription drugs
202 57 61 85 130 73 88 62 52 14 28 9
15.2% 11.1% 14.2% 21.6% 19.0% 11.3% 10.9% 16.5% 37.4% 22.1% 18.5% 15.6% A E K
Center of excellence' partnership a health provider to treat employees with a specific health condition...
185 53 75 57 111 74 52 86 47 11 22 9
14.0% 10.5% 17.6% 14.5% 16.2% 11.5% 6.4% 22.7% 34.3% 17.1% 14.3% 16.0% F
Use... of 'narrow provider networks,' which restrict employees' provider choice in exchange for lower costs and better quality of care
170 54 58 58 86 83 78 65 27 14 14 7
12.8% 10.6% 13.6% 14.6% 12.6% 12.9% 9.5% 17.2% 19.5% 22.1% 9.4% 11.6% F JK
Employer health benefit group purchasing coalitions
135 51 42 42 56 78 80 41 14 9 16 5
10.1% 10.1% 9.8% 10.6% 8.3% 12.1% 9.8% 10.9% 9.9% 13.7% 10.6% 8.8% K
Risk-sharing arrangements with either an insurer or provider based on how well they manage your employees' health outcomes
87 30 23 35 55 32 48 22 18 7 14 5
6.6% 5.8% 5.4% 8.7% 8.1% 4.9% 5.9% 5.8% 12.8% 11.5% 8.8% 9.2%
None of the above 668 308 182 178 331 337 493 151 24 21 79 27 50.3% 60.6% 42.8% 45.1% 48.4% 52.3% 60.7% 39.9% 17.5% 34.3% 51.7% 47.2% BC G I I

144
Q38a_1. [Center of excellence' partnership a health provider to treat employees with a specific health condition...] You indicated that you have the following types of arrangements and direct partnerships. How satisfied are you with each of these? ______________________________________________________________________________ Proportions/Means: Columns Tested (10% risk level) - A/B/C - D/E - F/G/H - I/J/K * small base; ** very small base (under 30) ineligible for sig testing
Company Size Decision Maker Awareness Occupation
Total 2 to 49 50 to 499 500 + Primary Decision Maker
Influencer Low Medium High Manufacturing
Retail trade Finance/Insurance
A B C D E F G H I J K
Base: Center of excellence' partnership a health provider to treat employees with a specific health condition... - Has Arrangements
192 39 60 93 121 71 69 66 57 55 47 40
Weighted 185* 53** 75** 57** 111** 74** 52** 86** 47** 11* 22* 9*
Center of excellence' partnership a health provider to treat employees with a specific health condition...
We are very satisfied with this partnership and would like to expand it
105 35 39 31 73 32 17 47 42 7 10 5
56.7% 66.0% 52.4% 53.8% 66.0% 42.9% 31.6% 54.9% 87.7% 67.3% 46.8% 57.5% J
We are satisfied with this partnership 74 18 30 26 38 37 36 33 5 4 11 4 40.1% 34.0% 40.1% 45.8% 33.8% 49.5% 68.0% 39.0% 11.3% 32.7% 51.1% 40.0% I
We are not satisfied with this partnership 6 0 6 0 0 6 0 5 0 0 0 0 3.2% - 7.5% 0.4% 0.2% 7.6% 0.4% 6.0% 1.0% - 2.1% 2.5%
Summary
Top2Box (Very satisfied/ satisfied) 180 53 69 57 111 69 52 81 47 11 21 9 96.8% 100.0% 92.5% 99.6% 99.8% 92.4% 99.6% 94.0% 99.0% 100.0% 97.9% 97.5%
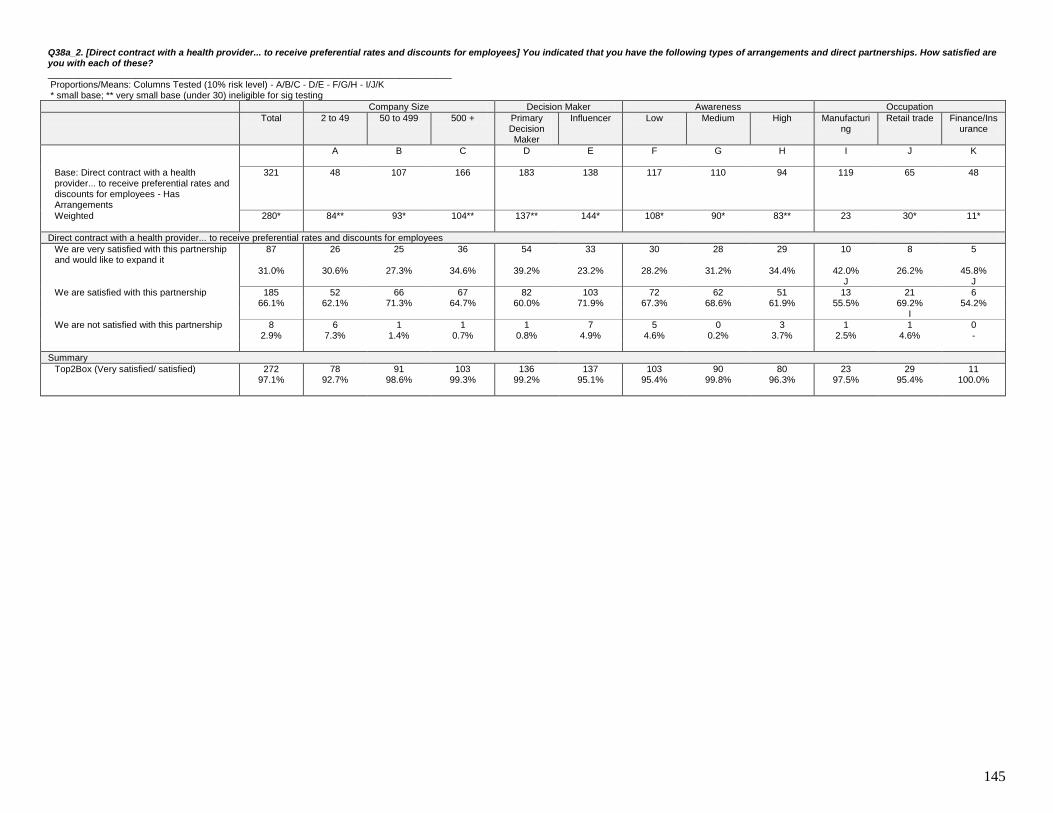
145
Q38a_2. [Direct contract with a health provider... to receive preferential rates and discounts for employees] You indicated that you have the following types of arrangements and direct partnerships. How satisfied are you with each of these? ______________________________________________________________________________ Proportions/Means: Columns Tested (10% risk level) - A/B/C - D/E - F/G/H - I/J/K * small base; ** very small base (under 30) ineligible for sig testing
Company Size Decision Maker Awareness Occupation
Total 2 to 49 50 to 499 500 + Primary Decision Maker
Influencer Low Medium High Manufacturing
Retail trade Finance/Insurance
A B C D E F G H I J K
Base: Direct contract with a health provider... to receive preferential rates and discounts for employees - Has Arrangements
321 48 107 166 183 138 117 110 94 119 65 48
Weighted 280* 84** 93* 104** 137** 144* 108* 90* 83** 23 30* 11*
Direct contract with a health provider... to receive preferential rates and discounts for employees
We are very satisfied with this partnership and would like to expand it
87 26 25 36 54 33 30 28 29 10 8 5
31.0% 30.6% 27.3% 34.6% 39.2% 23.2% 28.2% 31.2% 34.4% 42.0% 26.2% 45.8% J J
We are satisfied with this partnership 185 52 66 67 82 103 72 62 51 13 21 6 66.1% 62.1% 71.3% 64.7% 60.0% 71.9% 67.3% 68.6% 61.9% 55.5% 69.2% 54.2% I
We are not satisfied with this partnership 8 6 1 1 1 7 5 0 3 1 1 0 2.9% 7.3% 1.4% 0.7% 0.8% 4.9% 4.6% 0.2% 3.7% 2.5% 4.6% -
Summary
Top2Box (Very satisfied/ satisfied) 272 78 91 103 136 137 103 90 80 23 29 11 97.1% 92.7% 98.6% 99.3% 99.2% 95.1% 95.4% 99.8% 96.3% 97.5% 95.4% 100.0%
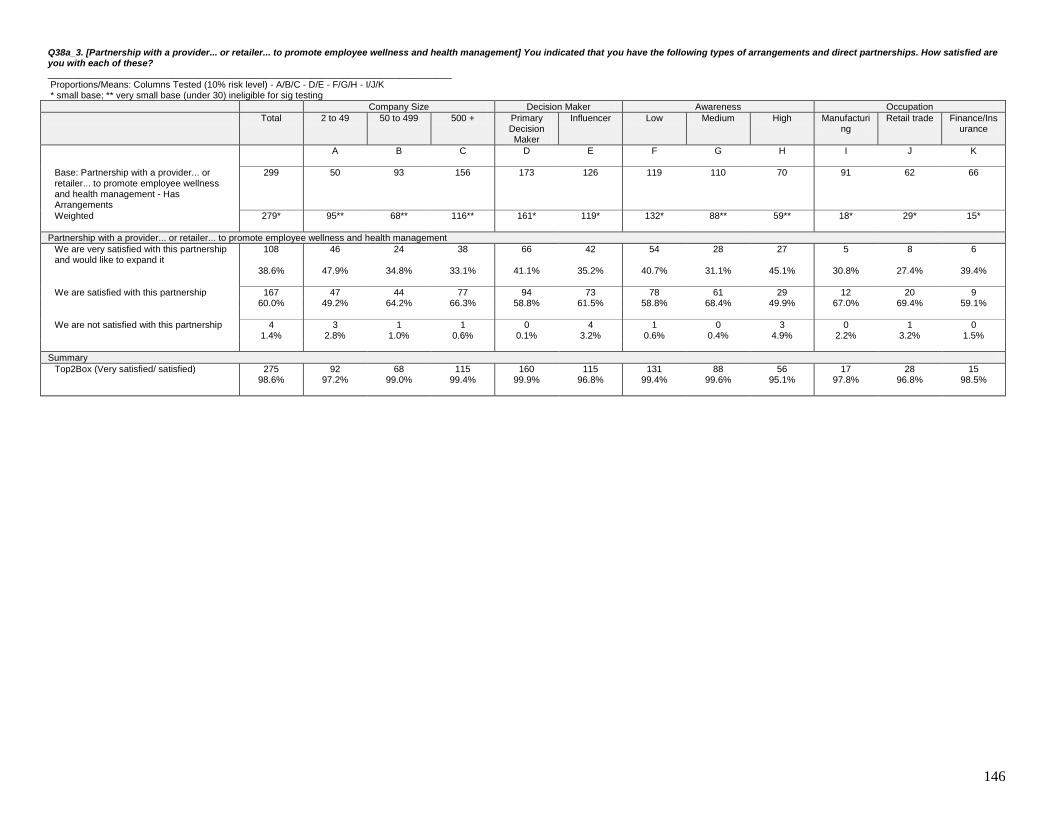
146
Q38a_3. [Partnership with a provider... or retailer... to promote employee wellness and health management] You indicated that you have the following types of arrangements and direct partnerships. How satisfied are you with each of these? ______________________________________________________________________________ Proportions/Means: Columns Tested (10% risk level) - A/B/C - D/E - F/G/H - I/J/K * small base; ** very small base (under 30) ineligible for sig testing
Company Size Decision Maker Awareness Occupation
Total 2 to 49 50 to 499 500 + Primary Decision Maker
Influencer Low Medium High Manufacturing
Retail trade Finance/Insurance
A B C D E F G H I J K
Base: Partnership with a provider... or retailer... to promote employee wellness and health management - Has Arrangements
299 50 93 156 173 126 119 110 70 91 62 66
Weighted 279* 95** 68** 116** 161* 119* 132* 88** 59** 18* 29* 15*
Partnership with a provider... or retailer... to promote employee wellness and health management
We are very satisfied with this partnership and would like to expand it
108 46 24 38 66 42 54 28 27 5 8 6
38.6% 47.9% 34.8% 33.1% 41.1% 35.2% 40.7% 31.1% 45.1% 30.8% 27.4% 39.4%
We are satisfied with this partnership 167 47 44 77 94 73 78 61 29 12 20 9 60.0% 49.2% 64.2% 66.3% 58.8% 61.5% 58.8% 68.4% 49.9% 67.0% 69.4% 59.1%
We are not satisfied with this partnership 4 3 1 1 0 4 1 0 3 0 1 0 1.4% 2.8% 1.0% 0.6% 0.1% 3.2% 0.6% 0.4% 4.9% 2.2% 3.2% 1.5%
Summary
Top2Box (Very satisfied/ satisfied) 275 92 68 115 160 115 131 88 56 17 28 15 98.6% 97.2% 99.0% 99.4% 99.9% 96.8% 99.4% 99.6% 95.1% 97.8% 96.8% 98.5%

147
Q38a_4. [Partnership with a retailer... to provide employees with added discounts for prescription drugs] You indicated that you have the following types of arrangements and direct partnerships. How satisfied are you with each of these? ______________________________________________________________________________ Proportions/Means: Columns Tested (10% risk level) - A/B/C - D/E - F/G/H - I/J/K * small base; ** very small base (under 30) ineligible for sig testing
Company Size Decision Maker Awareness Occupation
Total 2 to 49 50 to 499 500 + Primary Decision Maker
Influencer Low Medium High Manufacturing
Retail trade Finance/Insurance
A B C D E F G H I J K
Base: Partnership with a retailer... to provide employees with added discounts for prescription drugs - Has Arrangements
224 37 67 120 135 89 97 70 57 71 61 39
Weighted 202* 57** 61** 85** 130** 73** 88** 62** 52** 14* 28* 9*
Partnership with a retailer... to provide employees with added discounts for prescription drugs
We are very satisfied with this partnership and would like to expand it
74 23 27 24 54 20 37 21 17 5 9 3
36.8% 41.4% 44.5% 28.2% 41.8% 27.7% 41.6% 33.6% 32.3% 36.6% 32.8% 33.3%
We are satisfied with this partnership 122 31 33 58 72 50 51 39 32 8 19 6 60.4% 54.2% 54.9% 68.4% 55.8% 68.6% 57.9% 62.1% 62.6% 59.2% 67.2% 66.7%
We are not satisfied with this partnership 6 2 0 3 3 3 0 3 3 1 0 0 2.8% 4.4% 0.6% 3.4% 2.4% 3.7% 0.5% 4.3% 5.1% 4.2% - - J
Summary
Top2Box (Very satisfied/ satisfied) 197 54 60 82 127 70 88 60 49 13 28 9 97.2% 95.6% 99.4% 96.6% 97.6% 96.3% 99.5% 95.7% 94.9% 95.8% 100.0% 100.0% I

148
Q38a_5. [Use... of 'narrow provider networks,'...] You indicated that you have the following types of arrangements and direct partnerships. How satisfied are you with each of these? ______________________________________________________________________________ Proportions/Means: Columns Tested (10% risk level) - A/B/C - D/E - F/G/H - I/J/K * small base; ** very small base (under 30) ineligible for sig testing
Company Size Decision Maker Awareness Occupation
Total 2 to 49 50 to 499 500 + Primary Decision Maker
Influencer Low Medium High Manufacturing
Retail trade Finance/Insurance
A B C D E F G H I J K
Base: Use... of 'narrow provider networks,'... - Has Arrangements
178 32 58 88 102 76 66 65 47 71 31 29
Weighted 170* 54** 58** 58** 86** 83** 78** 65** 27** 14* 14* 7**
Use... of 'narrow provider networks,'...
We are very satisfied with this partnership and would like to expand it
45 20 12 13 32 13 11 18 16 5 4 2
26.3% 37.3% 20.3% 22.0% 36.8% 15.4% 13.9% 27.0% 60.1% 38.0% 25.8% 27.6%
We are satisfied with this partnership 102 28 33 42 52 50 54 38 10 8 10 5 60.3% 51.7% 56.4% 72.2% 60.3% 60.3% 70.0% 58.7% 36.5% 56.3% 71.0% 72.4%
We are not satisfied with this partnership 23 6 14 3 2 20 12 9 1 1 0 0 13.4% 11.0% 23.3% 5.7% 2.9% 24.3% 16.1% 14.3% 3.5% 5.6% 3.2% -
Summary
Top2Box (Very satisfied/ satisfied) 147 48 45 54 84 63 65 56 26 13 14 7 86.6% 89.0% 76.7% 94.3% 97.1% 75.7% 83.9% 85.7% 96.5% 94.4% 96.8% 100.0%

149
Q38a_6. [Risk-sharing arrangements...] You indicated that you have the following types of arrangements and direct partnerships. How satisfied are you with each of these? ______________________________________________________________________________ Proportions/Means: Columns Tested (10% risk level) - A/B/C - D/E - F/G/H - I/J/K * small base; ** very small base (under 30) ineligible for sig testing
Company Size Decision Maker Awareness Occupation
Total 2 to 49 50 to 499 500 + Primary Decision Maker
Influencer Low Medium High Manufacturing
Retail trade Finance/Insurance
A B C D E F G H I J K
Base: Risk-sharing arrangements... - Has Arrangements
113 21 39 53 71 42 41 43 29 37 29 23
Weighted 87* 30** 23** 35** 55** 32** 48** 22** 18** 7* 14** 5**
Risk-sharing arrangements...
We are very satisfied with this partnership and would like to expand it
33 19 3 11 24 10 16 8 9 3 4 2
38.2% 65.7% 14.4% 30.6% 42.6% 30.6% 34.2% 35.0% 53.0% 35.1% 27.6% 30.4%
We are satisfied with this partnership 50 10 19 21 28 22 30 14 5 4 9 3 57.3% 33.9% 83.6% 59.9% 50.6% 69.0% 63.7% 65.0% 30.7% 62.2% 69.0% 60.9%
We are not satisfied with this partnership 4 0 0 3 4 0 1 0 3 0 0 0 4.4% 0.4% 2.0% 9.5% 6.8% 0.3% 2.1% - 16.3% 2.7% 3.4% 8.7%
Summary
Top2Box (Very satisfied/ satisfied) 83 29 23 31 52 32 47 22 15 7 13 5 95.6% 99.6% 98.0% 90.5% 93.2% 99.7% 97.9% 100.0% 83.7% 97.3% 96.6% 91.3%

150
Q38a_7. [Employer health benefit group purchasing coalitions] You indicated that you have the following types of arrangements and direct partnerships. How satisfied are you with each of these? ______________________________________________________________________________ Proportions/Means: Columns Tested (10% risk level) - A/B/C - D/E - F/G/H - I/J/K * small base; ** very small base (under 30) ineligible for sig testing
Company Size Decision Maker Awareness Occupation
Total 2 to 49 50 to 499 500 + Primary Decision Maker
Influencer Low Medium High Manufacturing
Retail trade Finance/Insurance
A B C D E F G H I J K
Base: Employer health benefit group purchasing coalitions - Has Arrangements
143 26 59 58 67 76 71 50 22 44 35 22
Weighted 135* 51** 42** 42** 56** 78** 80** 41** 14** 9* 16* 5**
Employer health benefit group purchasing coalitions
We are very satisfied with this partnership and would like to expand it
33 10 13 10 23 10 13 9 11 3 5 0
24.2% 18.6% 30.6% 24.9% 40.3% 12.6% 16.3% 22.0% 76.7% 31.8% 28.6% 9.1%
We are satisfied with this partnership 71 24 24 23 32 39 40 28 3 5 8 4 52.7% 46.5% 57.0% 55.9% 56.9% 49.7% 50.7% 67.5% 19.9% 61.4% 48.6% 90.9%
We are not satisfied with this partnership 31 18 5 8 2 29 26 4 0 1 4 0 23.1% 34.9% 12.4% 19.2% 2.8% 37.7% 33.0% 10.5% 3.4% 6.8% 22.9% - I
Summary
Top2Box (Very satisfied/ satisfied) 104 33 36 34 55 49 53 37 13 8 13 5 76.9% 65.1% 87.6% 80.8% 97.2% 62.3% 67.0% 89.5% 96.6% 93.2% 77.1% 100.0% J

151
Q38b_1. [Center of excellence' partnership a health provider to treat employees with a specific health condition...] Please describe your company's level of involvement and interest in the following types of direct partnerships with other organizations that could help your employees access healthcare. ______________________________________________________________________________ Proportions/Means: Columns Tested (10% risk level) - A/B/C - D/E - F/G/H - I/J/K * small base; ** very small base (under 30) ineligible for sig testing
Company Size Decision Maker Awareness Occupation
Total 2 to 49 50 to 499 500 + Primary Decision Maker
Influencer Low Medium High Manufacturing
Retail trade Finance/Insurance
A B C D E F G H I J K
Base: Center of excellence' partnership a health provider to treat employees with a specific health condition... - Not Adopted
1137 297 398 442 551 586 689 318 130 266 282 210
Weighted 1144 454 351 338* 572 571 760 292* 91** 52 132 47
Center of excellence' partnership a health provider to treat employees with a specific health condition...
Very interested 94 31 35 27 55 39 49 27 18 10 14 6 8.2% 6.9% 10.1% 7.9% 9.6% 6.8% 6.4% 9.1% 19.9% 19.2% 10.3% 12.9% JK
Somewhat interested 480 133 163 184 267 214 285 143 53 24 53 20 42.0% 29.3% 46.6% 54.3% 46.6% 37.5% 37.5% 48.8% 58.1% 45.9% 40.4% 41.4% A A F
Not interested 271 171 67 34 126 145 195 58 18 10 23 9 23.7% 37.6% 19.0% 9.9% 22.1% 25.3% 25.6% 19.9% 20.3% 18.4% 17.4% 19.0% BC C
I don't know 298 119 85 94 125 174 232 65 2 9 42 13 26.1% 26.2% 24.3% 27.9% 21.8% 30.4% 30.5% 22.2% 1.8% 16.5% 31.9% 26.7% D I I
Summary
Top2Box (Very/ Somewhat interested) 574 165 199 210 321 253 334 169 71 34 67 26 50.2% 36.3% 56.7% 62.2% 56.1% 44.2% 43.9% 57.9% 77.9% 65.0% 50.7% 54.3% A A E F JK

152
Q38b_2. [Direct contract with a health provider... to receive preferential rates and discounts for employees] Please describe your company's level of involvement and interest in the following types of direct partnerships with other organizations that could help your employees access healthcare. ______________________________________________________________________________ Proportions/Means: Columns Tested (10% risk level) - A/B/C - D/E - F/G/H - I/J/K * small base; ** very small base (under 30) ineligible for sig testing
Company Size Decision Maker Awareness Occupation
Total 2 to 49 50 to 499 500 + Primary Decision Maker
Influencer Low Medium High Manufacturing
Retail trade Finance/Insurance
A B C D E F G H I J K
Base: Direct contract with a health provider... to receive preferential rates and discounts for employees - Not Adopted
1008 288 351 369 489 519 641 274 93 202 264 202
Weighted 1049 424* 333* 291* 547 502 705 288* 55** 39 123 45
Direct contract with a health provider... to receive preferential rates and discounts for employees
Very interested 183 66 84 32 125 58 104 60 18 9 16 9 17.4% 15.7% 25.3% 11.0% 22.8% 11.5% 14.8% 20.9% 33.3% 23.8% 13.3% 18.8% C E J J
Somewhat interested 399 138 120 140 207 192 264 119 16 16 48 17 38.0% 32.6% 36.0% 48.2% 37.8% 38.3% 37.5% 41.2% 28.9% 40.1% 39.0% 38.1% A
Not interested 212 113 62 37 106 105 131 60 20 7 19 8 20.2% 26.7% 18.5% 12.7% 19.5% 21.0% 18.6% 20.8% 36.9% 17.3% 15.2% 18.3% C
I don't know 255 106 67 82 109 146 205 49 0 7 40 11 24.3% 25.0% 20.2% 28.2% 19.9% 29.2% 29.1% 17.1% 0.9% 18.8% 32.6% 24.8% D G IK
Summary
Top2Box (Very/ Somewhat interested) 581 205 204 172 331 250 368 179 34 25 64 26 55.5% 48.3% 61.3% 59.2% 60.6% 49.8% 52.2% 62.1% 62.2% 63.9% 52.3% 56.9% A E J

153
Q38b_3. [Partnership with a provider... or retailer... to promote employee wellness and health management] Please describe your company's level of involvement and interest in the following types of direct partnerships with other organizations that could help your employees access healthcare. ______________________________________________________________________________ Proportions/Means: Columns Tested (10% risk level) - A/B/C - D/E - F/G/H - I/J/K * small base; ** very small base (under 30) ineligible for sig testing
Company Size Decision Maker Awareness Occupation
Total 2 to 49 50 to 499 500 + Primary Decision Maker
Influencer Low Medium High Manufacturing
Retail trade Finance/Insurance
A B C D E F G H I J K
Base: Partnership with a provider... or retailer... to promote employee wellness and health management - Not Adopted
1030 286 365 379 499 531 639 274 117 230 267 184
Weighted 1050 413* 357* 280* 523 527 681 290* 79** 45 125 41
Partnership with a provider... or retailer... to promote employee wellness and health management
Very interested 183 62 92 29 120 63 95 55 33 10 15 5 17.5% 15.1% 25.8% 10.3% 22.9% 12.0% 14.0% 19.0% 41.9% 23.0% 12.4% 13.0% AC E JK
Somewhat interested 373 116 137 120 180 192 236 108 29 19 43 17 35.5% 28.0% 38.2% 43.0% 34.5% 36.5% 34.6% 37.2% 36.8% 43.0% 34.8% 41.8% A J
Not interested 233 136 57 40 114 119 142 76 16 8 27 8 22.2% 32.8% 16.0% 14.4% 21.8% 22.6% 20.8% 26.1% 19.5% 17.4% 21.3% 19.6% BC
I don't know 261 99 71 90 109 152 208 51 1 7 39 11 24.9% 24.1% 20.0% 32.3% 20.8% 28.9% 30.6% 17.7% 1.7% 16.5% 31.5% 25.5% B G I I
Summary
Top2Box (Very/ Somewhat interested) 556 178 229 149 300 256 331 163 63 30 59 23 53.0% 43.1% 64.0% 53.3% 57.4% 48.5% 48.6% 56.2% 78.8% 66.1% 47.2% 54.9% A JK

154
Q38b_4. [Partnership with a retailer... to provide employees with added discounts for prescription drugs] Please describe your company's level of involvement and interest in the following types of direct partnerships with other organizations that could help your employees access healthcare. ______________________________________________________________________________ Proportions/Means: Columns Tested (10% risk level) - A/B/C - D/E - F/G/H - I/J/K * small base
Company Size Decision Maker Awareness Occupation
Total 2 to 49 50 to 499 500 + Primary Decision Maker
Influencer Low Medium High Manufacturing
Retail trade Finance/Insurance
A B C D E F G H I J K
Base: Partnership with a retailer... to provide employees with added discounts for prescription drugs - Not Adopted
1105 299 391 415 537 568 661 314 130 250 268 211
Weighted 1127 451 365* 310* 554 573 724 316* 87* 49 125 47
Partnership with a retailer... to provide employees with added discounts for prescription drugs
Very interested 183 62 78 43 101 81 105 52 25 12 21 8 16.2% 13.8% 21.2% 13.8% 18.3% 14.2% 14.5% 16.5% 29.3% 25.2% 16.4% 17.1% F JK
Somewhat interested 437 154 153 130 210 227 256 141 40 20 41 17 38.8% 34.1% 42.0% 41.9% 38.0% 39.6% 35.3% 44.6% 46.4% 41.6% 32.8% 36.5% J
Not interested 235 138 50 47 119 116 150 65 20 9 27 10 20.9% 30.6% 13.8% 15.0% 21.5% 20.2% 20.7% 20.6% 22.8% 18.8% 21.3% 21.3% BC
I don't know 272 97 84 91 123 149 213 58 1 7 37 12 24.1% 21.5% 22.9% 29.4% 22.2% 26.0% 29.4% 18.3% 1.6% 14.4% 29.5% 25.1% GH H I I
Summary
Top2Box (Very/ Somewhat interested) 620 216 231 173 312 308 361 193 65 32 62 25 55.0% 47.9% 63.3% 55.6% 56.3% 53.7% 49.9% 61.1% 75.7% 66.8% 49.3% 53.6% A F JK
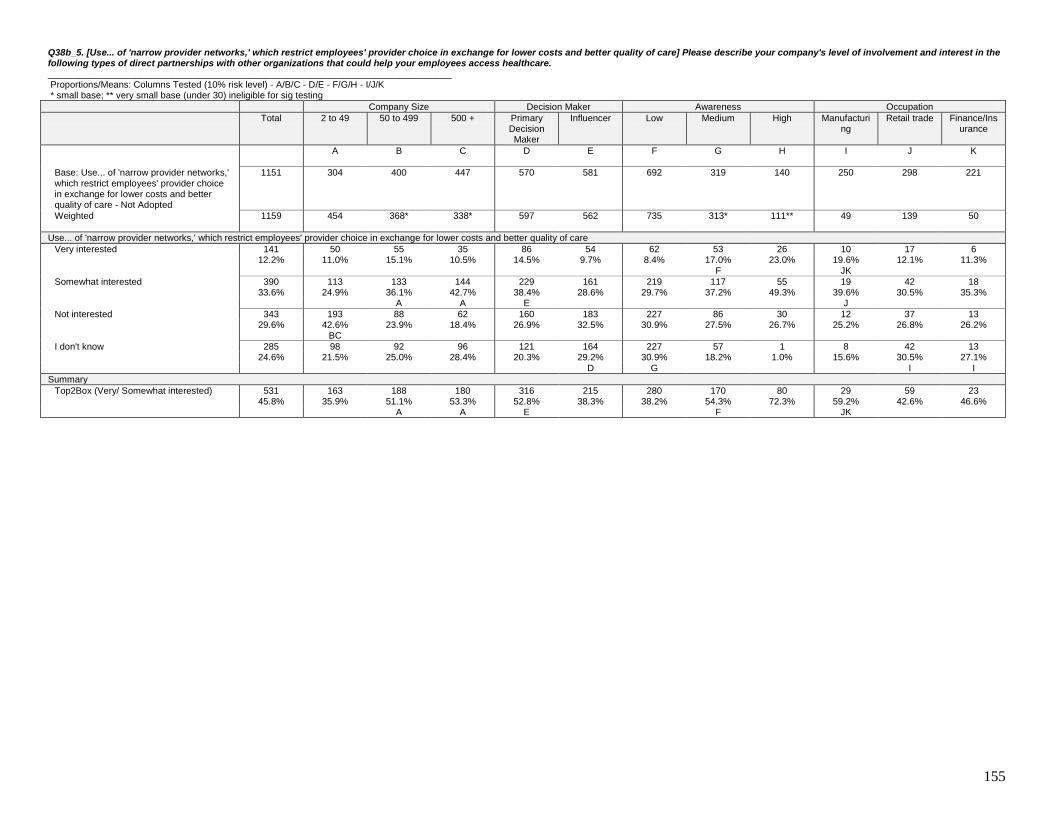
155
Q38b_5. [Use... of 'narrow provider networks,' which restrict employees' provider choice in exchange for lower costs and better quality of care] Please describe your company's level of involvement and interest in the following types of direct partnerships with other organizations that could help your employees access healthcare. ______________________________________________________________________________ Proportions/Means: Columns Tested (10% risk level) - A/B/C - D/E - F/G/H - I/J/K * small base; ** very small base (under 30) ineligible for sig testing
Company Size Decision Maker Awareness Occupation
Total 2 to 49 50 to 499 500 + Primary Decision Maker
Influencer Low Medium High Manufacturing
Retail trade Finance/Insurance
A B C D E F G H I J K
Base: Use... of 'narrow provider networks,' which restrict employees' provider choice in exchange for lower costs and better quality of care - Not Adopted
1151 304 400 447 570 581 692 319 140 250 298 221
Weighted 1159 454 368* 338* 597 562 735 313* 111** 49 139 50
Use... of 'narrow provider networks,' which restrict employees' provider choice in exchange for lower costs and better quality of care
Very interested 141 50 55 35 86 54 62 53 26 10 17 6 12.2% 11.0% 15.1% 10.5% 14.5% 9.7% 8.4% 17.0% 23.0% 19.6% 12.1% 11.3%
F JK
Somewhat interested 390 113 133 144 229 161 219 117 55 19 42 18 33.6% 24.9% 36.1% 42.7% 38.4% 28.6% 29.7% 37.2% 49.3% 39.6% 30.5% 35.3% A A E J
Not interested 343 193 88 62 160 183 227 86 30 12 37 13 29.6% 42.6% 23.9% 18.4% 26.9% 32.5% 30.9% 27.5% 26.7% 25.2% 26.8% 26.2% BC
I don't know 285 98 92 96 121 164 227 57 1 8 42 13 24.6% 21.5% 25.0% 28.4% 20.3% 29.2% 30.9% 18.2% 1.0% 15.6% 30.5% 27.1% D G I I
Summary
Top2Box (Very/ Somewhat interested) 531 163 188 180 316 215 280 170 80 29 59 23 45.8% 35.9% 51.1% 53.3% 52.8% 38.3% 38.2% 54.3% 72.3% 59.2% 42.6% 46.6% A A E F JK

156
Q38b_6. [Risk-sharing arrangements with either an insurer or provider based on how well they manage your employees' health outcomes] Please describe your company's level of involvement and interest in the following types of direct partnerships with other organizations that could help your employees access healthcare. ______________________________________________________________________________ Proportions/Means: Columns Tested (10% risk level) - A/B/C - D/E - F/G/H - I/J/K * small base; ** very small base (under 30) ineligible for sig testing
Company Size Decision Maker Awareness Occupation
Total 2 to 49 50 to 499 500 + Primary Decision Maker
Influencer Low Medium High Manufacturing
Retail trade Finance/Insurance
A B C D E F G H I J K
Base: Risk-sharing arrangements with either an insurer or provider based on how well they manage your employees' health outcomes - Not Adopted
1216 315 419 482 601 615 717 341 158 284 300 227
Weighted 1242 478 403 361* 628 614 765 356* 121** 55 140 51
Risk-sharing arrangements with either an insurer or provider based on how well they manage your employees' health outcomes
Very interested 142 34 79 29 97 46 51 54 37 11 9 7 11.4% 7.1% 19.6% 8.1% 15.4% 7.4% 6.7% 15.1% 30.6% 19.0% 6.7% 13.7%
AC E F J J
Somewhat interested 466 145 149 172 258 208 246 162 59 24 53 18 37.5% 30.3% 36.9% 47.8% 41.2% 33.8% 32.1% 45.4% 48.7% 43.3% 37.7% 34.4% A F K
Not interested 304 176 76 52 133 170 203 79 21 12 34 12 24.4% 36.8% 18.9% 14.3% 21.2% 27.7% 26.6% 22.1% 17.8% 21.5% 24.3% 23.8% BC
I don't know 330 123 99 108 140 191 265 62 4 9 44 14 26.6% 25.8% 24.6% 29.8% 22.2% 31.0% 34.6% 17.3% 3.0% 16.2% 31.3% 28.2% D G I I
Summary
Top2Box (Very/ Somewhat interested) 608 179 228 202 355 253 297 216 96 34 62 25 49.0% 37.4% 56.5% 55.9% 56.5% 41.2% 38.8% 60.5% 79.3% 62.3% 44.3% 48.0% A A E F JK

157
Q38b_7. [Employer health benefit group purchasing coalitions] Please describe your company's level of involvement and interest in the following types of direct partnerships with other organizations that could help your employees access healthcare. ______________________________________________________________________________ Proportions/Means: Columns Tested (10% risk level) - A/B/C - D/E - F/G/H - I/J/K * small base; ** very small base (under 30) ineligible for sig testing
Company Size Decision Maker Awareness Occupation
Total 2 to 49 50 to 499 500 + Primary Decision Maker
Influencer Low Medium High Manufacturing
Retail trade Finance/Insurance
A B C D E F G H I J K
Base: Employer health benefit group purchasing coalitions - Not Adopted
1186 310 399 477 605 581 687 334 165 277 294 228
Weighted 1194 456 384* 354* 627 567 733 337* 124** 54 137 51
Employer health benefit group purchasing coalitions
Very interested 189 53 94 42 141 48 92 66 31 13 15 8 15.8% 11.6% 24.5% 11.9% 22.5% 8.4% 12.5% 19.6% 24.8% 23.5% 10.9% 16.2% AC E JK J
Somewhat interested 454 170 129 155 240 214 238 155 61 23 54 17 38.0% 37.1% 33.7% 43.8% 38.2% 37.7% 32.5% 46.0% 48.7% 41.9% 39.1% 33.8% F K
Not interested 236 110 80 46 114 122 146 58 32 10 26 12 19.8% 24.0% 20.9% 13.0% 18.2% 21.5% 19.9% 17.4% 25.5% 18.8% 18.7% 23.7% C
I don't know 316 124 81 111 133 183 257 58 1 9 43 13 26.5% 27.3% 21.0% 31.4% 21.1% 32.3% 35.1% 17.1% 0.9% 15.9% 31.3% 26.3% D G I I
Summary
Top2Box (Very/ Somewhat interested) 642 222 223 197 380 262 330 221 92 35 69 26 53.8% 48.7% 58.1% 55.6% 60.7% 46.2% 45.0% 65.5% 73.6% 65.3% 50.0% 50.0% E F JK

158
Q39. The healthcare reform act introduces a 'Cadillac' excise tax on health plans whose costs exceed a certain threshold. Here are a few facts about it: [see questionnaire for details]… Overall, how much is the Cadillac tax affecting your organization's medical benefits strategy today? ______________________________________________________________________________ Proportions/Means: Columns Tested (10% risk level) - A/B/C - D/E - F/G/H - I/J/K * small base; ** very small base (under 30) ineligible for sig testing
Company Size Decision Maker Awareness Occupation
Total 2 to 49 50 to 499 500 + Primary Decision Maker
Influencer Low Medium High Manufacturing
Retail trade Finance/Insurance
A B C D E F G H I J K
Base: All Respondents 1329 336 458 535 672 657 758 384 187 321 329 250
Weighted 1329 508 426 395* 683 646 813 378* 138** 62 154 56
No impact because the tax will not likely apply to us
554 250 161 143 262 292 385 148 21 18 64 21
41.7% 49.3% 37.7% 36.3% 38.4% 45.2% 47.4% 39.2% 15.0% 28.7% 41.3% 37.2% BC I I
We have not made any changes because of the tax yet, but we may be at risk of incurring the tax in the future
519 187 176 156 286 233 299 153 66 26 59 22
39.1% 36.9% 41.3% 39.5% 41.9% 36.0% 36.8% 40.5% 48.1% 42.4% 38.3% 39.6%
We are actively considering making changes because of the tax
196 59 69 68 92 103 104 61 31 13 24 9
14.7% 11.6% 16.2% 17.1% 13.5% 16.0% 12.8% 16.0% 22.5% 20.6% 15.5% 16.8% J
We have already made changes specifically because of the tax...
60 11 21 28 42 18 24 16 20 5 7 4
4.5% 2.2% 4.8% 7.2% 6.2% 2.7% 3.0% 4.2% 14.4% 8.4% 4.9% 6.4% A J

159
Q39a. Which of the following changes have you made or are you considering specifically in response to the Cadillac excise tax? ______________________________________________________________________________ Proportions/Means: Columns Tested (10% risk level) - A/B/C - D/E - F/G/H - I/J/K * small base; ** very small base (under 30) ineligible for sig testing
Company Size Decision Maker Awareness Occupation
Total 2 to 49 50 to 499 500 + Primary Decision Maker
Influencer Low Medium High Manufacturing
Retail trade Finance/Insurance
A B C D E F G H I J K
Base: Actively Considering Or Have Already Made Changes Specifically Because Of The Tax
306 43 102 161 166 140 141 88 77 93 67 58
Weighted 256* 70** 90* 96* 135* 121* 128* 77** 51** 18* 31* 13*
Eliminating or reducing high cost options 99 26 43 30 57 43 44 29 26 6 12 5 38.8% 36.4% 48.5% 31.4% 41.9% 35.3% 34.6% 37.8% 50.8% 35.5% 37.3% 36.2%
Plan design and/or health management programs to lower cost trends
71 21 25 25 36 35 32 22 17 5 7 4
27.7% 29.9% 28.3% 25.6% 26.5% 29.1% 24.9% 28.6% 33.6% 26.9% 22.4% 29.3%
Reducing medical coverage for active employees
57 15 23 20 28 29 14 24 19 7 8 3
22.2% 20.7% 25.2% 20.7% 20.9% 23.7% 10.9% 31.3% 37.0% 37.6% 25.4% 22.4% JK
Eliminating ancillary benefits (dental, vision, etc.)
52 24 18 10 31 21 26 4 22 5 7 3
20.3% 34.1% 19.8% 10.7% 22.8% 17.6% 20.0% 5.1% 44.1% 30.1% 20.9% 25.9%
Reducing medical coverage for retirees 35 12 12 11 13 22 14 9 12 6 5 2 13.6% 17.4% 12.9% 11.5% 9.4% 18.3% 11.0% 11.5% 23.6% 32.3% 14.9% 19.0% JK
Discontinuing medical coverage for retirees
33 23 3 8 21 12 6 10 17 3 3 1
12.9% 32.2% 3.0% 8.1% 15.4% 10.2% 5.0% 12.6% 33.3% 16.1% 10.4% 10.3%
Discontinuing medical coverage for active employees
27 18 4 5 15 11 3 8 16 5 3 2
10.5% 25.5% 4.1% 5.4% 11.4% 9.4% 2.3% 10.2% 31.5% 26.9% 9.0% 12.1% JK
None 66 9 23 34 33 34 50 13 3 4 7 3 25.9% 13.2% 25.2% 35.9% 24.1% 27.9% 39.1% 16.4% 6.8% 22.6% 23.9% 25.9%

160
Q40. Small Business Health Options Programs... . Starting in 2014, there will be state-run exchanges called SHOPs where small businesses may purchase health coverage for their employees. Here are some additional facts:[see questionnaire for details]…. How likely is your company to 'begin offering health benefits and obtain'/ 'continue offering health benefits by obtaining' employee coverage through a SHOP? ______________________________________________________________________________ Proportions/Means: Columns Tested (10% risk level) - A/B/C - D/E - F/G/H - I/J/K * small base; ** very small base (under 30) ineligible for sig testing
Company Size Decision Maker Awareness Occupation
Total 2 to 49 50 to 499 500 + Primary Decision Maker
Influencer Low Medium High Manufacturing
Retail trade Finance/Insurance
A B C D E F G H I J K
Base: U.S. Based Employees - Fewer Than 99
518 336 182 0 253 265 312 152 54 108 147 66
Weighted 698 508 190* -** 354* 344* 442 206* 49** 21 69 15*
Definitely would 90 63 27 0 62 28 30 37 23 2 10 1 12.9% 12.3% 14.4% - 17.6% 8.0% 6.8% 17.9% 46.0% 9.3% 15.0% 7.6% E F
Probably would 221 165 55 0 109 112 135 73 13 7 22 3 31.6% 32.5% 29.1% - 30.8% 32.5% 30.5% 35.6% 25.4% 35.2% 32.7% 22.7% K
May or may not 309 209 100 0 150 159 217 86 6 10 28 8 44.3% 41.1% 52.7% - 42.4% 46.2% 49.1% 41.6% 12.3% 49.1% 40.8% 56.1% J
Probably would not 46 40 6 0 9 37 37 8 1 1 5 1 6.6% 7.9% 3.2% - 2.6% 10.8% 8.3% 4.1% 1.9% 3.7% 7.5% 4.5% D
Definitely would not 32 31 1 0 23 9 23 2 7 1 3 1 4.6% 6.1% 0.6% - 6.6% 2.5% 5.2% 0.9% 14.4% 2.8% 4.1% 9.1% I
Summary
Top2Box (Definitely/ Probably would) 311 228 83 0 171 139 165 110 35 9 33 4 44.5% 44.9% 43.5% - 48.4% 40.5% 37.3% 53.5% 71.4% 44.4% 47.6% 30.3% F K K
Low2Box (Definitely/ Probably would not) 78 71 7 0 32 46 60 10 8 1 8 2 11.2% 14.0% 3.8% - 9.2% 13.3% 13.6% 4.9% 16.3% 6.5% 11.6% 13.6% B

161
Q41a. Individual health insurance exchanges. Starting in 2014, there will be state-run exchanges for individuals to more readily purchase medical insurance on their own. Here are some additional facts:[see questionnaire for details]… Given this information, how likely do you think your company would be to discontinue employee health coverage? ______________________________________________________________________________ Proportions/Means: Columns Tested (10% risk level) - A/B/C - D/E - F/G/H - I/J/K * small base; ** very small base (under 30) ineligible for sig testing
Company Size Decision Maker Awareness Occupation
Total 2 to 49 50 to 499 500 + Primary Decision Maker
Influencer Low Medium High Manufacturing
Retail trade Finance/Insurance
A B C D E F G H I J K
Base: U.S. Based Employees - Fewer Than 49 And With Medical Plan(s)
249 249 0 0 119 130 149 72 28 53 58 33
Weighted 370* 370* -** -** 189* 181* 227* 102** 41** 10* 27* 7*
Definitely would 34 34 0 0 21 14 10 8 16 1 2 1 9.2% 9.2% - - 10.8% 7.5% 4.5% 7.4% 40.1% 5.7% 8.6% 12.1%
Probably would 101 101 0 0 43 58 58 32 11 3 4 2 27.4% 27.4% - - 22.8% 32.1% 25.4% 31.5% 28.2% 30.2% 15.5% 21.2% J
May or may not 165 165 0 0 90 75 120 37 7 4 14 3 44.5% 44.5% - - 47.4% 41.5% 53.0% 36.5% 17.3% 43.4% 53.4% 39.4%
Probably would not 37 37 0 0 17 20 17 15 6 2 5 1 10.0% 10.0% - - 9.1% 11.0% 7.4% 14.4% 13.8% 15.1% 17.2% 18.2%
Definitely would not 33 33 0 0 19 14 22 11 0 1 1 1 8.9% 8.9% - - 9.8% 7.9% 9.7% 10.3% 0.6% 5.7% 5.2% 9.1%
Summary
Top2Box (Definitely/ Probably would) 135 135 0 0 64 72 68 40 28 4 7 2 36.6% 36.6% - - 33.6% 39.7% 29.9% 38.9% 68.3% 35.8% 24.1% 33.3%
Low2Box (Definitely/ Probably would not) 70 70 0 0 36 34 39 25 6 2 6 2 18.9% 18.9% - - 19.0% 18.8% 17.1% 24.6% 14.4% 20.8% 22.4% 27.3%
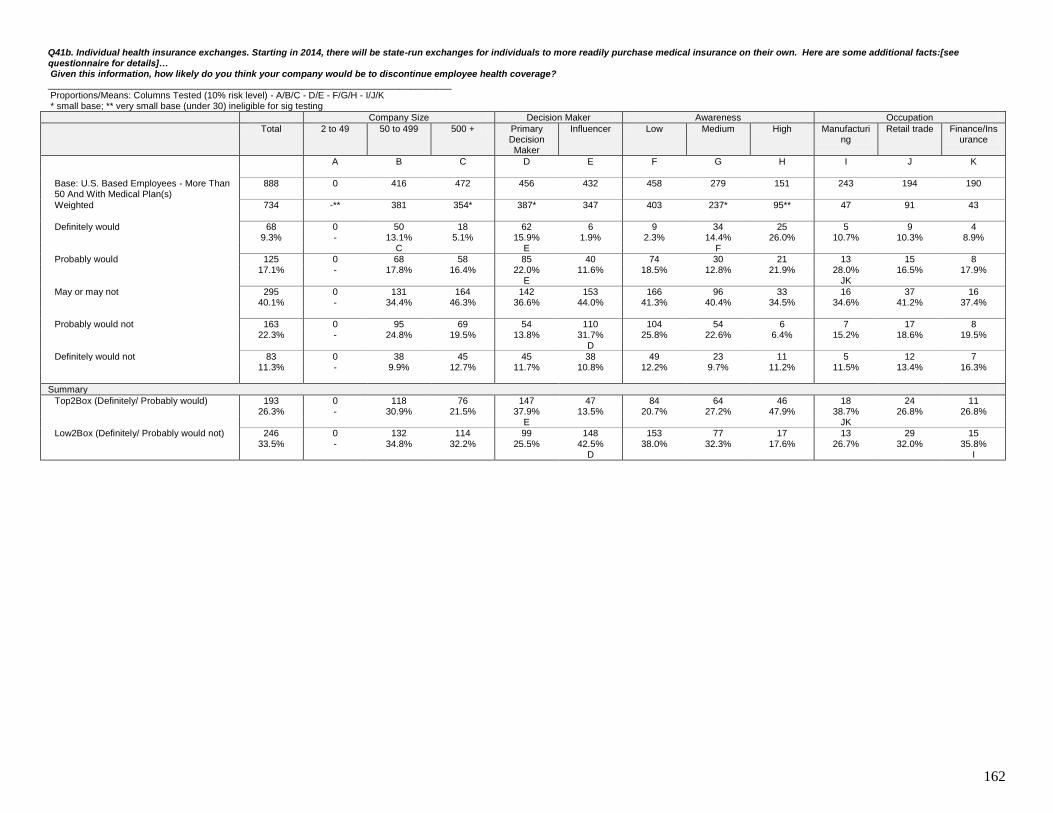
162
Q41b. Individual health insurance exchanges. Starting in 2014, there will be state-run exchanges for individuals to more readily purchase medical insurance on their own. Here are some additional facts:[see questionnaire for details]… Given this information, how likely do you think your company would be to discontinue employee health coverage? ______________________________________________________________________________ Proportions/Means: Columns Tested (10% risk level) - A/B/C - D/E - F/G/H - I/J/K * small base; ** very small base (under 30) ineligible for sig testing
Company Size Decision Maker Awareness Occupation
Total 2 to 49 50 to 499 500 + Primary Decision Maker
Influencer Low Medium High Manufacturing
Retail trade Finance/Insurance
A B C D E F G H I J K
Base: U.S. Based Employees - More Than 50 And With Medical Plan(s)
888 0 416 472 456 432 458 279 151 243 194 190
Weighted 734 -** 381 354* 387* 347 403 237* 95** 47 91 43
Definitely would 68 0 50 18 62 6 9 34 25 5 9 4 9.3% - 13.1% 5.1% 15.9% 1.9% 2.3% 14.4% 26.0% 10.7% 10.3% 8.9% C E F
Probably would 125 0 68 58 85 40 74 30 21 13 15 8 17.1% - 17.8% 16.4% 22.0% 11.6% 18.5% 12.8% 21.9% 28.0% 16.5% 17.9% E JK
May or may not 295 0 131 164 142 153 166 96 33 16 37 16 40.1% - 34.4% 46.3% 36.6% 44.0% 41.3% 40.4% 34.5% 34.6% 41.2% 37.4%
Probably would not 163 0 95 69 54 110 104 54 6 7 17 8 22.3% - 24.8% 19.5% 13.8% 31.7% 25.8% 22.6% 6.4% 15.2% 18.6% 19.5% D
Definitely would not 83 0 38 45 45 38 49 23 11 5 12 7 11.3% - 9.9% 12.7% 11.7% 10.8% 12.2% 9.7% 11.2% 11.5% 13.4% 16.3%
Summary
Top2Box (Definitely/ Probably would) 193 0 118 76 147 47 84 64 46 18 24 11 26.3% - 30.9% 21.5% 37.9% 13.5% 20.7% 27.2% 47.9% 38.7% 26.8% 26.8% E JK
Low2Box (Definitely/ Probably would not) 246 0 132 114 99 148 153 77 17 13 29 15 33.5% - 34.8% 32.2% 25.5% 42.5% 38.0% 32.3% 17.6% 26.7% 32.0% 35.8% D I

163
Q41ab.[tables 41a and 41b combined] Individual health insurance exchanges. Starting in 2014, there will be state-run exchanges for individuals to more readily purchase medical insurance on their own. Here are some additional facts: [see questionnaire for details] … Given this information, how likely do you think your company would be to discontinue employee health coverage? ______________________________________________________________________________ Proportions/Means: Columns Tested (10% risk level) - A/B/C - D/E - F/G/H - I/J/K * small base; ** very small base (under 30) ineligible for sig testing
Company Size Decision Maker Awareness Occupation
Total 2 to 49 50 to 499 500 + Primary Decision Maker
Influencer Low Medium High Manufacturing
Retail trade Finance/Insurance
A B C D E F G H I J K
Base: U.S. Based Employees - With Medical Plan(s)
1137 249 416 472 575 562 607 351 179 296 252 223
Weighted 1105 370* 381 354* 577 528 630 339* 136** 58 118 50
Definitely would 102 34 50 18 82 20 19 42 41 6 12 5 9.2% 9.2% 13.1% 5.1% 14.2% 3.8% 3.1% 12.3% 30.2% 9.8% 9.9% 9.4% C E F
Probably would 227 101 68 58 128 98 132 63 32 16 19 9 20.5% 27.4% 17.8% 16.4% 22.3% 18.6% 20.9% 18.5% 23.8% 28.4% 16.3% 18.4% C JK
May or may not 459 165 131 164 232 228 287 133 40 21 52 19 41.6% 44.5% 34.4% 46.3% 40.2% 43.1% 45.5% 39.2% 29.4% 36.1% 44.0% 37.7% I
Probably would not 201 37 95 69 71 130 121 68 12 9 21 10 18.2% 10.0% 24.8% 19.5% 12.3% 24.6% 19.2% 20.1% 8.6% 15.2% 18.3% 19.3% A A D
Definitely would not 116 33 38 45 64 52 71 34 11 6 14 8 10.5% 8.9% 9.9% 12.7% 11.1% 9.8% 11.3% 9.9% 8.0% 10.5% 11.5% 15.2%
Summary
Top2Box (Definitely/ Probably would) 329 135 118 76 210 118 151 104 73 22 31 14 29.8% 36.6% 30.9% 21.5% 36.5% 22.4% 24.0% 30.7% 54.0% 38.2% 26.2% 27.8% C E JK
Low2Box (Definitely/ Probably would not) 316 70 132 114 135 182 192 102 23 15 35 17 28.6% 18.9% 34.8% 32.2% 23.3% 34.4% 30.5% 30.0% 16.7% 25.7% 29.8% 34.5% A A D I

164
Q41c. Have you previously calculated how many of your employees would benefit economically if your company were to discontinue offering health insurance? ______________________________________________________________________________ Proportions/Means: Columns Tested (10% risk level) - A/B/C - D/E - F/G/H - I/J/K * small base; ** very small base (under 30) ineligible for sig testing
Company Size Decision Maker Awareness Occupation
Total 2 to 49 50 to 499 500 + Primary Decision Maker
Influencer Low Medium High Manufacturing
Retail trade Finance/Insurance
A B C D E F G H I J K
Base: Respondents With Medical Plan(s) 1137 249 416 472 575 562 607 351 179 296 252 223
Weighted 1105 370* 381 354* 577 528 630 339* 136** 58 118 50
Yes 242 77 89 76 170 72 55 112 75 18 25 9 21.9% 20.9% 23.3% 21.4% 29.5% 13.6% 8.7% 33.1% 55.1% 30.7% 21.0% 17.9% E F JK
No 592 219 218 155 292 300 362 171 59 32 63 28 53.6% 59.1% 57.3% 44.0% 50.7% 56.8% 57.5% 50.4% 43.8% 55.1% 53.2% 56.5% C C
I don't know 270 74 74 122 114 156 213 56 2 8 30 13 24.5% 20.1% 19.4% 34.6% 19.8% 29.5% 33.8% 16.5% 1.1% 14.2% 25.8% 25.6% AB D G I I

165
Q41d. If you discontinue health coverage for your employees, how likely is your company to make up for this by increasing other forms of compensation for your employees-particularly for employees who would wind up paying more for health insurance on the exchange than they currently pay for insurance through your company today? ______________________________________________________________________________ Proportions/Means: Columns Tested (10% risk level) - A/B/C - D/E - F/G/H - I/J/K * small base; ** very small base (under 30) ineligible for sig testing
Company Size Decision Maker Awareness Occupation
Total 2 to 49 50 to 499 500 + Primary Decision Maker
Influencer Low Medium High Manufacturing
Retail trade Finance/Insurance
A B C D E F G H I J K
Base: Discontinue With Health Coverage 779 196 273 310 430 349 397 240 142 220 177 146
Weighted 788 300* 249* 240* 442* 346 438 237* 113** 43 83 33
Definitely would 103 31 46 26 72 31 15 56 32 6 9 5 13.1% 10.3% 18.4% 11.0% 16.2% 9.1% 3.4% 23.6% 28.4% 14.5% 11.3% 15.8% F
Probably would 249 106 72 71 165 84 143 68 38 19 26 9 31.6% 35.3% 29.1% 29.5% 37.4% 24.3% 32.8% 28.5% 33.8% 43.6% 31.1% 27.4% E JK
May or may not 341 114 106 120 179 161 215 85 40 15 41 15 43.2% 38.1% 42.6% 50.3% 40.5% 46.6% 49.1% 35.9% 35.7% 34.5% 49.2% 45.9% I I
Probably would not 77 41 15 20 19 58 53 22 1 2 5 2 9.7% 13.7% 6.2% 8.3% 4.2% 16.8% 12.1% 9.3% 1.2% 4.5% 6.2% 7.5% D
Definitely would not 19 8 9 2 7 11 11 6 1 1 2 1 2.4% 2.5% 3.7% 0.9% 1.7% 3.3% 2.6% 2.7% 1.0% 2.7% 2.3% 3.4%
Summary
Top2Box (Definitely/ Probably would) 352 137 118 97 237 115 158 124 70 25 35 14 44.7% 45.6% 47.6% 40.5% 53.6% 33.3% 36.1% 52.1% 62.2% 58.2% 42.4% 43.2% E F JK
Low2Box (Definitely/ Probably would not) 95 49 25 22 26 69 65 28 2 3 7 4 12.1% 16.2% 9.9% 9.3% 5.9% 20.1% 14.7% 12.0% 2.1% 7.3% 8.5% 11.0% D
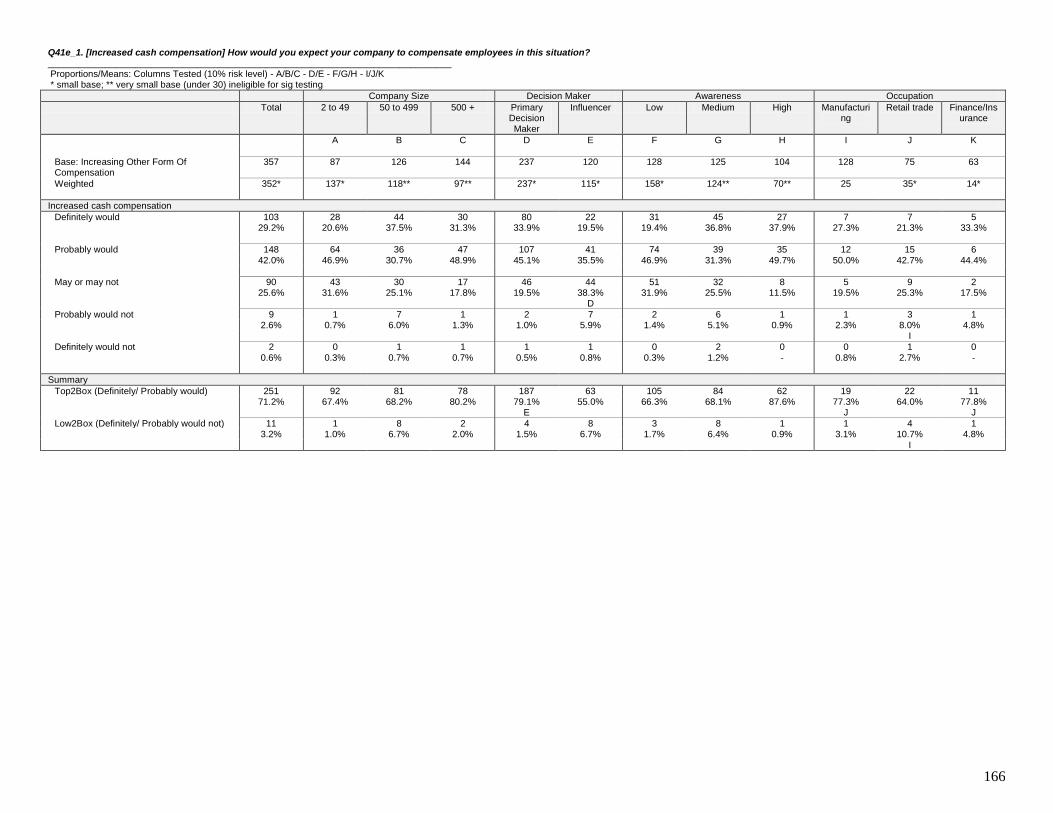
166
Q41e_1. [Increased cash compensation] How would you expect your company to compensate employees in this situation? ______________________________________________________________________________ Proportions/Means: Columns Tested (10% risk level) - A/B/C - D/E - F/G/H - I/J/K * small base; ** very small base (under 30) ineligible for sig testing
Company Size Decision Maker Awareness Occupation
Total 2 to 49 50 to 499 500 + Primary Decision Maker
Influencer Low Medium High Manufacturing
Retail trade Finance/Insurance
A B C D E F G H I J K
Base: Increasing Other Form Of Compensation
357 87 126 144 237 120 128 125 104 128 75 63
Weighted 352* 137* 118** 97** 237* 115* 158* 124** 70** 25 35* 14*
Increased cash compensation
Definitely would 103 28 44 30 80 22 31 45 27 7 7 5 29.2% 20.6% 37.5% 31.3% 33.9% 19.5% 19.4% 36.8% 37.9% 27.3% 21.3% 33.3%
Probably would 148 64 36 47 107 41 74 39 35 12 15 6 42.0% 46.9% 30.7% 48.9% 45.1% 35.5% 46.9% 31.3% 49.7% 50.0% 42.7% 44.4%
May or may not 90 43 30 17 46 44 51 32 8 5 9 2 25.6% 31.6% 25.1% 17.8% 19.5% 38.3% 31.9% 25.5% 11.5% 19.5% 25.3% 17.5% D
Probably would not 9 1 7 1 2 7 2 6 1 1 3 1 2.6% 0.7% 6.0% 1.3% 1.0% 5.9% 1.4% 5.1% 0.9% 2.3% 8.0% 4.8% I
Definitely would not 2 0 1 1 1 1 0 2 0 0 1 0 0.6% 0.3% 0.7% 0.7% 0.5% 0.8% 0.3% 1.2% - 0.8% 2.7% -
Summary
Top2Box (Definitely/ Probably would) 251 92 81 78 187 63 105 84 62 19 22 11 71.2% 67.4% 68.2% 80.2% 79.1% 55.0% 66.3% 68.1% 87.6% 77.3% 64.0% 77.8% E J J
Low2Box (Definitely/ Probably would not) 11 1 8 2 4 8 3 8 1 1 4 1 3.2% 1.0% 6.7% 2.0% 1.5% 6.7% 1.7% 6.4% 0.9% 3.1% 10.7% 4.8%
I

167
Q41e_2. [Increased retirement benefits] How would you expect your company to compensate employees in this situation? ______________________________________________________________________________ Proportions/Means: Columns Tested (10% risk level) - A/B/C - D/E - F/G/H - I/J/K * small base; ** very small base (under 30) ineligible for sig testing
Company Size Decision Maker Awareness Occupation
Total 2 to 49 50 to 499 500 + Primary Decision Maker
Influencer Low Medium High Manufacturing
Retail trade Finance/Insurance
A B C D E F G H I J K
Base: Increasing Other Form Of Compensation
357 87 126 144 237 120 128 125 104 128 75 63
Weighted 352* 137* 118** 97** 237* 115* 158* 124** 70** 25 35* 14*
Increased retirement benefits
Definitely would 72 11 26 35 60 13 18 25 30 6 7 4 20.5% 8.1% 22.4% 35.8% 25.2% 11.0% 11.2% 20.2% 42.0% 25.8% 18.7% 31.7% J
Probably would 130 45 43 43 102 28 63 51 16 9 11 5 37.0% 32.5% 36.3% 44.2% 43.1% 24.6% 39.9% 41.5% 22.6% 35.2% 32.0% 36.5%
May or may not 69 29 25 15 43 26 35 23 11 7 13 2 19.7% 21.0% 21.5% 15.7% 18.2% 22.8% 21.9% 19.0% 16.0% 26.6% 36.0% 15.9% K K
Probably would not 45 23 18 4 19 26 25 12 8 2 2 2 12.8% 16.8% 15.6% 3.9% 8.0% 22.7% 15.6% 9.8% 11.7% 8.6% 6.7% 11.1% D
Definitely would not 35 29 5 0 13 22 18 12 5 1 2 1 9.9% 21.5% 4.3% 0.5% 5.5% 19.0% 11.4% 9.4% 7.6% 3.9% 6.7% 4.8% D
Summary
Top2Box (Definitely/ Probably would) 203 56 69 78 162 41 81 76 45 15 18 10 57.6% 40.7% 58.7% 80.0% 68.2% 35.6% 51.1% 61.7% 64.6% 60.9% 50.7% 68.3% E J
Low2Box (Definitely/ Probably would not) 80 52 23 4 32 48 43 24 14 3 5 2 22.7% 38.3% 19.8% 4.3% 13.6% 41.6% 27.0% 19.3% 19.4% 12.5% 13.3% 15.9%
D

168
Q41e_3. [Defined contributions] How would you expect your company to compensate employees in this situation? ______________________________________________________________________________ Proportions/Means: Columns Tested (10% risk level) - A/B/C - D/E - F/G/H - I/J/K * small base; ** very small base (under 30) ineligible for sig testing
Company Size Decision Maker Awareness Occupation
Total 2 to 49 50 to 499 500 + Primary Decision Maker
Influencer Low Medium High Manufacturing
Retail trade Finance/Insurance
A B C D E F G H I J K
Base: Increasing Other Form Of Compensation
357 87 126 144 237 120 128 125 104 128 75 63
Weighted 352* 137* 118** 97** 237* 115* 158* 124** 70** 25 35* 14*
Defined contributions
Definitely would 93 26 38 29 68 25 20 43 30 7 8 5 26.3% 18.9% 31.9% 30.0% 28.6% 21.6% 12.5% 35.2% 42.0% 29.7% 22.7% 33.3%
Probably would 131 48 35 49 94 37 62 40 29 11 13 6 37.3% 34.8% 29.2% 50.7% 39.7% 32.3% 39.4% 32.4% 41.2% 42.2% 37.3% 39.7%
May or may not 93 38 37 18 55 37 50 31 12 5 9 3 26.4% 27.8% 31.4% 18.2% 23.4% 32.5% 31.8% 25.0% 16.5% 21.1% 25.3% 23.8%
Probably would not 29 21 7 1 15 14 24 5 0 1 3 0 8.4% 15.5% 6.2% 0.9% 6.4% 12.4% 15.4% 3.9% 0.3% 5.5% 9.3% 1.6% K
Definitely would not 6 4 2 0 4 1 1 4 0 0 2 0 1.7% 3.0% 1.3% 0.2% 1.9% 1.2% 0.9% 3.6% - 1.6% 5.3% 1.6%
Summary
Top2Box (Definitely/ Probably would) 224 74 72 78 162 62 82 83 59 18 21 10 63.6% 53.7% 61.1% 80.8% 68.4% 53.9% 51.9% 67.5% 83.2% 71.9% 60.0% 73.0% J
Low2Box (Definitely/ Probably would not) 35 25 9 1 20 16 26 9 0 2 5 0 10.0% 18.5% 7.5% 1.1% 8.3% 13.6% 16.3% 7.5% 0.3% 7.0% 14.7% 3.2%
K

169
Q41e_4. [Increased PTO] How would you expect your company to compensate employees in this situation? ______________________________________________________________________________ Proportions/Means: Columns Tested (10% risk level) - A/B/C - D/E - F/G/H - I/J/K * small base; ** very small base (under 30) ineligible for sig testing
Company Size Decision Maker Awareness Occupation
Total 2 to 49 50 to 499 500 + Primary Decision Maker
Influencer Low Medium High Manufacturing
Retail trade Finance/Insurance
A B C D E F G H I J K
Base: Increasing Other Form Of Compensation
357 87 126 144 237 120 128 125 104 128 75 63
Weighted 352* 137* 118** 97** 237* 115* 158* 124** 70** 25 35* 14*
Increased PTO
Definitely would 91 16 51 24 81 11 12 41 39 6 6 5 25.9% 11.5% 43.4% 25.0% 34.1% 9.2% 7.5% 32.9% 55.2% 24.2% 17.3% 33.3% E J
Probably would 107 39 21 48 80 27 73 15 19 11 14 4 30.5% 28.1% 17.9% 49.1% 33.7% 23.8% 46.2% 12.3% 26.9% 43.0% 38.7% 31.7%
May or may not 87 36 33 17 45 42 29 52 6 6 8 3 24.6% 26.3% 28.2% 17.7% 18.8% 36.4% 18.2% 42.0% 8.5% 22.7% 22.7% 20.6% D
Probably would not 49 38 7 4 19 31 36 11 2 2 5 2 14.0% 28.0% 6.1% 4.0% 7.9% 26.7% 22.5% 9.3% 3.2% 7.0% 13.3% 12.7% D
Definitely would not 18 8 5 4 13 5 9 4 4 1 3 0 5.0% 6.1% 4.3% 4.2% 5.5% 3.9% 5.6% 3.5% 6.2% 3.1% 8.0% 1.6%
Summary
Top2Box (Definitely/ Probably would) 199 54 72 72 161 38 85 56 58 17 20 9 56.4% 39.6% 61.3% 74.1% 67.8% 33.0% 53.7% 45.2% 82.1% 67.2% 56.0% 65.1% E
Low2Box (Definitely/ Probably would not) 67 47 12 8 32 35 45 16 7 3 7 2 19.0% 34.1% 10.4% 8.2% 13.4% 30.6% 28.1% 12.8% 9.4% 10.2% 21.3% 14.3%
D I

170
Q41e_5. [Support in selecting the right plan] How would you expect your company to compensate employees in this situation? ______________________________________________________________________________ Proportions/Means: Columns Tested (10% risk level) - A/B/C - D/E - F/G/H - I/J/K * small base; ** very small base (under 30) ineligible for sig testing
Company Size Decision Maker Awareness Occupation
Total 2 to 49 50 to 499 500 + Primary Decision Maker
Influencer Low Medium High Manufacturing
Retail trade Finance/Insurance
A B C D E F G H I J K
Base: Increasing Other Form Of Compensation
357 87 126 144 237 120 128 125 104 128 75 63
Weighted 352* 137* 118** 97** 237* 115* 158* 124** 70** 25 35* 14*
Support in selecting the right plan
Definitely would 129 50 49 31 100 29 35 56 39 7 11 5 36.6% 36.2% 41.1% 31.7% 42.0% 25.5% 21.8% 45.2% 54.8% 27.3% 32.0% 33.3%
Probably would 120 41 30 49 80 40 64 36 20 13 13 5 34.1% 29.9% 25.8% 50.1% 33.6% 35.1% 40.5% 29.4% 27.8% 51.6% 37.3% 36.5% JK
May or may not 71 23 30 17 41 30 37 24 10 5 8 4 20.1% 17.1% 25.6% 17.4% 17.3% 25.8% 23.6% 19.1% 13.8% 20.3% 22.7% 28.6%
Probably would not 26 16 8 1 10 15 16 7 2 0 1 0 7.3% 12.0% 7.1% 0.7% 4.4% 13.2% 10.2% 5.6% 3.5% 0.8% 2.7% 1.6%
Definitely would not 7 7 0 0 7 0 6 1 0 0 2 0 2.0% 4.8% 0.4% - 2.8% 0.4% 3.9% 0.8% - - 5.3% - I
Summary
Top2Box (Definitely/ Probably would) 249 91 79 79 179 70 99 92 58 20 24 10 70.7% 66.1% 66.8% 81.9% 75.6% 60.6% 62.3% 74.6% 82.7% 78.9% 69.3% 69.8%
Low2Box (Definitely/ Probably would not) 33 23 9 1 17 16 22 8 2 0 3 0 9.3% 16.8% 7.5% 0.7% 7.2% 13.6% 14.1% 6.4% 3.5% 0.8% 8.0% 1.6%
I

171
Q41f_1. [Provide comparative materials on multiple carriers] The following is a list of ways your company could provide support to help your employees select the right health insurance plan for themselves on the exchange. For each, how likely would your company be to offer it? ______________________________________________________________________________ Proportions/Means: Columns Tested (10% risk level) - A/B/C - D/E - F/G/H - I/J/K * small base; ** very small base (under 30) ineligible for sig testing
Company Size Decision Maker Awareness Occupation
Total 2 to 49 50 to 499 500 + Primary Decision Maker
Influencer Low Medium High Manufacturing
Retail trade Finance/Insurance
A B C D E F G H I J K
Base: Support in selecting the right plan - Definitely would/ Probably would
260 54 89 117 182 78 81 86 93 101 52 44
Weighted 249* 91** 79** 79** 179** 70** 99** 92** 58** 20 24* 10*
Provide comparative materials on multiple carriers
Definitely would 87 22 42 23 79 8 19 36 33 7 7 4 35.1% 24.7% 53.5% 28.6% 44.3% 11.4% 19.3% 38.7% 56.2% 36.6% 26.9% 45.5% J
Probably would 92 30 32 30 50 42 30 47 15 10 12 4 36.9% 32.7% 40.8% 37.8% 28.1% 59.6% 30.6% 50.6% 26.1% 50.5% 48.1% 40.9%
May or may not 49 21 3 26 42 7 39 8 2 2 5 1 19.8% 23.1% 3.6% 32.2% 23.7% 9.9% 39.8% 8.5% 3.9% 10.9% 19.2% 6.8%
Probably would not 9 7 1 1 1 8 7 2 0 0 1 0 3.8% 8.1% 1.4% 1.1% 0.6% 11.7% 7.4% 2.2% - 2.0% 3.8% 4.5%
Definitely would not 11 10 0 0 6 5 3 0 8 0 0 0 4.4% 11.4% 0.6% 0.3% 3.3% 7.3% 3.0% - 13.8% - 1.9% 2.3%
Summary
Top2Box (Definitely/ Probably would) 179 52 75 53 130 50 49 82 48 17 18 9 72.0% 57.4% 94.4% 66.4% 72.4% 71.1% 49.8% 89.3% 82.3% 87.1% 75.0% 86.4% J
Low2Box (Definitely/ Probably would not) 20 18 2 1 7 13 10 2 8 0 1 1
8.2% 19.5% 2.0% 1.4% 3.9% 19.0% 10.3% 2.2% 13.8% 2.0% 5.8% 6.8%
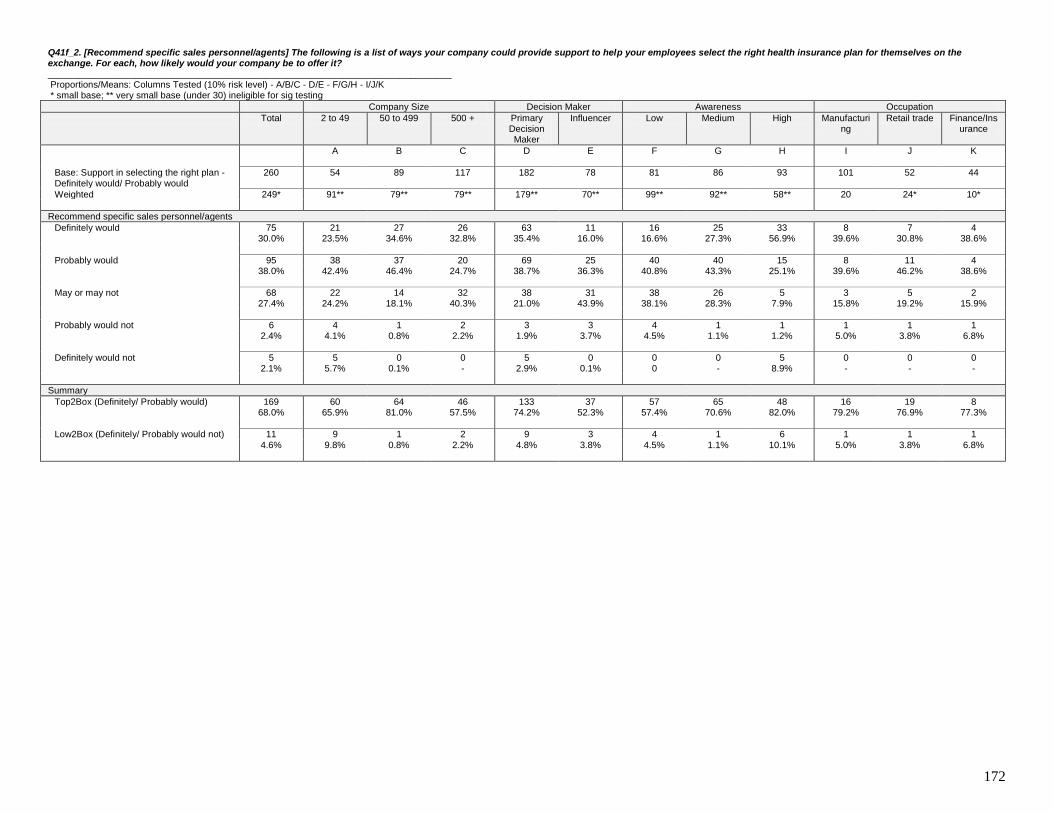
172
Q41f_2. [Recommend specific sales personnel/agents] The following is a list of ways your company could provide support to help your employees select the right health insurance plan for themselves on the exchange. For each, how likely would your company be to offer it? ______________________________________________________________________________ Proportions/Means: Columns Tested (10% risk level) - A/B/C - D/E - F/G/H - I/J/K * small base; ** very small base (under 30) ineligible for sig testing
Company Size Decision Maker Awareness Occupation
Total 2 to 49 50 to 499 500 + Primary Decision Maker
Influencer Low Medium High Manufacturing
Retail trade Finance/Insurance
A B C D E F G H I J K
Base: Support in selecting the right plan - Definitely would/ Probably would
260 54 89 117 182 78 81 86 93 101 52 44
Weighted 249* 91** 79** 79** 179** 70** 99** 92** 58** 20 24* 10*
Recommend specific sales personnel/agents
Definitely would 75 21 27 26 63 11 16 25 33 8 7 4 30.0% 23.5% 34.6% 32.8% 35.4% 16.0% 16.6% 27.3% 56.9% 39.6% 30.8% 38.6%
Probably would 95 38 37 20 69 25 40 40 15 8 11 4 38.0% 42.4% 46.4% 24.7% 38.7% 36.3% 40.8% 43.3% 25.1% 39.6% 46.2% 38.6%
May or may not 68 22 14 32 38 31 38 26 5 3 5 2 27.4% 24.2% 18.1% 40.3% 21.0% 43.9% 38.1% 28.3% 7.9% 15.8% 19.2% 15.9%
Probably would not 6 4 1 2 3 3 4 1 1 1 1 1 2.4% 4.1% 0.8% 2.2% 1.9% 3.7% 4.5% 1.1% 1.2% 5.0% 3.8% 6.8%
Definitely would not 5 5 0 0 5 0 0 0 5 0 0 0 2.1% 5.7% 0.1% - 2.9% 0.1% 0 - 8.9% - - -
Summary
Top2Box (Definitely/ Probably would) 169 60 64 46 133 37 57 65 48 16 19 8 68.0% 65.9% 81.0% 57.5% 74.2% 52.3% 57.4% 70.6% 82.0% 79.2% 76.9% 77.3%
Low2Box (Definitely/ Probably would not) 11 9 1 2 9 3 4 1 6 1 1 1
4.6% 9.8% 0.8% 2.2% 4.8% 3.8% 4.5% 1.1% 10.1% 5.0% 3.8% 6.8%

173
Q41f_3. [Provide seminars and training on the options available] The following is a list of ways your company could provide support to help your employees select the right health insurance plan for themselves on the exchange. For each, how likely would your company be to offer it? ______________________________________________________________________________ Proportions/Means: Columns Tested (10% risk level) - A/B/C - D/E - F/G/H - I/J/K * small base; ** very small base (under 30) ineligible for sig testing
Company Size Decision Maker Awareness Occupation
Total 2 to 49 50 to 499 500 + Primary Decision Maker
Influencer Low Medium High Manufacturing
Retail trade Finance/Insurance
A B C D E F G H I J K
Base: Support in selecting the right plan - Definitely would/ Probably would
260 54 89 117 182 78 81 86 93 101 52 44
Weighted 249* 91** 79** 79** 179** 70** 99** 92** 58** 20 24* 10*
Provide seminars and training on the options available
Definitely would 66 8 28 31 51 16 17 21 28 7 8 4 26.5% 8.5% 35.2% 38.6% 28.2% 22.3% 17.5% 22.3% 48.6% 37.6% 32.7% 45.5%
Probably would 114 50 41 22 91 23 44 52 18 10 10 3 45.6% 55.6% 51.8% 28.2% 50.9% 32.2% 44.5% 56.4% 30.4% 49.5% 40.4% 34.1% K
May or may not 56 21 9 26 34 22 32 15 9 2 5 2 22.6% 23.6% 10.8% 33.2% 19.2% 31.1% 32.1% 16.4% 16.1% 11.9% 21.2% 18.2%
Probably would not 9 8 2 0 3 7 3 3 3 0 1 0 3.8% 8.4% 2.3% 0.1% 1.7% 9.3% 3.2% 3.8% 4.9% 1.0% 5.8% 2.3%
Definitely would not 4 4 0 0 0 4 3 1 0 0 0 0 1.4% 3.9% - - - 5.1% 2.7% 1.0% - - - -
Summary
Top2Box (Definitely/ Probably would) 180 58 69 53 142 38 61 73 46 17 18 8 72.2% 64.1% 86.9% 66.8% 79.1% 54.5% 62.0% 78.8% 79.0% 87.1% 73.1% 79.5% J
Low2Box (Definitely/ Probably would not) 13 11 2 0 3 10 6 4 3 0 1 0
5.2% 12.4% 2.3% 0.1% 1.7% 14.4% 5.9% 4.8% 4.9% 1.0% 5.8% 2.3%

174
Q41f_4. [Provide employees time with an internal benefits consultant] The following is a list of ways your company could provide support to help your employees select the right health insurance plan for themselves on the exchange. For each, how likely would your company be to offer it? ______________________________________________________________________________ Proportions/Means: Columns Tested (10% risk level) - A/B/C - D/E - F/G/H - I/J/K * small base; ** very small base (under 30) ineligible for sig testing
Company Size Decision Maker Awareness Occupation
Total 2 to 49 50 to 499 500 + Primary Decision Maker
Influencer Low Medium High Manufacturing
Retail trade Finance/Insurance
A B C D E F G H I J K
Base: Support in selecting the right plan - Definitely would/ Probably would
260 54 89 117 182 78 81 86 93 101 52 44
Weighted 249* 91** 79** 79** 179** 70** 99** 92** 58** 20 24* 10*
Provide employees time with an internal benefits consultant
Definitely would 90 18 42 30 72 18 19 38 34 8 7 4 36.3% 19.8% 53.7% 38.0% 40.2% 26.4% 19.4% 41.0% 57.8% 39.6% 30.8% 45.5%
Probably would 99 43 32 23 69 30 34 43 22 9 12 4 39.6% 47.9% 41.1% 28.7% 38.3% 43.0% 34.6% 46.2% 37.8% 46.5% 48.1% 38.6%
May or may not 43 14 2 26 35 8 33 8 2 2 4 1 17.3% 15.8% 3.0% 33.3% 19.6% 11.5% 33.6% 8.2% 4.1% 9.9% 15.4% 13.6%
Probably would not 10 9 1 0 3 8 6 4 0 1 0 0 4.2% 10.3% 1.4% 0.1% 1.5% 11.0% 6.2% 4.4% 0.3% 3.0% 1.9% 2.3%
Definitely would not 6 6 1 0 1 6 6 0 0 0 1 0 2.5% 6.2% 0.8% - 0.4% 8.1% 6.2% 0.2% - 1.0% 3.8% -
Summary
Top2Box (Definitely/ Probably would) 189 61 75 53 141 49 53 80 56 17 19 8 76.0% 67.6% 94.8% 66.7% 78.5% 69.4% 53.9% 87.1% 95.6% 86.1% 78.8% 84.1%
Low2Box (Definitely/ Probably would not) 17 15 2 0 3 13 12 4 0 1 1 0
6.7% 16.5% 2.2% 0.1% 1.9% 19.1% 12.4% 4.7% 0.3% 4.0% 5.8% 2.3%

175
Q41f_5. [Provide employees time with an external benefits consultant affiliated with a specific health insurer] The following is a list of ways your company could provide support to help your employees select the right health insurance plan for themselves on the exchange. For each, how likely would your company be to offer it? ______________________________________________________________________________ Proportions/Means: Columns Tested (10% risk level) - A/B/C - D/E - F/G/H - I/J/K * small base; ** very small base (under 30) ineligible for sig testing
Company Size Decision Maker Awareness Occupation
Total 2 to 49 50 to 499 500 + Primary Decision Maker
Influencer Low Medium High Manufacturing
Retail trade Finance/Insurance
A B C D E F G H I J K
Base: Support in selecting the right plan - Definitely would/ Probably would
260 54 89 117 182 78 81 86 93 101 52 44
Weighted 249* 91** 79** 79** 179** 70** 99** 92** 58** 20 24* 10*
Provide employees time with an external benefits consultant affiliated with a specific health insurer
Definitely would 112 31 51 30 94 18 26 49 38 7 6 4 45.1% 34.3% 64.8% 38.0% 52.8% 25.6% 25.9% 53.1% 65.2% 34.7% 25.0% 45.5% J
Probably would 91 43 20 27 49 41 50 31 9 9 11 4 36.4% 48.0% 25.5% 33.9% 27.5% 59.0% 51.2% 33.6% 15.5% 45.5% 46.2% 40.9%
May or may not 36 8 6 22 27 9 22 8 6 3 6 1 14.5% 8.6% 7.8% 27.9% 15.0% 13.2% 22.3% 9.2% 9.7% 15.8% 25.0% 6.8% K
Probably would not 2 1 1 0 1 2 1 1 0 1 1 0 0.9% 0.7% 1.7% 0.2% 0.4% 2.1% 0.7% 1.2% 0.7% 4.0% 3.8% 4.5%
Definitely would not 8 8 0 0 8 0 0 3 5 0 0 0 3.2% 8.4% 0.3% - 4.4% - - 2.9% 8.9% - - 2.3%
Summary
Top2Box (Definitely/ Probably would) 203 74 71 57 144 59 76 80 47 16 17 9 81.5% 82.3% 90.3% 71.8% 80.3% 84.6% 77.1% 86.7% 80.7% 80.2% 71.2% 86.4% J
Low2Box (Definitely/ Probably would not) 10 8 2 0 9 2 1 4 6 1 1 1
4.0% 9.2% 1.9% 0.2% 4.8% 2.1% 0.7% 4.1% 9.6% 4.0% 3.8% 6.8%
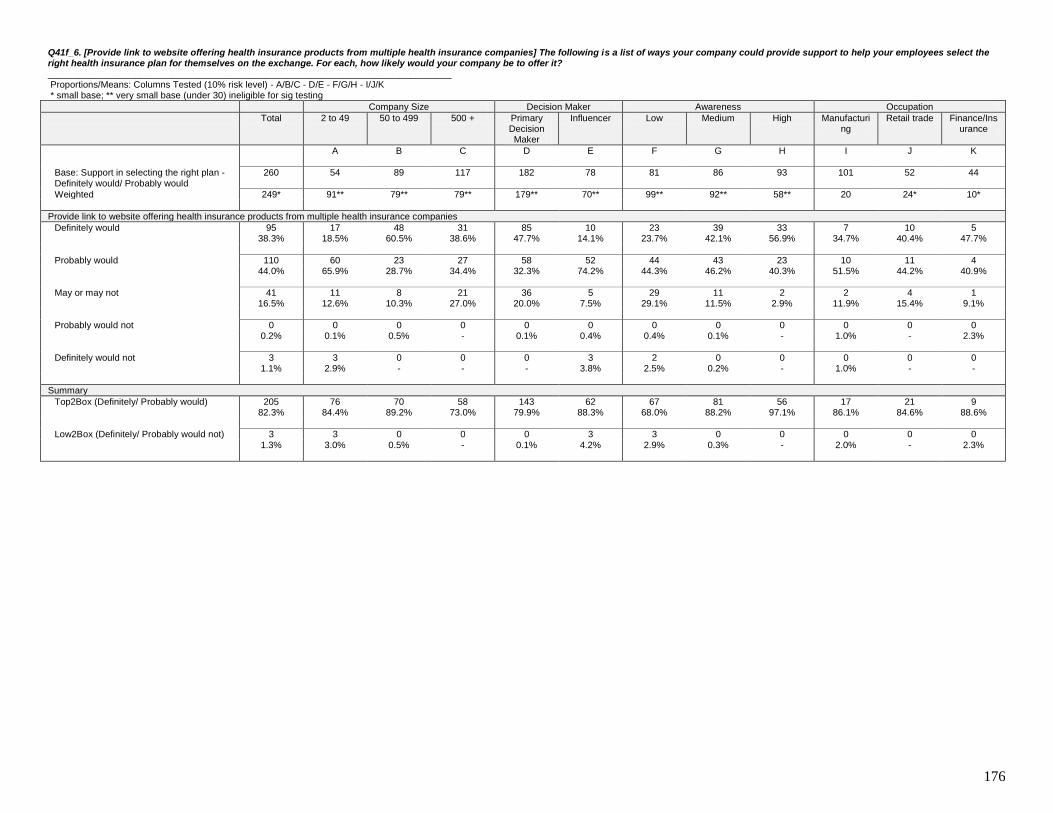
176
Q41f_6. [Provide link to website offering health insurance products from multiple health insurance companies] The following is a list of ways your company could provide support to help your employees select the right health insurance plan for themselves on the exchange. For each, how likely would your company be to offer it? ______________________________________________________________________________ Proportions/Means: Columns Tested (10% risk level) - A/B/C - D/E - F/G/H - I/J/K * small base; ** very small base (under 30) ineligible for sig testing
Company Size Decision Maker Awareness Occupation
Total 2 to 49 50 to 499 500 + Primary Decision Maker
Influencer Low Medium High Manufacturing
Retail trade Finance/Insurance
A B C D E F G H I J K
Base: Support in selecting the right plan - Definitely would/ Probably would
260 54 89 117 182 78 81 86 93 101 52 44
Weighted 249* 91** 79** 79** 179** 70** 99** 92** 58** 20 24* 10*
Provide link to website offering health insurance products from multiple health insurance companies
Definitely would 95 17 48 31 85 10 23 39 33 7 10 5 38.3% 18.5% 60.5% 38.6% 47.7% 14.1% 23.7% 42.1% 56.9% 34.7% 40.4% 47.7%
Probably would 110 60 23 27 58 52 44 43 23 10 11 4 44.0% 65.9% 28.7% 34.4% 32.3% 74.2% 44.3% 46.2% 40.3% 51.5% 44.2% 40.9%
May or may not 41 11 8 21 36 5 29 11 2 2 4 1 16.5% 12.6% 10.3% 27.0% 20.0% 7.5% 29.1% 11.5% 2.9% 11.9% 15.4% 9.1%
Probably would not 0 0 0 0 0 0 0 0 0 0 0 0 0.2% 0.1% 0.5% - 0.1% 0.4% 0.4% 0.1% - 1.0% - 2.3%
Definitely would not 3 3 0 0 0 3 2 0 0 0 0 0 1.1% 2.9% - - - 3.8% 2.5% 0.2% - 1.0% - -
Summary
Top2Box (Definitely/ Probably would) 205 76 70 58 143 62 67 81 56 17 21 9 82.3% 84.4% 89.2% 73.0% 79.9% 88.3% 68.0% 88.2% 97.1% 86.1% 84.6% 88.6%
Low2Box (Definitely/ Probably would not) 3 3 0 0 0 3 3 0 0 0 0 0
1.3% 3.0% 0.5% - 0.1% 4.2% 2.9% 0.3% - 2.0% - 2.3%

177
Q41f_7. [Provide employees time with a financial consultant] The following is a list of ways your company could provide support to help your employees select the right health insurance plan for themselves on the exchange. For each, how likely would your company be to offer it? ______________________________________________________________________________ Proportions/Means: Columns Tested (10% risk level) - A/B/C - D/E - F/G/H - I/J/K * small base; ** very small base (under 30) ineligible for sig testing
Company Size Decision Maker Awareness Occupation
Total 2 to 49 50 to 499 500 + Primary Decision Maker
Influencer Low Medium High Manufacturing
Retail trade Finance/Insurance
A B C D E F G H I J K
Base: Support in selecting the right plan - Definitely would/ Probably would
260 54 89 117 182 78 81 86 93 101 52 44
Weighted 249* 91** 79** 79** 179** 70** 99** 92** 58** 20 24* 10*
Provide employees time with a financial consultant
Definitely would 82 13 40 29 67 15 16 45 21 5 7 4 32.9% 14.7% 50.5% 36.1% 37.5% 20.9% 15.7% 48.9% 36.6% 27.7% 30.8% 36.4%
Probably would 77 35 17 25 50 27 32 21 24 9 8 3 31.1% 39.2% 21.1% 31.9% 28.2% 38.7% 32.6% 23.0% 41.4% 43.6% 34.6% 34.1%
May or may not 72 28 20 24 57 15 40 22 9 4 7 2 28.8% 31.1% 25.3% 29.7% 31.7% 21.5% 40.7% 24.2% 16.0% 22.8% 28.8% 20.5%
Probably would not 12 9 2 2 2 10 8 1 4 1 1 1 5.0% 9.4% 2.5% 2.3% 1.1% 14.8% 8.0% 1.0% 6.0% 5.0% 5.8% 6.8%
Definitely would not 6 5 0 0 3 3 3 3 0 0 0 0 2.2% 5.6% 0.5% - 1.5% 4.1% 2.9% 2.9% - 1.0% - 2.3%
Summary
Top2Box (Definitely/ Probably would) 159 49 57 54 118 42 48 66 45 14 16 7 64.0% 53.8% 71.6% 68.0% 65.7% 59.6% 48.4% 71.9% 78.0% 71.3% 65.4% 70.5%
Low2Box (Definitely/ Probably would not) 18 14 2 2 5 13 11 4 4 1 1 1
7.2% 15.1% 3.0% 2.3% 2.6% 18.9% 10.9% 3.9% 6.0% 5.9% 5.8% 9.1%
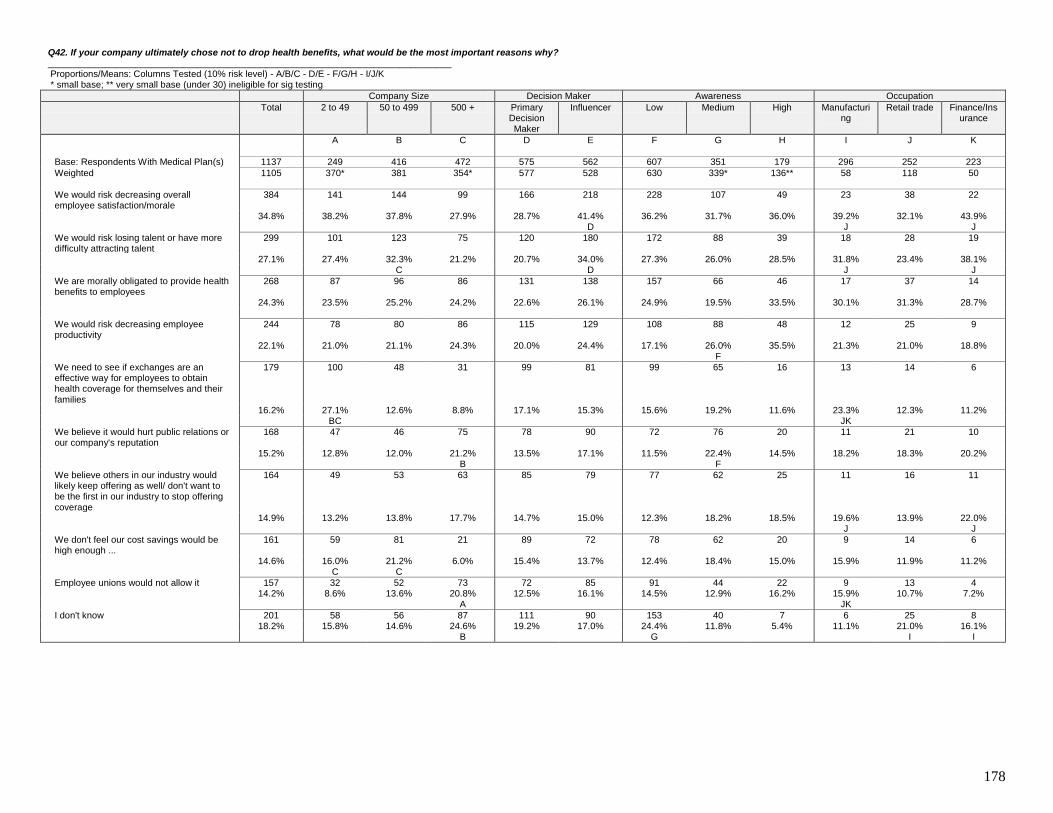
178
Q42. If your company ultimately chose not to drop health benefits, what would be the most important reasons why? ______________________________________________________________________________ Proportions/Means: Columns Tested (10% risk level) - A/B/C - D/E - F/G/H - I/J/K * small base; ** very small base (under 30) ineligible for sig testing
Company Size Decision Maker Awareness Occupation
Total 2 to 49 50 to 499 500 + Primary Decision Maker
Influencer Low Medium High Manufacturing
Retail trade Finance/Insurance
A B C D E F G H I J K
Base: Respondents With Medical Plan(s) 1137 249 416 472 575 562 607 351 179 296 252 223
Weighted 1105 370* 381 354* 577 528 630 339* 136** 58 118 50
We would risk decreasing overall employee satisfaction/morale
384 141 144 99 166 218 228 107 49 23 38 22
34.8% 38.2% 37.8% 27.9% 28.7% 41.4% 36.2% 31.7% 36.0% 39.2% 32.1% 43.9% D J J
We would risk losing talent or have more difficulty attracting talent
299 101 123 75 120 180 172 88 39 18 28 19
27.1% 27.4% 32.3% 21.2% 20.7% 34.0% 27.3% 26.0% 28.5% 31.8% 23.4% 38.1% C D J J
We are morally obligated to provide health benefits to employees
268 87 96 86 131 138 157 66 46 17 37 14
24.3% 23.5% 25.2% 24.2% 22.6% 26.1% 24.9% 19.5% 33.5% 30.1% 31.3% 28.7%
We would risk decreasing employee productivity
244 78 80 86 115 129 108 88 48 12 25 9
22.1% 21.0% 21.1% 24.3% 20.0% 24.4% 17.1% 26.0% 35.5% 21.3% 21.0% 18.8% F
We need to see if exchanges are an effective way for employees to obtain health coverage for themselves and their families
179 100 48 31 99 81 99 65 16 13 14 6
16.2% 27.1% 12.6% 8.8% 17.1% 15.3% 15.6% 19.2% 11.6% 23.3% 12.3% 11.2% BC JK
We believe it would hurt public relations or our company's reputation
168 47 46 75 78 90 72 76 20 11 21 10
15.2% 12.8% 12.0% 21.2% 13.5% 17.1% 11.5% 22.4% 14.5% 18.2% 18.3% 20.2% B F
We believe others in our industry would likely keep offering as well/ don't want to be the first in our industry to stop offering coverage
164 49 53 63 85 79 77 62 25 11 16 11
14.9% 13.2% 13.8% 17.7% 14.7% 15.0% 12.3% 18.2% 18.5% 19.6% 13.9% 22.0% J J
We don't feel our cost savings would be high enough ...
161 59 81 21 89 72 78 62 20 9 14 6
14.6% 16.0% 21.2% 6.0% 15.4% 13.7% 12.4% 18.4% 15.0% 15.9% 11.9% 11.2% C C
Employee unions would not allow it 157 32 52 73 72 85 91 44 22 9 13 4 14.2% 8.6% 13.6% 20.8% 12.5% 16.1% 14.5% 12.9% 16.2% 15.9% 10.7% 7.2% A JK
I don't know 201 58 56 87 111 90 153 40 7 6 25 8 18.2% 15.8% 14.6% 24.6% 19.2% 17.0% 24.4% 11.8% 5.4% 11.1% 21.0% 16.1% B G I I
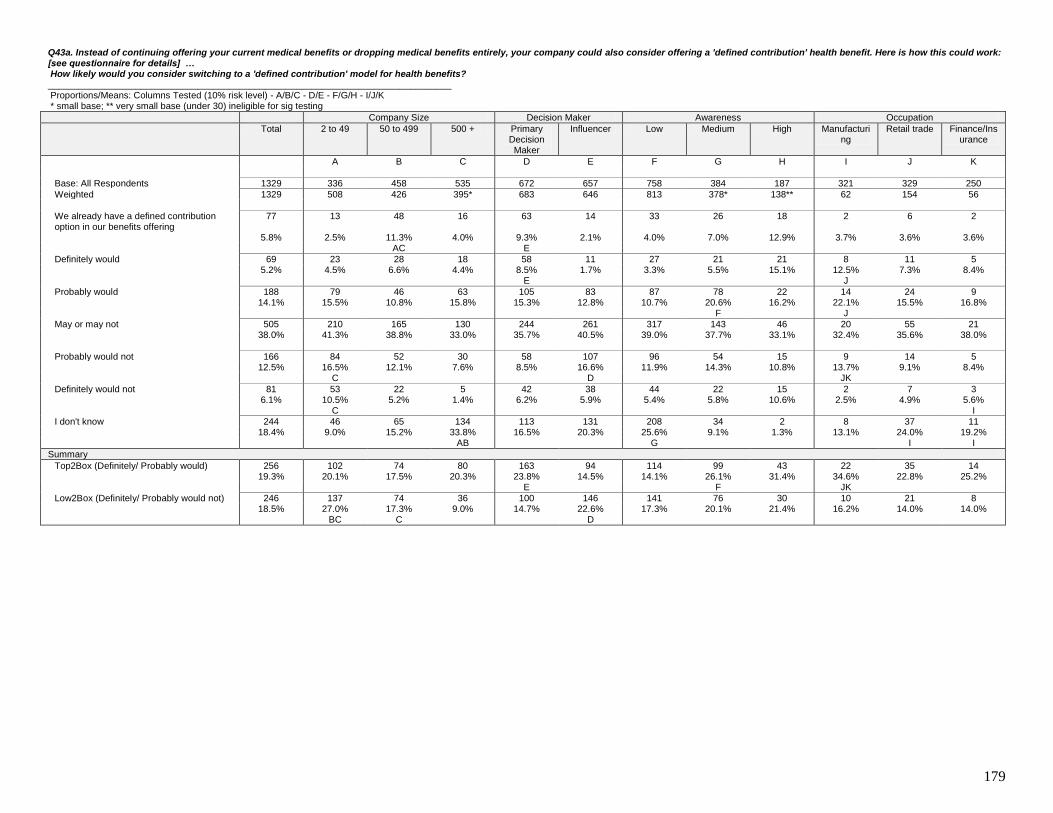
179
Q43a. Instead of continuing offering your current medical benefits or dropping medical benefits entirely, your company could also consider offering a 'defined contribution' health benefit. Here is how this could work: [see questionnaire for details] … How likely would you consider switching to a 'defined contribution' model for health benefits? ______________________________________________________________________________ Proportions/Means: Columns Tested (10% risk level) - A/B/C - D/E - F/G/H - I/J/K * small base; ** very small base (under 30) ineligible for sig testing
Company Size Decision Maker Awareness Occupation
Total 2 to 49 50 to 499 500 + Primary Decision Maker
Influencer Low Medium High Manufacturing
Retail trade Finance/Insurance
A B C D E F G H I J K
Base: All Respondents 1329 336 458 535 672 657 758 384 187 321 329 250
Weighted 1329 508 426 395* 683 646 813 378* 138** 62 154 56
We already have a defined contribution option in our benefits offering
77 13 48 16 63 14 33 26 18 2 6 2
5.8% 2.5% 11.3% 4.0% 9.3% 2.1% 4.0% 7.0% 12.9% 3.7% 3.6% 3.6% AC E
Definitely would 69 23 28 18 58 11 27 21 21 8 11 5 5.2% 4.5% 6.6% 4.4% 8.5% 1.7% 3.3% 5.5% 15.1% 12.5% 7.3% 8.4% E J
Probably would 188 79 46 63 105 83 87 78 22 14 24 9 14.1% 15.5% 10.8% 15.8% 15.3% 12.8% 10.7% 20.6% 16.2% 22.1% 15.5% 16.8% F J
May or may not 505 210 165 130 244 261 317 143 46 20 55 21 38.0% 41.3% 38.8% 33.0% 35.7% 40.5% 39.0% 37.7% 33.1% 32.4% 35.6% 38.0%
Probably would not 166 84 52 30 58 107 96 54 15 9 14 5 12.5% 16.5% 12.1% 7.6% 8.5% 16.6% 11.9% 14.3% 10.8% 13.7% 9.1% 8.4% C D JK
Definitely would not 81 53 22 5 42 38 44 22 15 2 7 3 6.1% 10.5% 5.2% 1.4% 6.2% 5.9% 5.4% 5.8% 10.6% 2.5% 4.9% 5.6% C I
I don't know 244 46 65 134 113 131 208 34 2 8 37 11 18.4% 9.0% 15.2% 33.8% 16.5% 20.3% 25.6% 9.1% 1.3% 13.1% 24.0% 19.2% AB G I I
Summary
Top2Box (Definitely/ Probably would) 256 102 74 80 163 94 114 99 43 22 35 14 19.3% 20.1% 17.5% 20.3% 23.8% 14.5% 14.1% 26.1% 31.4% 34.6% 22.8% 25.2% E F JK
Low2Box (Definitely/ Probably would not) 246 137 74 36 100 146 141 76 30 10 21 8 18.5% 27.0% 17.3% 9.0% 14.7% 22.6% 17.3% 20.1% 21.4% 16.2% 14.0% 14.0% BC C D

180
Q43b. Below are a set of factors you could consider in choosing a defined contribution health benefit solution. Please select the 2 most important factors to your company. ______________________________________________________________________________ Proportions/Means: Columns Tested (10% risk level) - A/B/C - D/E - F/G/H - I/J/K * small base; ** very small base (under 30) ineligible for sig testing
Company Size Decision Maker Awareness Occupation
Total 2 to 49 50 to 499 500 + Primary Decision Maker
Influencer Low Medium High Manufacturing
Retail trade Finance/Insurance
A B C D E F G H I J K
Base: Defined Contribution - Definitely would/ Probably would/ May or may not
800 208 302 290 435 365 387 266 147 215 192 158
Weighted 762 312* 240* 211* 407 355 431 242* 89** 42 90 36
Price of the plans/ choices available 527 210 177 140 245 282 310 162 55 25 61 25 69.2% 67.4% 73.9% 66.5% 60.3% 79.4% 72.0% 67.0% 61.8% 60.0% 67.7% 69.0% D I
Quality of the plans/choices available 412 203 128 80 221 190 216 150 45 28 46 25 54.0% 65.3% 53.6% 37.9% 54.4% 53.6% 50.2% 62.0% 50.9% 66.0% 51.0% 70.3% C C J J
Breadth of plans/choices available 129 56 41 32 68 61 69 37 23 11 17 6 16.9% 17.8% 17.1% 15.3% 16.8% 17.1% 15.9% 15.4% 25.6% 25.1% 18.8% 17.1% K
Solution's overall ease of use for employees
118 44 35 38 69 49 77 33 8 3 12 2
15.5% 14.2% 14.7% 18.2% 17.0% 13.7% 17.9% 13.5% 8.8% 7.4% 13.0% 6.3% IK
Quality and robustness of information/tools to help with decision making
61 24 14 22 36 24 45 13 3 6 10 4
8.0% 7.9% 5.8% 10.6% 9.0% 6.8% 10.5% 5.2% 3.3% 13.5% 11.5% 10.1%
Other factors 3 0 3 0 0 3 0 3 0 0 0 0 0.3% - 1.1% - - 0.7% - 1.1% - - - -

181
Q44_1. [Restructuring your company into two companies] With healthcare reform, some employers may be interested in offering health insurance to their higher-wage employees, but not to lower-wage employees... Here are some additional facts about this option: Healthcare reform prohibits employers from discriminating in favor of higher wage employees in their benefits offering. However, there are other workforce strategies your company could pursue to provide different benefits to your higher vs. lower wage employees.For the next set of questions, assume exchanges are an easy, affordable way for individuals to obtain health insurance. How likely would your company be to consider pursuing each of the following strategies? ______________________________________________________________________________ Proportions/Means: Columns Tested (10% risk level) - A/B/C - D/E - F/G/H - I/J/K * small base; ** very small base (under 30) ineligible for sig testing
Company Size Decision Maker Awareness Occupation
Total 2 to 49 50 to 499 500 + Primary Decision Maker
Influencer Low Medium High Manufacturing
Retail trade Finance/Insurance
A B C D E F G H I J K
Base: All respondents 1329 336 458 535 672 657 758 384 187 321 329 250
Weighted 1329 508 426 395* 683 646 813 378* 138** 62 154 56
Restructuring your company into two companies
Definitely would 101 25 47 29 73 28 27 43 31 7 8 4 7.6% 4.8% 11.1% 7.4% 10.7% 4.3% 3.3% 11.3% 22.8% 11.5% 5.2% 7.2% A E F JK
Probably would 103 33 35 36 75 28 58 30 15 13 14 7 7.8% 6.5% 8.1% 9.0% 11.0% 4.4% 7.1% 8.0% 10.9% 20.6% 9.4% 13.2% E JK
May or may not 320 84 107 130 183 137 179 105 37 15 41 14 24.1% 16.5% 25.1% 32.8% 26.8% 21.3% 22.0% 27.7% 26.6% 23.4% 26.4% 24.4% A
Probably would not 216 75 99 42 80 136 132 66 17 11 22 10 16.2% 14.7% 23.3% 10.6% 11.6% 21.1% 16.3% 17.6% 12.2% 17.4% 14.6% 17.2% AC D
Definitely would not 363 221 88 54 157 206 232 95 36 10 31 11 27.3% 43.6% 20.7% 13.5% 23.0% 31.9% 28.5% 25.0% 26.3% 16.2% 20.1% 20.4% BC D
I don't know 226 71 49 106 116 110 185 39 2 7 37 10 17.0% 13.9% 11.6% 26.7% 17.0% 17.0% 22.8% 10.3% 1.2% 10.9% 24.3% 17.6% AB G IK I
Summary
Top2Box (Definitely/ Probably would) 204 58 82 65 148 56 85 73 47 20 22 11 15.4% 11.3% 19.3% 16.4% 21.7% 8.7% 10.4% 19.4% 33.7% 32.1% 14.6% 20.4% A E F JK J
Low2Box (Definitely/ Probably would not) 579 296 187 95 236 342 364 161 53 21 53 21 43.5% 58.3% 44.0% 24.1% 34.6% 53.0% 44.8% 42.6% 38.5% 33.6% 34.7% 37.6% BC C D

182
Q44_2. [Shifting your lower-wage workforce toward more part-time workers] With healthcare reform, some employers may be interested in offering health insurance to their higher-wage employees, but not to lower-wage employees... Here are some additional facts about this option: Healthcare reform prohibits employers from discriminating in favor of higher wage employees in their benefits offering. However, there are other workforce strategies your company could pursue to provide different benefits to your higher vs. lower wage employees.For the next set of questions, assume exchanges are an easy, affordable way for individuals to obtain health insurance. How likely would your company be to consider pursuing each of the following strategies? ______________________________________________________________________________ Proportions/Means: Columns Tested (10% risk level) - A/B/C - D/E - F/G/H - I/J/K * small base; ** very small base (under 30) ineligible for sig testing
Company Size Decision Maker Awareness Occupation
Total 2 to 49 50 to 499 500 + Primary Decision Maker
Influencer Low Medium High Manufacturing
Retail trade Finance/Insurance
A B C D E F G H I J K
Base: All respondents 1329 336 458 535 672 657 758 384 187 321 329 250
Weighted 1329 508 426 395* 683 646 813 378* 138** 62 154 56
Shifting your lower-wage workforce toward more part-time workers
Definitely would 128 42 56 30 90 37 39 57 32 9 15 4 9.6% 8.3% 13.1% 7.5% 13.2% 5.8% 4.8% 15.2% 22.8% 14.0% 9.7% 7.6% E F JK
Probably would 226 106 68 52 141 85 150 47 28 12 28 10 17.0% 20.8% 16.0% 13.2% 20.6% 13.2% 18.5% 12.5% 20.4% 19.9% 18.5% 17.6% E
May or may not 364 103 117 143 164 200 214 113 37 16 44 15 27.4% 20.4% 27.5% 36.2% 24.0% 31.0% 26.3% 29.8% 27.0% 24.9% 28.9% 26.0% A
Probably would not 157 51 67 39 60 98 77 69 11 10 16 9 11.8% 10.1% 15.8% 9.7% 8.7% 15.2% 9.5% 18.4% 7.9% 15.3% 10.6% 16.0% D F J J
Definitely would not 228 121 73 35 115 113 143 56 29 9 18 9 17.2% 23.8% 17.1% 8.8% 16.8% 17.6% 17.7% 14.8% 20.9% 14.6% 11.9% 16.0% C C
I don't know 225 84 44 97 114 112 189 35 1 7 31 9 17.0% 16.6% 10.4% 24.5% 16.6% 17.3% 23.2% 9.3% 0.9% 11.2% 20.4% 16.8% B G I I
Summary
Top2Box (Definitely/ Probably would) 354 148 124 82 231 123 189 105 60 21 43 14 26.6% 29.2% 29.1% 20.7% 33.8% 19.0% 23.3% 27.7% 43.2% 34.0% 28.3% 25.2% E K
Low2Box (Definitely/ Probably would not) 386 172 140 73 174 211 220 125 40 19 35 18 29.0% 33.9% 32.9% 18.6% 25.5% 32.7% 27.1% 33.2% 28.8% 29.9% 22.5% 32.0% C C J J

183
Q44_3. [Significantly shifting your lower-wage workforce toward outsourced and/or offshore workers.] With healthcare reform, some employers may be interested in offering health insurance to their higher-wage employees, but not to lower-wage employees... Here are some additional facts about this option: Healthcare reform prohibits employers from discriminating in favor of higher wage employees in their benefits offering. However, there are other workforce strategies your company could pursue to provide different benefits to your higher vs. lower wage employees.For the next set of questions, assume exchanges are an easy, affordable way for individuals to obtain health insurance. How likely would your company be to consider pursuing each of the following strategies? ______________________________________________________________________________ Proportions/Means: Columns Tested (10% risk level) - A/B/C - D/E - F/G/H - I/J/K * small base; ** very small base (under 30) ineligible for sig testing
Company Size Decision Maker Awareness Occupation
Total 2 to 49 50 to 499 500 + Primary Decision Maker
Influencer Low Medium High Manufacturing
Retail trade Finance/Insurance
A B C D E F G H I J K
Base: All respondents 1329 336 458 535 672 657 758 384 187 321 329 250
Weighted 1329 508 426 395* 683 646 813 378* 138** 62 154 56
Significantly shifting your lower-wage workforce toward outsourced and/or offshore workers.
Definitely would 108 37 50 21 82 26 32 32 44 8 11 4 8.1% 7.2% 11.6% 5.4% 12.0% 4.0% 4.0% 8.4% 31.7% 12.8% 7.0% 8.0% E JK
Probably would 147 61 44 41 101 46 85 43 19 12 19 7 11.0% 12.0% 10.4% 10.5% 14.8% 7.1% 10.4% 11.3% 13.8% 19.6% 12.5% 12.0% E JK
May or may not 336 94 115 128 180 156 195 109 32 14 41 15 25.3% 18.4% 26.9% 32.4% 26.4% 24.1% 23.9% 28.9% 23.4% 23.1% 26.4% 26.4% A
Probably would not 145 50 53 42 46 99 78 62 5 9 14 8 10.9% 9.8% 12.4% 10.7% 6.7% 15.3% 9.6% 16.5% 3.4% 14.0% 9.1% 13.6% D F J J
Definitely would not 353 179 116 58 151 203 236 85 32 12 36 13 26.6% 35.2% 27.3% 14.7% 22.1% 31.4% 29.0% 22.6% 23.4% 19.0% 23.4% 23.2% C C D
I don't know 240 88 48 104 123 117 187 47 6 7 33 9 18.1% 17.3% 11.3% 26.4% 18.0% 18.1% 23.1% 12.3% 4.4% 11.5% 21.6% 16.8% B G I I
Summary
Top2Box (Definitely/ Probably would) 254 98 94 63 183 71 117 75 63 20 30 11 19.1% 19.2% 22.1% 15.8% 26.8% 11.1% 14.4% 19.7% 45.5% 32.4% 19.5% 20.0% E JK
Low2Box (Definitely/ Probably would not) 498 229 169 100 197 301 314 148 37 21 50 21 37.5% 45.1% 39.7% 25.4% 28.8% 46.7% 38.6% 39.0% 26.7% 33.0% 32.5% 36.8% C C D

184
Q44_4. [Setting the health coverage premium paid by employees above 9.5% of household income of many/most of your low-wage employees.] With healthcare reform, some employers may be interested in offering health insurance to their higher-wage employees, but not to lower-wage employees... Here are some additional facts about this option: Healthcare reform prohibits employers from discriminating in favor of higher wage employees in their benefits offering. However, there are other workforce strategies your company could pursue to provide different benefits to your higher vs. lower wage employees.For the next set of questions, assume exchanges are an easy, affordable way for individuals to obtain health insurance. How likely would your company be to consider pursuing each of the following strategies? ______________________________________________________________________________ Proportions/Means: Columns Tested (10% risk level) - A/B/C - D/E - F/G/H - I/J/K * small base; ** very small base (under 30) ineligible for sig testing
Company Size Decision Maker Awareness Occupation
Total 2 to 49 50 to 499 500 + Primary Decision Maker
Influencer Low Medium High Manufacturing
Retail trade Finance/Insurance
A B C D E F G H I J K
Base: All respondents 1329 336 458 535 672 657 758 384 187 321 329 250
Weighted 1329 508 426 395* 683 646 813 378* 138** 62 154 56
Setting the health coverage premium paid by employees above 9.5% of household income of many/most of your low-wage employees.
Definitely would 95 25 47 24 76 19 34 34 28 7 12 4 7.2% 4.9% 11.0% 5.9% 11.2% 2.9% 4.1% 8.9% 20.3% 11.2% 7.9% 7.2% A E F
Probably would 165 62 58 45 102 63 65 62 38 13 18 8 12.4% 12.1% 13.6% 11.4% 14.9% 9.7% 8.0% 16.3% 27.8% 21.5% 11.6% 14.4% F JK
May or may not 450 157 141 152 222 228 279 134 37 21 50 20 33.9% 31.0% 33.1% 38.4% 32.5% 35.4% 34.3% 35.5% 26.8% 33.3% 32.8% 35.2%
Probably would not 195 72 77 46 67 127 110 74 11 8 22 9 14.6% 14.1% 18.1% 11.6% 9.8% 19.7% 13.5% 19.6% 7.7% 13.4% 14.6% 15.6% D
Definitely would not 169 96 51 22 101 68 109 38 22 6 12 5 12.7% 19.0% 11.9% 5.5% 14.8% 10.5% 13.4% 10.1% 15.7% 9.0% 7.9% 8.4% C
I don't know 255 96 52 107 115 140 217 36 2 7 39 11 19.2% 18.9% 12.2% 27.2% 16.8% 21.7% 26.7% 9.6% 1.5% 11.5% 25.2% 19.2% B G IK I
Summary
Top2Box (Definitely/ Probably would) 260 86 105 69 178 82 98 95 67 20 30 12 19.6% 17.0% 24.6% 17.4% 26.1% 12.7% 12.1% 25.2% 48.2% 32.7% 19.5% 21.6% E F JK
Low2Box (Definitely/ Probably would not) 363 168 128 67 168 195 219 112 32 14 35 13 27.3% 33.1% 30.0% 17.0% 24.6% 30.2% 26.9% 29.7% 23.5% 22.4% 22.5% 24.0% C C

185
Q45. Another potential response to reform for employers is to become 'self-insured' or 'ASO'... Under this arrangement: [see questionnaire for details] … How likely is your company to convert your current fully-insured insurance plans to self-insured plans? ______________________________________________________________________________ Proportions/Means: Columns Tested (10% risk level) - A/B/C - D/E - F/G/H - I/J/K * small base; ** very small base (under 30) ineligible for sig testing
Company Size Decision Maker Awareness Occupation
Total 2 to 49 50 to 499 500 + Primary Decision Maker
Influencer Low Medium High Manufacturing
Retail trade Finance/Insurance
A B C D E F G H I J K
Base: Fully Insured Respondents 621 160 248 213 328 293 290 208 123 165 120 134
Weighted 591 217* 232* 141* 362* 229* 313* 199* 79** 32 56 30
Most likely 71 22 34 16 68 3 10 32 29 3 5 3 12.0% 9.9% 14.5% 11.0% 18.7% 1.3% 3.1% 16.1% 36.7% 7.9% 9.2% 10.4% E F
Likely 58 21 20 17 44 14 15 31 12 8 6 3 9.8% 9.8% 8.6% 12.0% 12.2% 6.2% 4.9% 15.6% 15.1% 24.8% 10.8% 10.4% F JK
Somewhat likely 104 48 40 16 69 35 57 36 11 6 10 6 17.6% 22.1% 17.1% 11.4% 19.2% 15.0% 18.3% 17.9% 14.0% 20.0% 18.3% 20.1%
Somewhat unlikely 130 26 58 45 73 57 74 51 5 5 14 4 22.0% 12.2% 25.1% 32.1% 20.2% 24.8% 23.7% 25.4% 6.8% 14.5% 24.2% 14.9% A A IK
Not likely 144 77 50 18 64 81 92 31 22 7 14 9 24.4% 35.4% 21.5% 12.5% 17.6% 35.2% 29.5% 15.4% 27.4% 21.2% 24.2% 29.9% C D G I
I don't know 84 23 31 30 44 40 64 19 0 4 7 4 14.2% 10.7% 13.2% 21.1% 12.1% 17.4% 20.6% 9.8% - 11.5% 13.3% 14.2%
Summary
Top3Box (Most likely/ Likely/ Somewhat likely)
233 91 93 49 181 52 82 98 52 17 21 12
39.4% 41.8% 40.2% 34.4% 50.1% 22.5% 26.2% 49.5% 65.8% 52.7% 38.3% 41.0% E F JK
Low2Box (Somewhat unlikely/ Not likely) 275 103 108 63 137 138 166 81 27 11 27 13 46.4% 47.5% 46.6% 44.5% 37.8% 60.1% 53.2% 40.7% 34.2% 35.8% 48.3% 44.8% D I

186
Q46. If your company has not previously offered wellness programs for employees, due to healthcare reform you could be eligible for federal grants toward establishing wellness programs. Given this, how interested would your company be in establishing a wellness program? ______________________________________________________________________________ Proportions/Means: Columns Tested (10% risk level) - A/B/C - D/E - F/G/H - I/J/K * small base; ** very small base (under 30) ineligible for sig testing
Company Size Decision Maker Awareness Occupation
Total 2 to 49 50 to 499 500 + Primary Decision Maker
Influencer Low Medium High Manufacturing
Retail trade Finance/Insurance
A B C D E F G H I J K
Base: No Health Management Programs 449 191 138 120 217 232 312 106 31 85 137 79
Weighted 469 287* 105* 77* 205* 264* 340* 114* 15** 17* 64 18*
Very interested 19 11 5 2 10 9 13 5 1 2 4 1 4.0% 3.9% 5.2% 2.7% 4.6% 3.5% 4.0% 4.0% 4.8% 11.8% 5.8% 3.8% JK
Interested 100 68 17 16 44 56 75 22 4 3 13 4 21.4% 23.6% 15.9% 21.0% 21.4% 21.4% 22.0% 19.0% 27.8% 15.3% 19.7% 21.5%
Somewhat interested 166 94 43 29 62 104 112 52 2 6 25 7 35.4% 32.8% 41.1% 37.3% 30.1% 39.5% 32.9% 45.8% 12.1% 37.6% 38.7% 40.5%
Somewhat uninterested 53 37 11 5 22 30 34 14 5 3 6 2 11.3% 12.8% 10.6% 6.5% 11.0% 11.5% 10.0% 12.2% 35.5% 15.3% 9.5% 10.1%
Not interested 131 77 28 25 67 63 106 22 3 3 17 4 27.9% 26.9% 27.2% 32.5% 32.8% 24.0% 31.2% 19.1% 19.9% 20.0% 26.3% 24.1%
Summary
Top3Box (Very/ Interested/ Somewhat interested)
285 173 65 47 115 170 200 79 6 11 41 12
60.8% 60.3% 62.3% 61.0% 56.2% 64.5% 58.9% 68.8% 44.6% 64.7% 64.2% 65.8%
Low2Box (Somewhat/ Not interested) 184 114 40 30 90 94 140 36 8 6 23 6 39.2% 39.7% 37.7% 39.0% 43.8% 35.5% 41.1% 31.2% 55.4% 35.3% 35.8% 34.2%

187
Q47_1. [Major illness support/ recovery programs] What type of employee wellness programs would you be most interested in launching or expanding? ______________________________________________________________________________ Proportions/Means: Columns Tested (10% risk level) - A/B/C - D/E - F/G/H - I/J/K * small base; ** very small base (under 30) ineligible for sig testing
Company Size Decision Maker Awareness Occupation
Total 2 to 49 50 to 499 500 + Primary Decision Maker
Influencer Low Medium High Manufacturing
Retail trade Finance/Insurance
A B C D E F G H I J K
Base: Health Management Programs OR Interested To Establish A Wellness Program
1213 287 430 496 610 603 666 367 180 304 293 231
Weighted 1198 430 397 370* 616 582 707 356* 135** 59 137 52
Major illness support/ recovery programs
Very interested 223 44 112 67 147 76 121 62 40 14 28 10 18.6% 10.3% 28.3% 18.1% 23.9% 13.1% 17.1% 17.5% 29.7% 23.7% 20.5% 19.9% AC E
Interested 349 137 112 100 178 171 209 96 45 20 48 17 29.1% 31.8% 28.3% 26.9% 28.9% 29.4% 29.5% 26.9% 32.9% 33.2% 34.8% 32.5%
Somewhat interested 423 164 112 147 183 240 240 146 38 20 43 16 35.3% 38.1% 28.2% 39.8% 29.8% 41.2% 34.0% 40.9% 27.8% 33.6% 31.4% 30.7% B D
Somewhat uninterested 92 31 39 22 40 53 52 35 6 3 8 5 7.7% 7.3% 9.7% 6.0% 6.5% 9.0% 7.3% 9.8% 4.4% 5.3% 6.1% 9.5% I
Not interested 110 54 22 34 68 42 85 18 7 3 10 4 9.2% 12.5% 5.5% 9.1% 11.0% 7.2% 12.1% 4.9% 5.1% 4.3% 7.2% 7.4% B G
Summary
Top3Box (Very Interested/ Interested/ Somewhat Interested)
996 345 337 314 508 488 570 304 122 54 119 43
83.1% 80.2% 84.7% 84.8% 82.5% 83.8% 80.6% 85.3% 90.5% 90.5% 86.7% 83.1% K
Low2Box (Somewhat uninterested/ Not interested)
202 85 61 56 108 95 137 52 13 6 18 9
16.9% 19.8% 15.3% 15.2% 17.5% 16.2% 19.4% 14.7% 9.5% 9.5% 13.3% 16.9% I
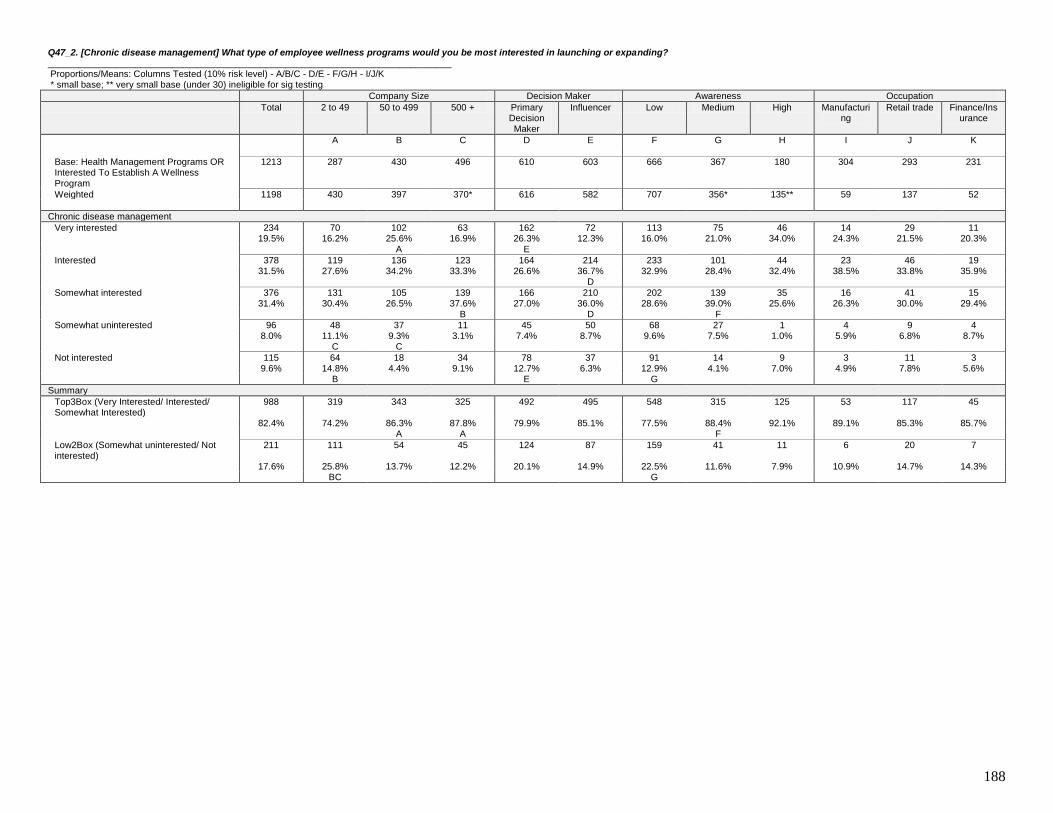
188
Q47_2. [Chronic disease management] What type of employee wellness programs would you be most interested in launching or expanding? ______________________________________________________________________________ Proportions/Means: Columns Tested (10% risk level) - A/B/C - D/E - F/G/H - I/J/K * small base; ** very small base (under 30) ineligible for sig testing
Company Size Decision Maker Awareness Occupation
Total 2 to 49 50 to 499 500 + Primary Decision Maker
Influencer Low Medium High Manufacturing
Retail trade Finance/Insurance
A B C D E F G H I J K
Base: Health Management Programs OR Interested To Establish A Wellness Program
1213 287 430 496 610 603 666 367 180 304 293 231
Weighted 1198 430 397 370* 616 582 707 356* 135** 59 137 52
Chronic disease management
Very interested 234 70 102 63 162 72 113 75 46 14 29 11 19.5% 16.2% 25.6% 16.9% 26.3% 12.3% 16.0% 21.0% 34.0% 24.3% 21.5% 20.3% A E
Interested 378 119 136 123 164 214 233 101 44 23 46 19 31.5% 27.6% 34.2% 33.3% 26.6% 36.7% 32.9% 28.4% 32.4% 38.5% 33.8% 35.9% D
Somewhat interested 376 131 105 139 166 210 202 139 35 16 41 15 31.4% 30.4% 26.5% 37.6% 27.0% 36.0% 28.6% 39.0% 25.6% 26.3% 30.0% 29.4% B D F
Somewhat uninterested 96 48 37 11 45 50 68 27 1 4 9 4 8.0% 11.1% 9.3% 3.1% 7.4% 8.7% 9.6% 7.5% 1.0% 5.9% 6.8% 8.7% C C
Not interested 115 64 18 34 78 37 91 14 9 3 11 3 9.6% 14.8% 4.4% 9.1% 12.7% 6.3% 12.9% 4.1% 7.0% 4.9% 7.8% 5.6% B E G
Summary
Top3Box (Very Interested/ Interested/ Somewhat Interested)
988 319 343 325 492 495 548 315 125 53 117 45
82.4% 74.2% 86.3% 87.8% 79.9% 85.1% 77.5% 88.4% 92.1% 89.1% 85.3% 85.7% A A F
Low2Box (Somewhat uninterested/ Not interested)
211 111 54 45 124 87 159 41 11 6 20 7
17.6% 25.8% 13.7% 12.2% 20.1% 14.9% 22.5% 11.6% 7.9% 10.9% 14.7% 14.3% BC G

189
Q47_3. [Smoking cessation] What type of employee wellness programs would you be most interested in launching or expanding? ______________________________________________________________________________ Proportions/Means: Columns Tested (10% risk level) - A/B/C - D/E - F/G/H - I/J/K * small base; ** very small base (under 30) ineligible for sig testing
Company Size Decision Maker Awareness Occupation
Total 2 to 49 50 to 499 500 + Primary Decision Maker
Influencer Low Medium High Manufacturing
Retail trade Finance/Insurance
A B C D E F G H I J K
Base: Health Management Programs OR Interested To Establish A Wellness Program
1213 287 430 496 610 603 666 367 180 304 293 231
Weighted 1198 430 397 370* 616 582 707 356* 135** 59 137 52
Smoking cessation
Very interested 263 65 101 97 144 118 140 73 49 16 36 13 21.9% 15.2% 25.4% 26.1% 23.4% 20.3% 19.9% 20.5% 36.3% 27.6% 26.6% 24.7% A A
Interested 328 123 122 83 157 171 179 115 34 21 40 15 27.4% 28.5% 30.7% 22.5% 25.5% 29.4% 25.3% 32.3% 25.2% 35.9% 29.0% 29.0% JK
Somewhat interested 334 101 109 125 157 177 189 116 29 14 36 14 27.9% 23.4% 27.3% 33.7% 25.5% 30.4% 26.7% 32.4% 21.8% 24.0% 26.3% 26.4%
Somewhat uninterested 93 42 25 25 41 52 59 24 9 4 10 3 7.7% 9.8% 6.3% 6.9% 6.7% 8.9% 8.4% 6.8% 6.8% 6.3% 7.2% 6.1%
Not interested 181 99 41 40 117 64 139 28 13 4 15 7 15.1% 23.1% 10.4% 10.9% 19.0% 11.0% 19.7% 8.0% 9.9% 6.3% 10.9% 13.9% BC E G I I
Summary
Top3Box (Very Interested/ Interested/ Somewhat Interested)
925 289 331 305 458 466 508 304 113 52 112 42
77.2% 67.1% 83.4% 82.2% 74.4% 80.1% 71.9% 85.2% 83.3% 87.5% 81.9% 80.1% A A F JK
Low2Box (Somewhat uninterested/ Not interested)
274 142 66 66 158 116 198 53 23 7 25 10
22.8% 32.9% 16.6% 17.8% 25.6% 19.9% 28.1% 14.8% 16.7% 12.5% 18.1% 19.9% BC G I I

190
Q47_4. [Diet/ nutrition coaching] What type of employee wellness programs would you be most interested in launching or expanding? ______________________________________________________________________________ Proportions/Means: Columns Tested (10% risk level) - A/B/C - D/E - F/G/H - I/J/K * small base; ** very small base (under 30) ineligible for sig testing
Company Size Decision Maker Awareness Occupation
Total 2 to 49 50 to 499 500 + Primary Decision Maker
Influencer Low Medium High Manufacturing
Retail trade Finance/Insurance
A B C D E F G H I J K
Base: Health Management Programs OR Interested To Establish A Wellness Program
1213 287 430 496 610 603 666 367 180 304 293 231
Weighted 1198 430 397 370* 616 582 707 356* 135** 59 137 52
Diet/ nutrition coaching
Very interested 266 79 113 75 163 103 150 68 48 14 28 11 22.2% 18.3% 28.4% 20.2% 26.5% 17.8% 21.3% 19.2% 35.3% 23.7% 20.8% 20.3% A E
Interested 345 125 117 103 164 181 209 96 40 21 54 20 28.8% 29.1% 29.3% 27.9% 26.6% 31.1% 29.6% 27.0% 29.5% 35.5% 39.2% 39.4%
Somewhat interested 356 129 98 129 162 194 184 137 35 16 34 15 29.7% 29.9% 24.8% 34.8% 26.3% 33.3% 26.0% 38.4% 26.2% 26.6% 24.6% 28.1% F
Somewhat uninterested 113 37 48 29 58 55 73 32 8 5 9 3 9.4% 8.5% 12.0% 7.8% 9.4% 9.4% 10.3% 9.0% 6.1% 8.9% 6.5% 5.6%
Not interested 118 61 22 35 69 49 91 23 4 3 12 3 9.8% 14.2% 5.5% 9.4% 11.2% 8.4% 12.8% 6.5% 2.8% 5.3% 8.9% 6.5% B
Summary
Top3Box (Very Interested/ Interested/ Somewhat Interested)
967 333 328 307 489 479 543 301 123 51 116 46
80.7% 77.3% 82.5% 82.9% 79.4% 82.2% 76.8% 84.5% 91.1% 85.9% 84.6% 87.9%
Low2Box (Somewhat uninterested/ Not interested)
231 98 70 64 127 104 164 55 12 8 21 6
19.3% 22.7% 17.5% 17.1% 20.6% 17.8% 23.2% 15.5% 8.9% 14.1% 15.4% 12.1%

191
Q47_5. [Exercise promotion] What type of employee wellness programs would you be most interested in launching or expanding? ______________________________________________________________________________ Proportions/Means: Columns Tested (10% risk level) - A/B/C - D/E - F/G/H - I/J/K * small base; ** very small base (under 30) ineligible for sig testing
Company Size Decision Maker Awareness Occupation
Total 2 to 49 50 to 499 500 + Primary Decision Maker
Influencer Low Medium High Manufacturing
Retail trade Finance/Insurance
A B C D E F G H I J K
Base: Health Management Programs OR Interested To Establish A Wellness Program
1213 287 430 496 610 603 666 367 180 304 293 231
Weighted 1198 430 397 370* 616 582 707 356* 135** 59 137 52
Exercise promotion
Very interested 308 97 128 83 186 122 158 90 61 18 30 13 25.7% 22.6% 32.2% 22.5% 30.2% 20.9% 22.3% 25.2% 45.0% 30.6% 22.2% 25.1% E J
Interested 433 168 141 124 194 239 282 121 30 21 50 20 36.1% 39.1% 35.4% 33.4% 31.5% 41.0% 39.9% 34.0% 21.8% 35.5% 36.5% 38.1% D
Somewhat interested 291 79 95 116 150 141 150 106 35 15 40 13 24.3% 18.5% 24.0% 31.3% 24.3% 24.2% 21.2% 29.8% 25.6% 25.3% 29.0% 25.1% A
Somewhat uninterested 79 41 25 14 34 46 46 27 7 4 7 3 6.6% 9.6% 6.2% 3.7% 5.5% 7.8% 6.5% 7.5% 4.9% 6.3% 4.8% 6.1%
Not interested 87 44 9 34 52 35 71 13 4 1 10 3 7.3% 10.3% 2.2% 9.1% 8.5% 6.0% 10.0% 3.5% 2.7% 2.3% 7.5% 5.6% B B G I I
Summary
Top3Box (Very Interested/ Interested/ Somewhat Interested)
1032 345 364 323 530 502 590 317 125 54 120 46
86.1% 80.1% 91.6% 87.2% 86.0% 86.2% 83.4% 89.0% 92.4% 91.4% 87.7% 88.3% A
Low2Box (Somewhat uninterested/ Not interested)
166 85 33 47 86 80 117 39 10 5 17 6
13.9% 19.9% 8.4% 12.8% 14.0% 13.8% 16.6% 11.0% 7.6% 8.6% 12.3% 11.7% B

192
Q47_6. [Worksite clinics] What type of employee wellness programs would you be most interested in launching or expanding? ______________________________________________________________________________ Proportions/Means: Columns Tested (10% risk level) - A/B/C - D/E - F/G/H - I/J/K * small base; ** very small base (under 30) ineligible for sig testing
Company Size Decision Maker Awareness Occupation
Total 2 to 49 50 to 499 500 + Primary Decision Maker
Influencer Low Medium High Manufacturing
Retail trade Finance/Insurance
A B C D E F G H I J K
Base: Health Management Programs OR Interested To Establish A Wellness Program
1213 287 430 496 610 603 666 367 180 304 293 231
Weighted 1198 430 397 370* 616 582 707 356* 135** 59 137 52
Worksite clinics
Very interested 198 68 79 50 134 64 94 60 45 11 22 10 16.5% 15.9% 20.0% 13.6% 21.7% 11.0% 13.3% 16.7% 32.9% 19.1% 16.0% 19.5% E
Interested 286 70 109 107 143 144 165 82 39 19 43 13 23.9% 16.2% 27.5% 29.0% 23.2% 24.7% 23.4% 23.0% 29.1% 32.9% 31.4% 24.2% A A K K
Somewhat interested 338 91 102 145 141 197 198 112 28 18 41 15 28.2% 21.0% 25.8% 39.1% 22.8% 33.9% 28.0% 31.3% 20.7% 30.3% 30.0% 29.0% AB D
Somewhat uninterested 163 90 53 21 70 94 106 51 6 5 12 7 13.6% 20.9% 13.4% 5.5% 11.3% 16.1% 15.1% 14.2% 4.8% 8.6% 8.9% 13.4% C C IJ
Not interested 213 112 53 47 129 84 143 53 17 5 19 7 17.7% 26.1% 13.3% 12.8% 20.9% 14.4% 20.3% 14.8% 12.5% 9.2% 13.7% 13.9% BC I I
Summary
Top3Box (Very Interested/ Interested/ Somewhat Interested)
822 228 291 302 417 405 457 253 112 49 106 38
68.6% 53.1% 73.3% 81.6% 67.7% 69.5% 64.7% 71.0% 82.7% 82.2% 77.5% 72.7% A A K
Low2Box (Somewhat uninterested/ Not interested)
376 202 106 68 199 177 250 103 23 11 31 14
31.4% 46.9% 26.7% 18.4% 32.3% 30.5% 35.3% 29.0% 17.3% 17.8% 22.5% 27.3% BC I

193
Q47_7. [Health risk assessments] What type of employee wellness programs would you be most interested in launching or expanding? ______________________________________________________________________________ Proportions/Means: Columns Tested (10% risk level) - A/B/C - D/E - F/G/H - I/J/K * small base; ** very small base (under 30) ineligible for sig testing
Company Size Decision Maker Awareness Occupation
Total 2 to 49 50 to 499 500 + Primary Decision Maker
Influencer Low Medium High Manufacturing
Retail trade Finance/Insurance
A B C D E F G H I J K
Base: Health Management Programs OR Interested To Establish A Wellness Program
1213 287 430 496 610 603 666 367 180 304 293 231
Weighted 1198 430 397 370* 616 582 707 356* 135** 59 137 52
Health risk assessments
Very interested 245 90 85 70 156 89 126 62 57 14 29 12 20.4% 20.9% 21.4% 18.9% 25.3% 15.3% 17.8% 17.3% 42.4% 24.0% 21.5% 22.5% E
Interested 368 113 133 122 187 180 230 111 27 22 49 19 30.7% 26.2% 33.4% 32.9% 30.4% 31.0% 32.5% 31.2% 19.8% 37.8% 35.8% 35.9%
Somewhat interested 391 136 125 130 170 221 213 136 42 17 38 15 32.6% 31.5% 31.5% 35.2% 27.6% 37.9% 30.1% 38.2% 30.8% 28.6% 27.6% 28.6% D
Somewhat uninterested 85 42 28 15 28 57 47 32 6 3 10 3 7.1% 9.7% 7.1% 4.0% 4.6% 9.7% 6.7% 8.9% 4.1% 5.6% 7.2% 6.1% D
Not interested 110 50 26 34 75 36 91 15 4 2 11 4 9.2% 11.6% 6.6% 9.1% 12.1% 6.1% 12.9% 4.3% 2.8% 3.9% 7.8% 6.9% E G I
Summary
Top3Box (Very Interested/ Interested/ Somewhat Interested)
1004 339 343 322 513 490 568 309 126 54 116 45
83.7% 78.7% 86.2% 87.0% 83.3% 84.2% 80.4% 86.7% 93.0% 90.5% 85.0% 87.0% J
Low2Box (Somewhat uninterested/ Not interested)
195 92 55 48 103 92 138 47 9 6 21 7
16.3% 21.3% 13.8% 13.0% 16.7% 15.8% 19.6% 13.3% 7.0% 9.5% 15.0% 13.0% I

194
Q48_1. [One or a few large, bellwether employers drop health insurance for a majority or all of their employees] How would the following possible events impact the way your company would react to health care reform? ______________________________________________________________________________ Proportions/Means: Columns Tested (10% risk level) - A/B/C - D/E - F/G/H - I/J/K * small base; ** very small base (under 30) ineligible for sig testing
Company Size Decision Maker Awareness Occupation
Total 2 to 49 50 to 499 500 + Primary Decision Maker
Influencer Low Medium High Manufacturing
Retail trade Finance/Insurance
A B C D E F G H I J K
Base: All Respondents 1329 336 458 535 672 657 758 384 187 321 329 250
Weighted 1329 508 426 395* 683 646 813 378* 138** 62 154 56
One or a few large, bellwether employers drop health insurance for a majority or all of their employees
Major impact 337 112 133 93 191 146 170 103 64 21 39 13 25.4% 22.0% 31.2% 23.5% 28.0% 22.6% 20.9% 27.3% 46.5% 33.6% 25.5% 23.2% JK
Minor impact 571 188 196 186 270 301 321 194 55 26 62 26 42.9% 37.1% 46.1% 47.0% 39.5% 46.6% 39.6% 51.4% 39.6% 41.7% 40.1% 46.4% F
No impact 421 208 97 117 222 199 321 81 19 15 53 17 31.7% 41.0% 22.7% 29.5% 32.5% 30.8% 39.5% 21.3% 13.9% 24.6% 34.3% 30.4% BC G I

195
Q48_2. [One or a few of my major competitors... drop health insurance for a majority or all of their employees] How would the following possible events impact the way your company would react to health care reform? ______________________________________________________________________________ Proportions/Means: Columns Tested (10% risk level) - A/B/C - D/E - F/G/H - I/J/K * small base; ** very small base (under 30) ineligible for sig testing
Company Size Decision Maker Awareness Occupation
Total 2 to 49 50 to 499 500 + Primary Decision Maker
Influencer Low Medium High Manufacturing
Retail trade Finance/Insurance
A B C D E F G H I J K
Base: All Respondents 1329 336 458 535 672 657 758 384 187 321 329 250
Weighted 1329 508 426 395* 683 646 813 378* 138** 62 154 56
One or a few of my major competitors... drop health insurance for a majority or all of their employees
Major impact 327 91 137 99 182 146 163 113 52 20 36 14 24.6% 18.0% 32.1% 25.1% 26.6% 22.6% 20.0% 29.9% 37.5% 31.5% 23.7% 25.6% A F J
Minor impact 561 189 188 184 269 292 331 164 66 28 66 25 42.2% 37.2% 44.2% 46.5% 39.4% 45.2% 40.7% 43.3% 47.9% 45.2% 42.9% 43.6%
No impact 441 228 101 112 233 208 319 101 20 15 51 17 33.2% 44.8% 23.8% 28.4% 34.1% 32.2% 39.3% 26.8% 14.6% 23.4% 33.4% 30.8% BC G I I

196
Q48_3. [One of your low-cost competitors drop health insurance for a majority or all of their employees] How would the following possible events impact the way your company would react to health care reform? ______________________________________________________________________________ Proportions/Means: Columns Tested (10% risk level) - A/B/C - D/E - F/G/H - I/J/K * small base; ** very small base (under 30) ineligible for sig testing
Company Size Decision Maker Awareness Occupation
Total 2 to 49 50 to 499 500 + Primary Decision Maker
Influencer Low Medium High Manufacturing
Retail trade Finance/Insurance
A B C D E F G H I J K
Base: All Respondents 1329 336 458 535 672 657 758 384 187 321 329 250
Weighted 1329 508 426 395* 683 646 813 378* 138** 62 154 56
One of your low-cost competitors drop health insurance for a majority or all of their employees
Major impact 319 106 132 81 202 117 158 98 63 18 37 12 24.0% 20.9% 31.0% 20.4% 29.6% 18.1% 19.5% 25.9% 45.6% 28.0% 24.0% 22.0% AC E K
Minor impact 545 166 183 196 260 285 311 176 59 30 60 25 41.0% 32.8% 42.9% 49.5% 38.0% 44.1% 38.2% 46.4% 42.5% 47.4% 39.2% 44.8% A J
No impact 465 235 111 119 221 243 344 105 16 15 57 19 35.0% 46.3% 26.1% 30.1% 32.4% 37.7% 42.3% 27.7% 11.9% 24.6% 36.8% 33.2% BC G I I

197
Q48_4. [The vast majority of large employers continue to offer health insurance to their employees] How would the following possible events impact the way your company would react to health care reform? ______________________________________________________________________________ Proportions/Means: Columns Tested (10% risk level) - A/B/C - D/E - F/G/H - I/J/K * small base; ** very small base (under 30) ineligible for sig testing
Company Size Decision Maker Awareness Occupation
Total 2 to 49 50 to 499 500 + Primary Decision Maker
Influencer Low Medium High Manufacturing
Retail trade Finance/Insurance
A B C D E F G H I J K
Base: All Respondents 1329 336 458 535 672 657 758 384 187 321 329 250
Weighted 1329 508 426 395* 683 646 813 378* 138** 62 154 56
The vast majority of large employers continue to offer health insurance to their employees
Major impact 371 118 149 104 212 159 187 115 69 23 42 16 27.9% 23.3% 34.9% 26.3% 31.0% 24.7% 23.0% 30.4% 50.1% 36.1% 27.7% 29.2% A JK
Minor impact 530 158 190 183 268 263 295 179 57 25 61 21 39.9% 31.1% 44.5% 46.2% 39.1% 40.7% 36.3% 47.2% 41.1% 40.8% 39.5% 38.0% A A F
No impact 428 231 88 109 204 224 331 85 12 14 50 18 32.2% 45.5% 20.6% 27.5% 29.9% 34.6% 40.7% 22.4% 8.8% 23.1% 32.8% 32.8% BC G I I

198
Q48_5. [The penalty for not offering medical coverage to employees is increased to nearly the cost of providing employee coverage] How would the following possible events impact the way your company would react to health care reform? ______________________________________________________________________________ Proportions/Means: Columns Tested (10% risk level) - A/B/C - D/E - F/G/H - I/J/K * small base; ** very small base (under 30) ineligible for sig testing
Company Size Decision Maker Awareness Occupation
Total 2 to 49 50 to 499 500 + Primary Decision Maker
Influencer Low Medium High Manufacturing
Retail trade Finance/Insurance
A B C D E F G H I J K
Base: All Respondents 1329 336 458 535 672 657 758 384 187 321 329 250
Weighted 1329 508 426 395* 683 646 813 378* 138** 62 154 56
The penalty for not offering medical coverage to employees is increased to nearly the cost of providing employee coverage
Major impact 489 185 198 106 231 259 280 149 61 29 57 20 36.8% 36.4% 46.5% 26.9% 33.8% 40.0% 34.4% 39.5% 43.8% 46.7% 37.4% 36.0% C JK
Minor impact 525 181 162 183 267 259 305 159 62 23 55 22 39.5% 35.7% 37.9% 46.2% 39.0% 40.1% 37.6% 41.9% 44.6% 37.4% 35.6% 39.2%
No impact 314 142 66 106 186 128 228 70 16 10 42 14 23.6% 27.9% 15.5% 26.9% 27.2% 19.9% 28.0% 18.6% 11.6% 15.9% 27.1% 24.8% B B G I I
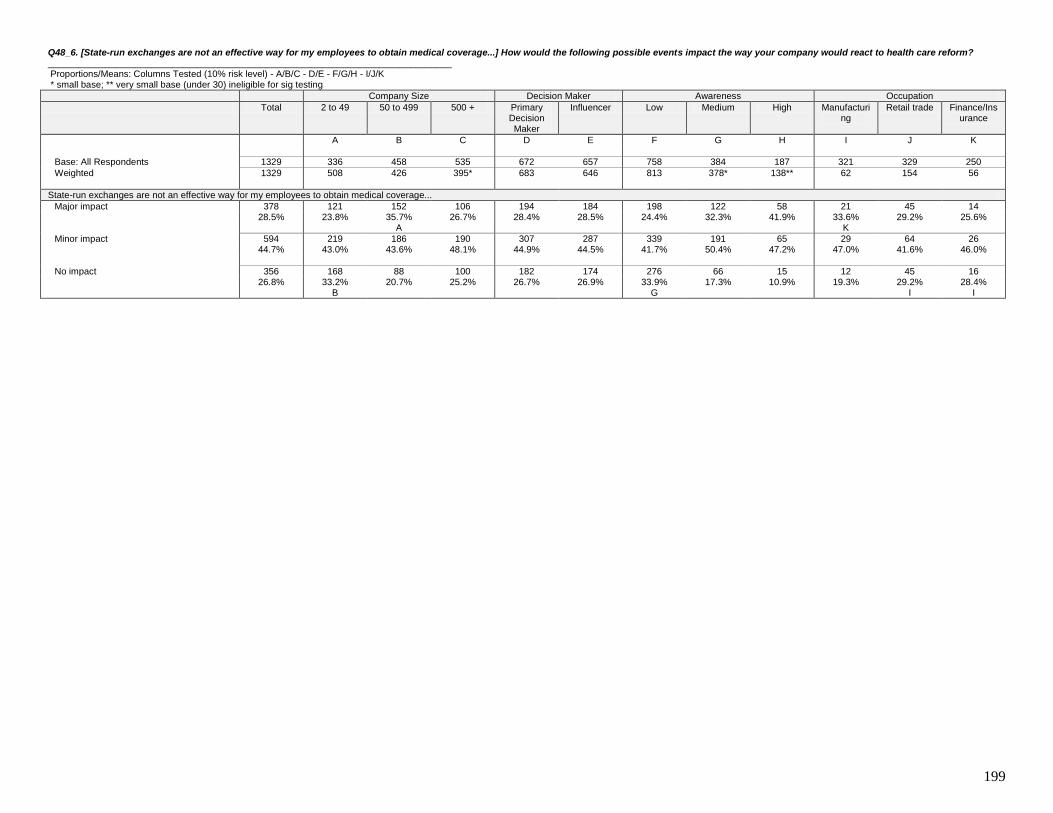
199
Q48_6. [State-run exchanges are not an effective way for my employees to obtain medical coverage...] How would the following possible events impact the way your company would react to health care reform? ______________________________________________________________________________ Proportions/Means: Columns Tested (10% risk level) - A/B/C - D/E - F/G/H - I/J/K * small base; ** very small base (under 30) ineligible for sig testing
Company Size Decision Maker Awareness Occupation
Total 2 to 49 50 to 499 500 + Primary Decision Maker
Influencer Low Medium High Manufacturing
Retail trade Finance/Insurance
A B C D E F G H I J K
Base: All Respondents 1329 336 458 535 672 657 758 384 187 321 329 250
Weighted 1329 508 426 395* 683 646 813 378* 138** 62 154 56
State-run exchanges are not an effective way for my employees to obtain medical coverage...
Major impact 378 121 152 106 194 184 198 122 58 21 45 14 28.5% 23.8% 35.7% 26.7% 28.4% 28.5% 24.4% 32.3% 41.9% 33.6% 29.2% 25.6% A K
Minor impact 594 219 186 190 307 287 339 191 65 29 64 26 44.7% 43.0% 43.6% 48.1% 44.9% 44.5% 41.7% 50.4% 47.2% 47.0% 41.6% 46.0%
No impact 356 168 88 100 182 174 276 66 15 12 45 16 26.8% 33.2% 20.7% 25.2% 26.7% 26.9% 33.9% 17.3% 10.9% 19.3% 29.2% 28.4% B G I I
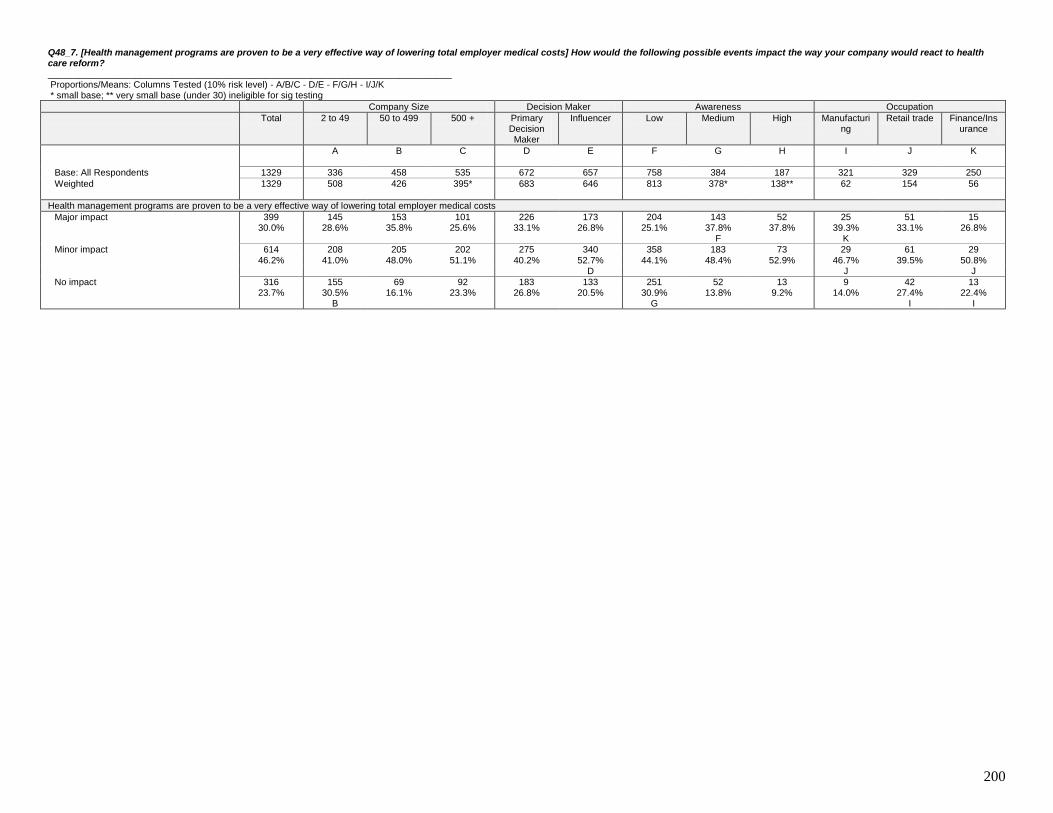
200
Q48_7. [Health management programs are proven to be a very effective way of lowering total employer medical costs] How would the following possible events impact the way your company would react to health care reform? ______________________________________________________________________________ Proportions/Means: Columns Tested (10% risk level) - A/B/C - D/E - F/G/H - I/J/K * small base; ** very small base (under 30) ineligible for sig testing
Company Size Decision Maker Awareness Occupation
Total 2 to 49 50 to 499 500 + Primary Decision Maker
Influencer Low Medium High Manufacturing
Retail trade Finance/Insurance
A B C D E F G H I J K
Base: All Respondents 1329 336 458 535 672 657 758 384 187 321 329 250
Weighted 1329 508 426 395* 683 646 813 378* 138** 62 154 56
Health management programs are proven to be a very effective way of lowering total employer medical costs
Major impact 399 145 153 101 226 173 204 143 52 25 51 15 30.0% 28.6% 35.8% 25.6% 33.1% 26.8% 25.1% 37.8% 37.8% 39.3% 33.1% 26.8% F K
Minor impact 614 208 205 202 275 340 358 183 73 29 61 29 46.2% 41.0% 48.0% 51.1% 40.2% 52.7% 44.1% 48.4% 52.9% 46.7% 39.5% 50.8% D J J
No impact 316 155 69 92 183 133 251 52 13 9 42 13 23.7% 30.5% 16.1% 23.3% 26.8% 20.5% 30.9% 13.8% 9.2% 14.0% 27.4% 22.4% B G I I

201
Q48_8. [The percentage of premium employers can place at stake for participation in wellness programs is increased to 50%] How would the following possible events impact the way your company would react to health care reform? ______________________________________________________________________________ Proportions/Means: Columns Tested (10% risk level) - A/B/C - D/E - F/G/H - I/J/K * small base; ** very small base (under 30) ineligible for sig testing
Company Size Decision Maker Awareness Occupation
Total 2 to 49 50 to 499 500 + Primary Decision Maker
Influencer Low Medium High Manufacturing
Retail trade Finance/Insurance
A B C D E F G H I J K
Base: All Respondents 1329 336 458 535 672 657 758 384 187 321 329 250
Weighted 1329 508 426 395* 683 646 813 378* 138** 62 154 56
The percentage of premium employers can place at stake for participation in wellness programs is increased to 50%
Major impact 353 101 133 119 177 176 172 127 54 21 44 14 26.6% 19.8% 31.3% 30.2% 25.9% 27.3% 21.2% 33.6% 39.2% 34.0% 28.9% 25.6% A A F K
Minor impact 617 227 215 176 297 320 359 195 63 29 60 27 46.5% 44.7% 50.4% 44.5% 43.4% 49.6% 44.2% 51.5% 45.9% 46.7% 39.2% 48.0% J J
No impact 358 180 78 100 210 149 282 56 21 12 49 15 27.0% 35.5% 18.3% 25.3% 30.7% 23.0% 34.7% 14.8% 14.9% 19.3% 31.9% 26.4% B G I I

202
Q49. Your industry, competitors, and other employers in your area How do you believe your total benefits offering generally compares to that of your industry? ______________________________________________________________________________ Proportions/Means: Columns Tested (10% risk level) - A/B/C - D/E - F/G/H - I/J/K * small base; ** very small base (under 30) ineligible for sig testing
Company Size Decision Maker Awareness Occupation
Total 2 to 49 50 to 499 500 + Primary Decision Maker
Influencer Low Medium High Manufacturing
Retail trade Finance/Insurance
A B C D E F G H I J K
Base: All Respondents 1329 336 458 535 672 657 758 384 187 321 329 250
Weighted 1329 508 426 395* 683 646 813 378* 138** 62 154 56
Our offering is significantly more extensive 131 35 50 46 92 39 57 30 44 9 10 7 9.9% 7.0% 11.8% 11.5% 13.4% 6.1% 7.1% 8.0% 31.6% 14.3% 6.7% 11.6% E J J
Our offering is moderately more extensive 315 134 110 71 167 148 173 90 51 21 33 13 23.7% 26.4% 25.8% 18.0% 24.5% 22.9% 21.3% 23.9% 37.1% 33.0% 21.6% 22.4% JK
Our offerings are about the same 462 140 172 150 210 252 246 174 42 21 63 22 34.8% 27.5% 40.4% 38.1% 30.8% 39.0% 30.3% 46.1% 30.4% 34.3% 41.0% 39.6% A F I
Their offerings are moderately more extensive
92 55 10 27 20 72 82 9 0 3 7 2
6.9% 10.8% 2.4% 6.7% 2.9% 11.1% 10.1% 2.5% - 4.7% 4.3% 4.4% B D G
Their offerings are significantly more extensive
43 31 7 4 25 18 25 18 0 1 4 1
3.2% 6.2% 1.7% 1.1% 3.7% 2.8% 3.1% 4.7% - 1.2% 2.7% 1.6% BC
I don't know 286 113 76 97 169 117 228 57 1 8 36 11 21.5% 22.2% 17.9% 24.6% 24.8% 18.1% 28.1% 14.9% 1.0% 12.5% 23.7% 20.4% G I I
Summary
Top2Box 446 169 160 117 259 187 230 120 95 30 43 19 33.5% 33.3% 37.6% 29.5% 37.9% 29.0% 28.4% 31.8% 68.6% 47.4% 28.3% 34.0% E JK
Low2Box 135 86 17 31 45 90 108 27 0 4 11 3 10.1% 17.0% 4.1% 7.8% 6.6% 13.9% 13.2% 7.1% - 5.9% 7.0% 6.0% BC D

203
Q50. How do you believe your total benefits offering generally compares to that of your competitors/ other businesses in your geographic area? ______________________________________________________________________________ Proportions/Means: Columns Tested (10% risk level) - A/B/C - D/E - F/G/H - I/J/K * small base; ** very small base (under 30) ineligible for sig testing
Company Size Decision Maker Awareness Occupation
Total 2 to 49 50 to 499 500 + Primary Decision Maker
Influencer Low Medium High Manufacturing
Retail trade Finance/Insurance
A B C D E F G H I J K
Base: All Respondents 1329 336 458 535 672 657 758 384 187 321 329 250
Weighted 1329 508 426 395* 683 646 813 378* 138** 62 154 56
Our offering is significantly more extensive 116 31 47 38 94 22 50 28 37 8 12 7 8.7% 6.1% 11.0% 9.5% 13.7% 3.4% 6.2% 7.4% 26.9% 12.1% 7.6% 11.6% E J J
Our offering is moderately more extensive 315 121 110 85 167 148 173 97 45 22 31 11 23.7% 23.8% 25.7% 21.5% 24.4% 23.0% 21.3% 25.7% 32.8% 35.2% 20.4% 20.4% JK
Our offerings are about the same 459 148 167 144 195 264 244 161 54 21 63 22 34.6% 29.2% 39.2% 36.4% 28.6% 40.9% 30.1% 42.5% 39.1% 34.3% 40.7% 39.2% D F I
Their offerings are moderately more extensive
117 76 15 25 41 76 98 19 1 3 7 3
8.8% 15.0% 3.6% 6.4% 6.0% 11.8% 12.1% 4.9% 0.5% 5.0% 4.9% 6.0% BC D G
Their offerings are significantly more extensive
40 28 7 5 27 13 22 18 0 1 4 1
3.0% 5.5% 1.8% 1.2% 4.0% 2.0% 2.8% 4.6% - 2.2% 2.7% 1.2% C
I don't know 282 103 80 99 160 122 225 56 1 7 36 12 21.2% 20.3% 18.7% 25.0% 23.3% 18.9% 27.6% 14.8% 0.8% 11.2% 23.7% 21.6% G I I
Summary
Top2Box 431 152 157 123 261 170 223 125 82 30 43 18 32.4% 29.9% 36.8% 31.0% 38.1% 26.4% 27.5% 33.1% 59.6% 47.4% 28.0% 32.0% E JK
Low2Box 157 104 23 30 68 89 120 36 1 4 12 4 11.8% 20.5% 5.3% 7.6% 9.9% 13.8% 14.8% 9.5% 0.5% 7.2% 7.6% 7.2% BC

204
Q51. How important do you think benefits are in competition for talent in your industry? ______________________________________________________________________________ Proportions/Means: Columns Tested (10% risk level) - A/B/C - D/E - F/G/H - I/J/K * small base; ** very small base (under 30) ineligible for sig testing
Company Size Decision Maker Awareness Occupation
Total 2 to 49 50 to 499 500 + Primary Decision Maker
Influencer Low Medium High Manufacturing
Retail trade Finance/Insurance
A B C D E F G H I J K
Base: All Respondents 1329 336 458 535 672 657 758 384 187 321 329 250
Weighted 1329 508 426 395* 683 646 813 378* 138** 62 154 56
Very important 613 198 222 194 317 296 348 178 88 37 64 32 46.2% 39.0% 52.0% 49.1% 46.4% 45.9% 42.8% 47.1% 63.5% 59.5% 41.3% 56.8% A J J
Somewhat important 574 228 178 168 299 275 353 175 47 23 70 19 43.2% 44.9% 41.8% 42.4% 43.7% 42.6% 43.4% 46.2% 33.8% 36.4% 45.6% 34.4% IK
Not important 142 82 26 34 67 75 112 25 4 3 20 5 10.7% 16.1% 6.1% 8.5% 9.8% 11.5% 13.8% 6.7% 2.8% 4.0% 13.1% 8.8% BC G I I

205
Q52. How important do you think benefits are in competition for talent in your geographic area? ______________________________________________________________________________ Proportions/Means: Columns Tested (10% risk level) - A/B/C - D/E - F/G/H - I/J/K * small base; ** very small base (under 30) ineligible for sig testing
Company Size Decision Maker Awareness Occupation
Total 2 to 49 50 to 499 500 + Primary Decision Maker
Influencer Low Medium High Manufacturing
Retail trade Finance/Insurance
A B C D E F G H I J K
Base: All Respondents 1329 336 458 535 672 657 758 384 187 321 329 250
Weighted 1329 508 426 395* 683 646 813 378* 138** 62 154 56
Very important 606 227 212 166 330 276 343 172 91 34 61 30 45.6% 44.7% 49.8% 42.1% 48.3% 42.7% 42.2% 45.4% 65.8% 54.2% 39.8% 52.8% J J
Somewhat important 588 206 183 199 285 303 359 186 43 26 75 22 44.3% 40.5% 43.0% 50.4% 41.8% 46.9% 44.2% 49.3% 30.9% 41.1% 48.6% 40.0% IK
Not important 135 75 30 30 68 67 110 20 5 3 18 4 10.1% 14.7% 7.1% 7.5% 10.0% 10.4% 13.5% 5.3% 3.3% 4.7% 11.6% 7.2% B G IK

206
Q53. How have you heard your competitors will respond/ How do you expect your competitors to respond to reform? ______________________________________________________________________________ Proportions/Means: Columns Tested (10% risk level) - A/B/C - D/E - F/G/H - I/J/K * small base; ** very small base (under 30) ineligible for sig testing
Company Size Decision Maker Awareness Occupation
Total 2 to 49 50 to 499 500 + Primary Decision Maker
Influencer Low Medium High Manufacturing
Retail trade Finance/Insurance
A B C D E F G H I J K
Base: All Respondents 1329 336 458 535 672 657 758 384 187 321 329 250
Weighted 1329 508 426 395* 683 646 813 378* 138** 62 154 56
Wait and see what other companies do 368 150 123 96 211 157 173 132 63 27 47 16 27.7% 29.5% 28.8% 24.3% 30.9% 24.4% 21.3% 34.8% 45.9% 43.6% 30.4% 29.2% F JK
Continue as-is or with minor changes 359 100 140 119 171 187 172 134 53 19 32 16 27.0% 19.6% 32.9% 30.0% 25.1% 29.0% 21.1% 35.5% 38.1% 30.8% 20.7% 28.4% A A F J J
Continue offering medical coverage but likely with significant changes
324 120 103 101 155 169 185 84 55 18 42 12
24.3% 23.7% 24.1% 25.4% 22.7% 26.1% 22.7% 22.1% 40.0% 28.7% 27.4% 20.8% K K
Drop coverage altogether, other (Please describe)
21 18 3 0 13 8 6 5 10 0 1 0
1.6% 3.6% 0.7% - 1.9% 1.2% 0.8% 1.2% 7.5% 0.3% 0.9% - C
Drop coverage for some groups (e.g., retirees) (Please describe group)
17 3 10 3 6 11 5 4 9 1 1 0
1.3% 0.6% 2.4% 0.8% 0.9% 1.7% 0.6% 0.9% 6.2% 1.2% 0.6% 0.8%
I don't know 417 176 111 130 218 199 337 76 4 15 55 20 31.4% 34.8% 26.1% 32.8% 31.9% 30.9% 41.5% 20.0% 3.1% 24.0% 35.9% 36.0% G I I

![June 2015 Survey Results · Aurora Flight Sciences, McKinsey & Co ., Rochester Institute of Technology , University of Waterloo Health Sciences and Technology [HST] ... University](https://static.fdocuments.in/doc/165x107/5f0eb1c37e708231d4407aba/june-2015-survey-results-aurora-flight-sciences-mckinsey-co-rochester.jpg)