McKinsey Global Institute -- Define Contributions Market
37
Financial Services Practice Winning in the Defined Contribution Market of 2015 New Realities Reshape the Competitive Landscape
-
Upload
hugh-nguyen -
Category
Documents
-
view
250 -
download
3
Transcript of McKinsey Global Institute -- Define Contributions Market

Financial Services Practice
Winning in the Defined Contribution Market of 2015New Realities Reshape the Competitive Landscape

Winning in the Defined Contribution Market of 2015New Realities Reshape the Competitive Landscape

Contents
1
5
9
19
Introduction
The Largest Growth Opportunity for AssetGatherers
New Products, Distribution, Economics andRegulation Reshape the Competitive Landscape
To Win in the DC Market, Asset Gatherers MustRefocus, Retool and Innovate
Appendix I A closer look at DC market growth and economics acrossproducts and segments
Appendix II The IRA race: A battle for the largest non cashopportunity in wealth management
24
29


1
Introduction
Born almost by accident nearly 30 years ago,
defined contribution (DC) has become the favorite
child of asset gatherers. Despite a trillion-dollar
decline in assets during the recent financial crisis,
DC has surpassed private defined benefit (DB) as
the major pool of retirement funds with $4 trillion in
assets. Although faced with the prospect of
$2 trillion in outflows over the next five years due to
retiring baby boomers, DC will continue to thrive,
with an equal level of new contributions.
However, the basis for competition in DC is shifting. The precipitousdecline in participants’ assets at the height of the financial crisis raisedawareness of U.S. retirement readiness, which fell to 63 percent1 in2009/10, and elevated DC to an even more prominent position on em-ployer, participant and government agendas. The resulting changes inpriorities and preferences among these groups have profound implica-tions for industry players and will reshape the competitive environment.
Some of the current market trends were underway before the financialcrisis (see our 2007 paper Redefining Defined Contribution) and havenow accelerated. But there are a number of new realities looming, re-vealed by our post-crisis research, which included interviews withmore than 80 plan sponsors, industry experts, registered investment
Winning in the Defined Contribution Market of 2015: New Realities Reshape the Competitive Landscape
1 McKinsey’s Retirement Readiness Index (RRI) is a measure of household retirement preparedness, taking into accountSocial Security, DB plans and personal savings, including DC plans. To maintain their standard of living in retirement,households need an RRI of 100. The average household RRI is 63, which represents a 37% shortfall in income requiredat retirement.

2
advisors (RIAs) and consultants, as well as analysis based on our pro-prietary model of DC flows, assets and economics by products andsegments. Among our key findings:
• A new suite of target-driven solutions will account for 60 percent ofDC assets and revenues by 2015 and capture $1.7 trillion of flows.
• Investment choices and options will continue to be streamlined, tothe benefit of both participants and investment-only DC (IODC)providers. The latter will see their share of DC assets increase from43 to 50 percent.
• Cost, investment automation and demographics will drive a shift inasset allocation. Passive and target-drivensolutions will gain share at the expense of ac-tive U.S. equity and stable value.
• The blurring lines between tax code and sizesegments and large concentrations of flowswill force players to rethink how they seg-ment clients.
• Competition for shelf space will require salesmodels to become more institutional.
• Continued pricing and margin pressure will force recordkeepers andasset managers to retool their service and operating models.
• Finally, potential regulatory discontinuities across fees, advice, auto-IRA, default and escalation rates, and retirement income solutionswill threaten to reshuffle the balance of power within the industry.
These new realities will alter the traditional routes to success in DC.Asset gatherers – whether integrated recordkeepers, asset managers orwealth managers – that aspire to be leaders in the DC market of 2015will need to focus on these imperatives:
• Focus on the client segments and product categories that will benefitdisproportionately from the new market realities.
• Retool sales and operating models to counter margin pressure andmeet client demand for more institutional service.
Winning in the Defined Contribution Market of 2015: New Realities Reshape the Competitive Landscape
Asset gatherers that take actionnow on these imperatives
will continue to pull away from the pack; those that cannot adapt or continue to dabble
will be marginalized.

3
• Build new businesses in major growth categories.
Asset gatherers that take action now on these imperatives will continue topull away from the pack. Those that cannot adapt or continue to dabblewill be marginalized.
Winning in the Defined Contribution Market of 2015: New Realities Reshape the Competitive Landscape


5
The Largest Growth Opportunityfor Asset Gatherers
With over $4 trillion dollars in assets, DC is more
than four times the size of the market’s other growth
darling – ETFs – and on par with the global sovereign
wealth fund market. DC and IRA together represent
nearly one-third of U.S. household assets, more than
retail mutual funds held outside of DC plans and
ETFs combined.
DC’s growth story is also one of remarkable resilience through crises.While non-qualified flows typically turn negative during financial crisesand spike in times of prosperity, qualified flows are consistently positiveand roughly stable throughout the economic cycle (Exhibit 1, page 6).True to form, Americans kept saving in DC plans between 2007 and2009. Plan participation rates increased to 69 percent from 66 percent,and contribution rates remained roughly constant at around 7 percent ofparticipants’ wages. The crisis actually underscored for many Ameri-cans how woefully unprepared they are for retirement. This awareness,along with the growing adoption of auto-enrollment and auto-escalationprovisions, promises to deliver $1.9 trillion in DC contributions over thenext five years.
DC flows have also proven more persistent and “stickier” than other re-tail flows. The average holding period for a mutual fund in a DC plan issix to seven years, compared to three to four years in a traditional bro-kerage account.
Winning in the Defined Contribution Market of 2015: New Realities Reshape the Competitive Landscape

6 Winning in the Defined Contribution Market of 2015: New Realities Reshape the Competitive Landscape
2005
77
395
76
2006
40
2009
802
401
190
2007
Rest
Financial crisisTech bubble
DC
11
2008
93
200420032002
71
2000
79 86
309418
74
180
2001
66
(150)
412
878
472
254
53(48)75
504
388
18
459
Net flows to mutual funds$ Billions
Flows into DC are relatively stable and more resilient during market downturns
Exhibit 1
Source: Investment Company Institute, “The US Retirement Market, 2009”
Asset holdings – 2009$ Trillions
0.8
1.0
1.1
3.8
7.1
U.S. exchange traded funds
U.S. endowments and foundations
U.S. insurance companyGA reserves (outsourced)
Sovereign wealth funds
U.S. defined benefit 5.9
8.4
U.S. mutual funds (outside DC & IRA)
U.S. Individual retirement savings
Public 3.8
DC 4.1 IRA 4.3
Private 2.1
DC and IRA assets combined represent the largest asset management opportunity
Exhibit 2
Source: Federal Reserve Flow of Funds; ICI; NACUBO; Foundation Center; Sovereign Wealth Fund Institute

7
We expect DC to continue its remarkable track record of sustainable assetgrowth, reaching $5.5 trillion in assets by 2015. Together, DC and its sistermarket, IRA, represent the largest asset growth and flow opportunity in retailfinancial services (Exhibit 2). Most asset gatherers – integrated recordkeep-ers, asset managers and wealth managers – recognize the scale of the op-portunity and its vital importance to their growth aspirations, but thisawareness must be bolstered by an understanding of how fundamentally dif-ferent the market will look in five years.
Winning in the Defined Contribution Market of 2015: New Realities Reshape the Competitive Landscape


9
New Products, Distribution,Economics and Regulation Reshape the Competitive Landscape
On one level, DC competition appears stable and
almost clubby. Over the past five years, the com-
bined market share of the 10 largest recordkeepers
has increased from 52 percent to 59 percent, and
the 10 largest asset managers now hold 52 percent
of assets compared to 48 percent in 2003. How-
ever, a deeper analysis shows that the market is up
for grabs, with large pools of assets changing
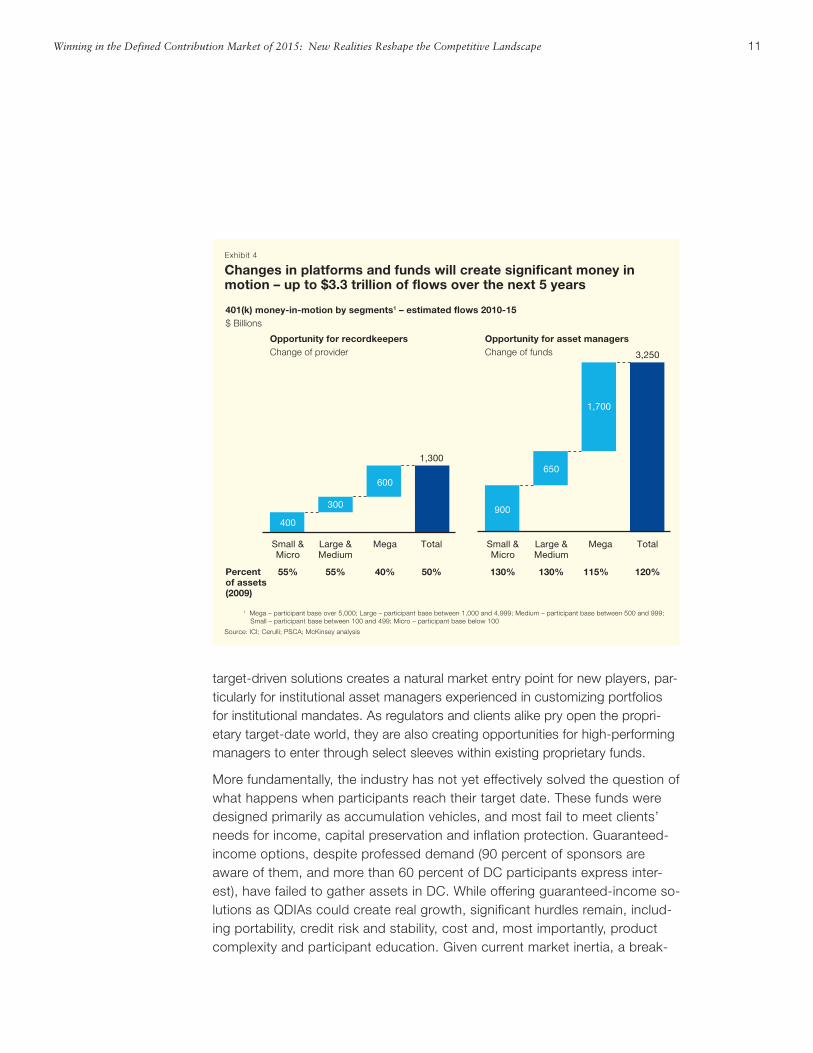
hands. Over the next five years, about $1.3 trillion
of 401(k) assets will change recordkeepers due to
plan switching. Another $3.3 trillion of assets will
be in play, moving to new investment vehicles or
strategies, as plans change providers for specific
asset classes and participants rebalance alloca-
tions. More fundamentally, seven trends will dra-
matically alter the competitive playing field.
Winning in the Defined Contribution Market of 2015: New Realities Reshape the Competitive Landscape

10
A new wave of target-driven solutions
The Pension Protection Act (PPA) of 2006 created a boom in target-date funds,which used their status as Qualified Default Investment Alternatives (QDIAs) tobecome the default choice for the majority of sponsors. Most of the assets ac-crued to integrated players. Over the next five years, we expect target-drivensolutions to capture $1.7 trillion of flows (Exhibit 5, page 12) and account for 60percent of all DC assets and revenues. But the competitive dynamics in target-driven solutions will undergo a revolution driven by plan sponsor demand, con-sultants and innovation. In the minds of many plan sponsors and consultants(as well as regulators), target-date funds failed to deliver during the financial cri-sis. This is opening the way for innovations, ranging from fully customized,open-architecture solutions (e.g., those incorporating non-correlated assetclasses or custom glide-paths) for large and mega plans to semi-customizedmulti-manager products, created from plan line-ups, for mid-sized to large plansto predominantly passive low-cost offerings for small plans. This new wave of
Winning in the Defined Contribution Market of 2015: New Realities Reshape the Competitive Landscape
Rest
Top 10
48%41%
2008
3.4
59%
2003
3.0
52%
52% 48%
2008
3.4
52%
2003
3.0
48%
Concentration of DC recordkeepers$ Trillions
Concentration of DC asset managers$ Trillions
Top 10 recordkeeping and asset management players have collectively gained share over the past 5 years
Exhibit 3
Source: Pensions & Investments; Plansponsor
11
target-driven solutions creates a natural market entry point for new players, par-ticularly for institutional asset managers experienced in customizing portfoliosfor institutional mandates. As regulators and clients alike pry open the propri-etary target-date world, they are also creating opportunities for high-performingmanagers to enter through select sleeves within existing proprietary funds.
More fundamentally, the industry has not yet effectively solved the question ofwhat happens when participants reach their target date. These funds weredesigned primarily as accumulation vehicles, and most fail to meet clients’needs for income, capital preservation and inflation protection. Guaranteed-income options, despite professed demand (90 percent of sponsors areaware of them, and more than 60 percent of DC participants express inter-est), have failed to gather assets in DC. While offering guaranteed-income so-lutions as QDIAs could create real growth, significant hurdles remain, includ-ing portability, credit risk and stability, cost and, most importantly, productcomplexity and participant education. Given current market inertia, a break-
Winning in the Defined Contribution Market of 2015: New Realities Reshape the Competitive Landscape
400
1,300
600
300 900
Total
3,250
Mega
1,700
650
Large &Medium
Small &Micro
TotalMegaLarge &Medium
Small &Micro
Percentof assets(2009)
40%55%55% 50% 115%130%130% 120%
401(k) money-in-motion by segments1 – estimated flows 2010-15$ Billions
Opportunity for recordkeepers Change of provider
Opportunity for asset managers Change of funds
Changes in platforms and funds will create significant money in motion – up to $3.3 trillion of flows over the next 5 years
Exhibit 4
1 Mega – participant base over 5,000; Large – participant base between 1,000 and 4,999; Medium – participant base between 500 and 999; Small – participant base between 100 and 499; Micro – participant base below 100
Source: ICI; Cerulli; PSCA; McKinsey analysis

12
through in guaranteed-income solutions likely hinges on a few large-plansponsors adopting them or meaningful regulatory intervention that alleviatesconcerns and dispels the wait-and-see attitude of plan sponsors. Innovatorsthat overcome these barriers and create target-driven solutions (e.g. target-date, target-return, target-risk, target-income, target-inflation, guaranteed-in-come) can expect significant rewards in the years ahead.
Fewer options but more competition
Plans will continue to streamline and simplify fund line-ups, driven largely bythe guidance of pension and investment consultants. While less is more forparticipants (research shows that too many choices lead to sub-optimal par-ticipant choices2), it also heightens competition among asset managers fordiminishing shelf space, but with larger ticket sizes. The trend toward simplifi-
Winning in the Defined Contribution Market of 2015: New Realities Reshape the Competitive Landscape
Other2
GIC/stable value
Fixed income
Equity
Balance/target risk
Target date
38%
16%
12%
13%
2015F
5.4 6.0
35 40%
15 20%
20 25%
6 8%5 7%
7 10%
2009E
4.1
11%
10%1,375
370
845
335
275
295
DC assets $ Trillions
DC cumulative net flows1 (2010-15)$ Trillions
By 2015, target-date funds are set to emerge as the largest asset class, capturing nearly 40% of assets and majority of the flows
Exhibit 5
1 Excludes other DC (profit-sharing plans, money purchase plans and stock bonus plans)
2 Includes company stock and assets held through brokerage window
Note: Asset growth of target-date and balanced/target-risk funds are driven by flows from: (i) Auto-enrollment and presence as default option, (ii) Participants switching assets to target-date funds and (iii) Reenrollment/re-mapping when sponsors change DC providers (on average, every year 6-7% of DC assets change recordkeeper)
Source: ICI; EBRI; PSCA; Vanguard; McKinsey analysis
2 See, for example: Sheena Iyengar and Emir Kamenica. “Choice proliferation, simplicity seeking and asset allocation,” Journal of PublicEconomics (April 2010).

13
cation will force asset managers to specialize more, deliver a clear valueproposition around a narrower band of asset classes and solutions, and raisethe bar for investment performance (Exhibit 6).
The streamlining of investment options coupled with the shift to open-archi-tecture in target-date funds will create significant growth opportunities forIODC managers. By 2015, we expect their share of DC assets to increasefrom 43 percent to 50 percent, surpassing the share of proprietary managers.However, this growth will not be uniform.
Major shifts in investor asset allocation driven by cost,automation, and demographics
For much of the past two decades DC investment allocations benefitedactive equity managers. Now, a confluence of trends (e.g., sponsors’ fidu-ciary and cost concerns; the growth of QDIA solutions) is redirecting someof these flows to lower-fee, passive solutions. We expect the share of
Winning in the Defined Contribution Market of 2015: New Realities Reshape the Competitive Landscape
Average number of funds in DC line-ups
2010E0
1998
10
18
11
20082006200420022000
17
16
15
14
13
12
19“We’re trying to simplifyour line up. For example, we’re consolidating our three foreign equity funds into onemulti manager ‘foreign active equity’ option to make choice easier for participants.”
Mega sponsor
“Sponsors are realizing that ‘less is more’, reducing bloated investment menus to a manageable number of funds participants can understand.”
Pension Consultant
The average number of funds in DC line-ups is starting to declineExhibit 6
Source: PSCA Profit Sharing 401(k) Survey; McKinsey interviews of DC sponsors

14
passive assets in DC plans to double by 2015 to 25 percent. ETFs mightbenefit from this movement, but they are starting from near-zero assetstoday (mostly in small/micro segments). Up-take in broader DC segments is likely to belimited in the next one to two years, due pri-marily to limited sponsor and consultantawareness and a lack of revenue-sharing and12b1 fees in most cases, although this maychange going forward.
While DC asset allocation historically has beenlargely immune to demographics (largely dueto participant inertia), automated rebalancingof asset allocation in target-driven solutionsand the aging of the population will changethis dynamic. By 2015, nearly 70 percent ofassets will be held by individuals at or withinfive years of their “target date” for retirement. This shift will create signifi-cant growth opportunities, particularly for fixed-income managers and in-come-oriented equity managers. Active equity managers, after twodecades of benefiting from DC growth, will be on the short end of this tril-lion dollar shift. (They may be able to withstand the pressure by branchinginto equity income or international equities.) Stable value managers willalso suffer, but to a lesser extent.
Blurring of lines between tax codes and size segments forces arethinking of segmentation
With the lines between tax codes and size segments blurring, pressure onthe traditional owners of these segments will increase, as outside playersseek new avenues for growth. For example, after a long journey, the 403(b)world now resembles the 401(k) world. This transformation was initiallydriven by regulatory reform (e.g., new requirements to maintain written plandocuments for each provider; ability of plan sponsors to terminate plans;employer contributions subject to all non-discrimination tests that apply to401(k) plans; prohibition of purchase of life insurance in 403(b) plans) andmore recently by the shift to a single recordkeeper environment, open archi-tecture, and the increasing role of pension consultants. Similarly, the linesbetween size segments within the 401(k) world are breaking down, assponsors of all sizes increasingly demand similar solutions (e.g., open archi-
Winning in the Defined Contribution Market of 2015: New Realities Reshape the Competitive Landscape
Segmentation in DC is also being shaped by stark contrasts
in flows. Small and mid-size plansand K-12, for example, will
experience inflows, driven byincreased (and automatic)
enrollment; mega plans by contrastwill suffer $200 billion in outflows,
owing to an older workforce.

15
tecture, participant advice), opening every segment to competition andforcing players to think beyond traditional size and tax code segments tobuild an advantage.
Segmentation in DC is also being shaped by stark contrasts in flows. Smalland mid-size plans and K-12, for example, will experience inflows, drivenby increased (and automatic) enrollment and workforces; mega plans bycontrast will suffer $200 billion in outflows, owing to an older workforce.
Shrinking shelf space requires sales models to become moreinstitutional
The shift from DB to DC as the primary retirement plan for employers,heightened fiduciary and cost concerns, and the increasing complexity ofDC rules and solutions are leading plan sponsors to turn more often to pen-sion consultants for guidance on a broader set of issues from recordkeeperselection to plan design and investment choices. In parallel, employers are
professionalizing their decision-making, involvingfinance, treasury and procurement functions atthe expense of human resources. These trendsare leading to more sophisticated plan design,rigorous decision-making, in-depth due dili-gence, and increasingly stringent and formalizedstandards for providers in both asset manage-ment and recordkeeping. DC is becoming an in-stitutional game, requiring deep relationshipswith pension and investment consultants andother influencers, as well as more embeddedand senior relationships with sponsors across all
involved functions. Asset managers and recordkeepers will need to trans-form their sales models and capabilities to succeed.
Continued margin pressure forces players to adapt their models
Commoditization is pressuring already razor-thin margins for recordkeep-ers. The looming resurgence of per-participant flat fees, which could comeas a consequence of new fee disclosure regulation, could provide some re-lief, but would also dampen upside revenue potential. These factors paint afairly grim view of recordkeeping as a source of growth. We project thatrecordkeeping’s share of DC revenues will shrink from 11 percent today to8 percent by 2015. The asset management side faces similar, albeit less
Winning in the Defined Contribution Market of 2015: New Realities Reshape the Competitive Landscape
DC is becoming an institutionalgame, requiring deep relationships
with pension and investmentconsultants and other influencers,as well as more embedded and
senior relationships with sponsorsacross all involved functions.

16
dire, pressures, as sponsors shift to lower-fee solutions such as institutionaland passive vehicles. This trend, which has been underway in the large andmega plan segments for some time, is now moving to smaller sponsor seg-ments. As a result, institutional vehicles already represent 50 percent of as-sets under management (AUM).
Regulatory discontinuities threaten to reshuffle the industry’sbalance of power
DC was born 30 years ago as an unintended tax loophole and has since ben-efited from the broad trend in regulation and policy that has shifted responsi-bility for retirement savings to the individual. However the regulatory andpolicy framework has not kept pace, and millions of Americans are still under-prepared. Our analysis of consumers’ balance sheets in 2009 indicated thatthe average American family faced a 37 percent shortfall in the income theywill need in retirement.3
In light of this shortfall, Congress, as well as the Department of Labor andother regulatory bodies, are considering revisions in retirement regulation.Among the multitude of proposals put forward,five in particular could significantly alter the com-petitive landscape for DC.
First, the introduction of auto-IRAs could have amaterial impact on small plan providers (e.g.,Simplified Employee Pension plans, Savings In-centive Match Plans for Employees of Small Em-ployers, micro 401(k)s), increasing participation by40 million and funneling over $100 billion into DCover the next five years. Second, increasing auto-default and escalation thresholds could direct anadditional $90 billion into DC by 2015 (and dra-matically improve Americans’ retirement readi-ness). Third, proposals around greater feedisclosure (e.g., displaying absolute dollar amounts to participants) could in-duce a shift to flat per-participant recordkeeping fees and away from rev-enue-sharing models with asset managers, making recordkeeper economics
Winning in the Defined Contribution Market of 2015: New Realities Reshape the Competitive Landscape
1 McKinsey’s Retirement Readiness Index (RRI) is a measure of household retirement preparedness, taking into account SocialSecurity, DB plans and personal savings, including DC plans. To maintain their standard of living in retirement, households needan RRI of 100. The average household RRI is 63, which represents a 37% shortfall in income required at retirement.
The adoption of any of theseregulatory measures could
significantly impact who wins andwho loses in DC, just as the PPA
changed competitive dynamics byproviding safe-harbor protectionfor the adoption of target-date or
target-risk solutions as QDIAs.

17
more stable but capping their upside. Fourth, decisions regarding who canprovide advice – and how they can provide it – could shift the balance ofpower between recordkeepers, asset managers and advisors to those withaccess to participants. Finally, a decision on whether to make retirement in-come solutions QDIAs or to require one in every plan could provide an entrypoint for manufacturers with annuity capabilities and dramatically shift aplan’s typical allocation. This would also greatly reduce the IRA opportunity,dramatically changing the economics for integrated recordkeepers. Theadoption of any of these regulatory measures could significantly impact whowins and who loses in DC, just as the PPA changed competitive dynamicsby providing safe-harbor protection for the adoption of target-date or target-risk solutions as QDIAs.
Winning in the Defined Contribution Market of 2015: New Realities Reshape the Competitive Landscape


19
To Win in the DC Market, Asset Gatherers Must Refocus,Retool and Innovate
In the past, when change was more incremental, asset
gatherers could focus on near-term execution and op-
erational improvement in DC. This approach will not
suffice any longer. Players must develop convictions
about where the DC market is heading and decide
where and how to execute against those convictions.
For example, the choice of which client segments to
target can have $100 billion in implications on flows.
Likewise, the shift to an institutional sales model and
pricing will have a meaningful impact on the structure
and value-added of current retail-oriented sales mod-
els. Investments in innovative target-driven solutions
today may yield outsize rewards five years from now
(while lack of investment could mean being shut out of
the market). Decisions about product emphasis might
position a firm squarely in the midst of massive new
flows or leave it on the sideline, desperately holding
onto depleting assets. Changes in DC that seem incre-
mental will turn out to be profound in five years’ time.
Winning in the Defined Contribution Market of 2015: New Realities Reshape the Competitive Landscape

20
For asset gatherers to emerge as leaders in the DC market of 2015 theymust refocus their portfolios on clients and products that will be dispropor-tionately valuable; retool core businesses to withstand margin pressure; andbuild new businesses that leverage core capabilities.
Refocus the portfolio
“Double down” on the one or two client segments that can be “owned” andthat will benefit from market trends. Even today, leading recordkeepers andDC-focused asset managers consistently own one or perhaps two segments,while laggards overextend themselves. And too many players focus on themega 401(k) space, which is overserved and offers increasingly thin marginsand negative growth prospects, compared to other segments. Between 2010and 2015, mega 401(k) plans will experience close to $200 billion in negativenet flows, while all other 401(k) segments will see $190 billion in positiveflows. The smaller size 401(k) markets are often less crowded and typicallyfaster-growing, but to be competitive and profitable, players must havelower-cost distribution models.
To win in a DC environment of blurring tax code lines and client needs,recordkeepers and asset managers must rethink how they segment (e.g.,employer behaviors, workforce characteristics) and leverage new segmen-tation models as a differentiator. For example, players with distinct capa-bilities in attractive verticals (e.g., law firms, banks, high-tech) coulddevelop tailored service offerings in an effort to become the provider ofchoice. Providers could also customize services to reflect the needs of theworkforce of a given segment. For instance, they could offer paperlesssolutions and online features that meet the needs of sponsors who wantlower-fee options and provide participants with easy access to technologyat the worksite.
Build specialist asset management expertise on the right product flow cate-gories. To win in the new DC environment, asset managers must fight theurge to be all things to all people and instead distinguish themselves withinspecific asset classes and adapt to the growing institutionalization of DC.Fixed-income and passive managers will benefit from shifts in the DC market.Others, especially active equity players, should aim for distinctiveness in se-lect categories (e.g., equity income). The goal should be to “own” an assetcategory, preferably in a big flow category, and to adapt the portfolio in areasthat are under pressure (e.g., from U.S. equity to equity income).
Winning in the Defined Contribution Market of 2015: New Realities Reshape the Competitive Landscape

21
Retool the core businesses
Build institutional-strength distribution and investment capabilities to accessscarcer, more valuable shelf space. From both a product and distributionstandpoint, the DC business has historically sat awkwardly between the retailand institutional worlds, incorporating elements of both. If anything, DC hasseemed more retail than institutional. Now, however, DC is clearly leaning tothe institutional side, both in vehicle choices and sales models, and futurewinners will be those that can adapt to this shift. Asset managers andrecordkeepers must develop new sales approaches and coverage models toeffectively address the demands of CFOs and treasury and procurementfunctions, as well as the advice of sophisticated consultants and RIAs.Recordkeepers will need be more than pure transactional service providersand proactively help sponsors with decision-making and services. Similarly,to expand and maintain their client base, both recordkeepers and asset man-agers must invest in building relationships with consultants, as winning thetrust of sponsors’ new “right arms” will be critical.
Develop a low-cost operating model and optimize pricing to counter marginpressure and reflect true cost-to-serve. Configuring a low-cost operatingmodel will be a prerequisite for recordkeepers and integrated players alike.In the past, firms have focused on scale as defined by assets alone to keepcosts in check, but this strategy will no longer suffice. Revenue pressuresare leading many recordkeepers – even those at scale – to take on newbusiness at or below cost. These pressures demand a more disciplinedand sophisticated approach, which could include standardizing offers tocreate true scale, eliminating customization wherever possible, outsourcingand offshoring, applying lean principles to eliminate wasted effort, and ag-gressively moving to e-delivery, self-service models and service delivery tai-lored to specific segments. Even the largest players will need to adapt toremain competitive.
Disciplined pricing is a necessary complement to cost containment. Histori-cally, the industry has offered standardized pricing structures that did not re-flect the value-added to each plan, i.e., they did not account for the level ofcustomization, types of solutions, participant balances or roll-over retention.To succeed, firms must build processes to measure each plan’s profitabilityand understand the true cost of different services and customization. This willallow them to devise a pricing strategy that is competitive but profitable,while communicating the full value of their services to clients.
Winning in the Defined Contribution Market of 2015: New Realities Reshape the Competitive Landscape

22
Build new businesses – or innovate in existing ones
Build new business lines in target-driven solutions. The goal of innovation inDC until now has been to have a perfect theoretical answer from an invest-ment or actuarial point of view. The results have often been large, compli-cated prospectuses and little in assets. To win, players must now wrestlewith thorny investment and risk issues, such as protecting against inflation ortargeting a safe return or income stream, while innovating in marketing (mak-ing the complicated simple) and nudging consumers to overcome their be-havioral biases (e.g., inertia, familiarity bias). Working with employers will beparticularly critical in a market where adoption of new solutions is heavily de-pendent on a few large-scale plans acting as trendsetters. Winners will alsoneed to anticipate and adapt quickly to regulatory changes.
Build better capabilities for capturing the IRA rollover. DC has historicallybeen thought of as an asset accumulation vehicle, with profits derived duringthe accumulation phase. But winning integrated recordkeepers will now useDC as a client acquisition platform to capture economic value throughoutparticipants’ lifetimes. Industry economics will shift dramatically by 2015.Driven by margin pressure and increasing IRA rollovers, recordkeeping rev-enues will drop from 11 percent of DC revenue pools to just 8 percent, whileIRA rollovers will jump from 18 percent to 23 percent of revenue (Exhibit 7).
Winning in the Defined Contribution Market of 2015: New Realities Reshape the Competitive Landscape
Recordkeeping
Revenue sharing
Advice
IRA rollover
Asset Management
2015E
11.2
69%
23%
1%0%8%
2008
7.9
68%
18%0%2% 11%
Illustrative revenues pools for mega 401(k) plan segment$ billions
Economics in the DC industry will continue to shift towards asset management and IRA rollovers versus traditional record keeping
Exhibit 7
Source: McKinsey analysis

23
Players must rethink how they assess and capture the value of recordkeepingplatforms, viewing them as client acquisition engines to attract rollovers anddeliver a broader set of solutions to individual participants. Integrated record-keepers must take a holistic view of the economics that drive platform, assetmanagement and IRA revenues and tie these economics to execution realities(e.g., actual, rather than aspirational, roll-over rates).
DC recordkeepers will also need to execute better to take advantage of therollover opportunity. While some firms have increased their capture rate toabove 50 percent, the industry average is only 25 percent, which translates intohundreds of billions of dollars in leakage to retail wealth firms. Recordkeepersneed to transform their pricing structures, redesign their rollover processes,align their product and service offerings, redesign incentives and structure theirorganizations to deliver a lifetime value proposition to plan participants.
The leakage from DC platforms will account for over half of the net flows into re-tail and will be the largest “money in motion” event for the next five years. Mostretail wealth firms cannot state what their “fair share” of IRA rollovers might beand are under-resourced for the opportunity. The leaders, however, are alreadybuilding a deep understanding of participant trigger points, tailored solutions toaccompany clients in their journey from asset accumulation to asset disaggrega-tion, and most importantly, world-class processes, as cycle times and client ex-perience are often the primary drivers of rollover capture rates.
* * *The stakes in the DC market have never been higher. The financial crisis andensuing recession have focused the attention of sponsors, participants and thegovernment on the crucial role DC plans play in ensuring retirement security formillions of Americans. This scrutiny will lead to regulatory changes that willalter the competitive landscape in both predicable and unpredictable ways. Inaddition, a confluence of trends – some new, some of older vintage –are fur-ther reshaping the DC market. In this shifting environment, marginal assetmanagers and recordkeepers will struggle to gather assets and miss out onone of the largest growth opportunities of this decade. Even more establishedinstitutions will need to take timely action to continue to thrive. Players thatmove in and out of the market or that are seen as potential transaction candi-dates will lose credibility, whereas those with a clear and long-term commit-ment to the retirement market and an attractive value proposition for sponsorsand participants will solidify their lead.
Winning in the Defined Contribution Market of 2015: New Realities Reshape the Competitive Landscape

24
Appendix I
A closer look at DC market growth andeconomics across products and segments
McKinsey & Company’s proprietary Defined Contribution Model offersunique insights into inflows, outflows, assets and economics at the taxcode (e.g., 401(k), 403(b), 457), segment (micro, small, mid-size, large,mega, K-12, higher education, healthcare), asset category (e.g., target-date, domestic equities, international, fixed-income) and management style(e.g., passive, active) levels. In addition, the model provides information re-garding assets changing hands annually, both on the recordkeeping andasset management sides, and the market share of different player types(e.g., integrated, IO, pure recordkeepers). Among the insights generatedfrom this research:
Flows and assets
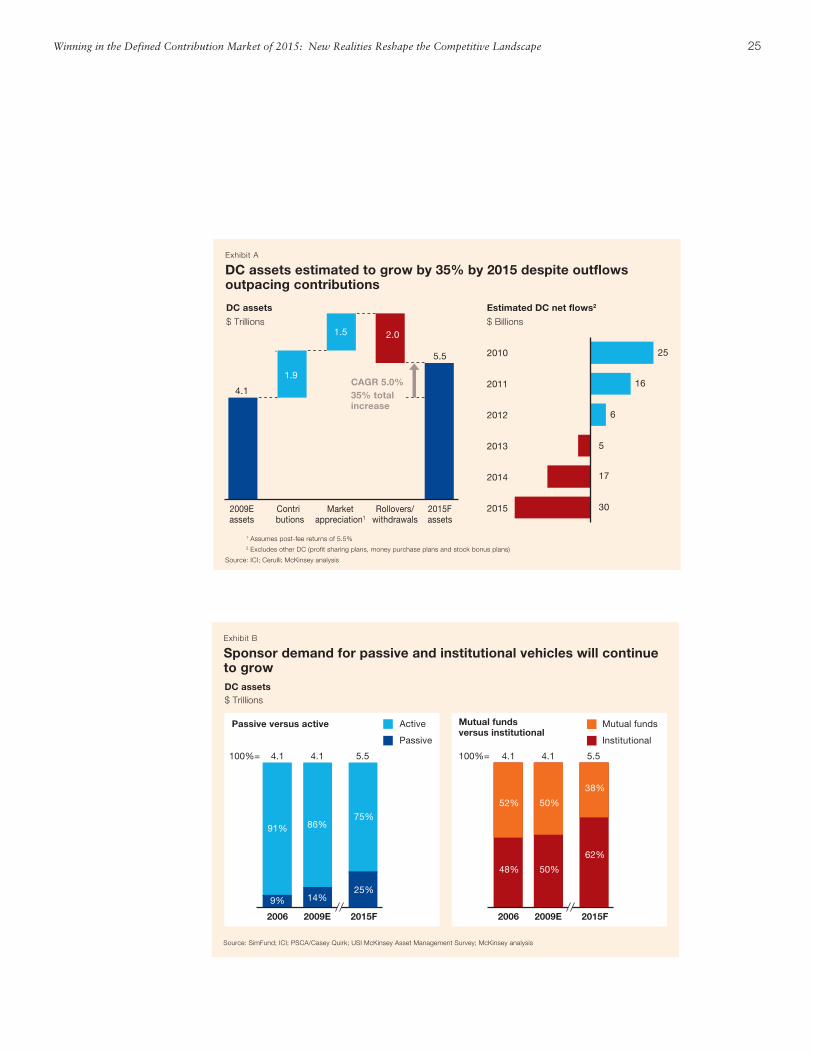
DC assets will total $5.5 trillion by 2015 (Exhibit A). Over the next fiveyears, the DC market will cumulatively grow by 35 percent, reachingclose to $5.5 trillion in assets under management (AUM) by 2015. Thisgrowth will occur despite net outflows beginning in 2013 (primarily frommega plans) and is based on a conservative market appreciation of 5.5percent (post-fee).
Solution and management style shifts
Asset allocation funds will capture the lion’s share of net flows. As the QDIAof choice, target-date funds (TDFs) will capture the vast majority of DC netflows. By 2015, TDFs will see $1.4 trillion of cumulative net flows and control40 percent of DC AUM.
Traditional equities and stable-value/GICs will lose ground. Equities areprojected to experience over $800 billion in net outflows over the next fiveyears. Similarly, GIC/stable-value products will cumulatively lose over $250billion of assets.
There will be a shift to passive assets (Exhibit B). Passively-managed prod-ucts are expected to account for up to one-fourth of all DC assets by 2015,up from only 9 percent in 2006.
Winning in the Defined Contribution Market of 2015: New Realities Reshape the Competitive Landscape
25Winning in the Defined Contribution Market of 2015: New Realities Reshape the Competitive Landscape
Rollovers/withdrawals
Marketappreciation1
1.5
5.5
2015Fassets
Contributions
1.9
2009Eassets
4.1
2.0
30
17
5
6
16
25
2015
2014
2013
2012
2011
2010
CAGR 5.0% 35% total increase
DC assets
$ Trillions
Estimated DC net flows2
$ Billions
DC assets estimated to grow by 35% by 2015 despite outflows outpacing contributions
Exhibit A
1 Assumes post-fee returns of 5.5%
2 Excludes other DC (profit sharing plans, money purchase plans and stock bonus plans)
Source: ICI; Cerulli; McKinsey analysis
91% 86%
Passive
Active
2009E
4.1
14%
2006
4.1100%=
9%
Passive versus active
75%
2015F
5.5
25%
52%
2009E
4.1
2006
4.1100%=
48%
50%
50%
38%
62%
2015F
5.5
Institutional
Mutual fundsMutual funds versus institutional
DC assets $ Trillions
Sponsor demand for passive and institutional vehicles will continue to grow
Exhibit B
Source: SimFund; ICI; PSCA/Casey Quirk; USI McKinsey Asset Management Survey; McKinsey analysis

26
Sponsor demand for institutional vehicles will increase. Institutional vehi-cles will grow at the expense of mutual funds, reaching 62 percent of DCassets in 2015, up from 48 percent in 2006.
Segments
Small/micro and mid/large will be the fastest-growing 401(k) segments (Ex-hibit C). Small/micro and mid/large plans are projected to grow assets atabout 7.5 percent over the next five years versus 3.5 percent growth formega plans. The growth of smaller plans will be driven by new plan cre-ation and the adoption of auto-enrollment.
Mega 401(k) plans will experience negative net flows and continued pres-sure on economics. Over the next five years, retiring baby boomers will beresponsible for approximately $200 billion in net outflows from mega plans.This contrasts with $70 billion and $110 billion in net inflows, respectively,for large/mid and small/micro plans. The gap between mega and smallerplans is the result of larger rollover balances in mega 401(k) plans, due tohigher per-participant asset balances.
Not-for-profit, K-12 and healthcare segments will experience faster growth.Between 2010 and 2015, K-12 and healthcare plans are projected to growabout 6 percent, as opposed to 5 percent for higher education plans.Faster growth in K-12 and healthcare will be driven by higher workforceand participant growth.
Economics
Asset management revenue margins will remain stable despite the shiftto passive and institutional investments (Exhibit D). Despite the increas-ing shift to lower-fee passive and institutional vehicles across variousasset classes, overall DC revenue margins are projected to remain rela-tively stable. Rising allocations to target-date/target-risk/balancedproducts, which typically command higher fees, will offset the move tolower-fee products.
Recordkeeping margins will face continued pressure. Per participantrecordkeeping revenues have dropped by about 30 percent since the cri-sis, severely squeezing margins.
Winning in the Defined Contribution Market of 2015: New Realities Reshape the Competitive Landscape

27Winning in the Defined Contribution Market of 2015: New Realities Reshape the Competitive Landscape
2015E
2009E
Percent of DC assets
43
76
63
43
9
39
6258
38
9
Fixedincome
Stablevalue
Equity Balanced/Target risk
Target date
12 6 16 7 38 24 10 17 11 38
44 42
Overall DC
Average DC asset management revenue margins
Basis points of assets managed
Overall margins will remain roughly constantExhibit D
Source: SimFund; ICI; PSCA/Casey Quirk; USI McKinsey Asset Management Survey; DC Sponsor interviews; McKinsey analysis
401(k)1
403(b)
0 50
~(10)
~0
~0
~(10)
~100
50 100
~(200)
175
30
150
225
300
700
500
1,500
457
Other
Healthcare
K 12
Higher Ed
Small & Micro
Large & Medium
Mega
~8
~0
~6
5 6
~5
7 8
7 8
3 4
2009 DC assets $ Billions Net flows
2010 15
CAGR 2009-15Percent
DC outflows will be primarily in the mega 401(k) segment; large-medium and small-micro 401(k) will continue to experience positive net inflows
Exhibit C
1 Mega – participant base over 5,000; Large – participant base between 1,000 and 4,999; Medium – participant base between 500 and 999; Small – participant base between 100 and 499; Micro – participant base below 100
Source: ICI; EBRI; Cerulli; Spectrem Group; Vanguard; McKinsey analysis
28
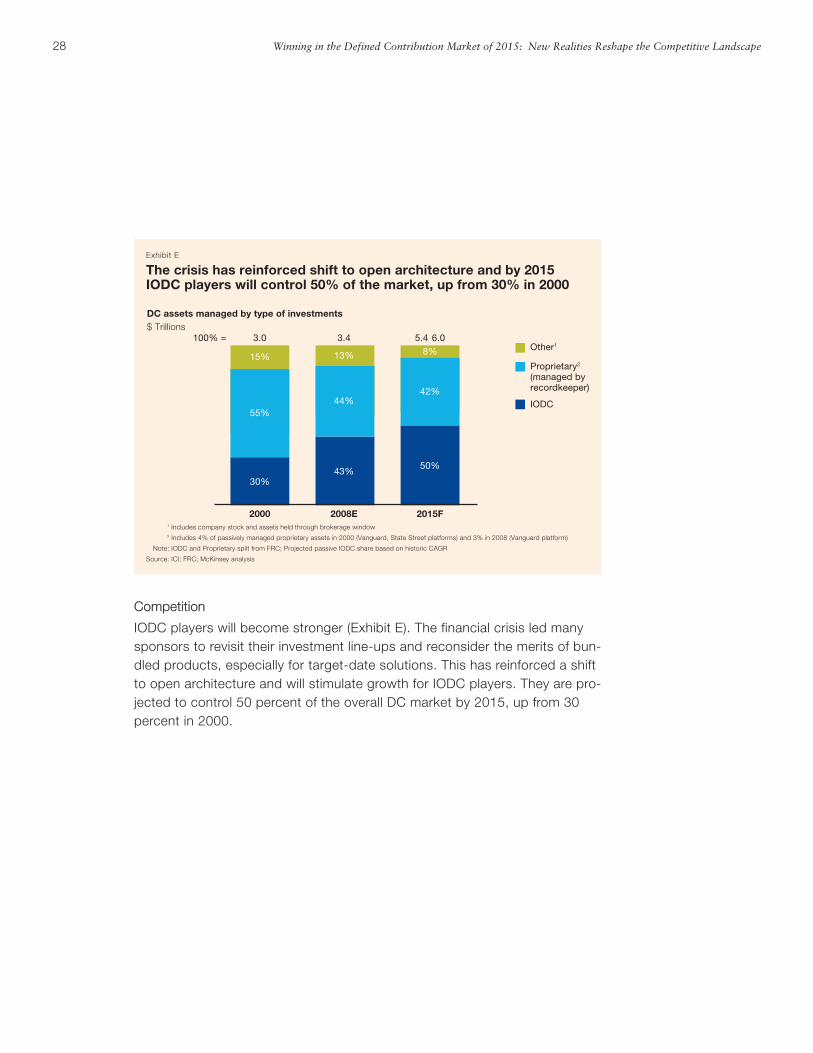
Competition
IODC players will become stronger (Exhibit E). The financial crisis led manysponsors to revisit their investment line-ups and reconsider the merits of bun-dled products, especially for target-date solutions. This has reinforced a shiftto open architecture and will stimulate growth for IODC players. They are pro-jected to control 50 percent of the overall DC market by 2015, up from 30percent in 2000.
Winning in the Defined Contribution Market of 2015: New Realities Reshape the Competitive Landscape
55%44%
42%
15% 13% 8%100% =
2015F
5.4 6.0
50%
2008E
3.4
43%
2000
3.0
30%
Other1
Proprietary2
(managed by recordkeeper)
IODC
DC assets managed by type of investments$ Trillions
The crisis has reinforced shift to open architecture and by 2015 IODC players will control 50% of the market, up from 30% in 2000
Exhibit E
1 Includes company stock and assets held through brokerage window
2 Includes 4% of passively managed proprietary assets in 2000 (Vanguard, State Street platforms) and 3% in 2008 (Vanguard platform)
Note: IODC and Proprietary split from FRC; Projected passive IODC share based on historic CAGR
Source: ICI; FRC; McKinsey analysis

29
Appendix II
The IRA race: A battle for the largest non-cash opportunity in wealth management
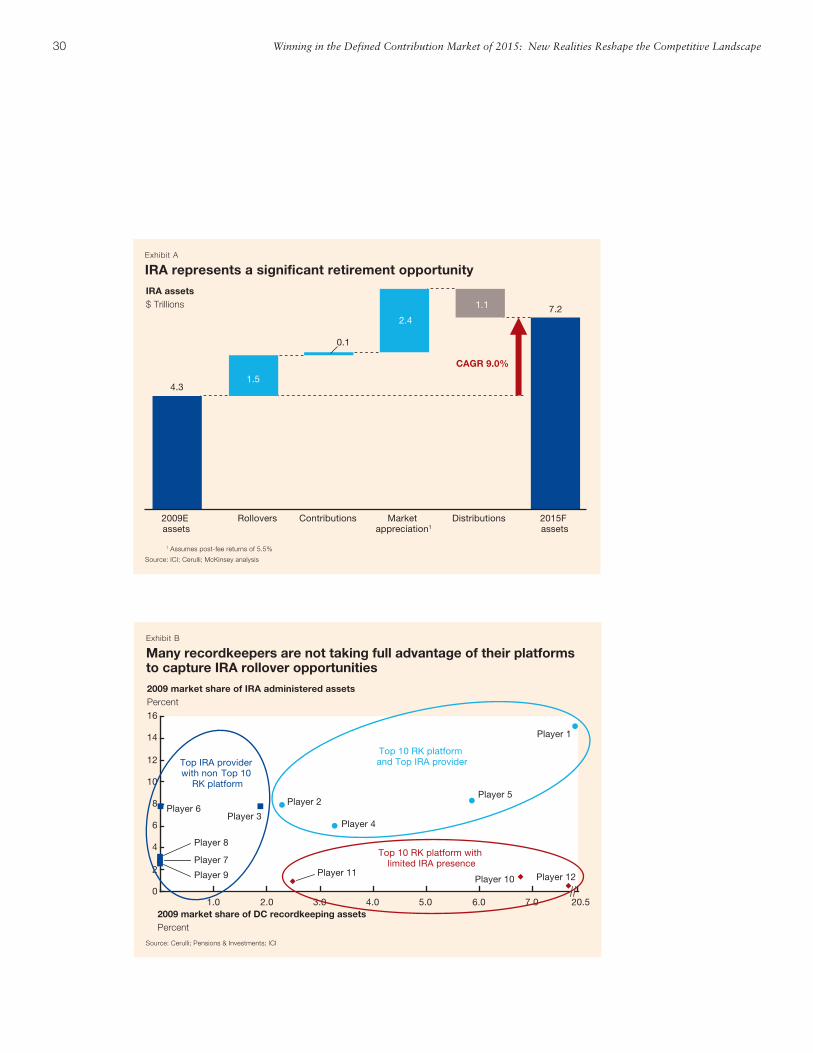
Thanks to massive rollovers from retiring baby boomers, IRA is the singlelargest non-cash opportunity in wealth management today. More than $1.5trillion will roll over in the next five years, which translates into $30 billion ofbottom line value over the lifetime of these participants. And the game is verymuch still open. Despite the formidable advantage of owning a recordkeepingplatform and the relationship on the DC side, many platforms have failed tocapture these advantages, with wealth managers across the spectrum – fromRIAs to wirehouses, independents and regional broker dealers – benefiting.
A race for these assets will emerge between platforms and other wealth players.Winners will leverage their brand and market presence, their ability to identifyand funnel leads, a seamless process, and high-quality solutions and advice.
• With $4.3 trillion in assets today and an expected $1.5 trillion in rolloversover the next five years, the IRA market will reach a staggering $7 trillion by2015. Every percentage point of DC market share represents a $40 millionannual bottom-line opportunity, as the average lifetime profitability of thecustomer is $2,000 and two million participants roll over an average of$50,000 every year from DC (Exhibit A).
• Despite the formidable advantage of owning a rollover platform, most of thetop IRA providers do not have a DC recordkeeping platform. Every year, 73percent of assets continue to leak from platform providers that have failedto capitalize on their scale in DC (Exhibit B). However, while on average DCrecordkeepers retain only 27 percent of assets rolled into an IRA from theplans they administer, best-in-class players retain over 50 percent.
To capture their fair share of the rollover opportunity IRA providers can takethe following actions:
• Develop creative solutions that address sponsors’ concerns about propri-etary product push. Sponsors are often unwilling to grant recordkeepers di-rect access to participants’ rollover assets, mainly due to concerns aboutproviders pushing proprietary products. At the same time, some sponsors
Winning in the Defined Contribution Market of 2015: New Realities Reshape the Competitive Landscape
30 Winning in the Defined Contribution Market of 2015: New Realities Reshape the Competitive Landscape
CAGR 9.0%
2.4
1.54.3
1.1
Contributions 2015F assets
7.2
Distributions Rollovers2009E assets
Market appreciation1
0.1
IRA assets $ Trillions
IRA represents a significant retirement opportunityExhibit A
1 Assumes post-fee returns of 5.5%
Source: ICI; Cerulli; McKinsey analysis
0
2
4
6
8
10
12
14
16
3.0 4.0 5.0 6.0 7 0 20.52.01.0
Player 12Player 11Player 10Player 9
Player 8
Player 7
Player 6
Player 5
Player 4Player 3
Player 2
Player 1
2009 market share of IRA administered assetsPercent
2009 market share of DC recordkeeping assetsPercent
Top 10 RK platform and Top IRA providerTop IRA provider
with non Top 10 RK platform
Top 10 RK platform with limited IRA presence
Many recordkeepers are not taking full advantage of their platforms to capture IRA rollover opportunities
Exhibit B
Source: Cerulli; Pensions & Investments; ICI

31
prefer participants to keep their assets in the plan to help keep plan costslow (because of asset-based revenue sharing). Providers should think cre-atively about solutions. For example, they could promote product-agnosticalliances that address fiduciary concerns about product push. Further-more, providers could develop a model of revenue-sharing that wouldallow sponsors to participate in the upside from participants’ IRA rollovers.
• Build participant relationships early and make the most of each interaction.Recordkeepers should try to make the most of each participant interactionto drive awareness of their product offering and rollover capabilities.Recordkeepers can foster proactive dialogue about additional services androllover when new participants open accounts and should continue this di-alogue every time the participant calls in. This requires service staff to betrained (and incentivized) to identify “leads” and seamlessly transition serv-ice conversations into broader IRA rollover discussions.
• Overcome participant inertia by developing solutions with built-in rolloversand seamless processes. Participant inertia often leads to deferment ofthe decision to roll over assets and leaves them with the DC sponsor.Recordkeepers can tackle this challenge by creating automatic rolloversfor employees at retirement (e.g., into IRA accounts that mirror partici-pants’ 401(k)s). Asset managers could develop QDIA products that auto-matically roll participant assets into an income-focused IRA on retirement.In addition, rollover processes should be streamlined (e.g., avoid or deferthe need to provide time-consuming information; allow users to “save andexit” instead of forcing them to restart the process from scratch if they exittemporarily) to avoid leakage of assets.
• Leverage brand and market presence to gain participant mindshare. Whileleveraging institutional relationships with sponsors to initiate conversationswith participants, recordkeepers and asset managers should not neglectthe importance of building a strong retail brand. Because of the reluctanceof many sponsors to grant direct access to participants, many partici-pants will be forced to choose an IRA provider from among the retailproviders they have come to know through their own experience. Invest-ing in a strong brand image focused on retirement will be important incompeting for DC assets that are rolling over.
Winning in the Defined Contribution Market of 2015: New Realities Reshape the Competitive Landscape
About McKinsey & Company
McKinsey & Company is a management consulting firm that helps many of theworld’s leading corporations and organizations address their strategic challenges,from reorganizing for long-term growth to improving business performance andmaximizing profitability. For more than 80 years, the firm’s primary objective hasbeen to serve as an organization’s most trusted external advisor on critical issuesfacing senior management. With consultants in more than 40 countries aroundthe globe, McKinsey advises clients on strategic, operational, organizational andtechnological issues.
McKinsey’s Retirement Practice serves leading asset managers, insurers, wealthmanagers and recordkeepers globally on issues of strategy, organization, opera-tions and business performance. Our partners and consultants in the Americashave deep expertise in all facets of the business. Our proprietary research spans allretirement markets, including defined benefit, defined contribution, IRA and individ-ual retirement, as well as retirement security. Our proprietary tools provide deep in-sights into the flows, assets and economics of each of the sub-segments of thesemarkets and into the preferences and behaviors of consumers and sponsors.
To learn more about McKinsey & Company’s specialized expertise and capabilitiesrelated to the U.S. retirement industry or for additional information about this re-port, please contact:
The authors would like to acknowledge the contributions of Manu Balakrishnan to this report.
Pooneh Baghai Director(416) 313-3939 pooneh [email protected]
Céline Dufétel Principal (212) 446-8081celine [email protected]
Onur Erzan Principal (212) 446-7172onur [email protected]
David Hunt Director(212) 446-7708 david [email protected]
Salim Ramji Director (212) 446-7393 salim [email protected]
Chad SlawnerPrincipal (212) 446-8075 chad [email protected]
Pete Walker Director(212) 446-8580 peter [email protected]

Financial Services Practice September 2010Designed by Hudspith Design Copyright © McKinsey & Companywww.mckinsey.com/clientservice/financial services