McGraw-Hill /Irwin© 2009 The McGraw-Hill Companies, Inc. INVENTORIES: ADDITIONAL ISSUES Chapter 9.
36
McGraw-Hill /Irwin © 2009 The McGraw-Hill Companies, Inc. INVENTORIES: INVENTORIES: ADDITIONAL ISSUES ADDITIONAL ISSUES Chapter 9
-
Upload
johnathan-collins -
Category
Documents
-
view
214 -
download
0
Transcript of McGraw-Hill /Irwin© 2009 The McGraw-Hill Companies, Inc. INVENTORIES: ADDITIONAL ISSUES Chapter 9.

McGraw-Hill /Irwin © 2009 The McGraw-Hill Companies, Inc.
INVENTORIES:INVENTORIES:ADDITIONAL ISSUESADDITIONAL ISSUES
Chapter 9

Slide 2
9-2
Reporting -- Lower of Cost or MarketReporting -- Lower of Cost or Market
GAAP requires that inventories be carried at cost or current market
value, whichever is lower.
LCM is a departure from historical cost.LCM is a departure from historical cost.LCM is a departure from historical cost.LCM is a departure from historical cost.

Slide 3
9-3
Determining Market ValueDetermining Market Value
Market Should Not Exceed Net Realizable
Value (Ceiling)
Market Should Not Be Less Than Net Realizable Value less Normal Profit
(Floor)
Accounting Accounting Research Bulletin Research Bulletin No. 43 defines No. 43 defines “market value” in “market value” in terms of current terms of current replacement cost.replacement cost.
Replacement cost is Replacement cost is constrained to fall constrained to fall between the “ceiling” between the “ceiling” and the “floor.”and the “floor.”

Slide 4
9-4
Determining Market ValueDetermining Market Value
CeilingCeilingNRVNRV
CeilingCeilingNRVNRV
ReplacementReplacementCostCost
ReplacementReplacementCostCost
NRV – NPNRV – NPFloorFloor
NRV – NPNRV – NPFloorFloor
DesignatedDesignatedMarketMarket
DesignatedDesignatedMarketMarket
CostCostCostCostNot More Than
Not Less Than
Or
Step 1Determine Designated Market
Step 2Compare Designated Market with Cost
Lower of CostLower of CostOr MarketOr Market
Lower of CostLower of CostOr MarketOr Market

Slide 5
9-5
Lower of Cost or MarketLower of Cost or Market
An item in inventory has a historical cost of $20 per unit. At year-end we gather the following per unit information: • current replacement cost = $21.50current replacement cost = $21.50• selling price = $30selling price = $30• cost to complete and dispose = $4 cost to complete and dispose = $4 • normal profit margin of = $5normal profit margin of = $5
How would we value this item in the Balance Sheet?

Slide 6
9-6
Lower of Cost or MarketLower of Cost or Market
ReplacementCost =$21.50
ReplacementCost =$21.50
$21.50

Slide 7
9-7
1. Apply LCM to 1. Apply LCM to each individual itemeach individual item in in inventory. inventory.
1. Apply LCM to 1. Apply LCM to each individual itemeach individual item in in inventory. inventory. 2. Apply LCM to each 2. Apply LCM to each classclass of inventory. of inventory. 2. Apply LCM to each 2. Apply LCM to each classclass of inventory. of inventory. 3. Apply LCM to the 3. Apply LCM to the entireentire inventory as a inventory as a
group. group. 3. Apply LCM to the 3. Apply LCM to the entireentire inventory as a inventory as a
group. group.
Applying Lower of Cost or MarketApplying Lower of Cost or Market
Lower of cost or market can be applied 3 different ways.

Slide 8
9-8
Adjusting Cost to MarketAdjusting Cost to Market
1. Record the Loss as a Separate Item in the Income Statement
Adjust inventory directly or by using an allowance account.
2. Record the Loss as part of Cost of Goods Sold
Adjust inventory directly or by using an allowance account.

Slide 9
9-9
Inventory Estimation TechniquesInventory Estimation Techniques
Estimate instead of taking physical inventory Less costly Less time consuming
Two popular methods are . . .1.1.Gross Profit MethodGross Profit Method
2.2.Retail Inventory MethodRetail Inventory Method

Slide 10
9-10
Gross Profit MethodGross Profit Method
Useful when . . .Useful
when . . .
Estimating inventory & COGS for interim
reports.
Determining the cost of inventory lost,
destroyed, or stolen.
Auditors are testing the overall reasonableness
of client inventories.
Preparing budgets and forecasts.

Slide 11
9-11
Gross Profit MethodGross Profit Method
This method assumes that the historical gross margin ratio is reasonably constant in the short-run.
This method assumes that the historical gross margin ratio is reasonably constant in the short-run.
Beginning Inventory (from accounting records)
Plus: Net purchases (from accounting records)
Goods available for sale (calculated)
Less: Cost of goods sold (estimated)
Ending inventory (estimated)
Estimate the Historical Gross Profit Ratio

Slide 12
9-12
Gross Profit Method Gross Profit Method
Matrix, Inc. uses the gross profit method to estimate Matrix, Inc. uses the gross profit method to estimate end of month inventory. At the end of May, the end of month inventory. At the end of May, the
controller has the following data:controller has the following data:
•Net sales for May = $1,213,000Net sales for May = $1,213,000•Net purchases for May = $728,300Net purchases for May = $728,300
•Inventory at May 1 = $237,400 Inventory at May 1 = $237,400 •Estimated gross profit ratio = 43% of sales Estimated gross profit ratio = 43% of sales
Estimate Inventory at May 31.Estimate Inventory at May 31.

Slide 13
9-13
Gross Profit Method Gross Profit Method
NOTE: The key to successfully applying this method is a reliable Gross Profit Ratio.
NOTE: The key to successfully applying this method is a reliable Gross Profit Ratio.

Slide 14
9-14
The Retail Inventory MethodThe Retail Inventory Method
This method was developed for retail operations like department stores.
Uses both the retail value and cost of items for sale to calculate a cost to retail percentage.
Objective: Convert ending inventory at Objective: Convert ending inventory at retail to ending inventory at cost.retail to ending inventory at cost.
Objective: Convert ending inventory at Objective: Convert ending inventory at retail to ending inventory at cost.retail to ending inventory at cost.

Slide 15
9-15
The Retail Inventory MethodThe Retail Inventory Method
Term Meaning
Initial markup Original amount of markup from cost to selling price.
Additional markup Increase in selling price subsequent to initial markup.
Markup cancellation Elimination of an additional markup.
Markdown Reduction in selling price below the original selling price.
Markdown cancellation Elimination of a markdown.
Retail TerminologyRetail Terminology
Slide 16
9-16
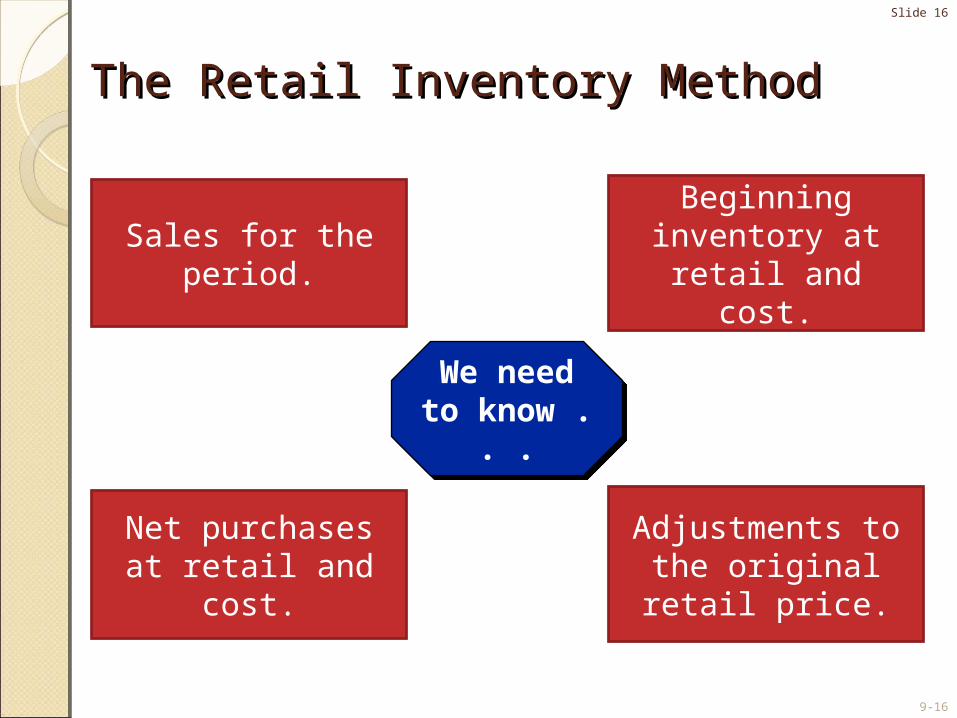
The Retail Inventory MethodThe Retail Inventory Method
We need to know . . .
We need to know . . .
Sales for the period. Beginning inventory at retail and cost.
Adjustments to the original retail price.
Net purchases at retail and cost.

Slide 17
9-17
The Retail Inventory MethodThe Retail Inventory Method
Matrix, Inc. uses the retail method to estimate inventory at Matrix, Inc. uses the retail method to estimate inventory at the end of each month. For the month of May the the end of each month. For the month of May the
controller gathers the following information: controller gathers the following information:
Beg. inventory at cost $27,000Beg. inventory at cost $27,000(at retail $45,000)(at retail $45,000)
Net purchases at cost $180,000Net purchases at cost $180,000(at retail $300,000)(at retail $300,000)
Net sales for May $310,000Net sales for May $310,000
Estimate the inventory at May 31.Estimate the inventory at May 31.

Slide 18
9-18
The Retail Inventory MethodThe Retail Inventory Method

Slide 19
9-19
The Retail Inventory MethodThe Retail Inventory Method
x

Slide 20
9-20
The Retail Inventory MethodThe Retail Inventory Method
Approximating Average CostApproximating Average Cost
Slide 21
9-21
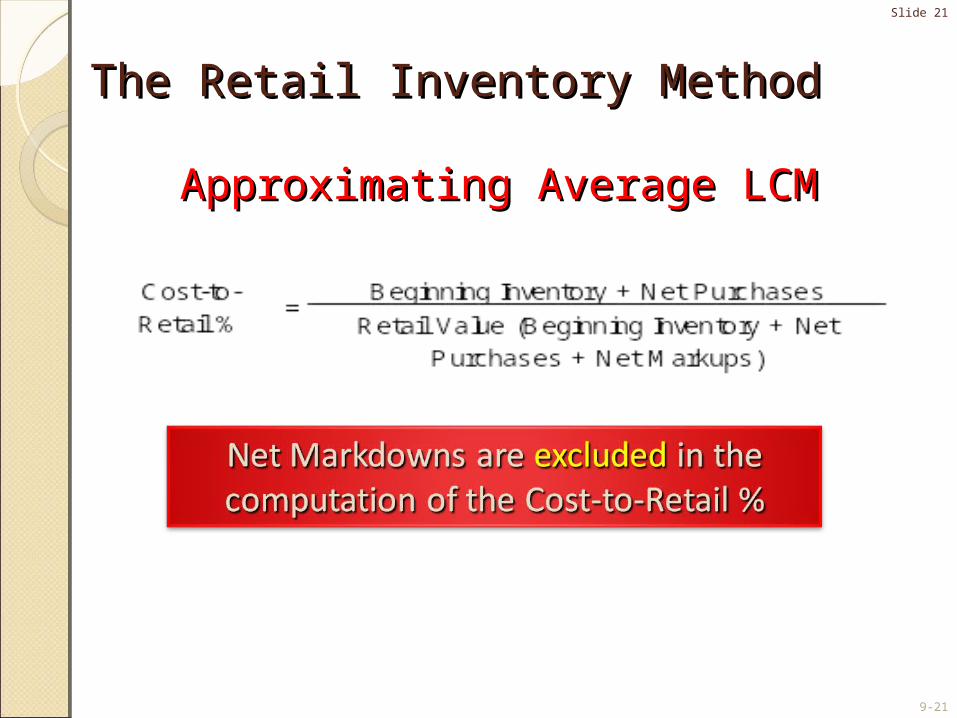
The Retail Inventory MethodThe Retail Inventory Method
Approximating Average LCMApproximating Average LCM

Slide 22
9-22
The Retail Inventory MethodThe Retail Inventory Method
Assume that retail prices of goods remain stable during the period.
Establish a LIFO base layer (beginning inventory) and add (or subtract) the layer from the current period.
Calculate the cost-to-retail percentage for beginning inventory and for adjusted net purchases for the period.
The LIFO Retail MethodThe LIFO Retail Method

Slide 23
9-23
The Retail Inventory MethodThe Retail Inventory Method
The LIFO Retail MethodThe LIFO Retail Method
LIFO Cost- = Net Purchases
to-Retail % Retail Value (Net Purchases + Net Markups - Net Markdowns)

Slide 24
9-24
Other Issues of Retail MethodOther Issues of Retail Method
Element Treatment
Before calculating the cost-to-retail percentage
Freight-in Added to the cost column
Purchase returns Deducted in both the cost and retail columns
Purchase discounts taken Deducted in the cost column
Abnormal shortage, spoilage, or theft Deducted in both the cost and retail columns
After calculating the cost-to-retain percentage
Normal shortage, spoilage, or theft Deducted in the retail column
Employee discounts Added to net sales
Slide 25
9-25
Dollar-Value LIFO RetailDollar-Value LIFO Retail
We need to eliminate the effect of any price changes before we compare the ending inventory with the beginning inventory.

Slide 26
9-26
Dollar-Value LIFO RetailDollar-Value LIFO Retail
Let’s use this data from Matrix Inc. to estimate the ending inventory using dollar-value LIFO retail.
Beginning inventory at cost $21,000Beginning inventory at cost $21,000(at retail $35,000)(at retail $35,000)
Net purchases at cost $200,000Net purchases at cost $200,000(at retail $304,000)(at retail $304,000)
Net markups $8,000Net markups $8,000
Net markdowns $4,000Net markdowns $4,000
Net sales for June $300,000Net sales for June $300,000
Price index at June 1 is 100 and at June 30
the index is 102.

Slide 27
9-27
Dollar-Value LIFO RetailDollar-Value LIFO Retail

Slide 28
9-28
Changes in Inventory MethodChanges in Inventory Method
Recall that most voluntary changes in accounting principles are reported
retrospectivelyretrospectively. This means reporting all previous periods’ financial statements as though the new method had been used in
all prior periods.
Changes in inventory methods, other than a Changes in inventory methods, other than a change to LIFO, are treated change to LIFO, are treated retrospectivelyretrospectively..Changes in inventory methods, other than a Changes in inventory methods, other than a change to LIFO, are treated change to LIFO, are treated retrospectivelyretrospectively..

Slide 29
9-29
Change To The LIFO MethodChange To The LIFO Method
When a company elects to change toto LIFO, it is usually impossibleimpossible to calculate the income effect on prior years. As a result, the company does not
report the change retrospectively. Instead, the LIFO method is used from the point of adoption forward.
A disclosure note is needed to explain (a) theA disclosure note is needed to explain (a) thenature of the change; (b) the effect of thenature of the change; (b) the effect of the
change on current year’s income andchange on current year’s income andearnings per share, and (c) why retrospective earnings per share, and (c) why retrospective
application was impracticable.application was impracticable.

Slide 30
9-30
Inventory ErrorsInventory Errors
Overstatement of ending inventory◦Understates cost of goods sold andUnderstates cost of goods sold and◦Overstates pretax income.Overstates pretax income.
Understatement of ending inventory◦Overstates cost of goods sold andOverstates cost of goods sold and◦Understates pretax income.Understates pretax income.

Slide 31
9-31
Inventory ErrorsInventory Errors
Overstatement of beginning inventory◦Overstates cost of goods sold andOverstates cost of goods sold and◦Understates pretax income.Understates pretax income.
Understatement of beginning inventory◦Understates cost of goods sold andUnderstates cost of goods sold and◦Overstates pretax income.Overstates pretax income.

Slide 32
9-32
Inventory ErrorsInventory Errors
Overstatement of purchases◦Overstates cost of goods sold andOverstates cost of goods sold and◦Understates pretax income.Understates pretax income.
Understatement of purchases◦Understates cost of goods sold andUnderstates cost of goods sold and◦Overstates pretax income.Overstates pretax income.

9-33
Appendix 9
PurchaseCommitments

Slide 34
9-34
Purchase CommitmentsPurchase Commitments
Purchase commitments are contracts that obligate a company to purchase a specified amount of
merchandise or raw materials at specified prices on or before specified dates.
In July 2009, Matrix, Inc. signed two purchase commitments. The first requires Matrix to purchase raw materials for $100,000 byDecember 1, 2009. On December 1, 2009, the raw materialshad a market value of $90,000. The second requires Matrixto purchase inventory items for $200,000 by March 1, 2010.
On December 31, 2009, the market value of the inventory itemswas $188,000. On March 1, 2010, the market value of the inventory
items was $186,000. Matrix uses the perpetual inventory systemand is a calendar year-end company.
Let’s make the journal entries for these commitments.

Slide 35
9-35
Purchase CommitmentsPurchase CommitmentsDate Description Debit Credit
7/1/09 Raw materials inventory 100,000 Accounts payable 100,000
12/1/09 Accounts payable 100,000 Cash 100,000
12/1/09 Loss on purchase commitment 10,000 Raw materials inventory 10,000
12/31/09 Estimated loss on commitment 12,000 Estimated liability on commitment 12,000
3/1/10 Inventory 186,000 Estimated liability on commitment 12,000 Loss on purchase commitment 2,000 Cash 200,000
Single year commitment
Multi-year Commitment

McGraw-Hill /Irwin © 2009 The McGraw-Hill Companies, Inc.
End of Chapter 9End of Chapter 9